Operator
Ladies and gentlemen, thank you for standing by and welcome to Pathward Financial's second quarter fiscal year 2026 investor conference call. During the presentation, all participants will be in a listen-only mode. Following the prepared remarks, we will conduct a question and answer session. As a reminder, this conference call is being recorded.
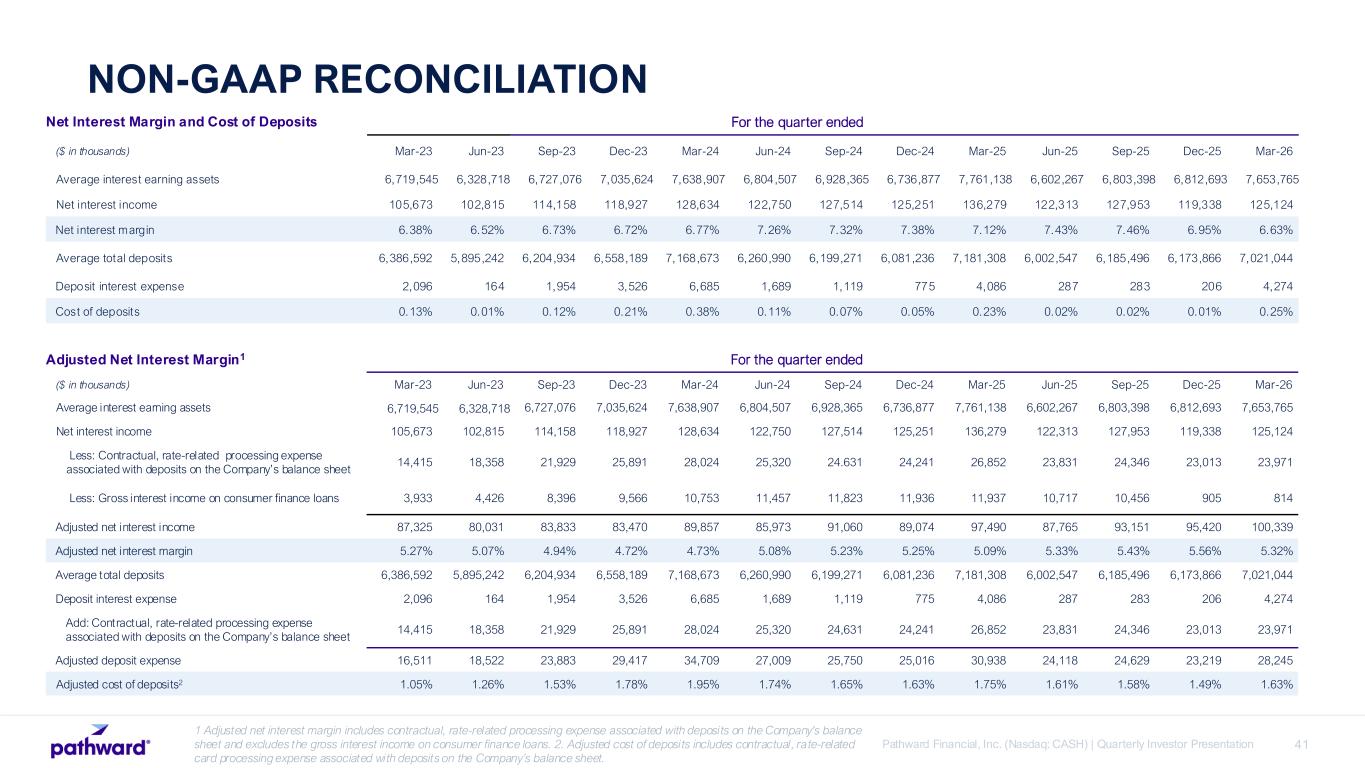
I would now like to turn the conference call over to Darby Schoenfeld, Senior Vice President, Chief of Staff and investor relations please go ahead thank you operator and welcome with me today our password financials ceo brett pharr and cfo greg sigrist who will discuss our operating and financial results for the second quarter of fiscal year 2026 after which we will take your questions additional information including the earnings release the investor presentation that accompanies our prepared remarks and supplemental slides may be found on our website at passwordfinancial.com As a reminder, our comments may include forward-looking statements. Those statements are subject to risks and uncertainties that could cause actual and anticipated results to differ. The company undertakes no obligation to update any forward-looking statements. Please refer to the cautionary language in the earnings release, investor presentation, and in the company's filings with the Securities and Exchange Commission, including our most recent filings, for additional information covering factors that could cause actual and anticipated results to differ materially from the forward-looking statement. Additionally today we will be discussing certain non-GAAP financial measures on this conference call. References to non-GAAP measures are only provided to assist you in understanding the company's results and performance trends, particularly in competitive analysis. In order to make our adjusted net interest margin as comparable as possible, we have excluded the impact of the growth accounting methodology on our consumer loans and included contractual rate related processing expenses associated with deposits on the company's balance sheet. The historical numbers in the earnings presentation has also been updated to reflect this. Reconciliation for such non-GAAP measures are included in the earnings release and the appendix of the investor presentation. Finally, all time periods referenced are fiscal quarters and fiscal years, and all comparisons are to the prior year period unless otherwise noted. Now let me turn the call over to Brett Farr, our CEO.
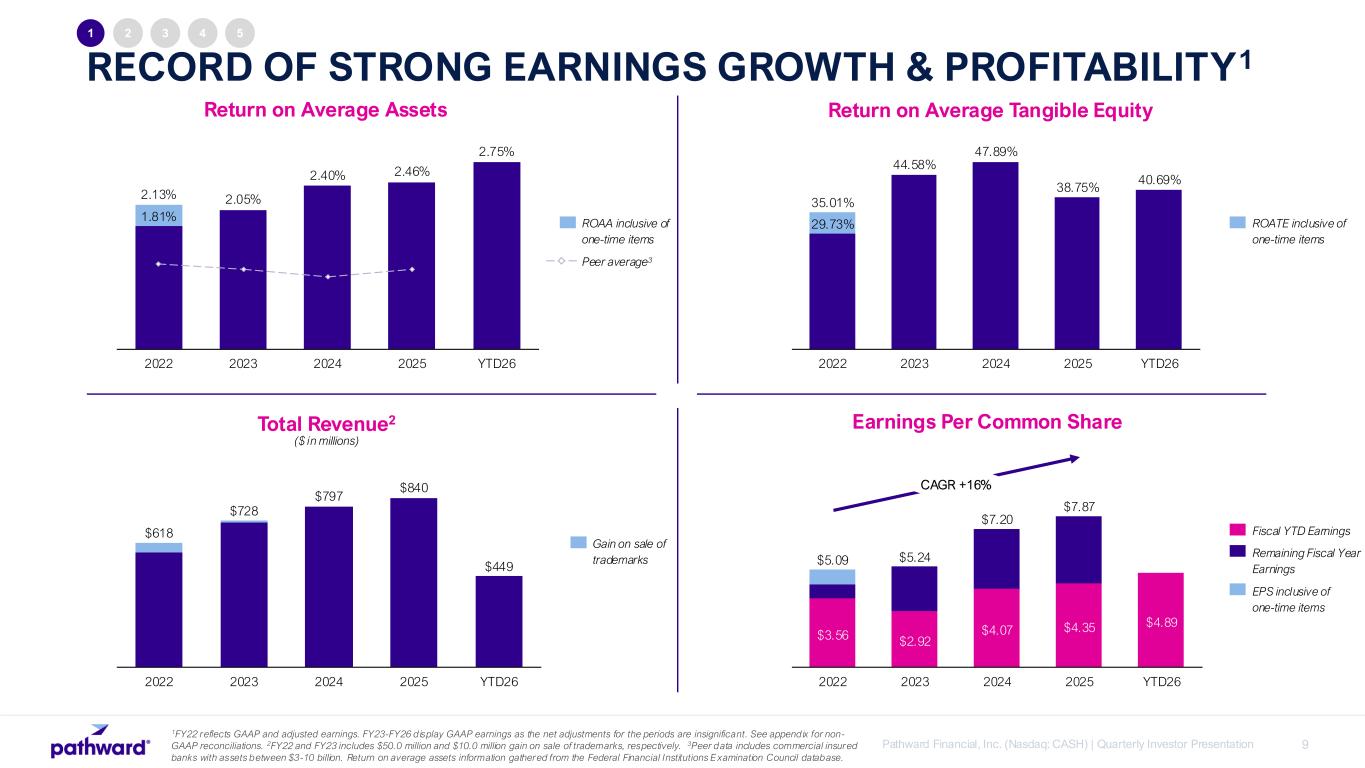
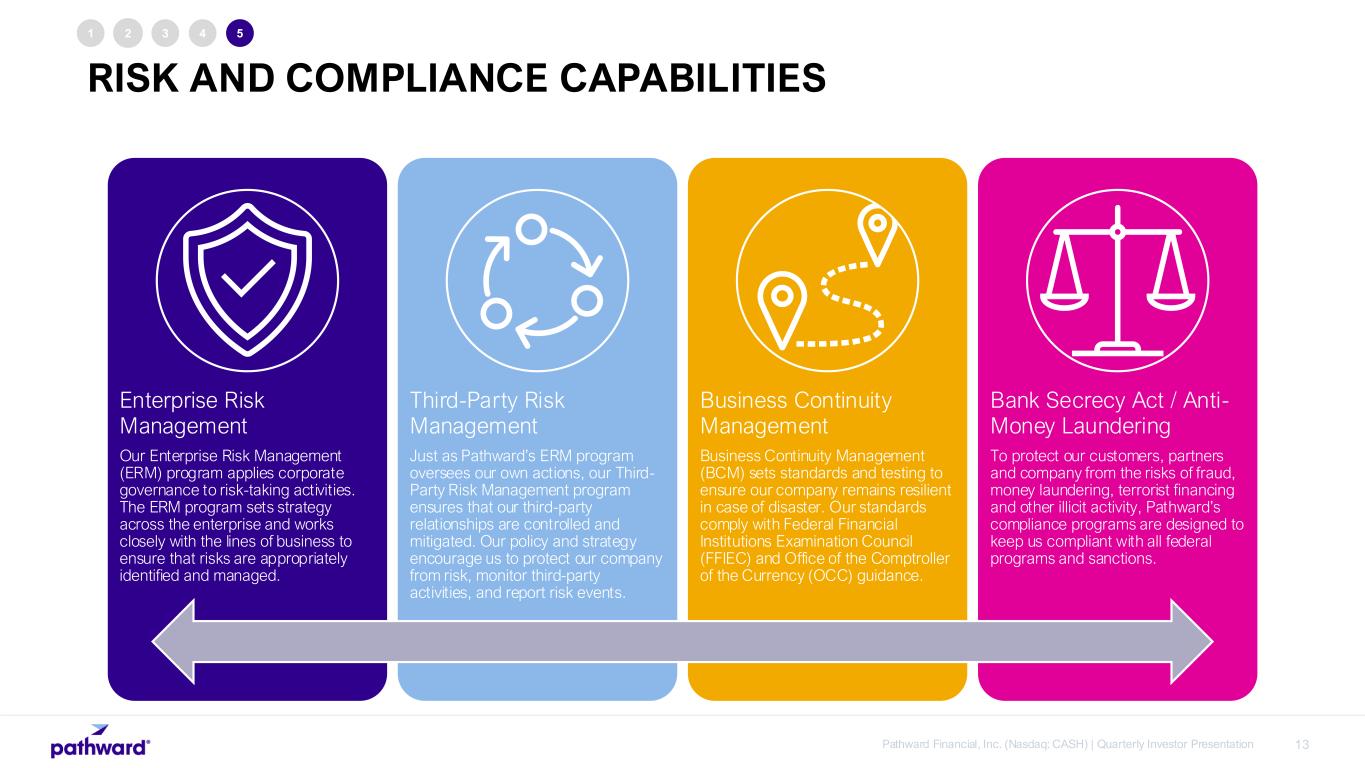
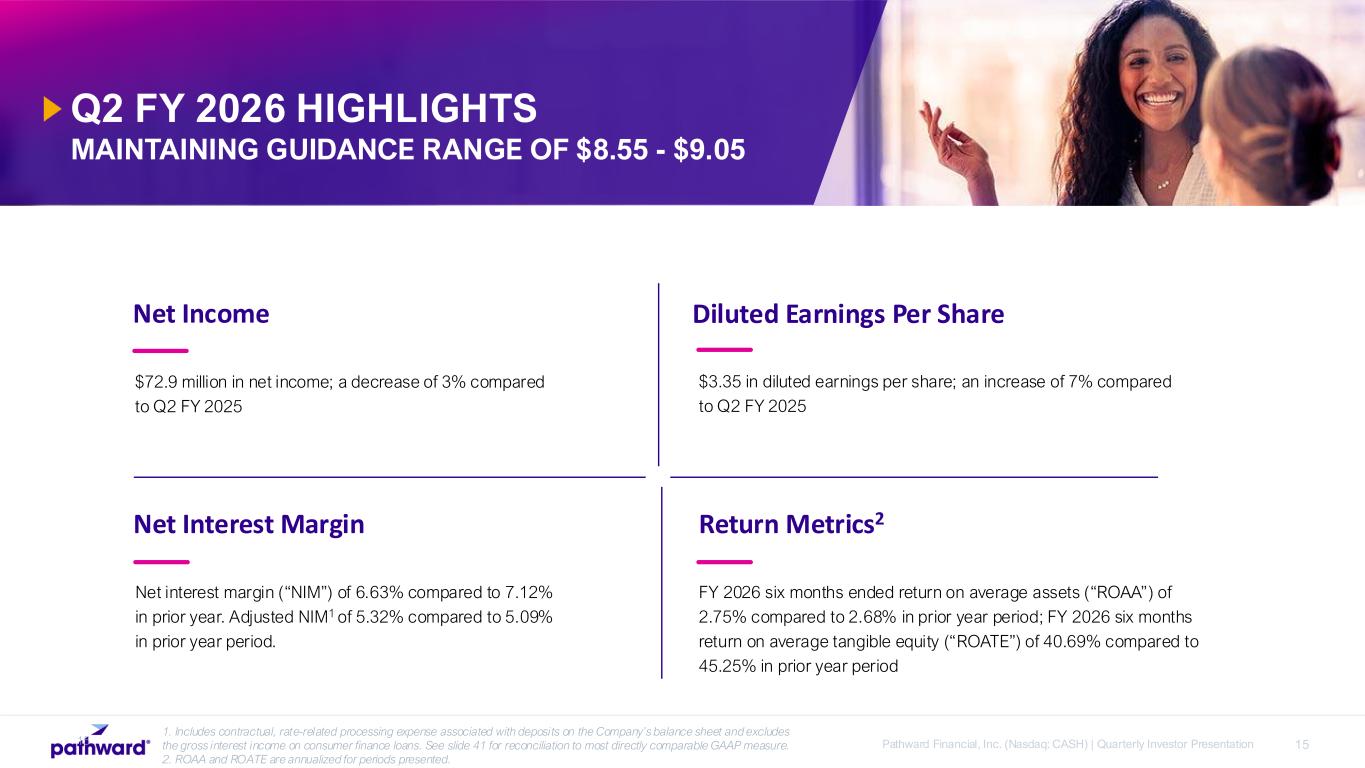
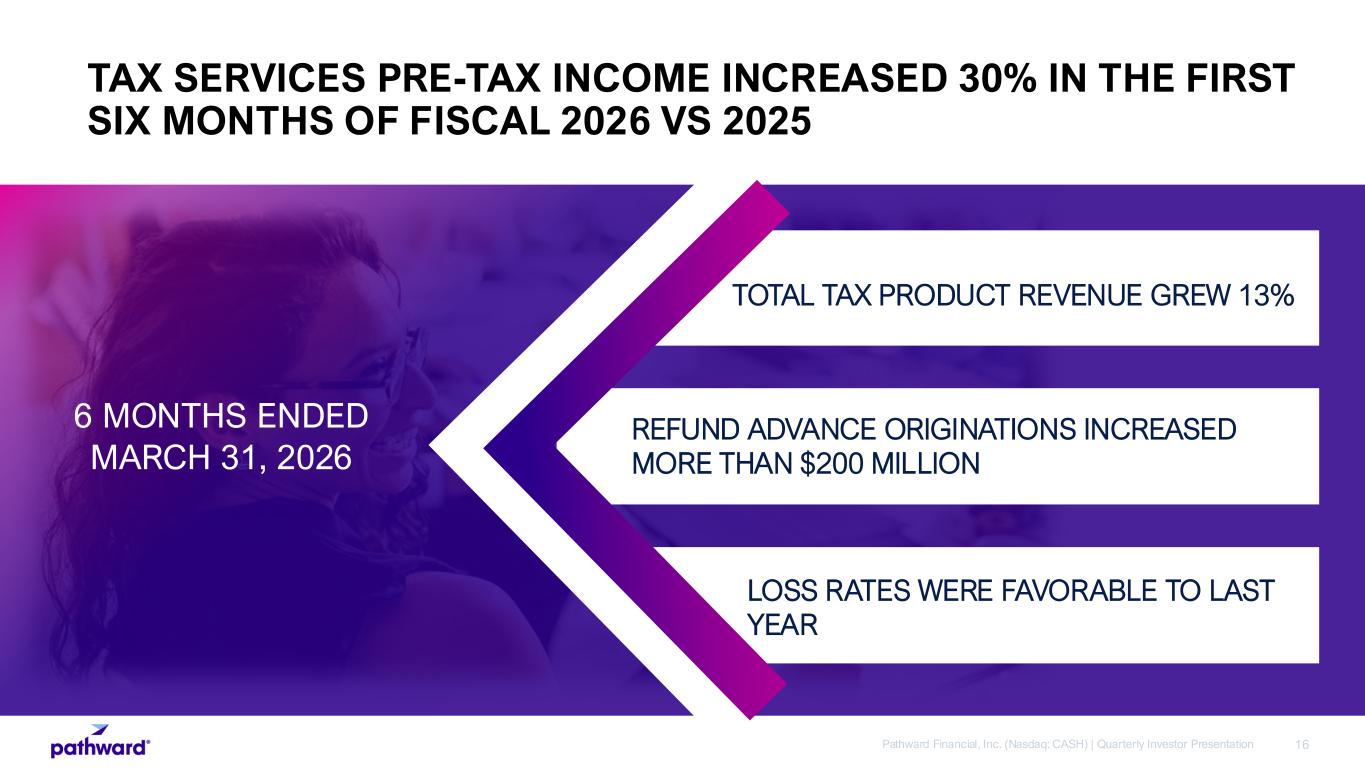
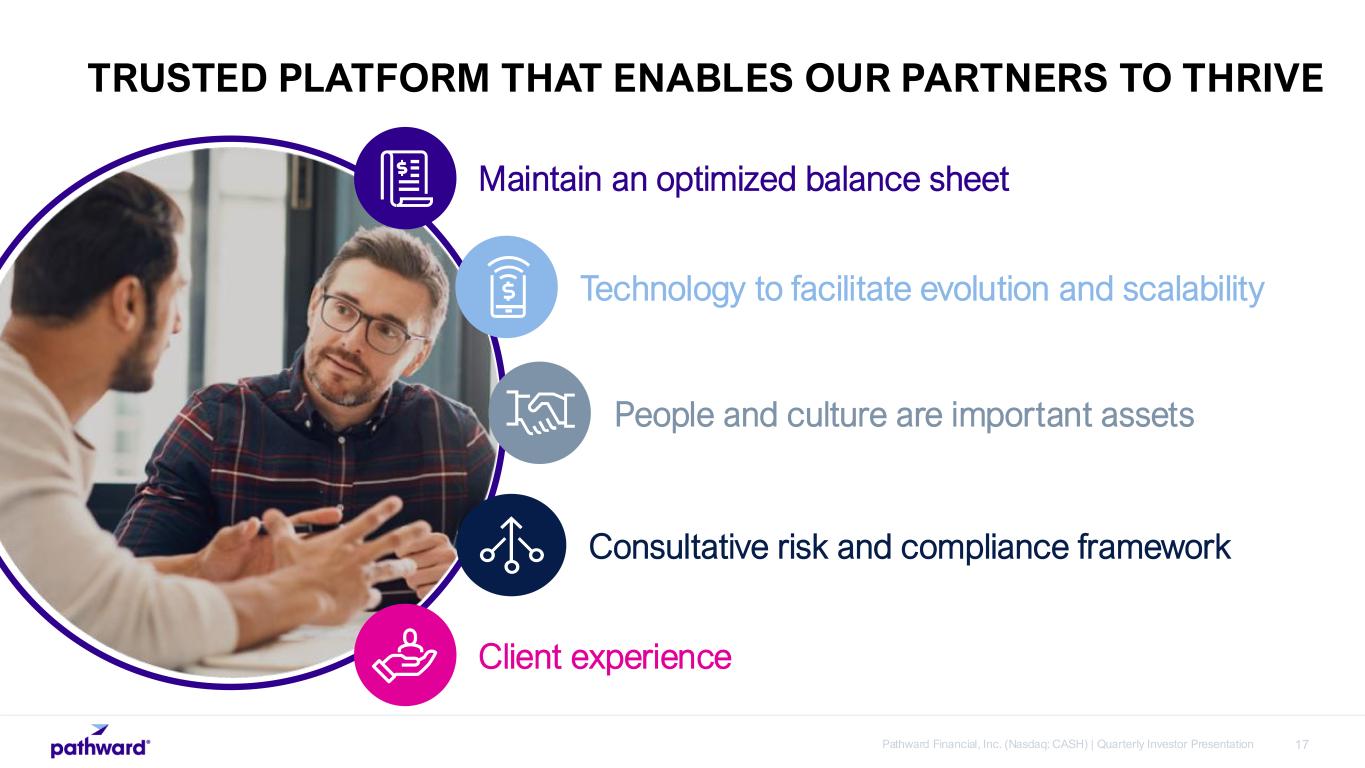
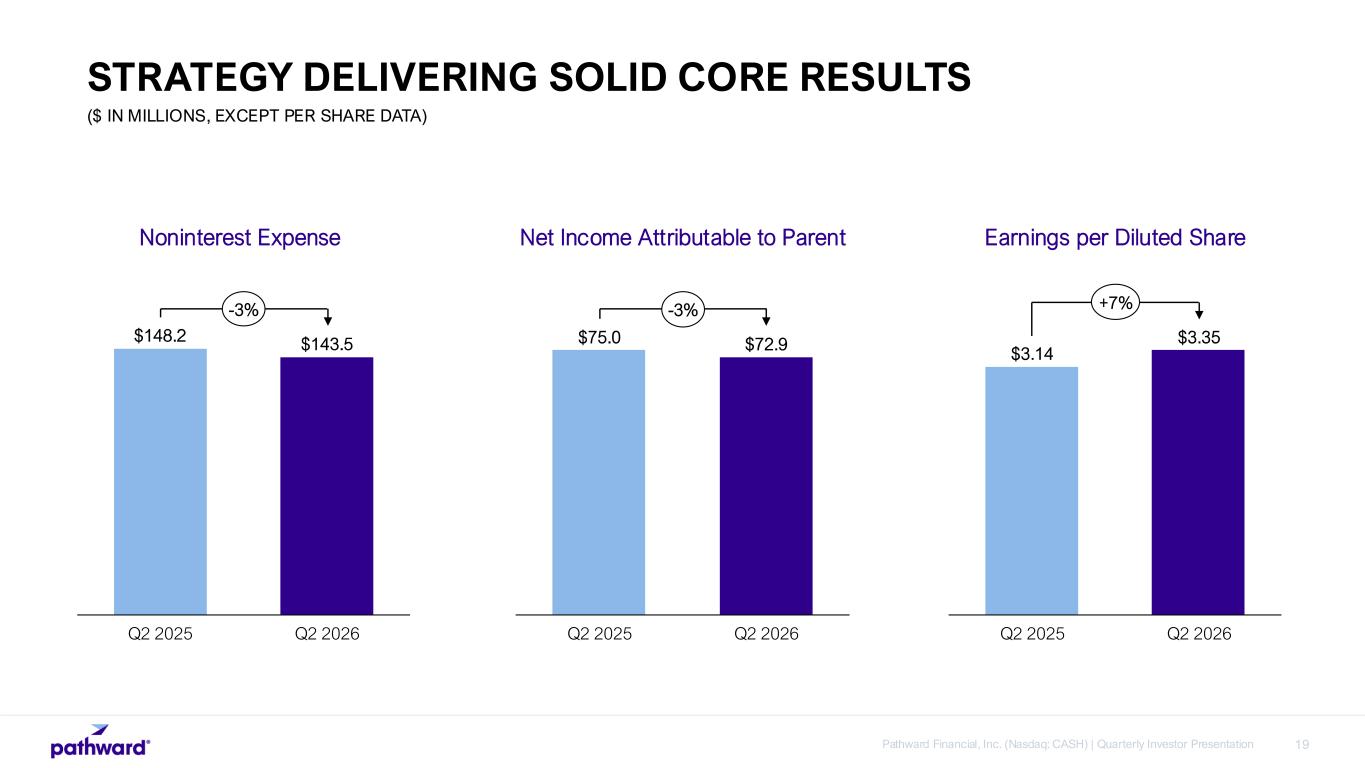
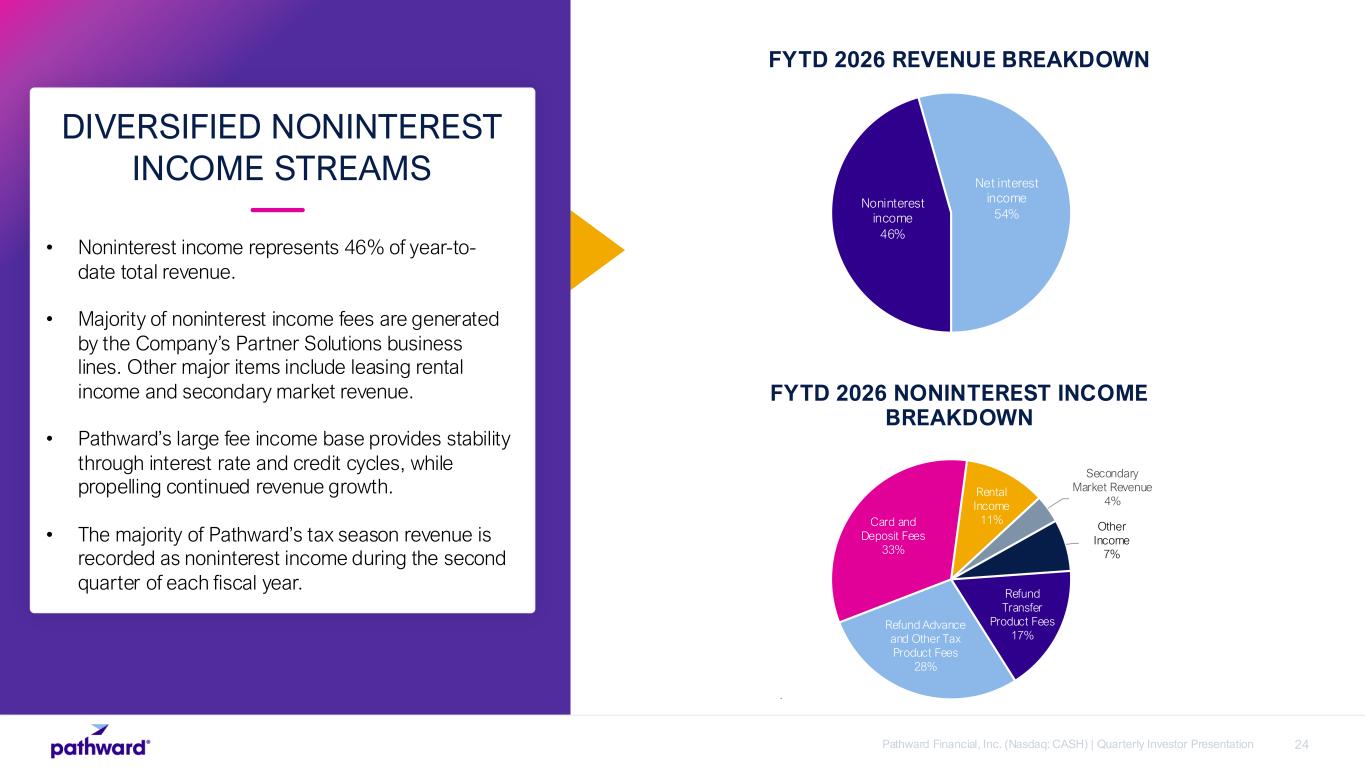
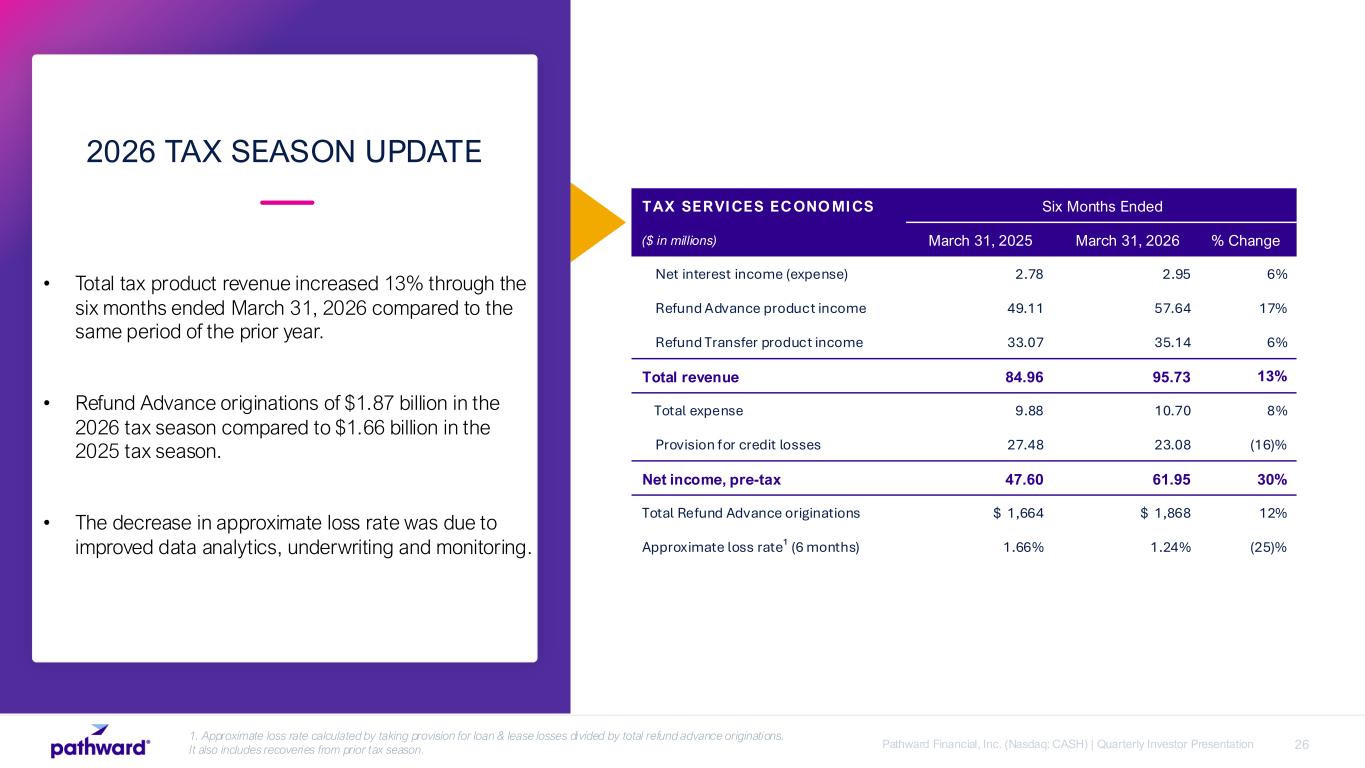
Thanks, Darby, and welcome, everyone, to our earnings conference call. At the midpoint of our fiscal year, we continue to make good progress on our goals and execute on our long-term strategy, being the trusted platform that enables our partners to thrive. Our tax season is going very well, with tax-related products leading the way in revenue growth for the quarter. Additionally, new and existing partnerships announced last year are developing nicely, and the partner solutions pipeline remains robust. Net interest income from our commercial finance loans also increased significantly as well. All in all, our core businesses remain healthy and we are pleased with the results achieved in the quarter. Continuing with some highlights, we reported net income of $72.9 million and earnings per diluted share of $3.35. Non-interest income in the quarter grew 9% and represented 55% of our total revenue. This was primarily accomplished through numerous successes within tax services and further supported by growth in our core card and deposit fees. Return metrics were also strong for the first six months of the year with return on average assets of 2.75 percent and return on average tangible equity of 40.69 percent. Just a reminder that these metrics generally hit their high point during this quarter due to the seasonality of the tax business. Finally, we are maintaining our guidance range of $8.55 to $9.05 earnings per diluted share. our investments within tax services are paying off and we are very proud of all that the team was able to accomplish not only this quarter but also in the planning and preparation that was undertaken to achieve the results that you see today this year we operated with over 48 000 independent tax offices which is another record for us and nearly double the number of offices from just five years ago. We are thankful to have cultivated such strong relationships with our existing tax partners and independent tax offices, as well as new ones that have come on board. It is incredibly important to us, especially given the competitive nature of the space, that they trust our people and the level of service they receive. We hope to inspire financial confidence and empower more people to navigate the tax system with clarity. Tax season can be the most significant financial event of the year for many families, and through our products, we aim to help individuals make informed decisions about their finances. This focus on empowering taxpayers and delivering transparent solutions drove increased engagement and improved financial performance within tax services. For the six months ending March 31, 2026, we increased total tax product revenue by 13%, led by a 13% increase in non-interest income related to refund transfer products and refund advance products. Additionally, refund advance originations increased by over $200 million this year. This brought total tax services revenue to $96 million. Loss rates on refund advances were also favorable when compared to last year due to our continued work on our underwriting models and data analytics capabilities. This led us to pre-tax income of $62 million for tax services, an increase of 30%. We believe these outcomes reflect our commitment to empowering people and partners through innovative solutions, unlocking potential and fueling success for those we serve. We remain diligently focused on delivering on our strategy of being the trusted platform that enables our partners to thrive. As a reminder, this consists of five key focus areas in our fiscal 2026. First, we continue to favor asset rotation in areas where we believe we have a competitive advantage to deliver higher return on assets. With an asset limit of $10 billion to remain below the Durbin Amendment exemption, we remain focused on creating balance sheet optionality. This should deliver increasing net interest income without growing the overall asset size and generate sustainable fee income in the form of secondary market revenue. Second, we invest regularly in technology and our run rate to help ensure that our platform undergoes the evolution and scalability needed to support our partners growth as they expand their reach with new products and markets. Third, we believe that people and culture are Pathward's most important assets, which is why I'm very proud to share with you that we once again earned the Great Place to Work certification in 2026 for the fourth year in a row. Our culture is just as important as the outcome of our efforts. At Pathard, we are guided by our core values. Lead by example, find a better way, help others succeed, and dare to be great. These core elements along with our talent anywhere approach is what we believe sets us apart. Fourth, the consultative governance approach we take when it comes to our risk and compliance framework helps our partners manage an area that is often complex and difficult to navigate. We also continue to invest in this area to not only evolve with the regulatory environment, but also allow for scalability with our partners. Finally, our focus on the client experience is about supporting our partners for greater successes and revenue enablement. Our pipeline remains full, and we are diligently working to bring more partners into the Pathward family and help those that we are already working with to do more. We are also happy to announce that in April after the quarter close, Pathward executed a three-year extension with TavaPay, a leading money movement platform. Now I'd like to turn it over to Greg, who will take you through the financials.
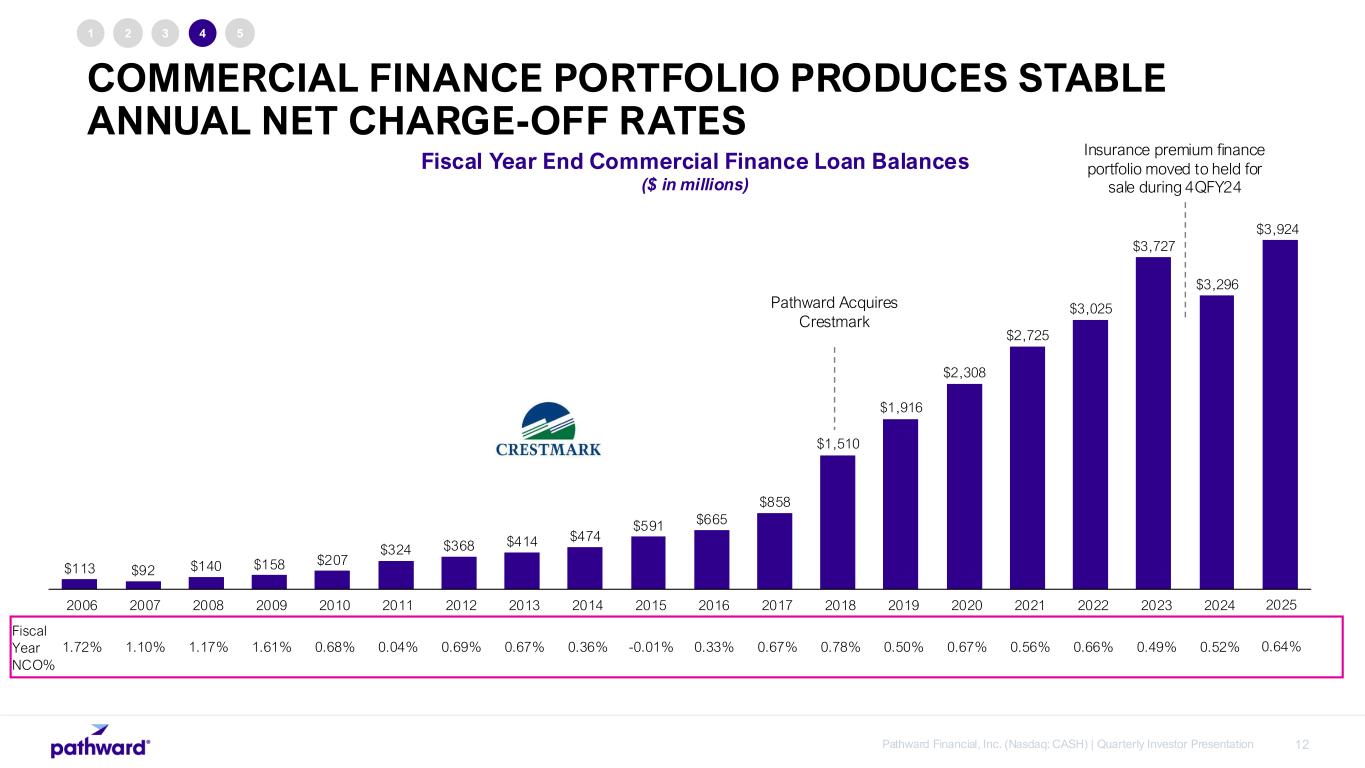
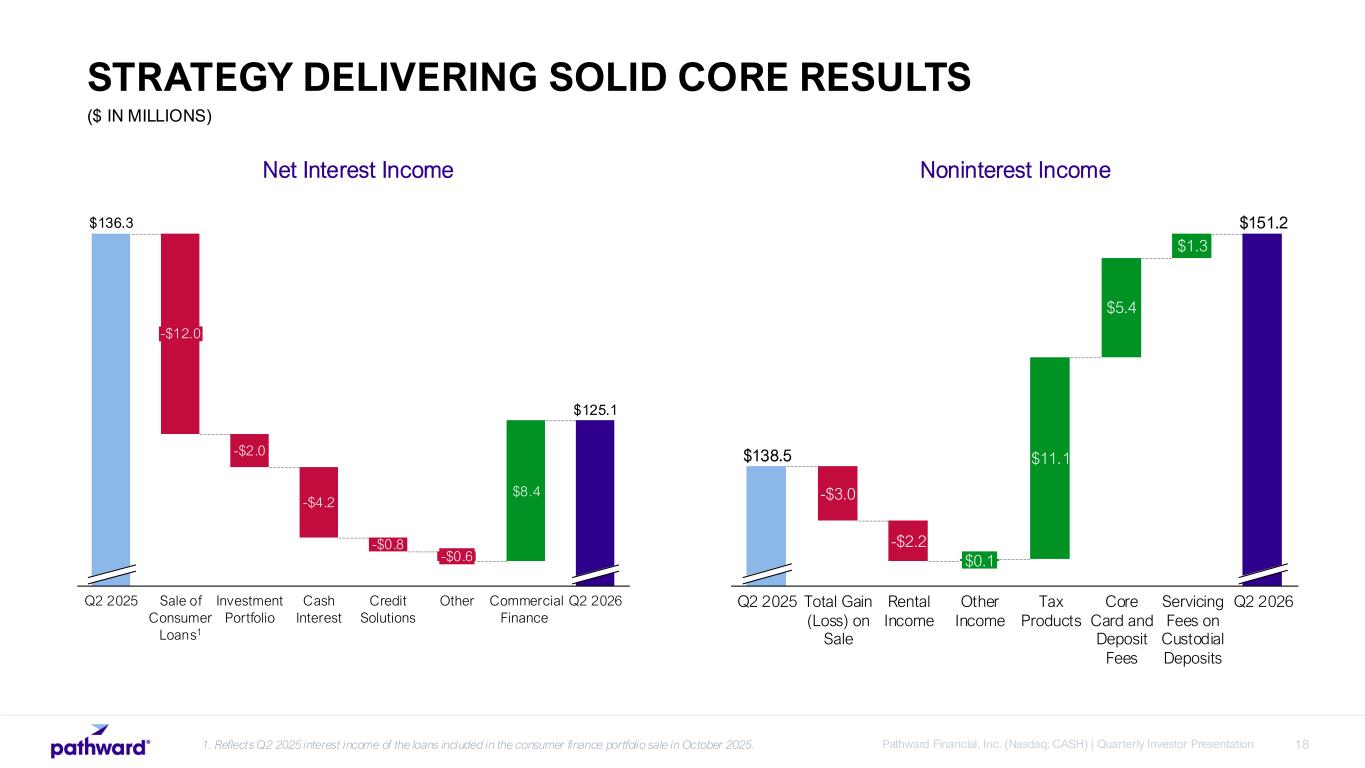
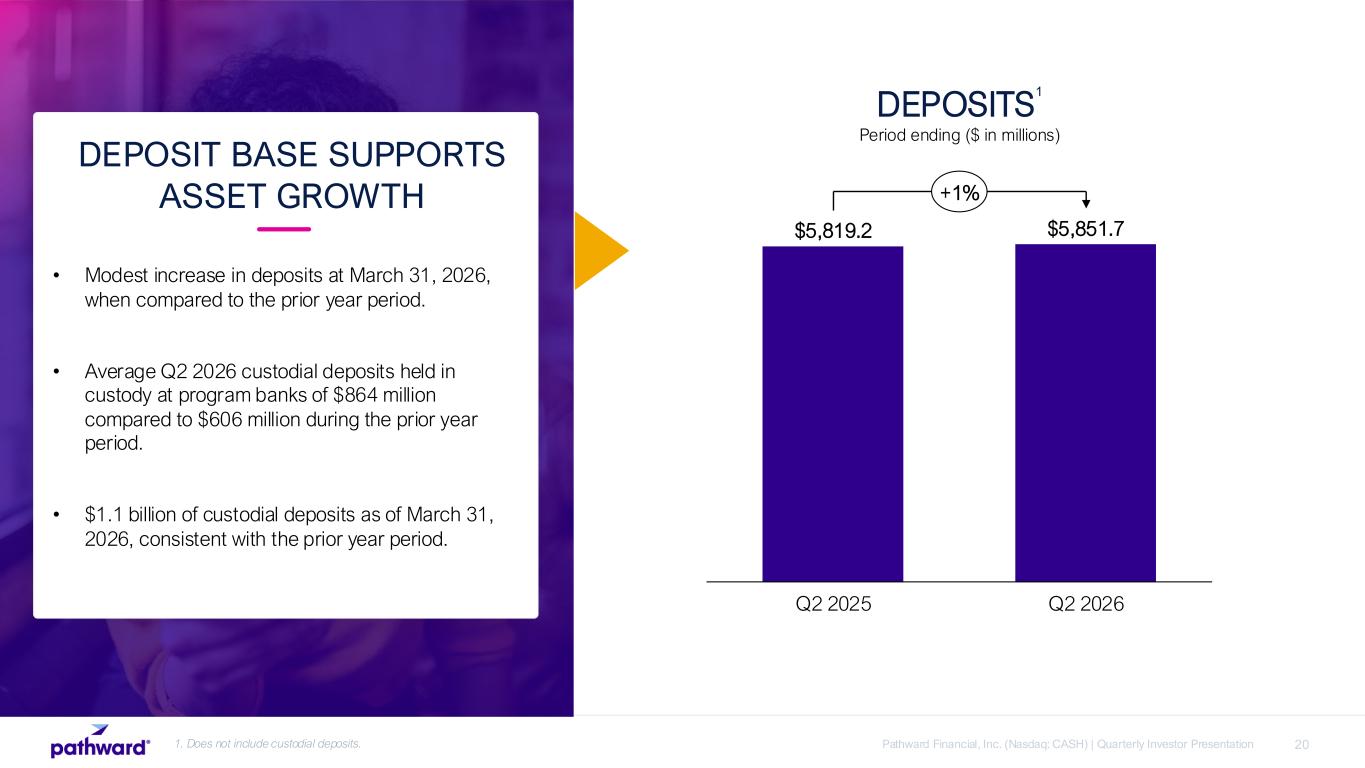
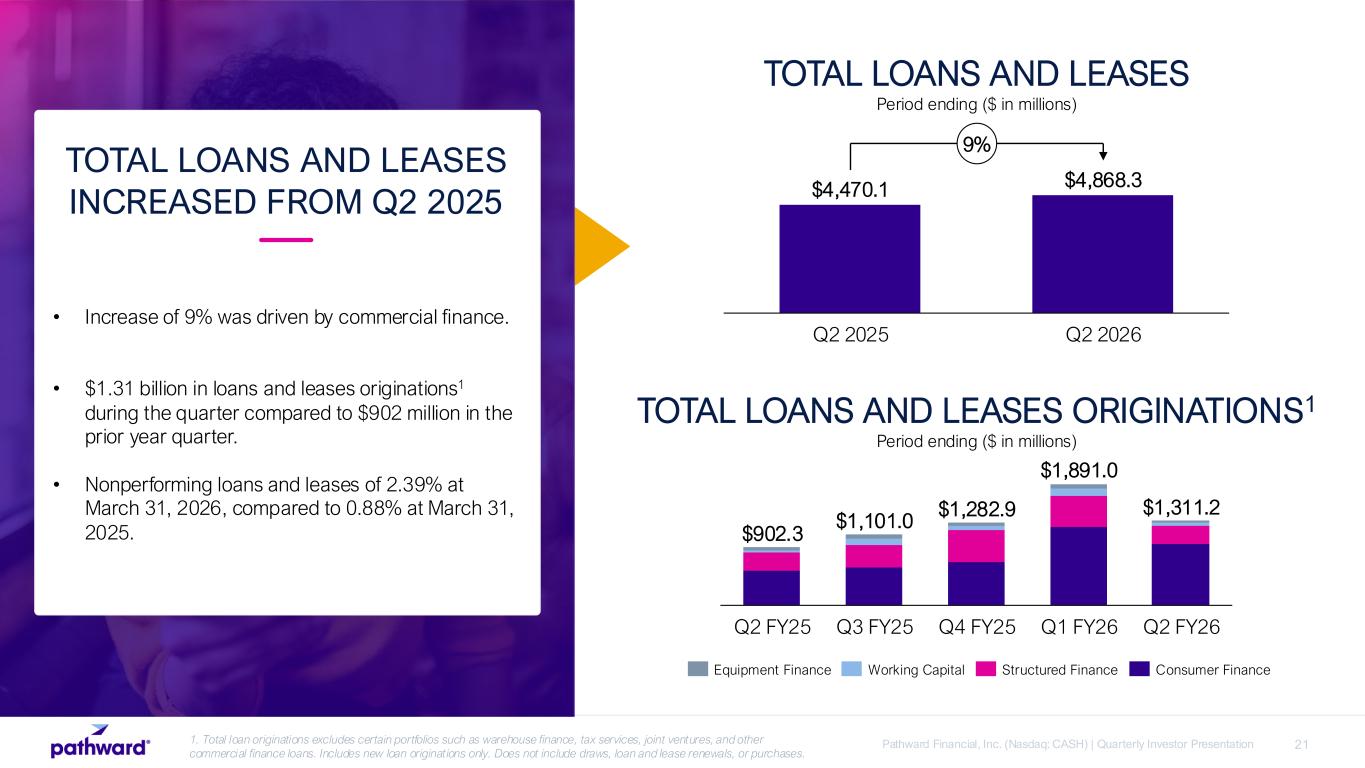
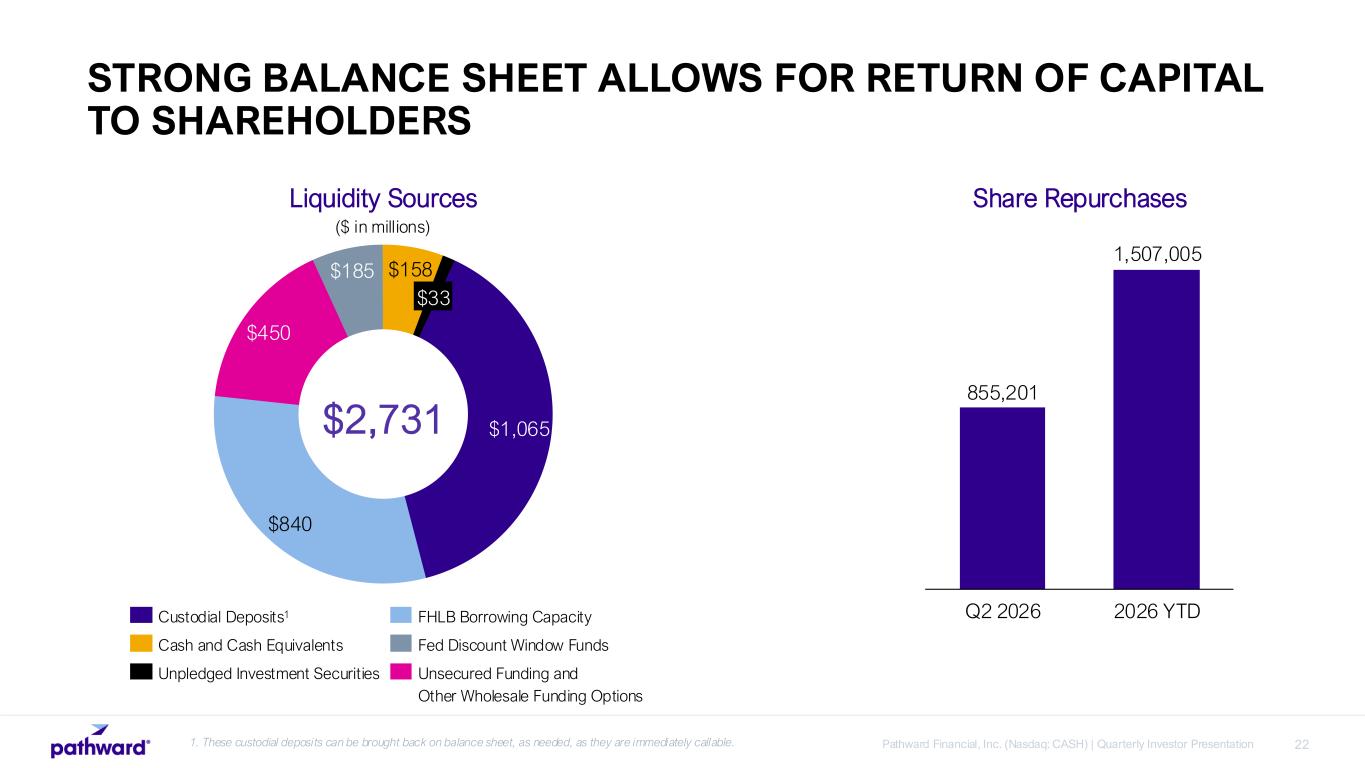
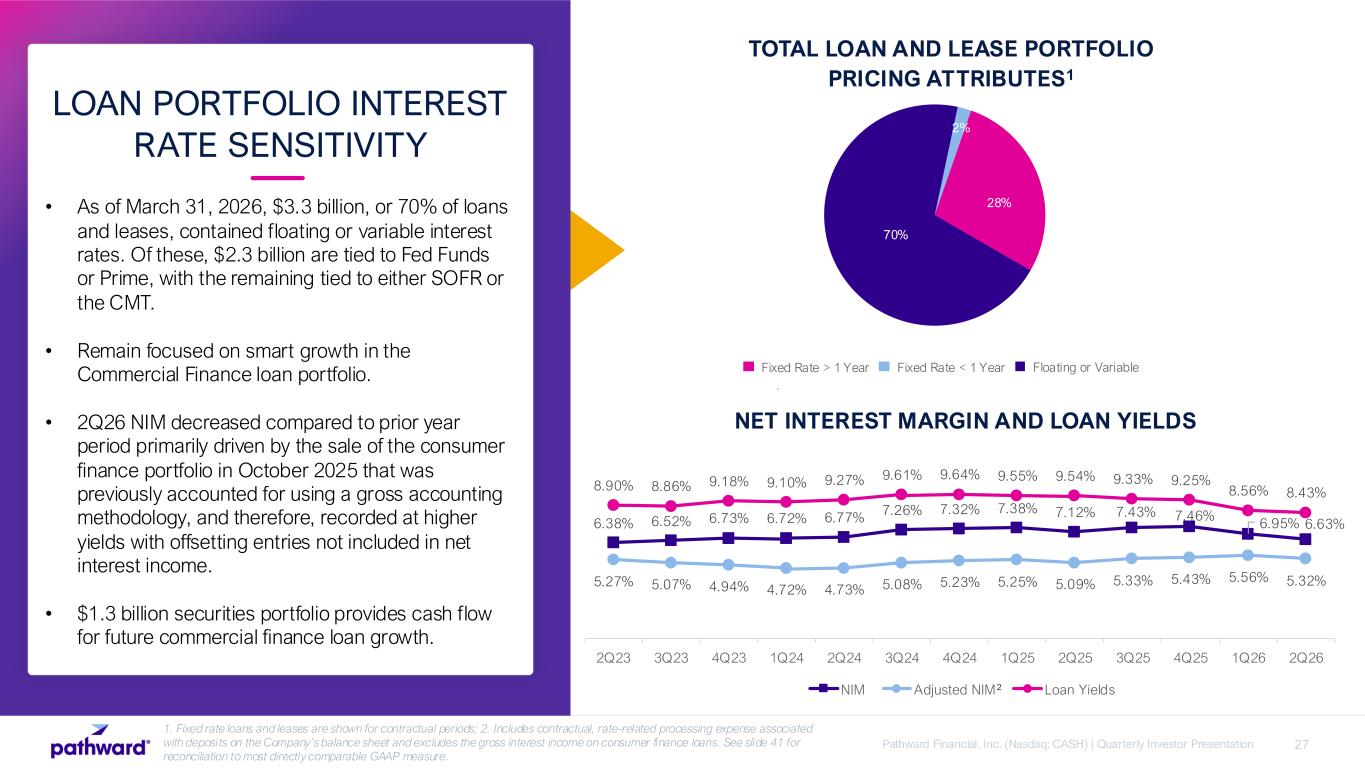
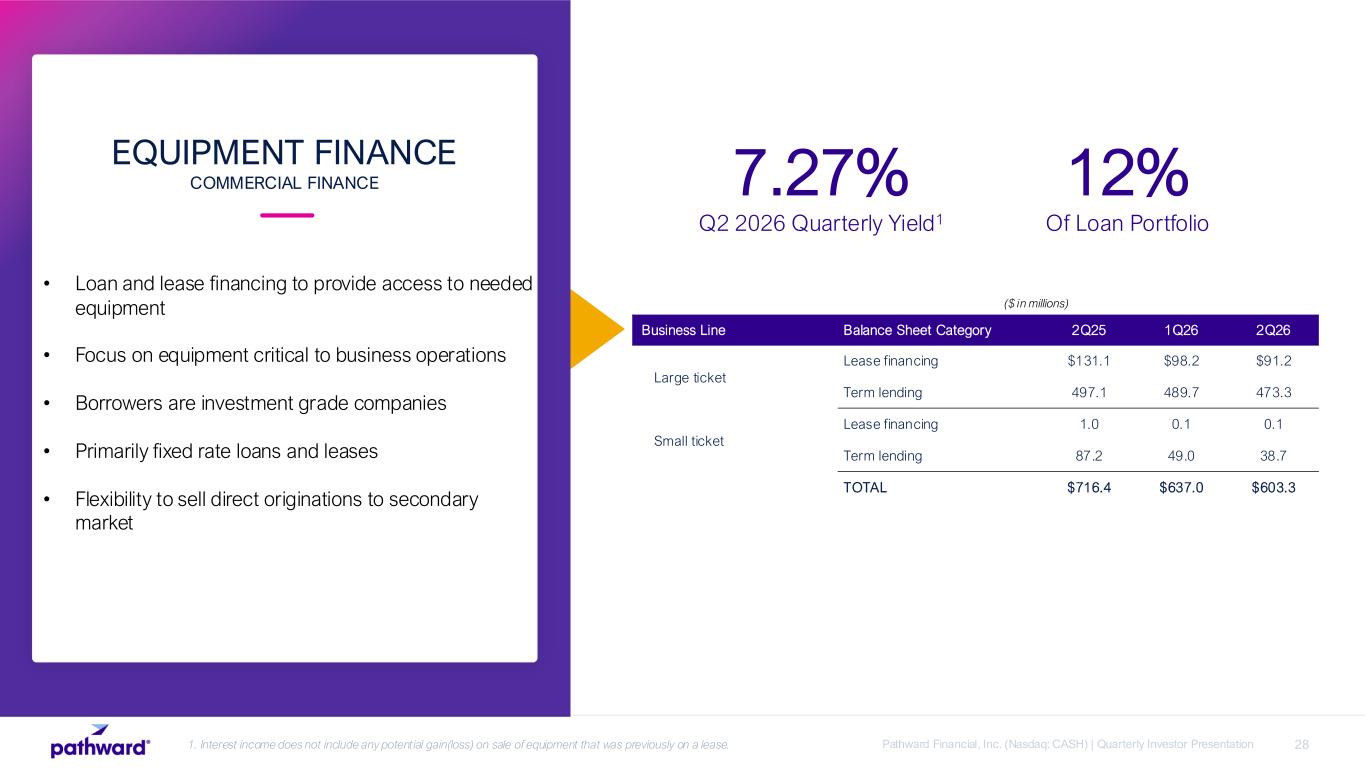
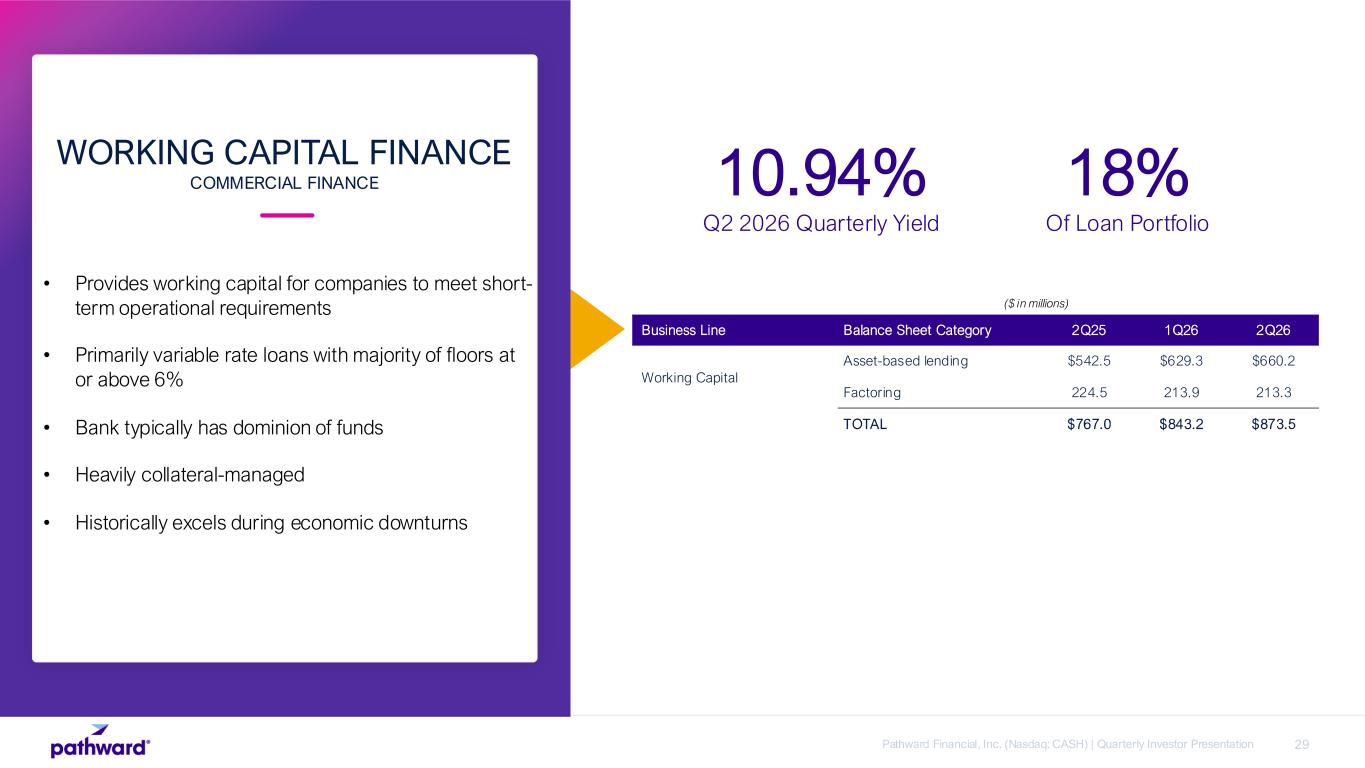
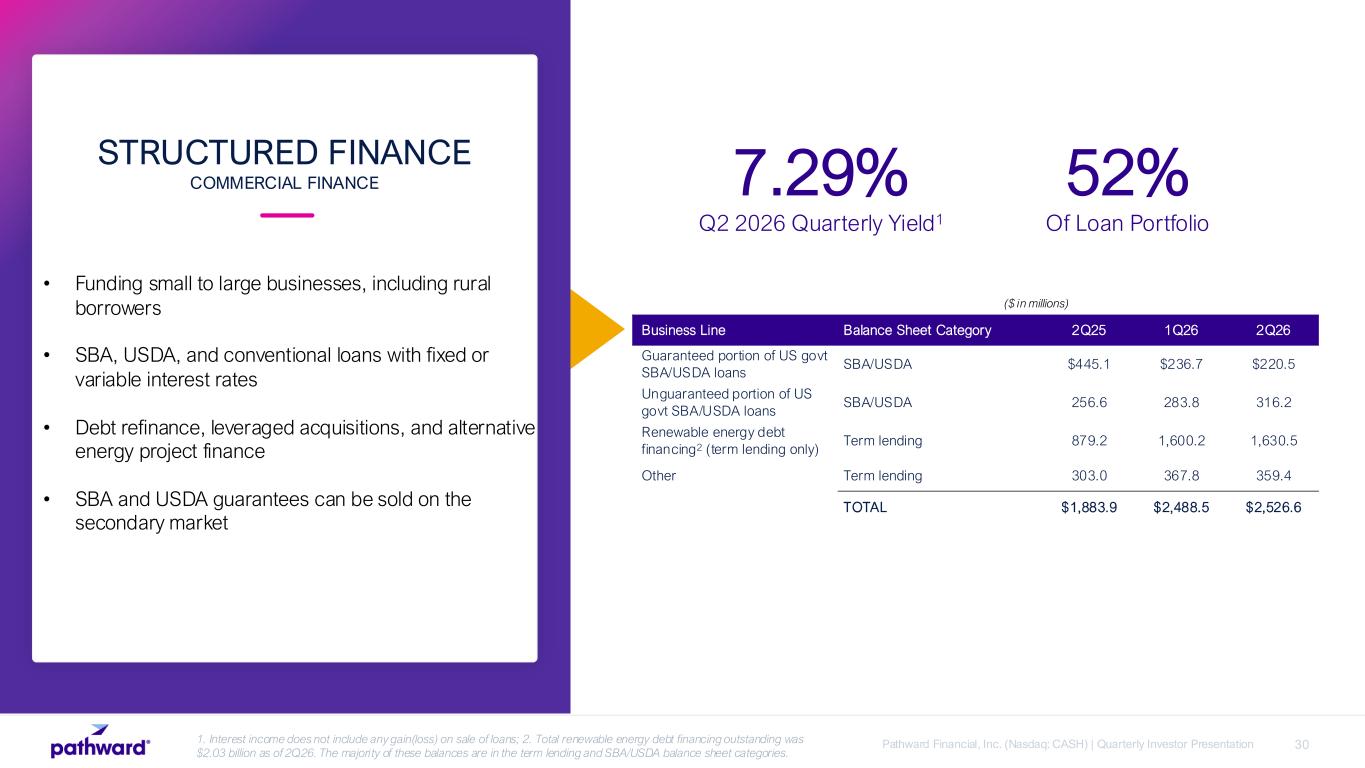
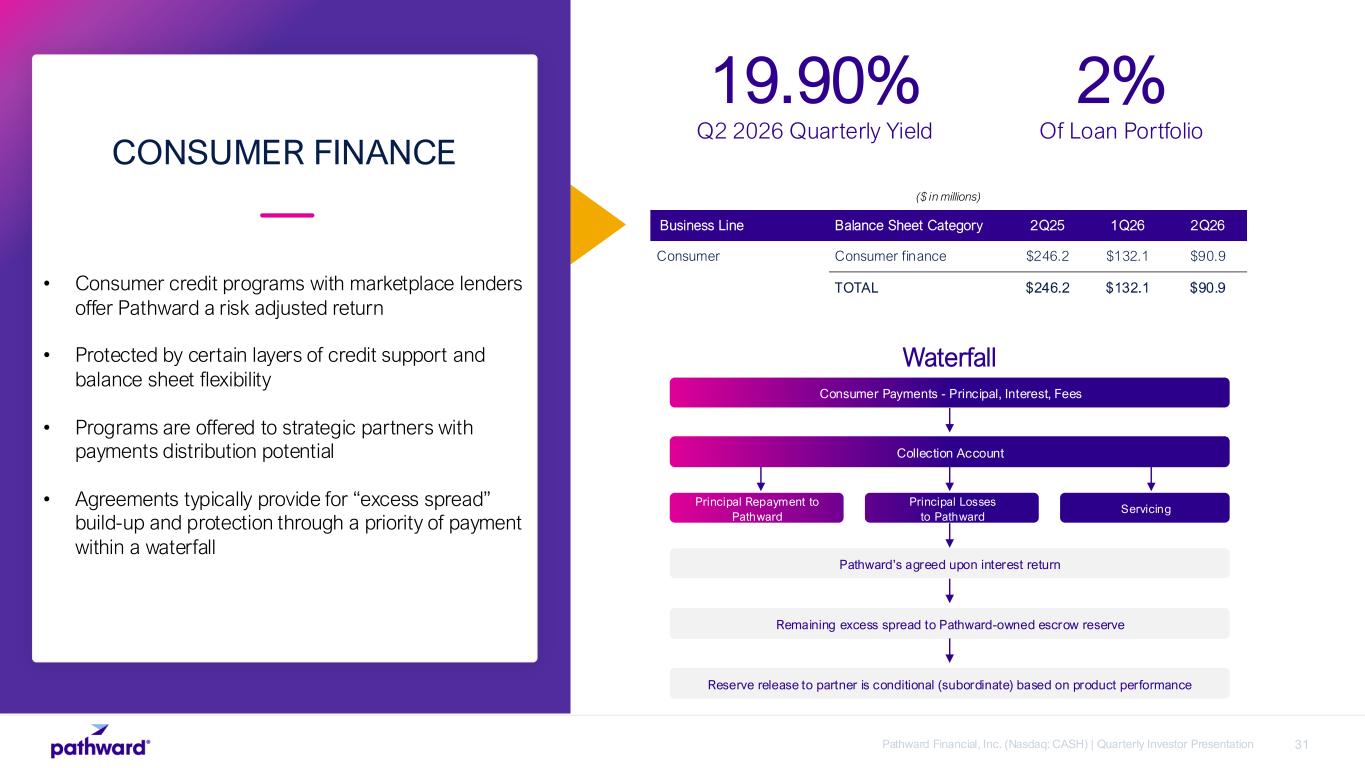
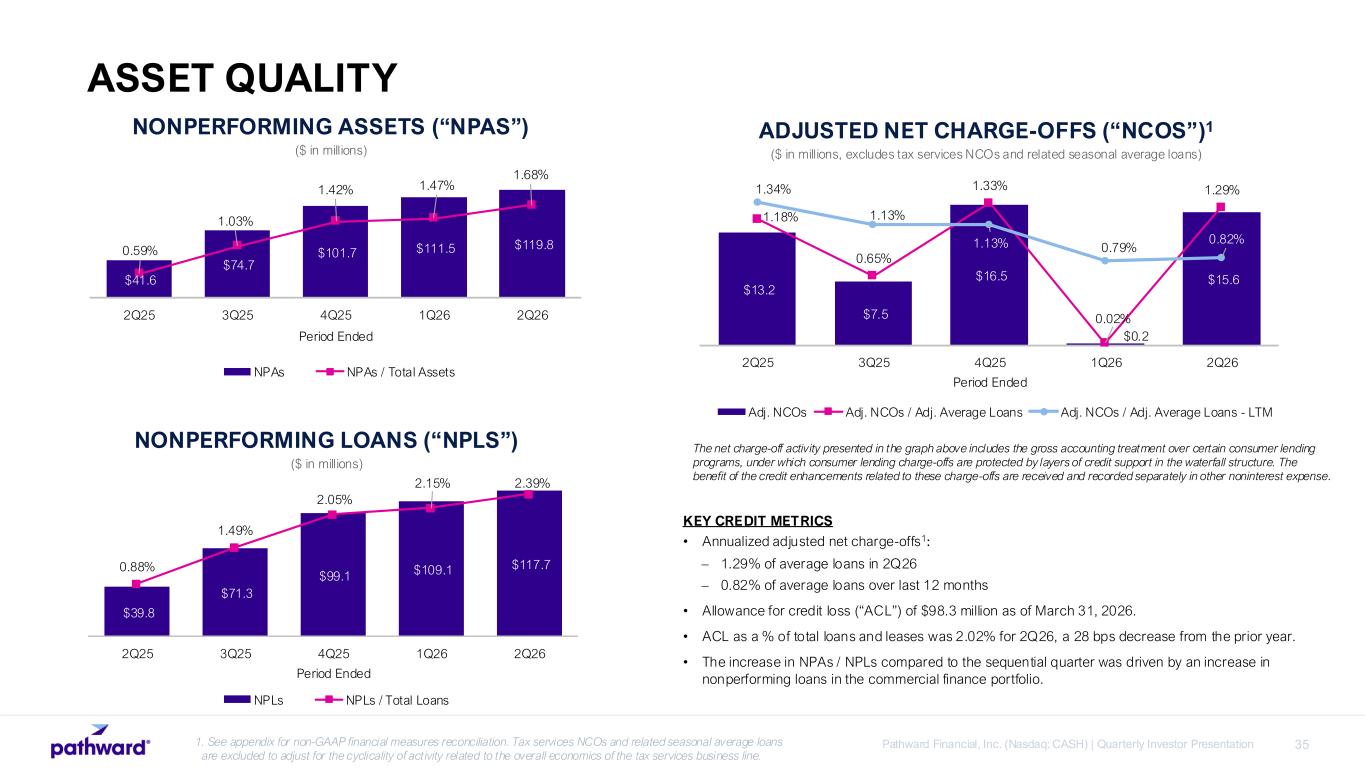
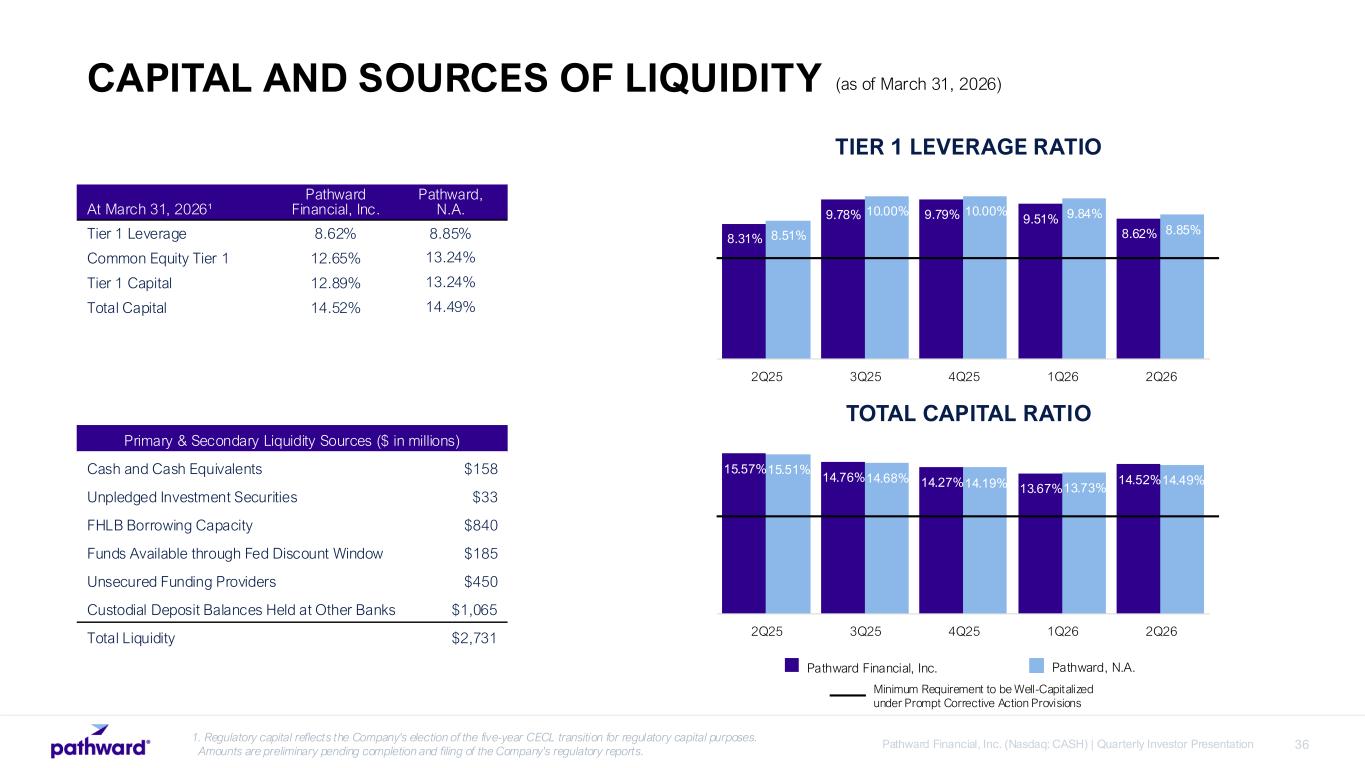
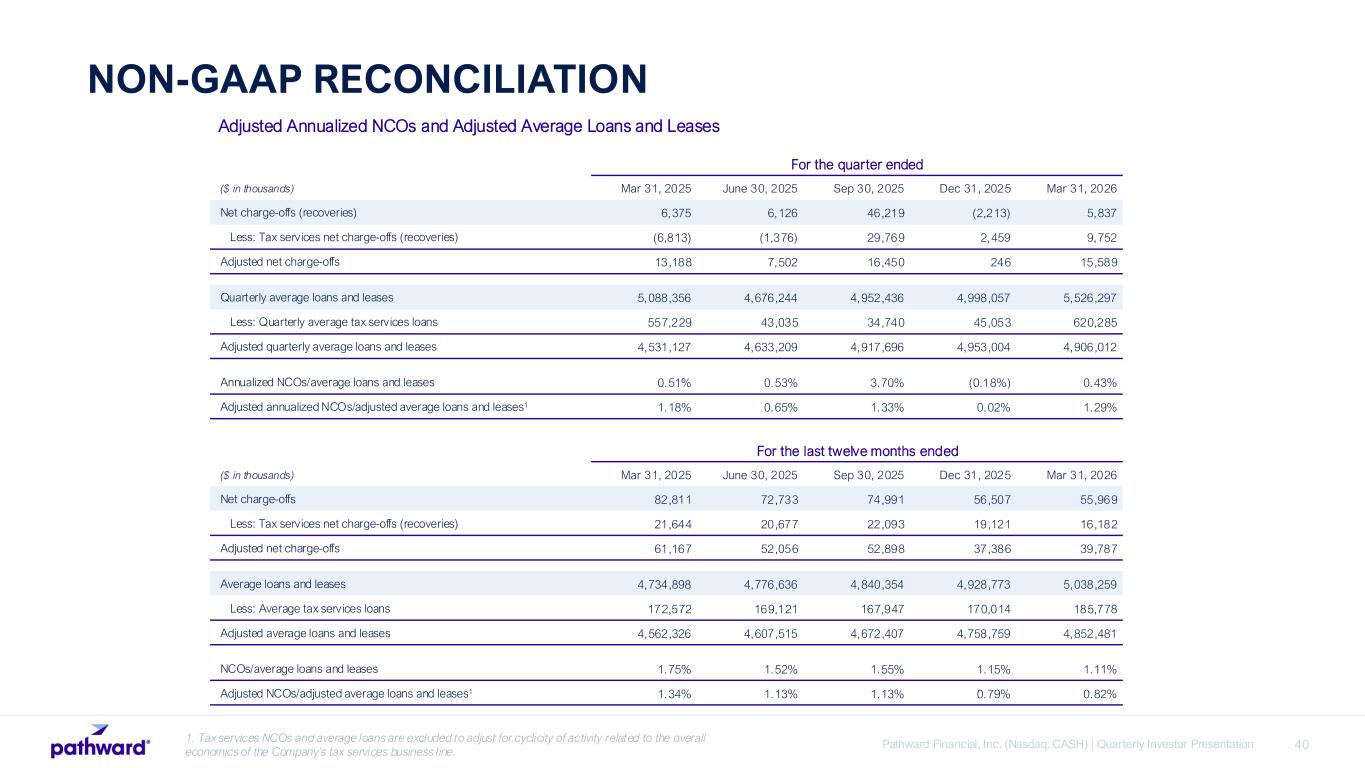
Thank you, Brett. Overall, we are pleased with the financial performance in the quarter. As Brett mentioned, our tax season is off to a great start. This is the product of thoughtful planning and teamwork, and we're proud of what the team is accomplishing again this year. We're equally pleased to see growth in partner solutions, which I'll dive into a little deeper in a moment. First, let me start with revenue. As expected, the sale of the consumer finance portfolio back in October did impact net interest income, given the elimination of the grossed-up accounting for that portfolio. Having said that, our strategy of balance sheet optimization continues to deliver solid results with growth in our core commercial finance business. Other parts of our strategy have enabled us to report solid results in non-interest income, particularly in our tax products as well as in core card and deposit fees. In our consolidated tax services, which consists of both our independent tax offices and tax partnerships, we saw an 18% increase in non-interest income from refund advance and other tax fees and a 7% growth in revenue from refund transfers during the quarter. This is the direct result of significant work to grow this business, increase market share, and evolve the underwriting model. Core card and deposit fee income, which excludes the servicing fees we earn on custodial deposits, grew 22%. We're seeing a lot of growth through existing partners, as well as increasing contributions from new contracts signed last year. Due to the continued backlog from the first government shutdown, we fell short of our goal range for secondary market revenues but we believe this is primarily a timing impact and we expect to make up the difference in subsequent quarters non-interest expense improved in the quarter outside of the impact from the sale of the consumer portfolio the primary driver was lower card processing expense due to lower rates partially offset by an increase in compensation and benefits given the value we place on our people we remain committed to investing in them as well as processes and technology, and we were still able to manage expenses well when compared to the prior year quarter. This led to net income of $72.9 million and earnings per diluted share of $3.35. Deposits held on the company's balance sheet at March 31st were relatively flat versus a year ago. This is consistent with our balance sheet optimization strategy. Lower yielding assets such as securities declined, and partner deposits were strong in the quarter. This allowed us to have over $250 million more in average custodial deposits than in the prior quarter, and also generated higher servicing fee income in the quarter. Loans and leases at March 31st grew 9%. Our focus on ensuring we have the right loans on the balance sheet was the primary driver of the increase, with a $588 million increase in our core commercial finance business, particularly in renewable energy and structured finance. Additionally, origination volumes were strong during the quarter, with $367 million in commercial finance at yields higher than the March 31st portfolio yield, and $945 million in consumer finance. This represents significant growth versus the same quarter last year, and we were pleased by the growth in consumer finance originations, which was driven by the new contract we announced last year. In commercial finance, our loan pipeline remained strong despite timing delays in certain cases stemming from the October 2025 government shutdown. Net interest margin was 6.63% in the quarter. Our adjusted net interest margin was 5.32%, a 23 basis point improvement over the same quarter last year. This was primarily driven by lower rate related card expenses. Our non-performing loans saw a modest increase to 2.39% and our allowance for credit loss ratio on commercial finance increased versus last year. This was driven by a mix of specific reserves and our CISL model, which takes into account a number of factors, including the macroeconomic environment, as well as portfolio history over time. Our commercial finance portfolio metrics are being driven by a relatively small number of loans in comparison to our portfolio size and in different verticals. As we've mentioned before, we look at our credit metrics to a full year look back. and to March 31st, our trailing 12-month net charge-off rate was at or below the same metric at the end of every quarter in fiscal 2025 and still remains at the low end of our historical range. Lastly, we continue to believe that we are still in a relatively stable credit environment consistent with the past few quarters. Our liquidity remains strong with $2.7 billion available, and we are extremely pleased with our position at this point in the year. During the quarter, we repurchased approximately 855,000 shares at an average price of $84.15. This leaves 3.4 million shares still available for repurchase under the current stock repurchase program. This concludes our prepared remarks. Operator, please open the line for questions.
Operator
We will now begin the question and answer session. If you would like to ask a question, please press star 1 to raise your hand. To withdraw your question, press star one again. We ask that you pick up your handset when asking a question to allow for optimum sound quality. If you are muted locally, please remember to unmute your device. Please stand by while we compile the Q&A roster. Your first question comes from the line of Tim Switzer with KBW.
Good afternoon. Thank you for taking questions.
So the first one I have, you guys just touched on it, but you upped the buyback quite a bit this quarter relative to what you've been doing recently. You still have a good amount of capital, obviously a high ROE. Is what you did this quarter, is that kind of repeatable for the rest of the year? And what are your other priorities outside of organic growth and repurchases? You know, are there any other kind of M&A type businesses you're in discussions with?
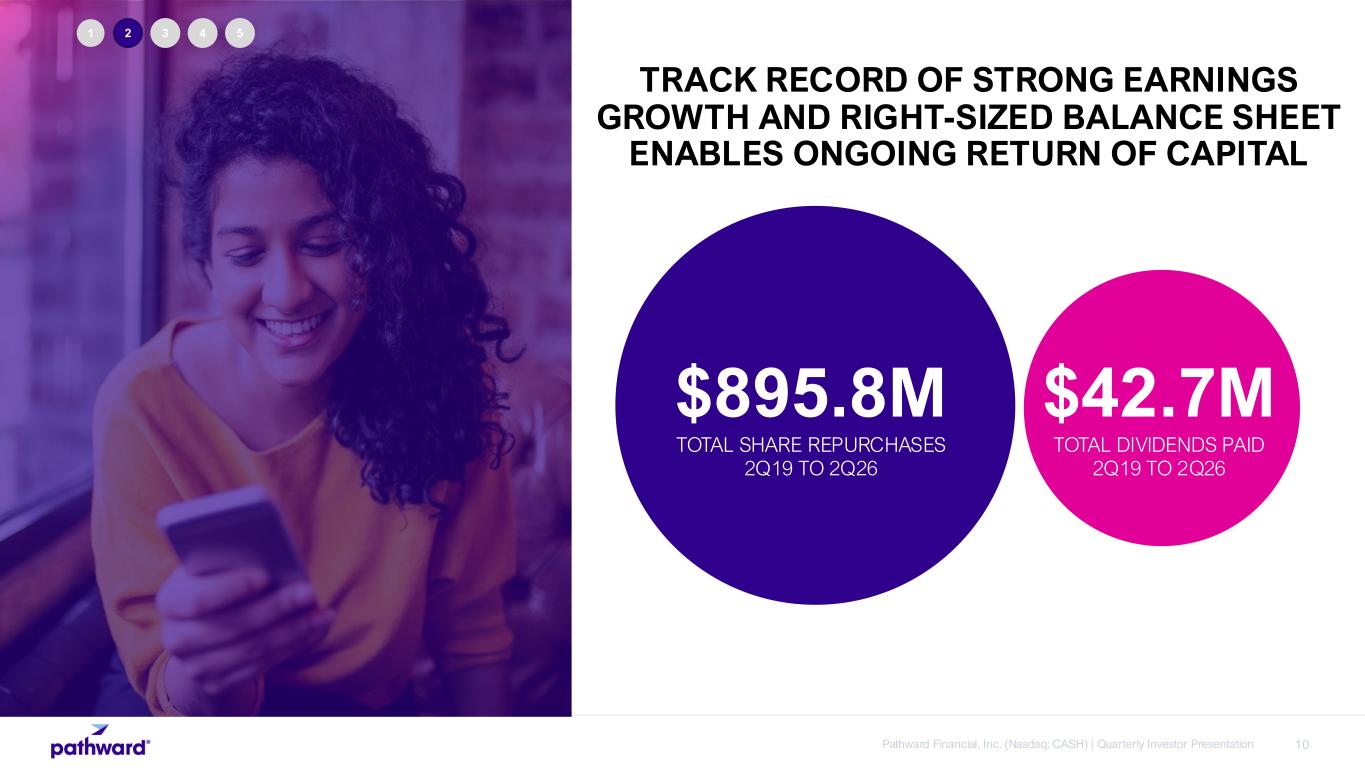
Yeah, Tim, let me start, and Brett may jump in at the end. But I think what you typically see, you know, throughout the years, you're going to see seasonality in that buyback, the number of shares in the dollar amount. It typically is correlated to our higher earnings quarter. So second quarter is always our highest buyback quarter on a relative basis. I would say, though, that, you know, the algorithm for the number of shares we buy, particularly early in the quarter, does get updated periodically. And I think this quarter, in part, it was we took advantage of lower share prices as well. So if it optically looked like we got a little bit ahead, it probably had something to do with that. Obviously, very pleased with where we landed in the quarter on the buybacks. But I think more broadly on the question of capital and capital allocations, I mean, I still continue to believe and we continue to believe that the share buybacks are still the highest and best use of capital at this point in time. You know, we obviously continue to look at a lot of things, but if that changes, we'll, you know, at some point let you know. But I think it's still buybacks.
Yeah, and Tim, it's Brett. So just sort of on the strategic elements of M&A, I mean, we're always looking to see what's out there. But with our results, we've got a pretty high hurdle rate and obvious reasons we wouldn't be involved in much of a bank kind of situation. We look for things that you might buy versus build. But we've just not seen anything over time that make any sense.
So the kind of capital utilization we're doing is, you know, the highest and best use in our mind at this moment. very clear um and then the other another question i had you guys mentioned i remember his last quarter two quarters ago about the new programs you guys announced in 25 would contribute you know mid to high single digits to card fees year over year um not even including some of the new um you know lending partnerships you guys have now that we're a few quarters then are you guys still on track for that um you know what have been kind of the puts and takes over the last few months, and where do you think that can go as we head into 27th?
Yeah, and Greg can talk about specifics if he wants to, but you look at our card fee income year-to-date, that's part of the increase in the non-interest income. And we had those deals. We always talk about some of them take time to come on. We're now seeing the benefit of that come through the non-interest income line.
Yeah, but as I said in my prepared remarks year over year, you know, the significant increase versus a year ago is largely organic, but as you would expect and as we've talked about, we've started to see some of the benefit of the new deals, but, you know, it's all about the speed to revenue. It still takes some time after you've signed the deals to, depending upon the product, to get those programs live and get the programs ramped and get them fully loaded, but the guide we gave previously about what that looked like on a fully loaded basis still applies. we still think it's going to be a measurable increase into next year as those programs fully ramp.
Okay, got it. And then the last one I have, and it might be a little too early to ask a question, and I don't know if we have enough details, but there's been the proposed executive order about banks being required to obtain citizenship info. And, you know, that seems like a tricky situation i guess for some of the bass banks and like you know what what's the risk of needing to perform that for all the bank accounts you guys have and like how much could that cost and then i know there's a lot in here but like on the other side of it is there an opportunity at all for like your prepaid card products like do we know if those would be required to attain to obtain citizenship info as well?
All right, Tim. So let's get in the weeds just a little bit. Obviously, we don't know what the rules are, right? So that's part of it. You probably know that for any known owner of account, you have to collect something called CIP. So we already have documentary and non-documentary pieces of information about our customers that we're required to get. An exception to that is if it's unregistered, like an unregistered gift card that would not apply, And I would suspect in this case it would not apply. But so we already have the processes in place with our partners to collect the necessary information like that. If there's something else that has to be collected, then, you know, we, like everybody else, would have to go and do that. But until we know what the rules are, we don't know what the implications are. But the highways already exist to get that kind of information. okay are you able to tell us maybe like what percent of your deposits or accounts would be part of that unregistered um prepaid card business yeah so so i'm getting the heads that said we don't disclose that here right um but you can think about our business right in general the kinds of things we have and you know if you're in the gift card it doesn't apply unless they specifically register it payroll card obviously know who it is there's various kinds of things so we would have it on some and we would not have it on others yeah and i think as we say broadly
on just the topic of deposits it's a well diversified deposit right so it's going to be different it's it's over time it evolves and over time as we continue to bring on new partners it continues to diversify so hopefully that helps ship yeah yeah no thanks uh thanks for answering that.
I'll jump back in the queue. Thanks.
Operator
Thanks, Tim. Your next question comes from the line of Joe Yanchunis from Raymond James.
Good afternoon. Hey, Joe. Hey, Joe. Good afternoon.
So I'd like to start with credit here. And I know you touched on your prepared remarks, but, you know, NPA has picked higher again this quarter. You know, can you provide some color on the underlying credits that drove this increase, and I know you often tout your workout process, you know, which can take time. So, do you have a sense for how much of this bucket was resolved intracorder?
So, let me go through a big picture. So, you know, you recall we've got different asset classes. We always do collateral managed transactions, so there's no unsecured, and we stay out of certain kinds of verticals that we do not think have good collateral attributes over time. We measure these things through the cycle, and Greg in his comments even talked about that. You always have some one-offs, right? So you have to go through a workout. Workouts can be short, you know, workouts can be long, and they're uneven as you go through them. So I don't know that we could answer the question if there any had been resolved, But they're all consistent with the way that we approach our collateral management program. And we've had consistent results with that literally for years that you can trace through. So, again, to Greg's comments, I think, in his remarks, you know, we're not seeing anything changing in the credit environment. It's just one-off stories that happen in various asset classes.
Yeah, and, Joe, just to walk you through a few of the metrics there just broadly on the credit side, You know, you probably saw when you get into it that on the, you know, past due side, the 30 to 59 day bucket increase went up by about, you know, $40 million. That was due to a limited number of loans that frankly came current after quarter end. So that kind of factors into this equation, too. So you kind of get back to more normalized level of past dues in that bucket. And then when you take that into account, overall past dues are pretty moderate. And then when you get you mentioned the NPL ratio ticked up, it did, but then you need to disaggregate that a little bit. when you look at the non-accrual balances in the earnings release those non-accrual balances actually came down about five million dollars that's the bucket that had some of the larger loans in it that we've been talking about in terms of resolution over the last couple of quarters what drove the npl up ratio up in the quarter though is that greater than 90 days past due and still accruing bucket which and that's that's really the broad stuff you know normal course uh collateral management collection piece that brett's talking about so that's a number of just our normal process, a number of smaller loans kind of drove that. So in the quarter, what drove it up was that bucket, not anything that's larger and part of the resolution.
Okay, that's helpful. And then just kind of moving over to the provision, and then we'll move on to a different topic. So the provision increased, you know, pretty materially in this quarter. How much of that increase was due to, you know, seasonal tax changes, organic growth versus, you know, underlying credit issues?
Yeah, I think the line I focus on the most, I mean, I think we isolate the tax services provisioning in the document. I keep coming back to the commercial finance, which I addressed in my prepared remarks, right? It was a mix of both, you know, there's certainly some specific reserving related to everything we talked about on the NPL side, but it's also just driven by our normal CECL process. Many quarters is driven by increasing the loan book, but this quarter it was more driven just by looking through and just taking a pragmatic view of where we're going to land on some of these credits. But with the benefit of looking forward, we still believe this is a very, my word's benign, very stable credit environment. So we're not seeing anything special in that. I think the other thing I pointed to in my prepared remarks, though, is you've heard us say this for quite a few quarters now. We always look at the trailing 12-month NPLs or net charge-offs because, you know, that's a better barometer for this business given how lumpy some of our workouts are and some of our recoveries are. So, when you kind of apply that backward-looking, you know, 12-quarter view to the net charge-offs this quarter, and frankly, the things driving some of the credit metrics, it's benign. It's well within our historic averages.
One of the things that's very important about our asset classes, Joe, is while in some industries, these non-performing loans are a leading indicator and the net charge-offs are a lagging indicator. If you look at the correlation in our book for the past literally decade, that's not what happens. And so while you have non-performing loans, they generally tend to be more tightly secured. And even if you get a charge-off, you get a recovery. So look at that history through the cycle, and you'll see our net charge-offs are disconnected from our non-performing loans.
Got it. I appreciate that. And I'll ask one more before hopping back in the queue. You know, so you had mentioned subsequent quarter end, you reached a contract extension with a partner. And sorry, I didn't catch the name during it. Generally speaking, how do economics change during the recontracting process? You know, I understand that if the partner grows during the contract, you'll get more volume. But does the recontracting generally result in lower margins?
You know, every contract is different. And, you know, there's a lot of contracts where you trade one thing for the other because that's what the partner wants to do. So, you know, the classic example is if there's deposits involved and somebody wants a higher percentage of what we call contractual card service payments on it, but then we just charge more transaction fees. So the net economics for us are the same. And a lot of it depends on whether they want to take interest rate risk or not. And, you know, we can manage interest rate risk or they can manage it. So there's always tradeoffs. There's also tradeoffs of, you know, if you want it longer, you know, that'll probably be better economically. If you want it shorter, probably not as good economically. So that's a general comment on them. So every contract negotiation is different, and there's not a standard sort of book approach to it.
And, no, we're not seeing things generally go south on the margin side because that's – we did this a few years ago that's the reason we didn't do a lot of transactions uh at one point was the pricing was silly now we're seeing the kind of pricing we want to have and part of that too is we feathered in the discipline to do risk adjusted returns every time we do either a new partner or one of these renewals so there's a kind of you know there's a pricing team that looks at it to make sure it makes sense and it's sensical for for us from an overall enterprise perspective um all right that was very helpful and i will hop back in the queue and we'll talk again Thanks, Joe.
Operator
Your next question comes from the line of Manuel Navas from Piper Sandler. Manuel, your line is open.
Hey, is there any more color you could add? Good afternoon. Is there any more color you could add about the partner pipeline? You said it was robust. Just anything you could add there.
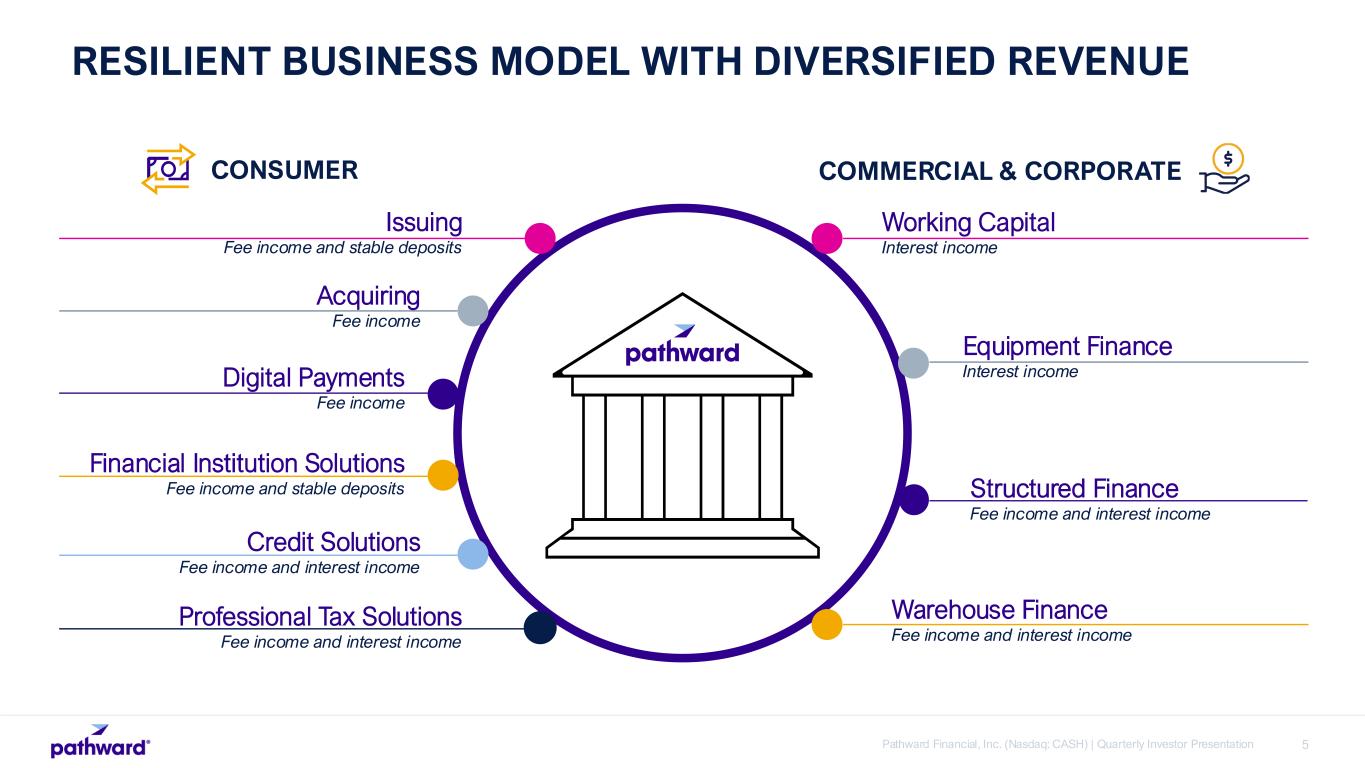
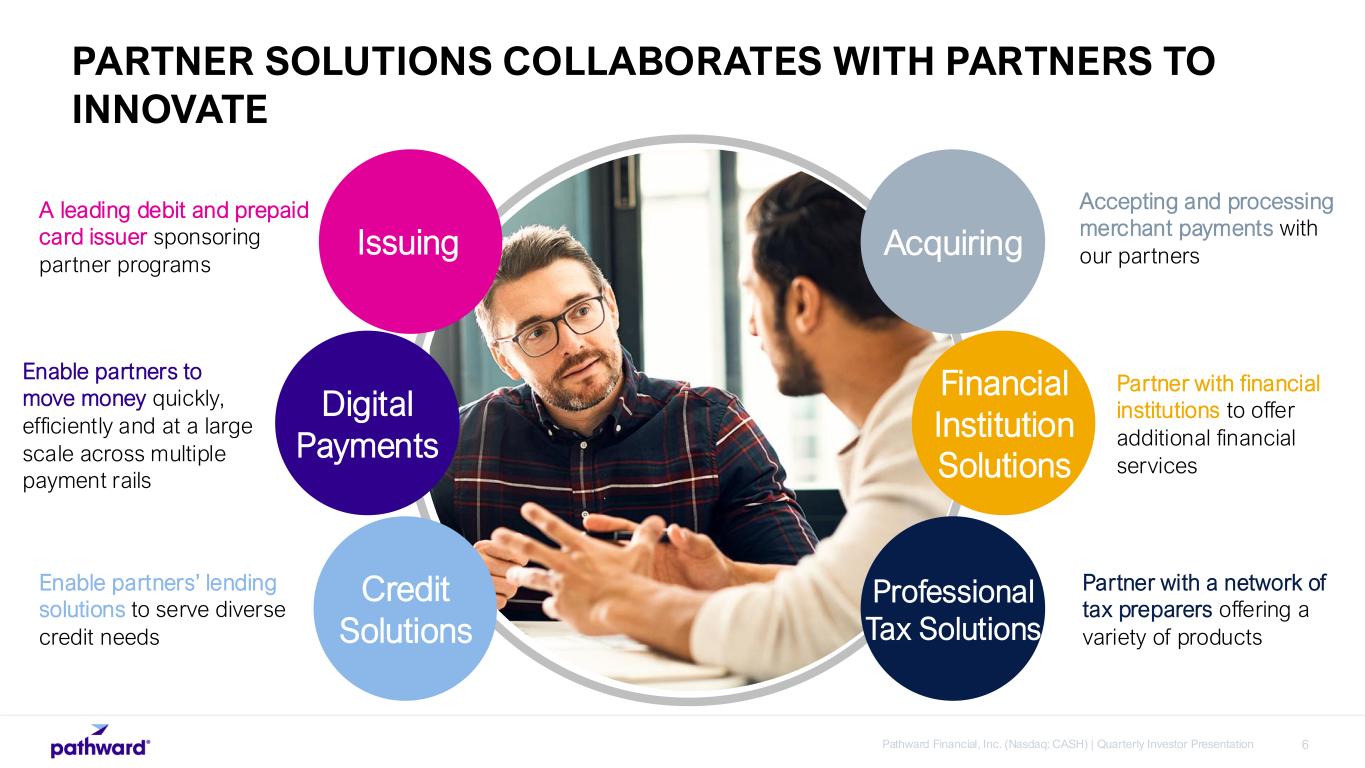
Yeah, well, and, you know, we've been through these last several years where, you know, There was a period of time, I alluded to it a minute ago, where there were some things that were going on in the industry that we really didn't want to participate in. A lot of that's gotten washed out, and we've started talking in the last year, year and a half, that it's really picking up and it's actually coming through with contracts. And yes, our pipeline is very strong. part of that has to do with our breadth of product approach with our partners where we'll do multiple kinds of products with the same partner and that's an advantage I think we have in the marketplace and we're continuing to have lots of new opportunities and new partners as well as existing partners bringing on new products and new programs so pipeline is very strong and part of us because you know we think the dynamics and economics have returned back in our favor.
Yeah, and the 22% increase in core card fee income from last year, that in part is new products with existing organic partners. No, I don't have the numbers to split it out for you. But again, that's just one outward sign that we're having success with our existing partners doing the multi-threaded approach on the product side, as Brett mentioned, in addition to, as he also mentioned, new partners to new products. So we're really pleased with where we are right now.
That's helpful. Can you speak to, there was some loan decline this quarter. I understand some of the seasonality there. How should we think about loan growth going forward? You talk about healthy pipelines and different of your loan lines. Can you speak to perhaps the mix of that growth as well going forward as you kind of reset the loan book to how you want it to end up?
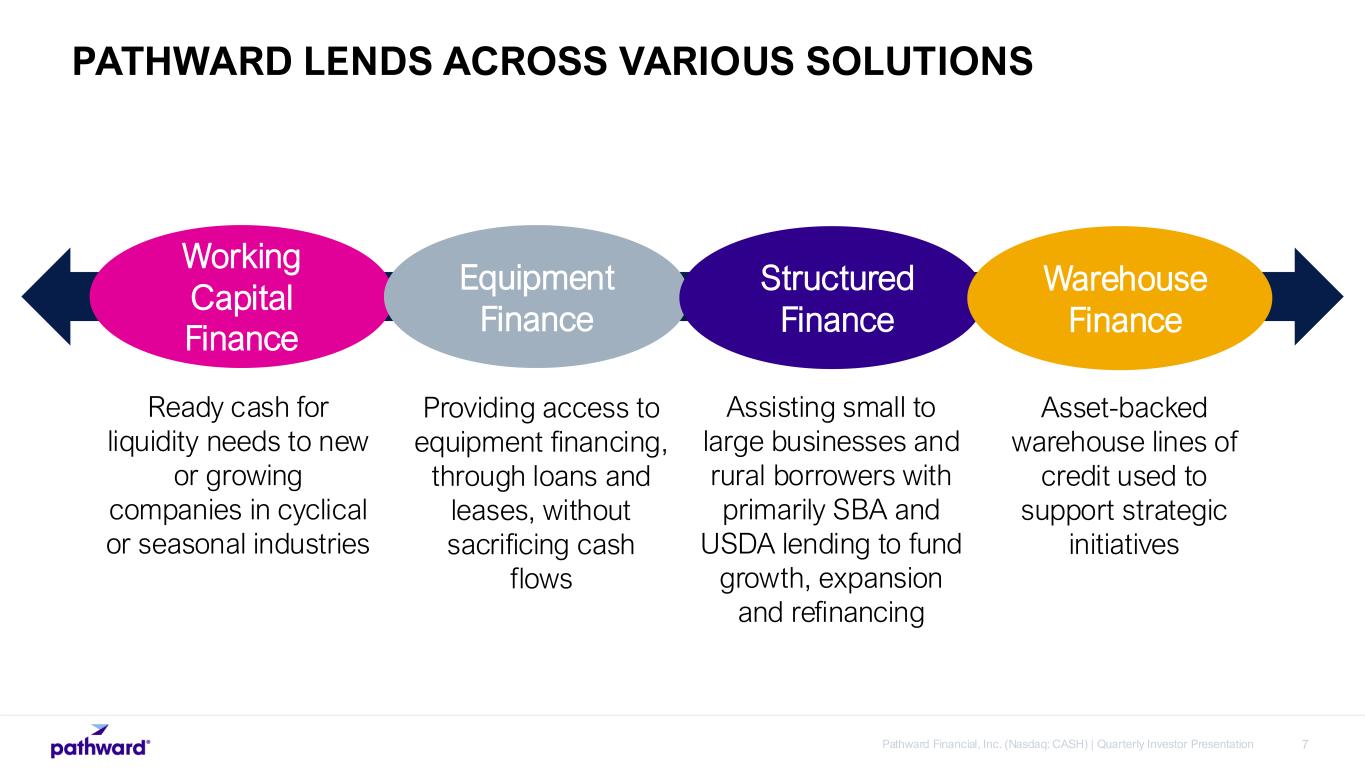
Let me work backwards on that. I mean, I think we like the verticals we're in. You know, we've done some resetting over the last couple of years. We've actually did a couple of verticals. But when we think about the asset classes that we're in, we've been very purposeful with them. We've obviously used a risk-adjusted, you know, return approach with looking at credit through the cycle. I think the variance you saw in the quarter, though, was more of a timing issue. On the USDA side, there's probably a bit of a slowdown in the quarter just related to the government. The first shutdown with the government led to some slowdown in the USDA side, but I continue to believe that's just a timing issue. When I think about the rest of the asset classes more broadly, I think it's just more of a timing issue. I would say our pipelines are still very full across the verticals. So when I think about the balance of the year, I tend to focus more on the originations than I do the relative point estimate or average on the loan side. Why? And this goes back to the treasury-led model and the fact that we're focused on the balance sheet velocity, which really means we can be down quarter on quarter too, just because we sold a lot of stuff purposefully as part of that process. This quarter, I didn't have anything to do with that, again, because the USDA was, you know, they're still a little bit, you know, groggy. They're forward, I would expect to see some modest continued uptick in the quarters going forward in the products we're in with an eye toward, again, risk-adjusted returns across the verticals we're in at this point in time.
I appreciate that. Any near-term guidance on the direction of the NIM? It stepped down on both the full version and then the adjusted level. Just kind of how should we think of it going forward on either metric?
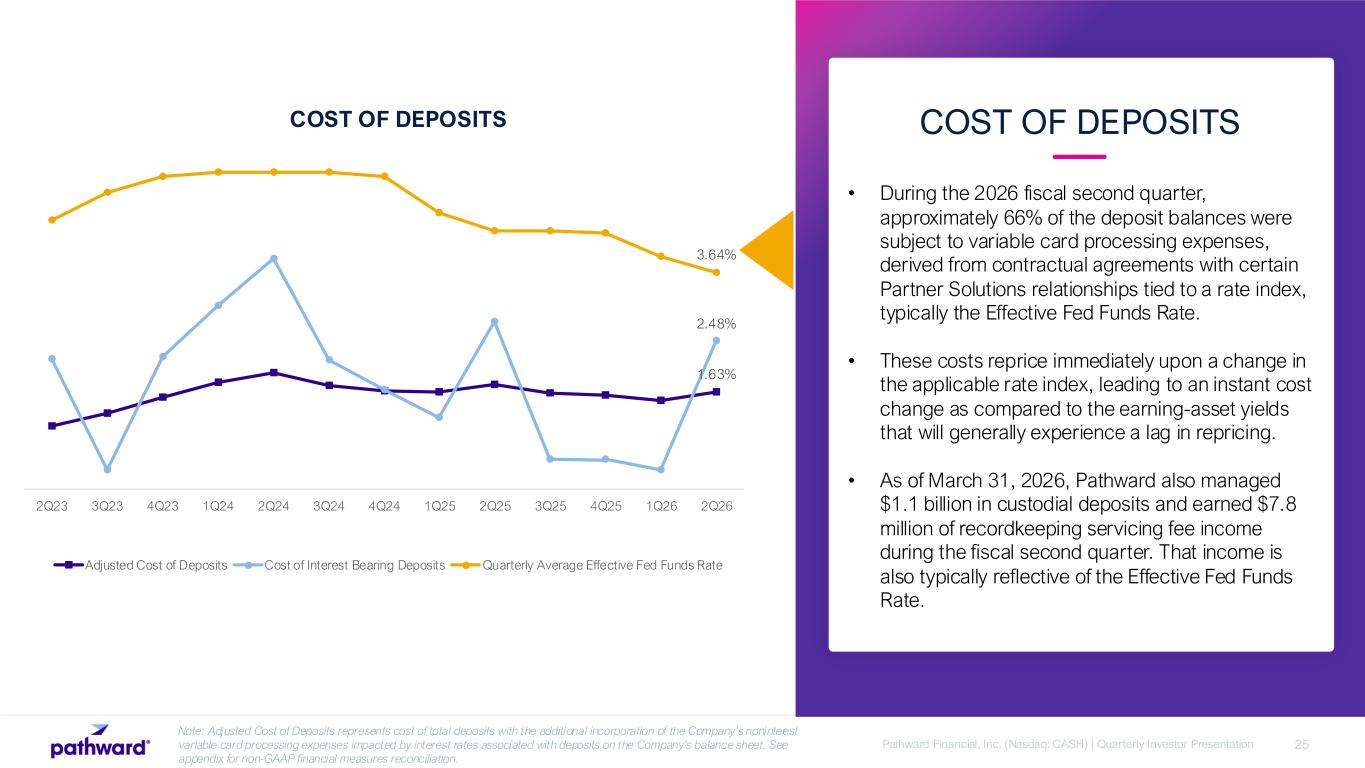
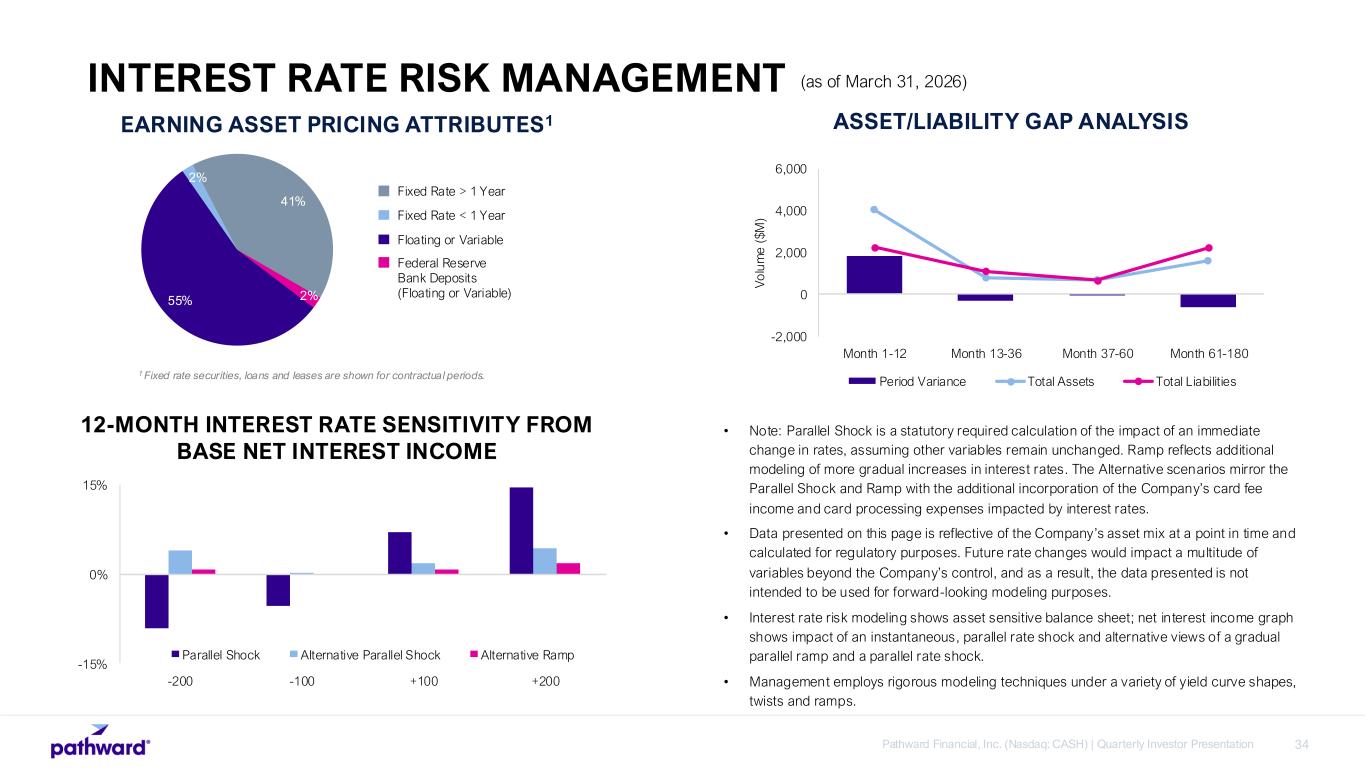
Yeah, adjusted NIM is the one I would recommend. It's the one I look to because I believe it's the more accurate representation of the interest rate risk on our balance sheet because it kind of neutralizes for things that are not sitting in, you know, net interest expense, you know, the contractual rate related fees we pay to partners on deposits. That one was down in the quarter, but if you kind of go back, I think we have a time sequence someplace that'll show you that metric kind of back in time. You tend to always see seasonality in the March quarter because of tax season. The balance sheet grows. And as a result, you know, we tend to do some borrowings, you know, wholesale borrowings at the margin to fund that. We don't need to fund it 12 months of the year, but we do fund it for 45 to 60 days of the year. So that tends to cause a little bit of a downtick in the March quarter. Looking ahead, though, I mean, and I appreciate you weren't on last quarter's call, and Emmanuel will say now, we really appreciate you joining the team here and joining the party. I still continue to believe we're stable to slightly trending up on the adjusted net interest margin. Why? I think we've proven, you can look at either metric over the last year, you know, rates are down, you know, approaching 100 basis points in the last year. The adjusted, you know, you look back to the adjusted them a year ago, we're up. And that kind of, I think it's proof that we're not sensitive to the short end of the curve. And as we've said consistently, we are more sensitive to the middle part of the curve, three to five year, because that's where we price, you know, fixed rate loans that we do have are priced there. And as importantly, we still have roughly $200 million for the next 12 months in the securities portfolio that it'll reprice, and it'll reprice likely into loans over that horizon. And there's still a bit of fixed rate loans that were put on before rates really ran up in 2022 that still are subject to repricing. And that last one's becoming a smaller and smaller bucket, but it all leads down the path of, again, I still believe there's a modest tailwind there for us. I don't see with the current rate environment, current rate outlook, and the mix we've got anything that would suggest otherwise.
I appreciate that. One last question on the tax season. What's kind of, I know there's about a month left in terms of what you haven't reported yet, but like what are some of the learnings that you're going to apply to next year?
Anything on new tax laws, where you can gain market share, kind of any of the priorities that you think you might set up for the next tax season you know over the last several years we have really done a good job of focusing on customer service with our eros uh and because of some disruption going on in the marketplace that's given us a great opportunity to grab market share and we would hope we would continue to do the same thing next year now this year got quite a boost from, you know, the new tax laws and interest in refunds and, you know, the size of them and a lot of those kinds of things. And that may not come next year, but we still continue to believe we're having a better experience for EROs. And so, therefore, we retain more and we'll be grabbing more in future years.
Thank you for the commentary.
Thank you, Manuel. your next question comes from the line of tim switzer from kbw tim your line is open please go ahead um yeah thanks for letting me back um a quick one here there's obviously been a lot of pullback from some competitors in the banking as a service space due to the regulatory environment now that we're a few years through that you know can you quantify and maybe not quantify but you know discuss if you're starting to see more competition um coming in and you know is are there different types of players or more players in the space than there were previously in terms
of like this coming from beyond just banks now as you guys also expand your offerings yeah so you know let's talk about the elephant in the room right which is you know everybody's going and getting a bank charter right now we might as well just hit that head on um so generally in our pipelines we are not seeing the effect of that. There are those including some of our partners that are getting charters but in many cases they're getting sort of limited purpose charters and re-acknowledging to us they're going to continue to do things with us so you know we think there'll be certain cases where people get charters and do that. Those that are going for full national charters some of those things there's a long way between here and them actually getting a bank opened and getting something up and running. So, you know, my view is we're a couple years out and they'll probably arrive just in time from what might be the next administration, which will be an interesting experience. So I think we've got a period of time here with runway on pipelines and we're not seeing any impact yet from some of those kinds of things. I do believe there'll be some that are successful in two or three years from now. We'll have some more competitors that are in this space, but we've been there before and that's one of the reasons We're making sure we're, you know, serving partners well, giving them a wide breadth of product opportunities, which are not easy to duplicate, typically getting longer-term contracts where we can because switching costs are high. And we think that will help us even if we hit another competitive wave that may happen here in a few years.
Interesting. Yeah, you did get ahead of my follow-up there on some of your partners going to get contracts. So I got just one more here, and I think I asked this a couple quarters ago, too, but there's so much movement happening in the space right now, and the current administration is very open to it. Any recent developments you guys can share or talk about your level of interest in partnering with a stable coin or some other digital asset company?
I mean, we're in the payments business, so we have to pay attention, right? So we have our own views on stablecoin, how we're going to deal with that, think about that, et cetera. But we are a partner-led model, and we're watching our partners. And as our partners come to us, we're engaging in various things. And that's not just stablecoin. That's many other different kinds of payments mechanisms that are happening. And so we'll continue to do that. But we're watching it and participating in the dialogue, but it's not the kind of thing we're announcing. and we'll watch how our partners lead us.
Thanks for taking my extra questions. Yep.
Operator
Your next question comes in the line of Joe Yachunas from Raymond James. Joe, your line is open. Please go ahead.
Hello again. Hey, Joe. So a few more questions for me here. So I understand your pipeline, your partner pipeline is pretty full. You know, cross-selling remains, a big opportunity. Over the next, call it 12, 18 months, do you expect to have more success cross-selling products or signing up new partners?
It's hard to answer that question. And a lot of it depends on, I mean, we're going to be doing both, right? New ideas come in, et cetera. When you do a new partner and a new program, ramp up is slower. There's no doubt about that. Greg alluded to it earlier, organic growth has been an awful lot of our, you know, growth recently, but we've got new things coming in. So, you know, I don't know that I could put a 50-50 on it or something like that, but it's both of them are key parts of our overall strategy.
Yeah, I'll answer just from a revenue growth perspective, not even the numbers, what signed up. And to Brett's point, I think you always get to revenue faster with existing partners in part because of just the third-party risk management you have to do once they're onboarded. It makes it a little easier and there's less. But I think you also typically, when I think about the next 18 months, I still think that you're going to have a fair amount of revenue growth still going to come from existing partners, whether that's cross-selling to your words or multi-threaded to ours. I think when you get out past the 18 months is when you're still going to have the tailwind from new partners, new products.
Okay. And so, you know, in that answer, you talked about, you know, onboarding partners and how it can take longer for new partners. I guess, how has the time to onboard a new partner changed over, you know, now versus, say, three years ago? And I understand you have, you know, different products, which might have different times.
But just generally speaking, has that, you know, speed to market, has that changed at all? you know we've had a focus on speed to market and that's part of what we're doing some of that is a process improvement some of that is uh you know we're investing in technology and and those kinds of things that that will help with it uh and sometimes you know we're waiting on partners right so you've got both of those things are going on and and you sort of took the words of my mouth and it depends on the product there's a few products you can turn on in a matter of weeks right and there's others that can take quite a while to do it uh so uh it varies but we have been focused on us improving the speed of that uh but we just got to remember third-party delivery
is in fact third-party delivery and there are frameworks that have to be put in place when you set that up and that's an important part of our overall program yeah and speed to launching is different from speed to revenue because again we're not lifting and shifting programs that exist These are not BIN transfers, right? So then you're then beholden to the partner to actually ramp their programs, and that, again, varies by product. But that's the other dimension that we work with partners on, but that's the way they manage the program.
That's fair. And, you know, on the technology front, I mean, you're one of the major players in the banking as a service space. Can you talk about the value of building your own technology versus using a third-party vendor?
Yeah, we spend a lot of time talking about that. part of the issue is that um the requirements for this business are fairly unique um and the ability for say a service bureau to provide them there's not sufficient scale for them to be interested in developing so we have to do a lot of things ourself have done a lot of things in the past and are rebuilding a lot of things um now um the other thing is and i'll just kind of go ahead and use the word everybody wants to use, which is AI is being used a lot in our engineering space to help speed up the time to develop various capabilities. And that makes it even easier for us to build things ourselves internally. And I think that'll be a key part of the future. I'm not saying that software service providers aren't going away. I just think that there will be different kinds of use cases for different things. And the things that are unique to our business, we will likely build ourselves.
Okay. And then one more for me here, you know, just kind of taking a step back and, you know, looking at the broader bass space. I mean, what do you view the biggest potential risk to the industry? You know, we have JPM seems to be focused on small businesses. They're kind of doubling down on that segment. But I mean, how do you handicap the risk of, say, one of the GSIBs starting to target lower-end consumers?
Yeah, I mean, one of the key things here for the big banks is, is there sufficient scale, right? And I don't see that happening, and I worked for one of those at one point, so I kind of know the conversations that went on in that space. So, I don't see that happening. I do think as we become less interchange product-dependent oriented, which could happen over time, we'll face different kinds of competition. But again, being small, fast, and nimble is something that I think is of great value and is particularly important in this third-party delivery environment. And so we will have to adapt and change as product desires are coming in from our partners, which we're doing. That's why we like that wide breadth of products. But I don't see, you know, one of the big banks coming in and trying to take over the low to moderate income or the digital first, very young folks. It's just not enough scale in it.
Got it. Well, thank you. And I appreciate you taking my questions.
Operator
At this time, there are no further questions. I will now hand the call over to Brett Farr, CEO, for closing remarks.
Thank you, everyone, for joining the call today. Have a good evening.
Operator
This concludes today's call. Thank you for attending. You may now disconnect.