Operator
Good morning, ladies and gentlemen, and welcome to the Celsius Holdings first quarter 2025 earnings conference call. At this time, all lines are in listen mode only. Following the presentation and the prepared remarks, we will be conducting a question and answer session. If you'd like to ask a question during that time, please press star 1 on your telephone keypad. Thank you. I'd now like to hand it over to Paul Wiseman, Investor Relations. Please go ahead.
Good morning, and thank you for joining Celsius Holdings' first quarter 2025 earnings webcast. With me today are John Fieldley, Chairman and CEO, Jared Langans, Chief Financial Officer, and Toby David, Chief of Staff. We'll take questions following the prepared remarks. Our first quarter earnings press release was issued this morning with all materials available on our website, ir.celsiusholdingsinc.com, and on the SEC site, sec.gov. An audio replay of this webcast will also be accessible later today. Today's discussion includes forward-looking statements based on current expectations and information. These statements involve risks and uncertainties, many beyond the company's control. Celsius Holdings disclaims any duty to update forward-looking statements except as required by law. Please review our safe harbor statements and risk factors in today's press release and in our most recent filings with the SEC, which contain additional information and a description of risks that may result in actual results differing materially from those contemplated by our forward-looking statements. We'll present results on both a GAAP and non-GAAP basis. Non-GAAP measures like adjusted EBITDA, adjusted EBITDA margin, adjusted diluted earnings per share, and their GAAP reconciliations are detailed in our Q1 earnings release. And non-GAAP financial measures should not be used as a substitute for our results reported in accordance with GAAP. With that, I'll turn it over to John.
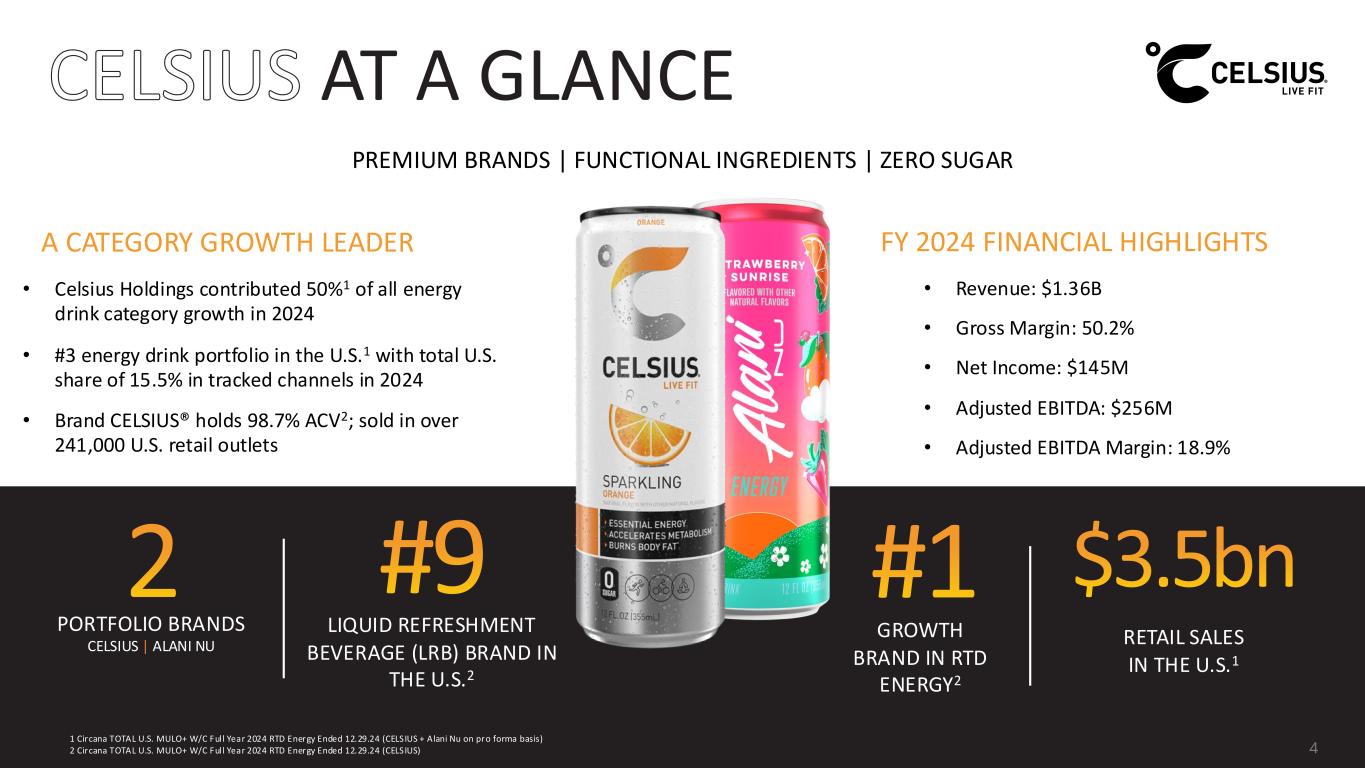
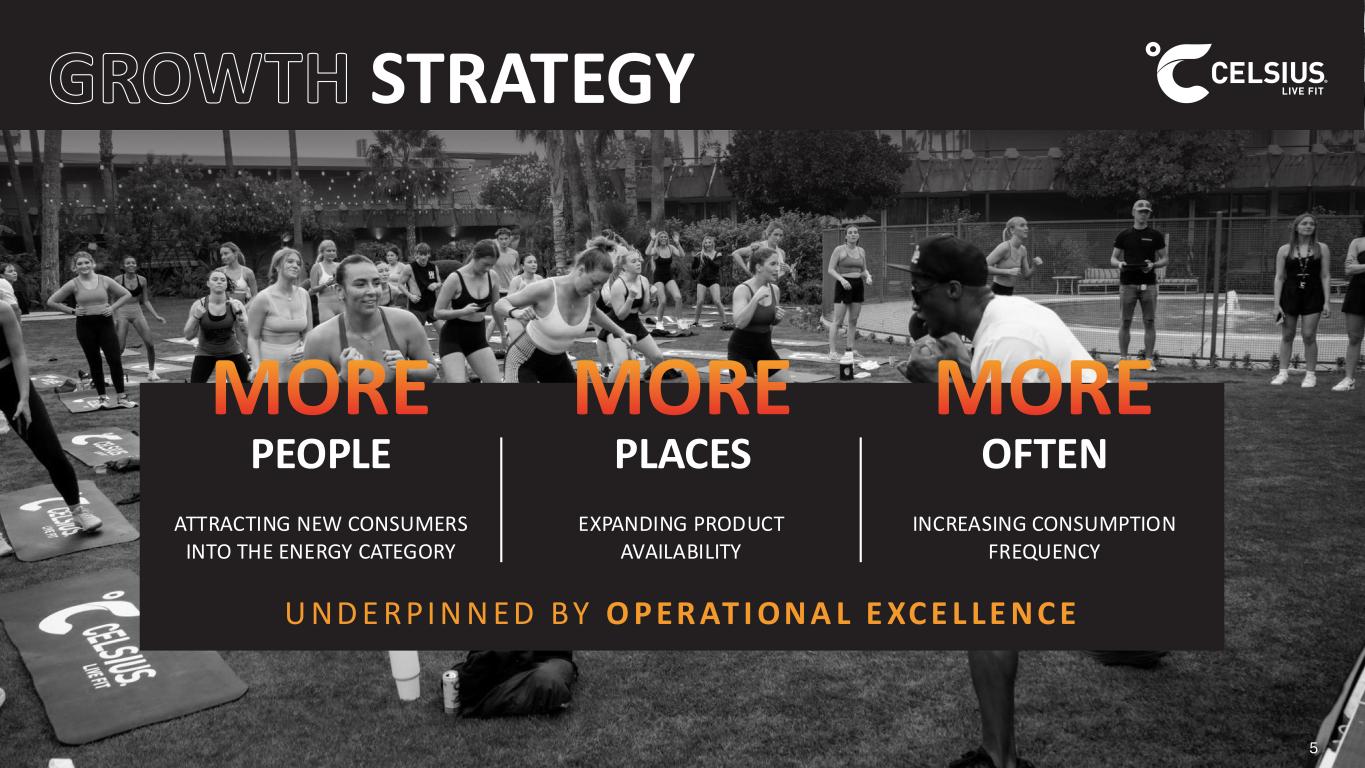
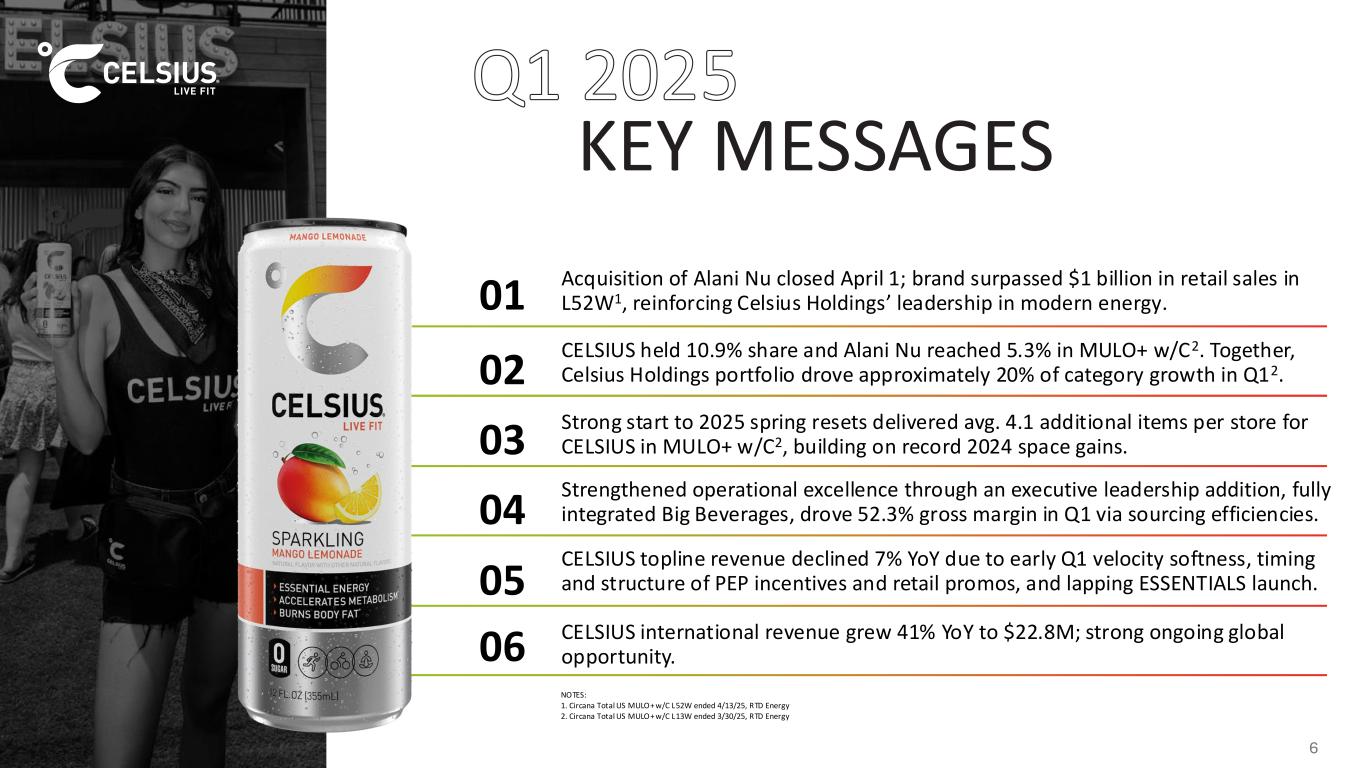
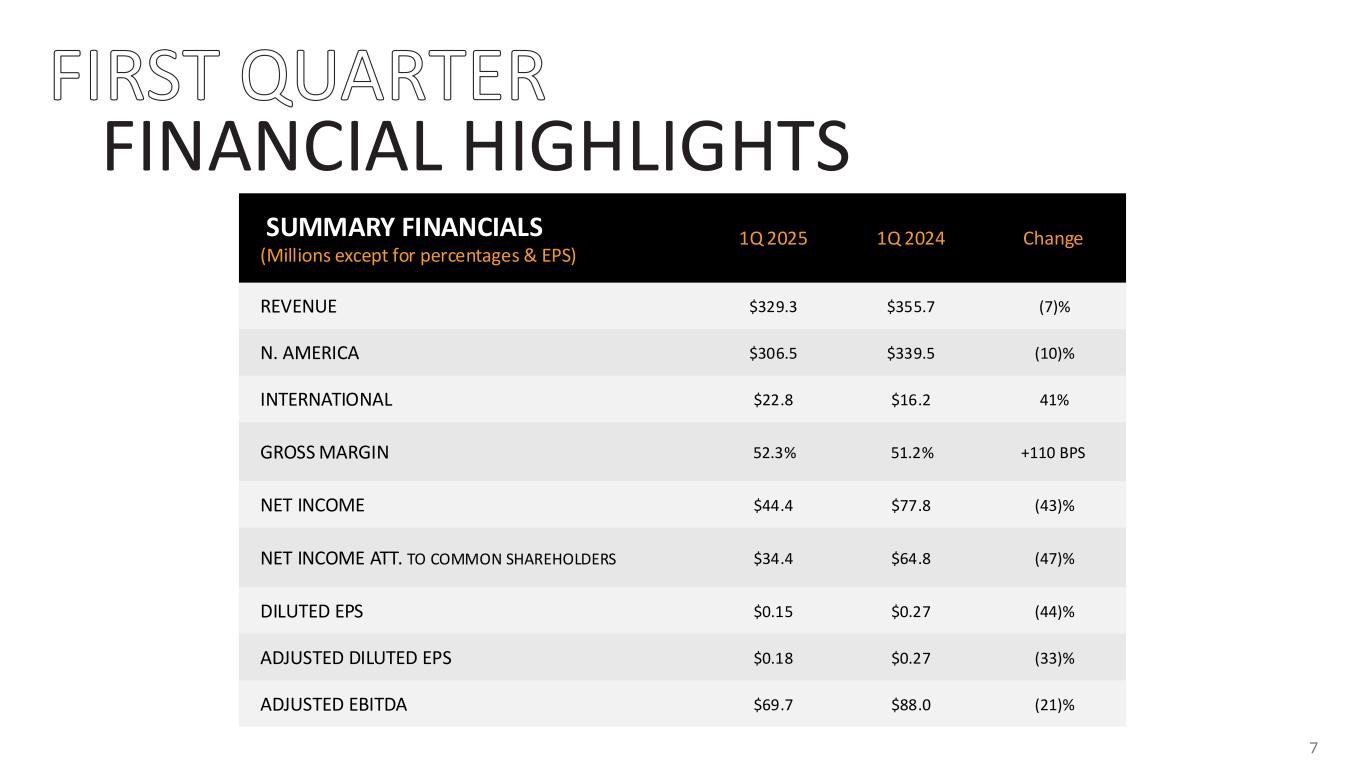
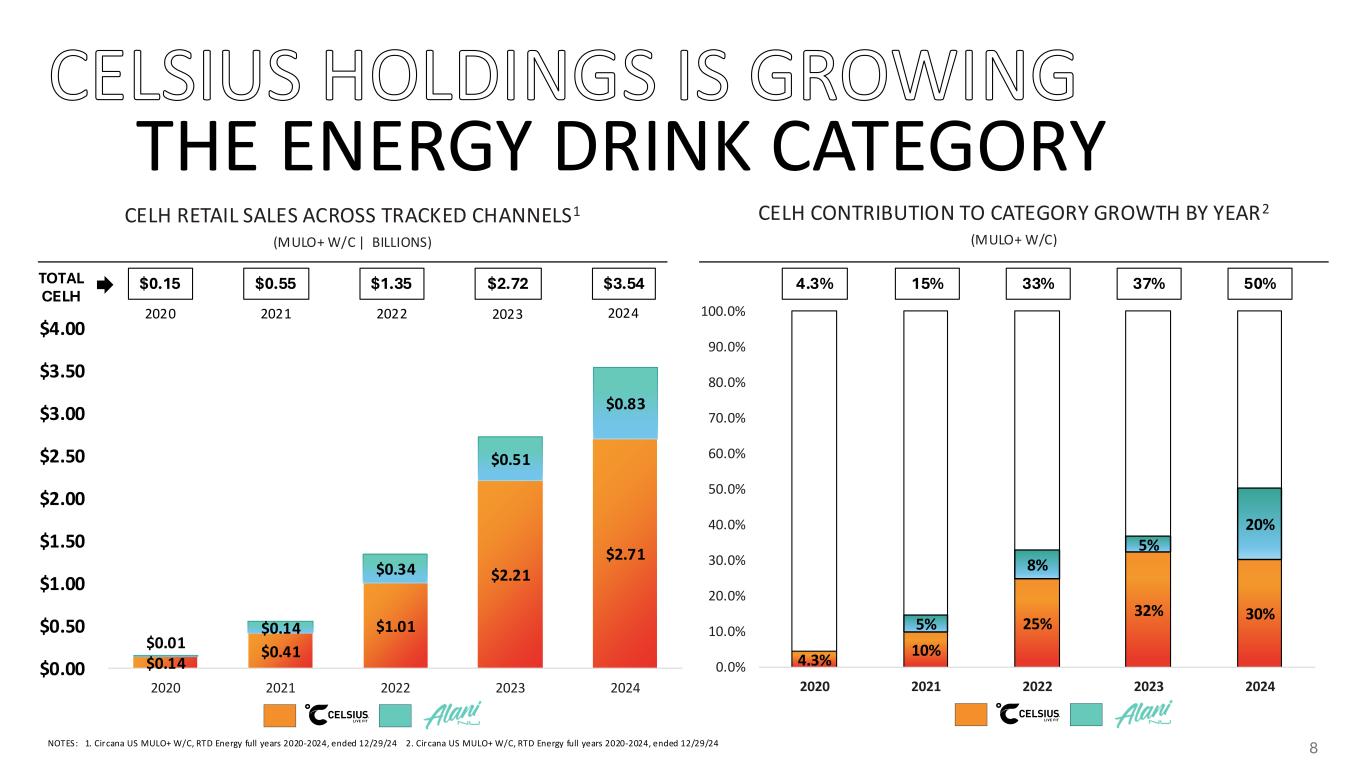
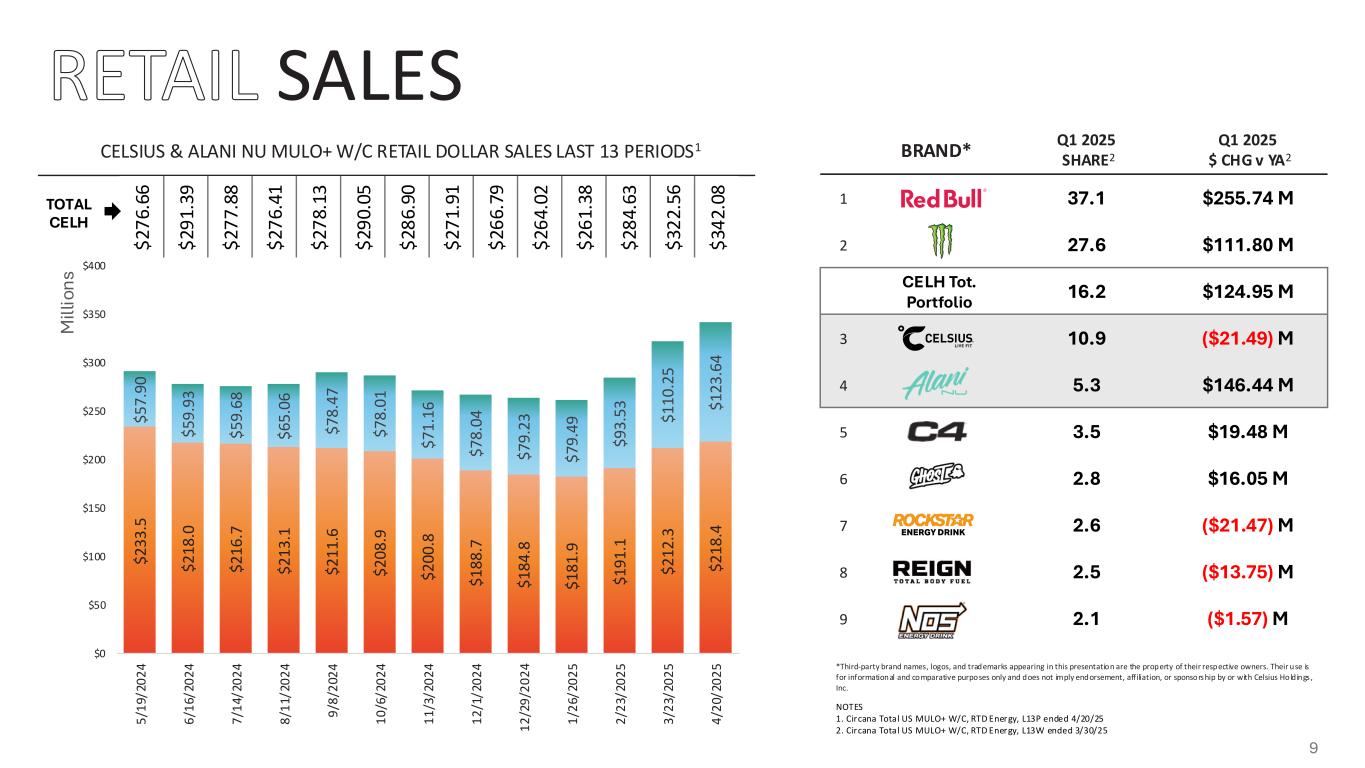
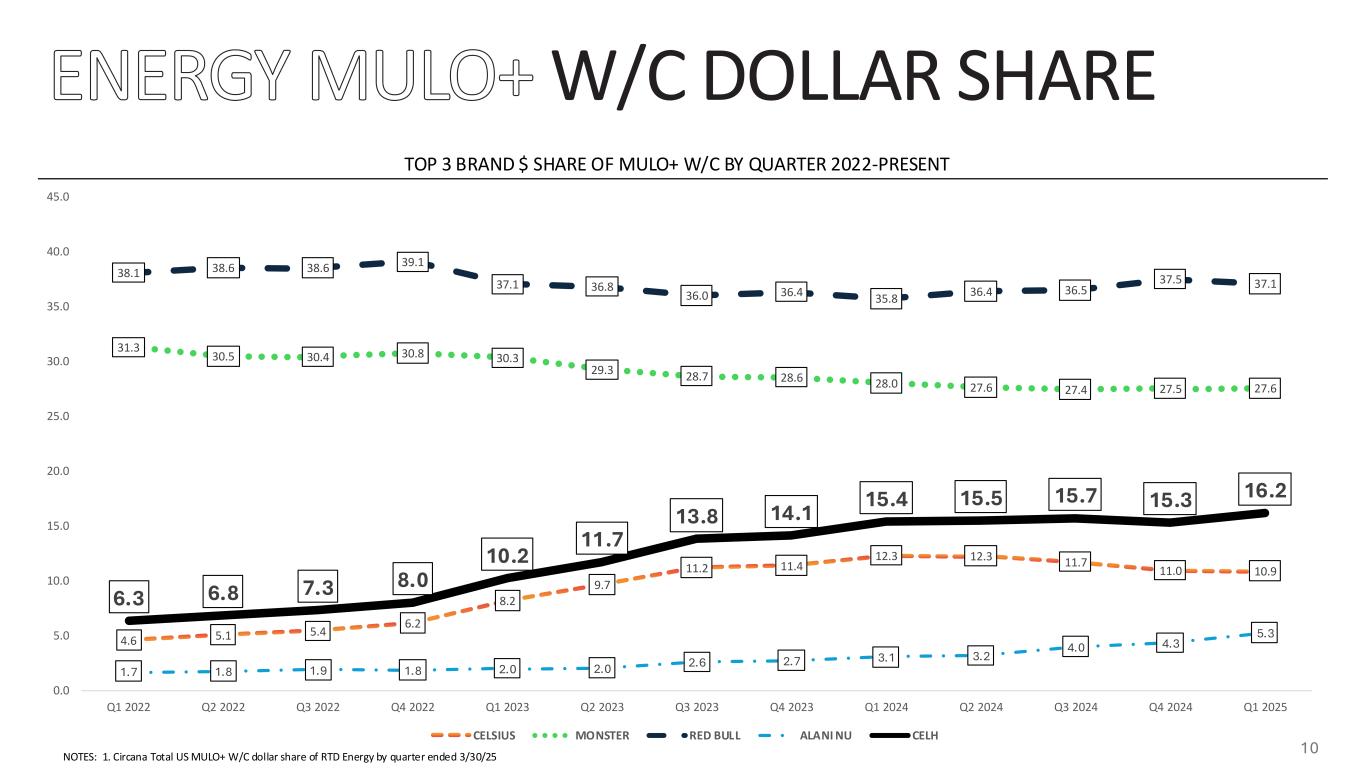
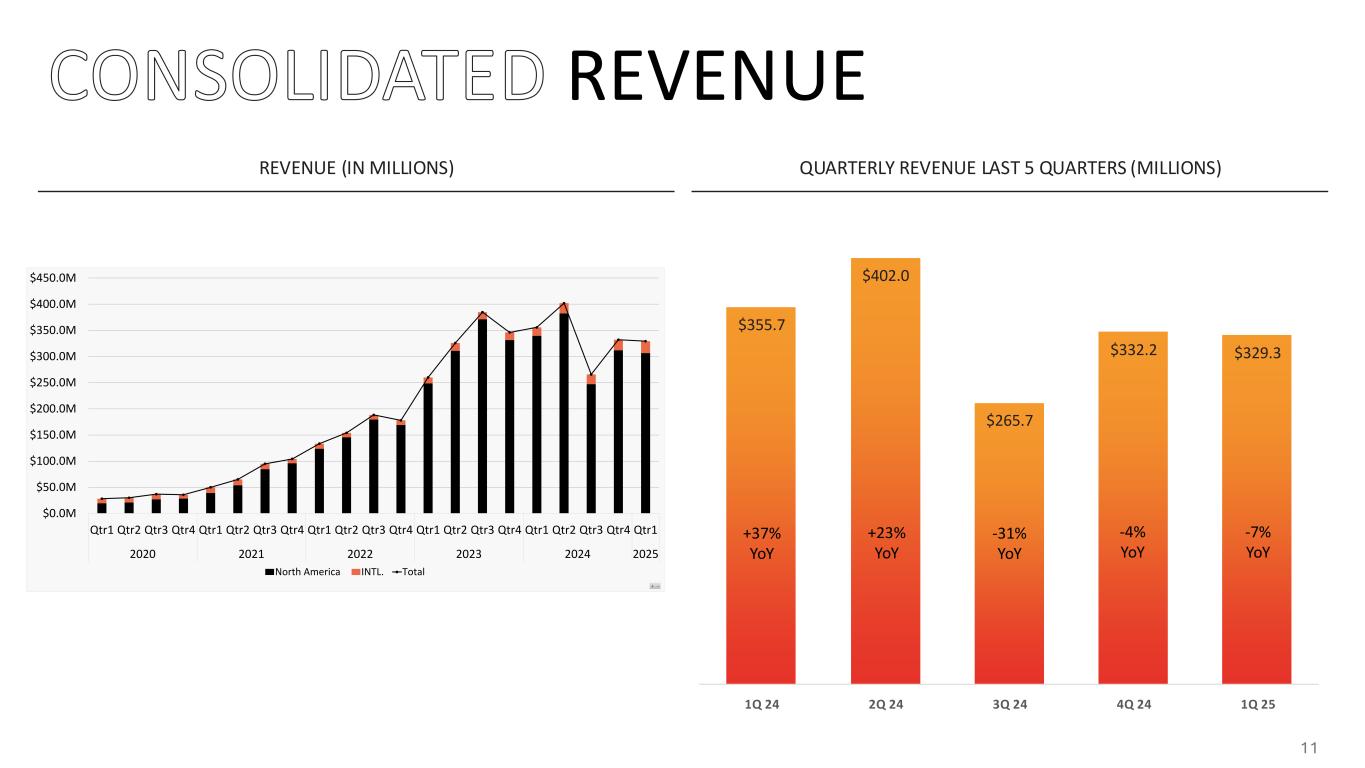
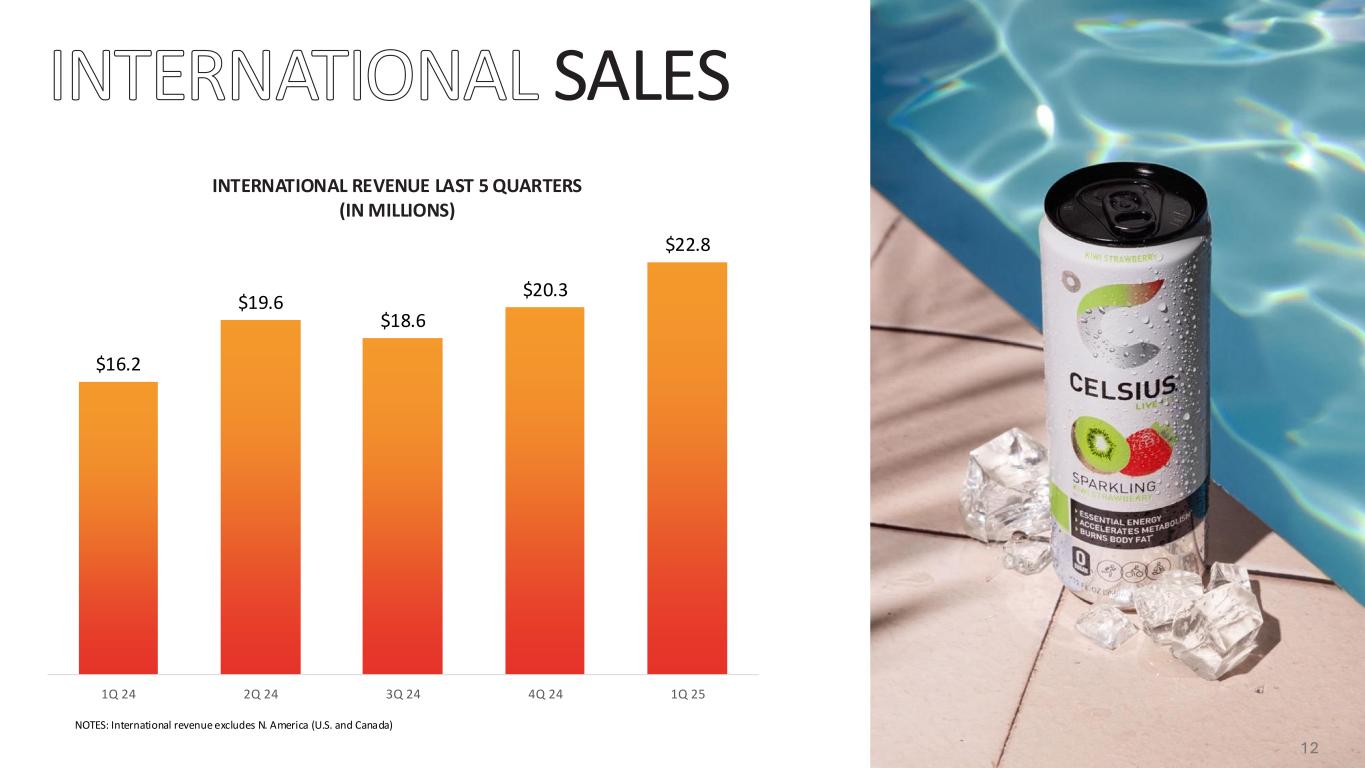
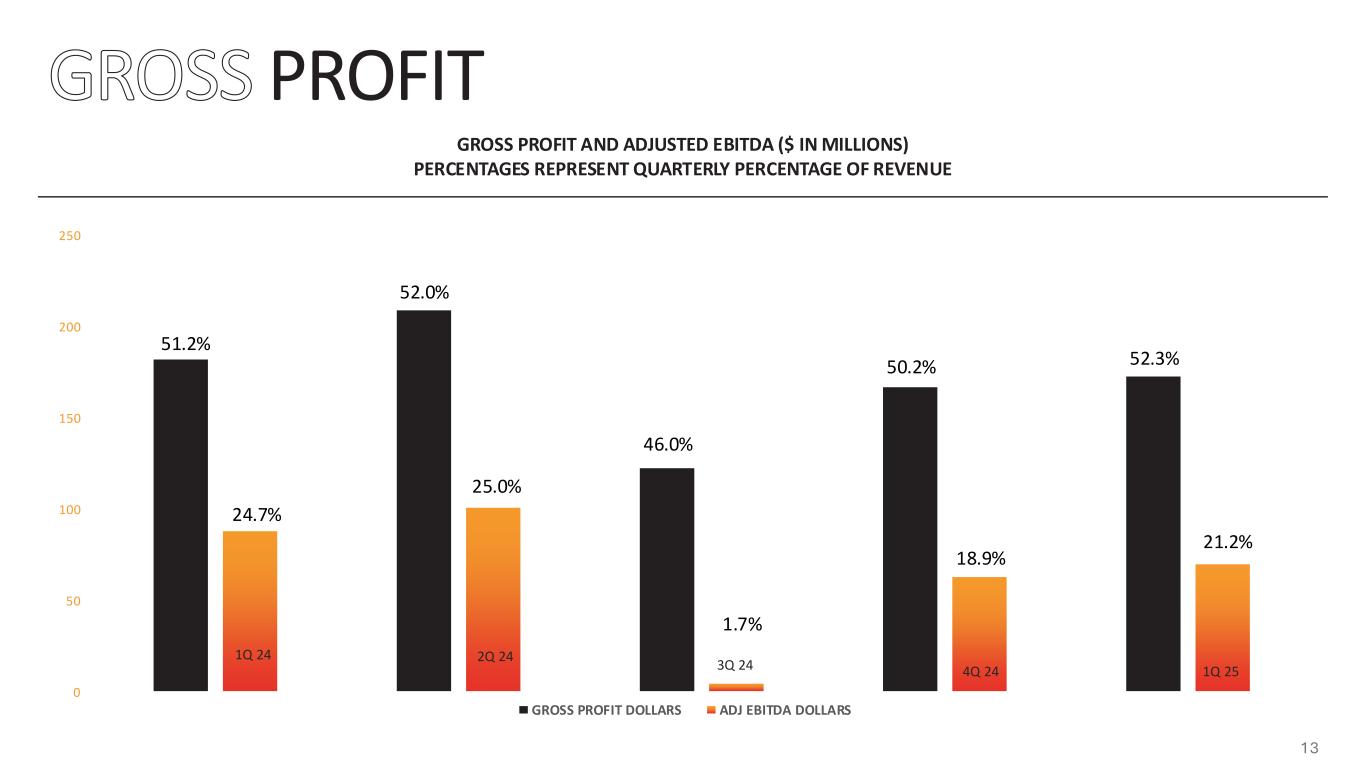
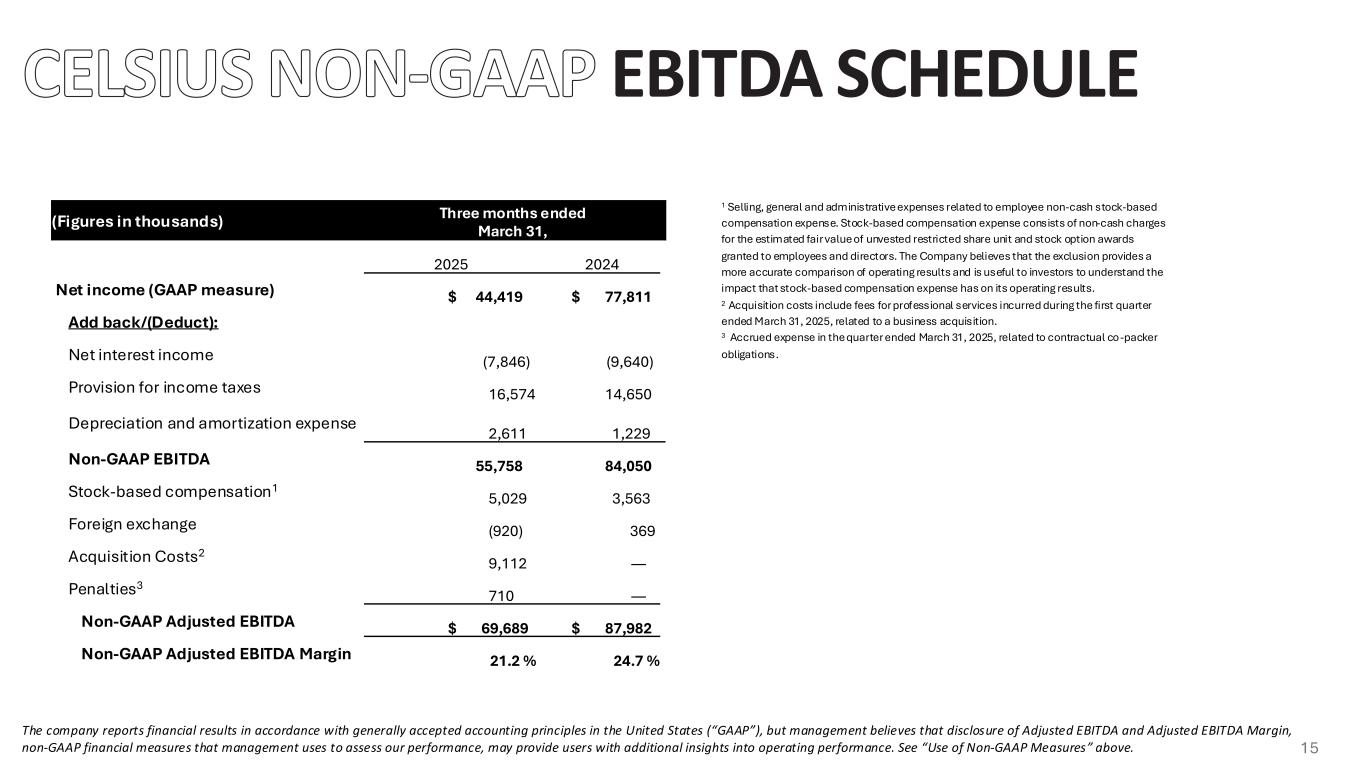
Good morning, everyone, and thank you for joining us today. Celsius navigated a dynamic operating environment in the first quarter while continuing to invest in our core brand, product innovation and operational scale. We saw business fundamentals strengthen through the quarter and are encouraged by the positive momentum heading into Q2. While the Alani new acquisition now closed continued gains in retail shelf space and strong international growth across both legacy and new markets, we are confident in our strategy and believe that we are well positioned to lead the modern energy category. Energy drinks are evolving, no longer just an impulse purchase. Functional modern energy is becoming part of consumers' daily routines, lifestyles, and pantry staples. Celsius is uniquely positioned to lead this evolution with a portfolio of leading brands built around fitness, functionality, and better-for-you energy. As previously announced, we successfully closed the acquisition of Alani Niu on April 1st, adding a second billion-dollar brand to Celsius Holdings' growing functional beverage platform. together we are well positioned to lead the modern energy revolution with great product innovation an excellent network of distributors and retail partners and the team to pull everything together celsius continues to pursue operational excellence to support this commitment we appointed eric hansen our first president and chief operating officer in march eric brings nearly three decades of food and beverage leadership experience, including senior roles at PepsiCo. We believe that his experience will help us drive operational excellence, scale, and unlock greater efficiencies in our partnership with Pepsi, our largest customer and North American distribution partner. Our big beverages facility, now fully integrated, provides us greater manufacturing flexibility, faster innovation cycles, and it can accommodate a second production line in the future within its current footprint as demand scale for Celsius products and portfolio. For the first quarter of 2025, revenue totaled $329.3 million, a 7% decline compared to the prior year quarter, reflecting three primary factors, slowed velocity in the first quarter, timing, and structure of our U.S. distributor incentive program and increased retail promotional programs. It's also important to remember that we were lapping a very strong first quarter in 2024 when we began nationwide distribution of Celsius essentials and had elevated dedicated retail promotion takeovers providing strong tailwinds. Adjusted EBITDA for the first quarter of 2025 was 69.7 million with a margin of 21.2 percent. Gross margin expanded 110 basis points to 52.3 percent supported by sourcing efficiencies for raw and packaging materials. International revenue grew 41 percent to 22.8 million demonstrating strong organic growth in our legacy markets as well as our newer expansion markets including the UK, Ireland, France, Australia, and New Zealand. As previously noted, we have a grounded approach to global expansion, but we are pleased to see the progress that has been made thus far and would look for this component of our business to pick up in the future years as we expand further within new markets and adding additional markets. In the U.S., track channels Celsius held a 10.9% dollar share for the 13 weeks ending March 30th, 2025, according to Shikana. We've held steady in category share, despite a challenging consumer environment, increased competition, and strong pricing action by other category players. Alani New retail sales increased 88% year-over-year, reaching a 5.3% share, up 221 basis points. Just last month, Alani New surpassed $1 billion and trailing 52-week retail sales. This extraordinary achievement reflects the strength of the brand's connection with consumers and the accelerating momentum in the better-for-you functional beverage space. Combined, the Celsius Holdings portfolio captured a 16.2% dollar share in the quarter ending March 30th, an 81 basis point increase year-over-year. Together, Celsius and Alani Niu accounted for approximately 20% of total energy drink category dollar growth in the first quarter of 2025, following a strong 50% contribution to total category growth in 2024. We are focused on strengthening our core Celsius brand, accelerating sales, increasing velocity, and growing our in-store presence with consumer-centric innovation and a new exciting marketing campaign that will begin this summer. As we look forward the second and third quarters this year, we expect to continue gaining incremental space at retail, helping to drive greater consumer awareness and flavor availability, including recent innovation like Celsius Playa Vibe, Retro Vibe, and Mango Lemonade. According to Sakana, our average items selling per store within the Celsius brand family increased by 4.1 items in Mulo Plus with convenience during the first quarter, with even greater gains in the food and chain convenience channels, underscoring the continued expansion of our in-store presence. This year's gains are particularly meaningful because they lapped the strongest shelf reset cycle in our company history, which were reported during our Q1-2024 earnings call. Dollar sales for sugar-free energy drinks surpassed full sugar varieties for the first time in 2024, and the incredible momentum of these better-for-you functional beverages changes drove 86% of category growth in Q1 2025. Celsius and Alani energy drinks and powders are 100% sugar-free, and we are leaders in this growing segment. Our live-fit identity, health-focused, aspirational, daily functionality deeply resonates with today's consumer. We believe that female consumers represent a large and underserved segment of the energy category, and Celsius is uniquely positioned here with a greater gender-balanced consumer base. The addition of Alani New, a brand beloved by women, strengthens this advantage even further. Innovation continues to fuel our overall growth. In Q1 2025, we launched a new core vibe and essential flavors, and we expanded our multi-pack offerings, which now represent approximately 28% and 55% of our retail sales mix in Mulo Plus Convenience and Mulo Plus. Further bolstering our place within the pantry and confirming that Celsius modern energy is going mainstream. Our launch of Celsius Hydration, a new line of zero-sugar, zero-caffeine electrolyte powder sticks, extends our brand into the fast-growing $1.4 billion hydration powder category. food service continues to be a strategic growth channel for celsius in q1 2025 we expanded into more than 1800 home depot locations increasing brand presence and everyday on-the-go consumption moments we also recently began rolling out celsius in 18 000 subway locations nationwide a significant win that enhances both distribution and visibility during meal occasions These new points of availability reflect our growing role in functional daily energy. Food service now represents approximately 13.4% of North America's sales through PepsiCo, and we see a compelling runway ahead as we deepen our presence across work, retail, and restaurant locations. Our marketing initiatives continue to drive awareness and trial. Highlights in Q1 include our NIL March Madness campaign with 136 athlete partnerships, the launch of Jaden Daniels as the first ambassador for Celsius hydration, a targeted activation with MLB star Juan Soto to promote Playa Vibe at Walmart, we are increasing our marketing investments behind our core Celsius brand and our LiveFit identity. These investments will support our strategy of reaching more people in more places more often. Beginning this summer, you will see bold, story-driven campaigns showing how Celsius helps people live fit, achieve their goals, and align with wellness-driven lifestyles. Overall, we are pleased with the improvements in business fundamentals we saw exiting the first quarter and the momentum we are building into the spring and summer seasons. We believe Celsius Holdings is uniquely positioned to lead the modern energy category with a portfolio of brands that addresses the growing consumer demand for functional, better-for-you beverages across energy, hydration, and wellness occasions.
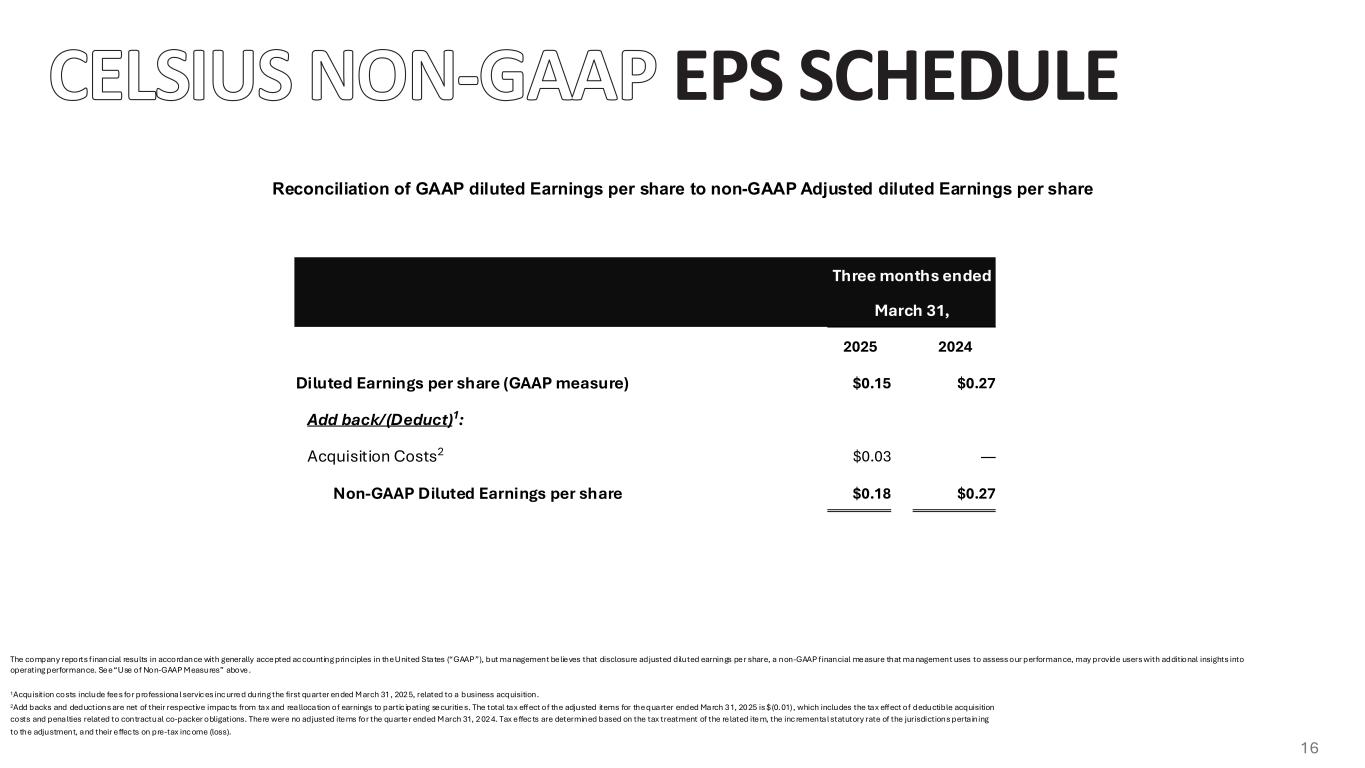
With innovation, operational leverage, international expansion, and strong retail partnerships, we are confident in our ability to drive sustained growth and value creation in 2025 and beyond thank you i'll now turn the call over to jared to review our financial results in more detail jared thank you john and good morning everyone first quarter revenue totaled 329.3 million dollars compared to 355.7 million dollars in the prior year period representing a seven percent decline as john noted revenue performance reflect soft Q1 velocity, the timing and structure of our main distribution partner incentive program, timing and breadth of our retail promotional allowances weighted later in the quarter, and lapping the nationwide launch of Celsius Essentials in Q1 2024. Gross profit totaled $172.4 million compared to $182.2 million in the prior year period. The year-over-year gross margin expansion of 110 basis points to 52.3 percent was supported by sourcing efficiencies for raw and packaged materials. We are pleased with the continued expansion in gross margin even as we invest in growth and support our innovation. Selling general and administrative expenses totaled $120.3 million, compared to $99 million in the prior year. The increase reflects transaction-related expenses for the Awani new acquisition, along with continued investment in global sales, marketing, and organizational infrastructure. Non-GAAP adjusted EBITDA was $69.7 million for the quarter, representing a 21.2% margin compared to $88 million and 24.7% margin in Q1 2024, driven by the organizational investments. Net income attributable to common shareholders was $34.4 million, or $0.15 per diluted share. Non-GAAP adjusted diluted EPS was $0.18 compared to $0.27 in the prior year period. As of March 31, 2025, our balance sheet remained strong with $977 million in cash and no outstanding debt. It is important to note that these figures reflect our cash position prior to the close of the Alani new acquisition. In connection with the closing on April 1, we utilized a mixture of $900 million dollars in debt approximately 400 million dollars in cash with the remainder in stock to acquire alani new which will be reflected in the q2 financial statements we remain confident in our liquidity position and our ability to support future growth initiatives innovation continues to support growth and momentum across our retail channels recent innovation including the essentials line and multi-packs are contributing meaningfully to retail sales and celsius hydration launched late in January, is gaining early traction as we expand into the high-growth hydration powder segment. We believe that our distribution gains across the portfolio, positive spring shelf resets, and expanded fill sales and merchandising execution continue to position as well for the important summer selling season. Looking ahead, our focus remains on improving velocity, expanding household penetration, growing share across functional beverage occasions, and delivering operational efficiency through scale. We remain confident in our strategy and our ability to remain resilient through the uncertain economic times thanks to our robust supply chain operations as well as mitigation strategies which we are pursuing to best position us for long-term advantage. Before I turn it back over to the operator for questions, I want to mention that we are planning a public call this quarter to discuss modeling and general financial considerations for Alani Nu. Details will be communicated in advance. As a part of this call, we will put together pro-former reviews of our combined business and provide further insight around the purchase accounting impacts of the acquisition, such as inventory step-up and how that will impact Q2 as we sell through the inventory on hand at April 1st on the acquisition date, as well as valuations around intangibles and fixed assets, which will result in increased depreciation and amortization. With that, I'll turn the call back to the operator to open the line for questions. Thank you.
Operator
We are now opening the floor for question and answer session. If you'd like to ask a question, please press star followed by one on your telephone keypad. That's star followed by one on your telephone keypad. Please limit your question to one question only. Thank you. Your first question comes from the line of Kamil Gajrawala of Jefferies. Your line is now open.
Hey, guys. Good morning. Can you maybe – we're seeing energy drinks as a category accelerate at a time where almost everything else in CPG seems to be going the other way. And I'm just curious if you've dug into that or maybe just some details on what might be behind it.
Yeah, morning. Well, this is – you're seeing a lot of – the first quarter was really good for the energy category. And, you know, even going into last year, still driving volume in dollars. So, you know, the energy category has been kind of resilient on both dollar and volumes over the last several years. I know we had pressure in Q3 and Q4, but Q1 was very strong, starting to see growth rates come back. I think you're also, you know, these health and wellness trends and the amount of innovation we saw in the quarter coming from a variety of competition, I think drove a lot of excitement for consumers to try. And that's where you're seeing some of these results here.
Okay, got it. And then you mentioned many times in your prepared remarks on, you know, this focus on velocity. What specifically are you doing to increase those figures?
Well, when you look at, you know, when you look at the first quarter, we got off to a slow start. And, you know, we have more of a balanced approach this year. We took some key learnings last year. We were cycling a lot of innovation in the first quarter. If you look at their Q1 2024, we had probably the largest. We did have the largest distribution gains as well as innovation launching and great support and promo activity as well with those some of those lead launches. So we're cycling that. And we're a little bit softer in the back half of the year in 2024. and so this year changing some of those strategies and key learnings putting us into a more of a balanced approach and then we're really leaning in we're building programs around live fit i've been doing a lot of research around uh the dna of the brand and how we can resonate uh and bring more more consumers into the category and really be a driver and continue to be a driver in the growing segment of sugar free got it thank you thank you thank you again kindly limit your questions to one question only.
Operator
Thank you. Your next question comes from the line of Peter Grum of UBS. Your line is now open.
Thank you, operator. Good morning, everyone. So, I just wanted to, you know, get some perspective on the first quarter sales performance. I think, you know, John, in the release, you mentioned sales growth of retail, sales growth of 2%, but can you maybe just bridge us to kind of the high single digit decline in North America. I know you mentioned, you know, some promotional allowances, you know, tough comps with essentials, but it just seems like there's, you know, maybe another component that we need to kind of get or bridge to get to that, you know, decline in North America. So just if we can maybe walk through that or if you can quantify, you know, what those impacts were. And then I guess what I'm really trying to get at is, is there a way to kind of parse out what kind of the underlying shit trends or depletion trends were in the quarter after backing out all the noise?
Thanks. Yeah, no, Peter, like we said, there was, you know, we had a slow start to the quarter. It was increased competition. We started to see velocities and improvement as we're exiting Q1. So we're very optimistic as we continue to move through and enter Q2. Um, you know, we, when you look at some of the, some of the launches we had last year, some of the key retailers, um, they were substantial, um, versus this year, uh, you're looking at more of a balanced approach with some of the promotional activities versus retailers leaning in on one specific brand. So we were impacted by that. Um, and then, you know, when you look at, um, some of the promotional activities, you're also cycling some of the, um, you know, the additional incentive, uh, for our distribution partner. And we were looking at the inventory levels. I'll throw that over to Jared to comment on some of the supply chain and inventory levels and kind of what we're seeing there.
Yeah, so I mean, at the 10,000-foot view or the simple view, if you look at the scanner data, we were kind of at minus four. And then we ended from our books and records at minus seven. You've got a couple points in there from the promos and incentives. And then you've got a little bit of timing, not on the DSD, but more non-DSD, where we saw a little bit of pipe filling in the back half of the year versus having the programs run in Q1. So within some of those categories, you saw good growth at the scanner, but we did have a little bit of a load in in Q4. And then there was some noise at the very end of the quarter. When it comes to depletions with our primary distribution network from across the COBOS and FOBOS, that optimization appears to be in good shape and didn't cause much noise in this quarter from what we can see.
Got it. Thanks so much. I'll pass it on.
Operator
Your next question comes from the line of Kevin Grundy of BNP Paribas. Your line is now open.
Hey, good morning, everyone. John, I was hoping you could comment on pricing in the category. I think there's been a good amount of enthusiasm around the pricing that Monster has led on 75 percent of the portfolio. I think there's an expectational price on the balance of it, but it seems like kind of a mixed picture where Red Bull really hasn't followed in the past. that's led to some trepidation among investors, whether they will or not. Can you just comment broadly on pricing in the category, maybe, and what your plan is for the balance of the year, both from a pricing and promotion perspective? That would be appreciated. Thank you very much. Yeah, Kevin, sure.
You know, pricing, there's opportunities, and there's opportunistic opportunities to take additional pricing. We feel very confident in our brands. We want to be very cautious as well, keeping a close eye on the consumer. There is you're seeing consumers some move from purchasing singles to purchasing at larger format with multipacks and looking for promos. So we are somewhat cautious as we move through the next several months and quarters about promotional activity. We want to be very, very aware of that and pay attention very closely to how the consumer is purchasing and their purchasing habits. I will say we did take pricing in Q4 last year, so that has been rolling through, and there's opportunities and opportunistic ways to leverage that as we're going through, we will. It does allow us to have additional flexibility with promotional activities as we're entering into somewhat uncertainty, we feel, with the consumer and some of the channels that we're operating in.
I'll pass it on. your next question comes from the line of john anderson of william blair your line is now open hey good morning thanks for the question um i was wondering if you could put a little bit more uh color around the shelf space uh expansion you expect this spring um obviously you had a terrific uh kind of shelf reset um last year and could you talk a little bit about trying to dimensionalize it both for the core brand Celsius, but also your expectations for kind of a Lonnie New and how you may, you know, kind of activate the consumer around those gains this spring relative to kind of last year? Thanks.
Yeah, John, great question. You know, right now we do have, as mentioned in the prepared remarks, we have some great innovation that we'll be rolling out, and that is our Playa Vibe, our Retro Vibe, and Mango Lemonade for summer. So we expect that to gain additional placements. You know, it's really also these secondary placements and display activities has been a really key for us. So as an example, gaining additional checkout coolers has been some really big wins that have been flowing through in some retailers, large national retailers, which we're really excited about. So making sure we have closer availability, closer to that checkout, so we can take advantage of those purchase, that app purchase, impulse purchase, purchase occasion. So that is really, was really promising this year, the amount of cold placement we gained at checkout. So as that continues to fill out, that'll provide additional velocity improvements as well, having that availability. Looking at Alani, I'm really excited about Alani. I think there's a lot of opportunities there, especially working closely with our key accounts team and as we position and really get ready for buyer meetings and 2026 you know key account meetings it's going to be really exciting especially the momentum that they've they've had you know entering summer and going to be exiting summer they just broke a billion dollars in retail sales which is just an amazing achievement it's a great brand that's resonating with an extremely loyal female consumer base and we're extremely optimistic about the distribution games we'll be able to gain with the alani portfolio thank you
your next question comes from the line of andrea trixierra of jp morgan your line is now open uh thank you operating good morning everyone so john i understand the new um on-premise and other channels like the home centers but conversely you had a steep decline at Costco did you lose distribution there or is with that any this talking that you'd highlight and I understand your base period was also down in the end a clarification for Jared on how much sales were down in North America if you exclude the change in allowances year over year understand that you've been telling us um that these allowances would increase so then if we can do like a apples to apples or
underlying uh growth that would be super helpful and if i can layer that as well on the uh on the the stocking uh impacts that you might see related and trying to calculate the stocking uh vis-a-vis your sellouts okay excellent um balances to stocking and costco well i just when peter was on i just mentioned if you look at kind of we were down roughly four percent at the scanner data a couple points to in versus our minus seven a couple points to get to that minus seven was related to promos and incentives when we're looking at costco if you're looking at the scanner data it was up um we did run an mvm this quarter when you run those typically you get a little bit of a pipe fill the quarter before the month before so that caused some of the noise within the system uh if you look at um i'll throw something out there just in case it comes up but if you look at kind of our revenue as a percentage of sales and our ar as a percentage of sales There's a little nuance within Costco as well. That's just timing of payments, more of a working capital component. So no issues there. What was the?
Talked about allowances with promos, talked about Costco, talked about timing.
Not only at Costco, but in general, yeah, sorry to interrupt, but just in general, the allowance is total against, because it's hard to calculate the allowances over a year. I mean, it's not disclosed, so we wanted to just get clarity on those.
Well, for this quarter we talked, we said it was a couple percentage points.
Yeah, and on a sequential basis, though, I mean, I understand, and probably it would be helpful for all of us to understand how the allowances will face in. I understand this is going to be with us for the next, at minimum, and the next three quarters. Is that fair?
So I hear what you're saying. And so if we look out over the remainder of the year, you probably got a couple points of pressure in Q1 and Q2. And then it should flip in Q3 and Q4 where we'll benefit by a couple points because we saw it go up a bit with some of the de-stocking last year. So first half of the year, you'll see a little bit of pressure from that. Back half of the year, when we're looking at year over year, you'll see benefit. it right and then and then on the um on the couple of points of this stalking can you help us like kind of understand the phasing of it as well is that a similar uh impact so uh there wasn't de-stocking so um if you're looking year over year and we're talking just promos and incentives we talked about a couple points this quarter a couple points next quarter flipping to positive couple points in Q3 and Q4. If you're looking at destocking, when we talked about depletions within our DSD network, we said that it was pretty stable this quarter and ended up pretty stable as we ended the prior year as well. There was some timing and sequencing of non-DSD around club in Q4 into Q1 and a little bit of noise at the very end of our quarter, but nothing and nothing else to call out from that perspective.
And I'll just add, even with the percentage, you know, the allowances there, we were able to mitigate some of those allowances with a strong gross profit number for the quarter, which really flowed through to EPS or EBITDA as well.
Operator
Your next question comes from the line of Michael Lavery of Piper Sandler. Your line is now open.
Thanks. Just one for me. I wanted to come back to gross margins. Even with some of the increased incentives and allowances, gross margins were very strong. You called out some better sourcing efficiencies. Any other color you can add or, you know, especially just help us understand how sustainable that might be?
Should we have any watchouts looking a little further ahead from aluminum or, you know, just a little help on kind of what drove the lift and and where it might go from here yeah so in the near term of the short term um we're in in great shape as you saw with the the margin profile um we as we have scaled and created our orbit model uh and utilized our organizational structure we've been able to benefit um from a gross profit perspective the aluminum knock on would right now is not something that we see being significantly impactful to us. Unfortunately, we don't know where things will go with the tariffs and how those things are going to come into play long term. But in the short term, looking out at Q2, we see still strong gross profit numbers. I think we kind of pegged 50% for the year. We're not going to move off of that at the moment. But really, as we look to the back half of the year, it's kind of an unknown in terms of what's going to happen from an inflation perspective or a tariff perspective. As we look at Q2, we're in good shape. Our structure's set up well. Our scale has benefited us. And the orbit model and infrastructure that our supply chain team is set up is really coming through. And it's set up as a long-term program to be sustainable.
Operator
Your next question comes from the line of Jim Solera of Stephens.
Your line's now open. hey guys good morning thanks for taking our question uh i wanted to ask about um is there any formats or retailers where alani new actually performs better than the core celsius brand and if so you know how should we think about kind of utilizing the brands to maybe cross-pollinate each other and and help get placement in retailers where one is stronger than the other yeah jim you know we see great opportunities with both of our brands in the portfolio actually all three when you look at celsius essentials has uh performed well a lot of opportunities as we continue to scale that as as well as uh our core celsius and then alani specific locations um you
know i think we need to really get that in further into the system really work on further pricing promotional activities um you know it's just entering convenience um you have uh there's a huge opportunity with Alani as we integrated further within our Amazon teams, and also restaurants and food service, college and universities, and opportunities we're working on right now through our distribution partners is further expanding within on-premise. So, you know, a lot of opportunities there with both these portfolios. They have different consumer segments. We've talked about, you know, cannibalization. There's been a lot of big question prior. The cannibalization has been somewhat minimal. According to our data from Surcona, it's about a 15% crossover. And some of both these portfolios over-index with some of the other leading brands that are out there within the category. So this portfolio is going to give us a really strong position to continue to drive growth in the category for years to come and leverage the tailwinds of health and wellness also more female consumers coming are expected to come into the category uh than ever before if you go over the last uh decades so um we're really excited about uh our what are being well positioned for the future can we get an update on uh branded cooler placements and maybe thinking through the comment you just made about limited cannibalization is there an opportunity to have you know co-branded or cross-branded coolers that have both Alani and Celsius that would obviously be very visible in store and minimal on the
Yeah, I mean, you're seeing that now in locations, a lot of grocery stores. I mean, we're all energy is kept in energy sets and energy coolers. So, you know, it is a lot of times Celsius and Alani are placed right next to each other, right next to Red Bull and Monster. So that is something standard in the industry. And the cooler placements, that's a huge focus for us. Gaining additional cooler placements is a big push, big KPI for our sales team. We're placing dedicated coolers. And, you know, as we're rolling in and partnering further and integrating Alani, we will be looking for, you know, we're evaluating co-branded coolers and or dedicated coolers based on the retailer's footprint and space availability. A lot of small format stores aren't able to take multiple coolers. We'll work on a co-branded cooler. That's something that's in the works. And then also more space and availability and opportunities to place dedicated coolers. That's always our priority number one.
Operator
Your next question comes from the line of Gerald Pascarelli of Needham and Company. Your line is now open.
Great. Thanks very much. Um, just a question on your, on your core portfolio. So as we look ahead on a standalone basis, it's just, it seems like you have a lot of tailwinds on the horizon. You have the new innovation, 15 to 20% shelf reset wins, easier comps and new marketing campaign, et cetera.
So John, like taking all of those, those tailwinds, can you maybe just provide some color or talk about your level of conviction or confidence, um, that we start to see core revenue trends improve from here uh any color there would be great thank you yeah gerald i mean you're spot on i mean the tailwinds look really favorable um especially after we get through really the next three to really the four to five weeks um it's kind of the peak uh revenue hurdles um that you're seeing in a week over week basis uh or versus the prior year um once we get into really june you'll start to see some much easier comps um that will have to that will celsius will be recycling, and the improvement in velocity that we've been seeing also is giving us strong conviction as we continue to build upon the consumer health and wellness trends that are out there. The category has come back to really strong growth. We know we have both our brands and our portfolio of really strong brand positions that are aligned with consumers. Fundamentals are improving. Look at gross profit improvements, the acquisition of big beverage, the leverage of our infrastructure, as Jared talked about with the Orbit model, driving efficiencies with both these brands coming together and leveraging a strength of a portfolio versus going singularly into the category. Now we'll be able to do a variety of additional pricing promotional strategies that we weren't able to do prior. And we're really excited on where we're headed. And the core fundamentals of our core portfolio, Celsius, you're right, Jared, it does have a lot of tailwinds as we're entering, you know, summer and the back half of this year.
Operator
Your next question comes from the line of Sean McGowan of Roth Capital Partners. Your line is now open.
Thank you. I was hoping you could talk a little bit about international, you know, how is that market by market going relative to your expectations? It seemed like that was pretty strong in the quarter.
Yeah, international, you know, we've always been very cautious, cautiously optimistic. It's all about timing and sequencing and really following our strict strategic approach on entering new markets. And the international expansion in these new markets has been, you know, well-received, better than initially expected. Also, you know, entering new markets, you need to be very cautious. It's difficult. It's highly competitive, as we all know. But the acceptance has been well-received. Australia, New Zealand, we launched with specific key retailers. you know, the new consumers coming into the category, additional share from other players within the category was really great to see. So we're rolling out a variety of other retailers. International will be a growth area for us. There'll be additional markets and opportunities as we go through 2026 and 27 and beyond. Right now in 2025, we're very much focused on these core markets that we've launched last year in Q4 and continuing to roll that out and build upon and drive a loyal consumer base. Our goal is to drive daily consumption and the same health and wellness trends we're seeing in North America. These are global trends. And the world right now is one click away within our social media and influencers. And a lot of the campaigns we're running, we're getting much broader reach as the world has gotten extremely small. So really excited about the future that we see on our international expansions and opportunities. Thank you very much, John.
Operator
Your next question comes from the line of Steve Powers of Deutsche Bank. Your line is now open.
Hey, thanks very much. Good morning. Jared, I wanted to go back to the gross margin, gross profit, if I could, because I appreciate the prudence and just the allowances for the unknown going forward in this environment. But I guess, are there any kind of known headwinds that you would call out in terms of reasons for sequential moderation and the gross margin from where we saw in Q1 land? I think the 50% number you called out for the year was a base business number. And I'm sure we'll hear more on the Alani New modeling call later in the quarter. But but any any considerations there as we think about how that layers in from a gross profit perspective, that'd be helpful to you. Thank you.
Yeah, thanks for clarifying that. You're right. That was the Celsius core business margin that I was referring to. We'll we'll do a call later in the month or early June to call out kind of what the impacts will be with the Alani getting rolled into from a consolidation perspective. there will be some noise around the inventory step up for the quarter as we turn through the inventory that existed at 401 when we acquired the business. That's really just a purchase accounting issue more than anything. In terms of the core business, I think we're, like we said, we're comfortable with kind of where we are for the quarter. Q3 and Q4 is a little harder to tell, a little harder to draw a line in the sand on that one because there's still a lot of activity going on. There could be opportunities for improvement or could be opportunities for further pressure. I think the structure we have set up today is good. It's a good, robust supply chain. But again, if different things that the government does are going to impact that, we'll come out and let you know. I think that's all we're going to say at the moment when it comes to alani i think i said back on the 220 call that they um they're about 18 to 24 months behind us in terms of our p l profile you know put the inventory step up aside so they would be kind of where their structure would be it would be kind of mid 40s or probably low end of mid 40s that will work up to get to the same profile as us from the gross profit perspective and then we'll get more into the nitty-gritty when we have the the modeling call and show some pro forma views around 2024 and go forward.
Operator
I'd now like to hand the call back over to Chairman and CEO, John Fieldby. Please go ahead.
Thank you again for joining us today. We're proud of the continued progress we've made and energized by the opportunities ahead. With strong brands, focused strategy, and growing global momentum, we believe Celsius Holdings is well positioned to lead the next phase of growth in the modern energy category. I also want to thank our employees and partners around the world for their dedication and commitment. Their efforts continue to power our success. We appreciate your continued support and look forward to updating you again next quarter. Grab a Celsius and live fit.
Operator
Thank you for attending today's call. You may now disconnect.