Operator
Ladies and gentlemen, thank you for standing by, and welcome to the Clarivate Plc Q1 2026 Earnings Conference Call. All lines have been placed on mute to prevent any background noise. After the speakers' remarks, there will be a question and answer session. If you would like to ask a question, press star followed by the number one on your telephone keypad. If you would like to withdraw your question, press star then the number one. I will now hand today's call over to Mark J. Donohue to begin today's conference. Please go ahead, sir.
Speaker 1
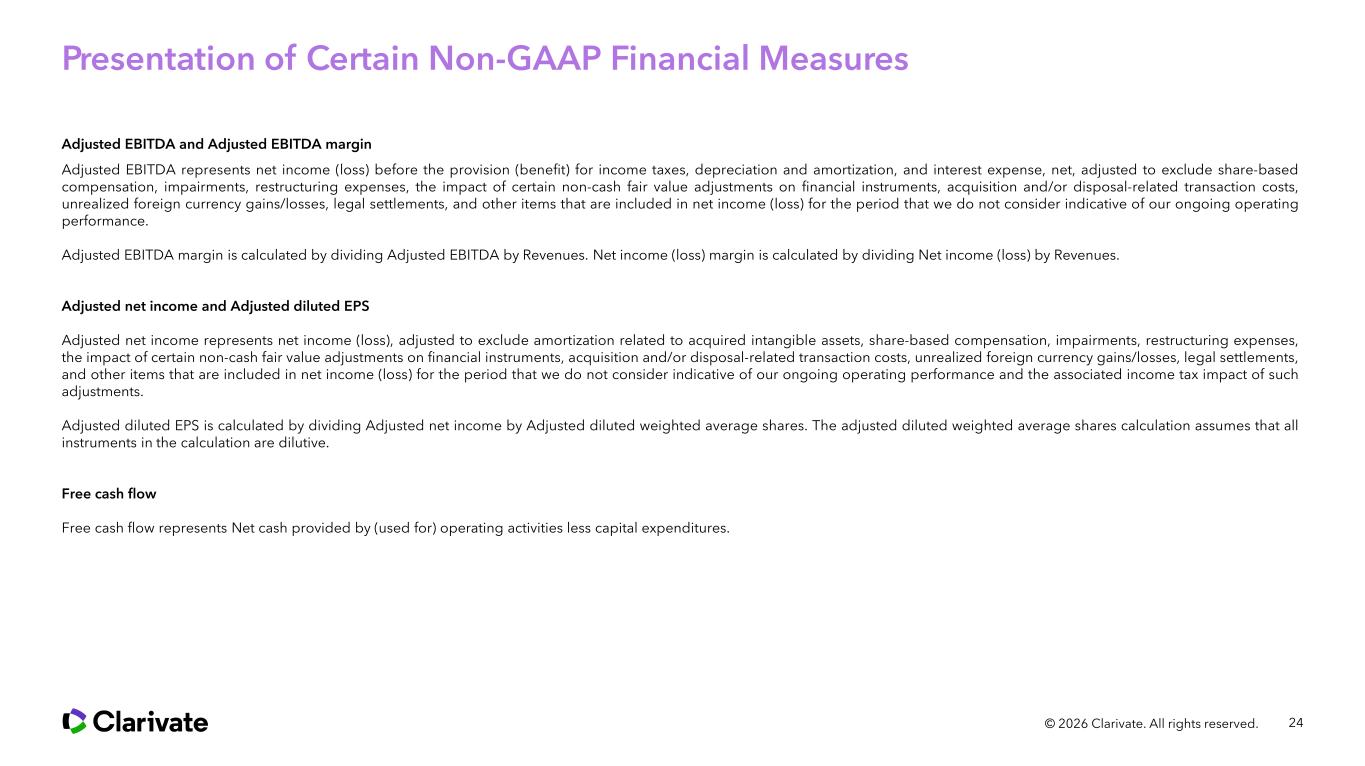
Thank you, and good morning, everyone. Thank you for joining us for the Clarivate Plc first quarter 2026 earnings conference call. As a reminder, this conference call is being recorded and webcast and is the copyrighted property of Clarivate Plc. Any rebroadcast of this information in whole or in part without prior written consent of Clarivate Plc is prohibited. The accompanying earnings call presentation is available on the Investor Relations section of the company's website. During our call, we will make certain forward-looking statements within the meaning of the applicable securities laws. Such forward-looking statements involve known and unknown risks, uncertainties, and other factors that may cause the actual results, performance, or achievements of the business or developments in Clarivate Plc’s industry to differ materially from the anticipated results, performance, achievements, or developments expressed or implied by such forward-looking statements. Information about the factors that cause actual results to differ materially from anticipated results or performance can be found in Clarivate Plc’s filings with the SEC and on the company's website. Our discussion will include non-GAAP measures or adjusted numbers. Clarivate Plc believes non-GAAP results are useful in order to enhance understanding of our ongoing operating performance, but they are a supplement to and should not be considered in isolation from or as a substitute for GAAP financial measures. Reconciliations of these measures to GAAP measures are available in our earnings release and supplemental presentation on our website. With me today are Matitiahu Shem Tov, Chief Executive Officer, and Jonathan M. Collins, Chief Financial Officer. After our prepared remarks, we will open up the call to your questions. With that, it is a pleasure to turn the call over to Matitiahu Shem Tov. Good morning, and thank you for joining us.
Speaker 2
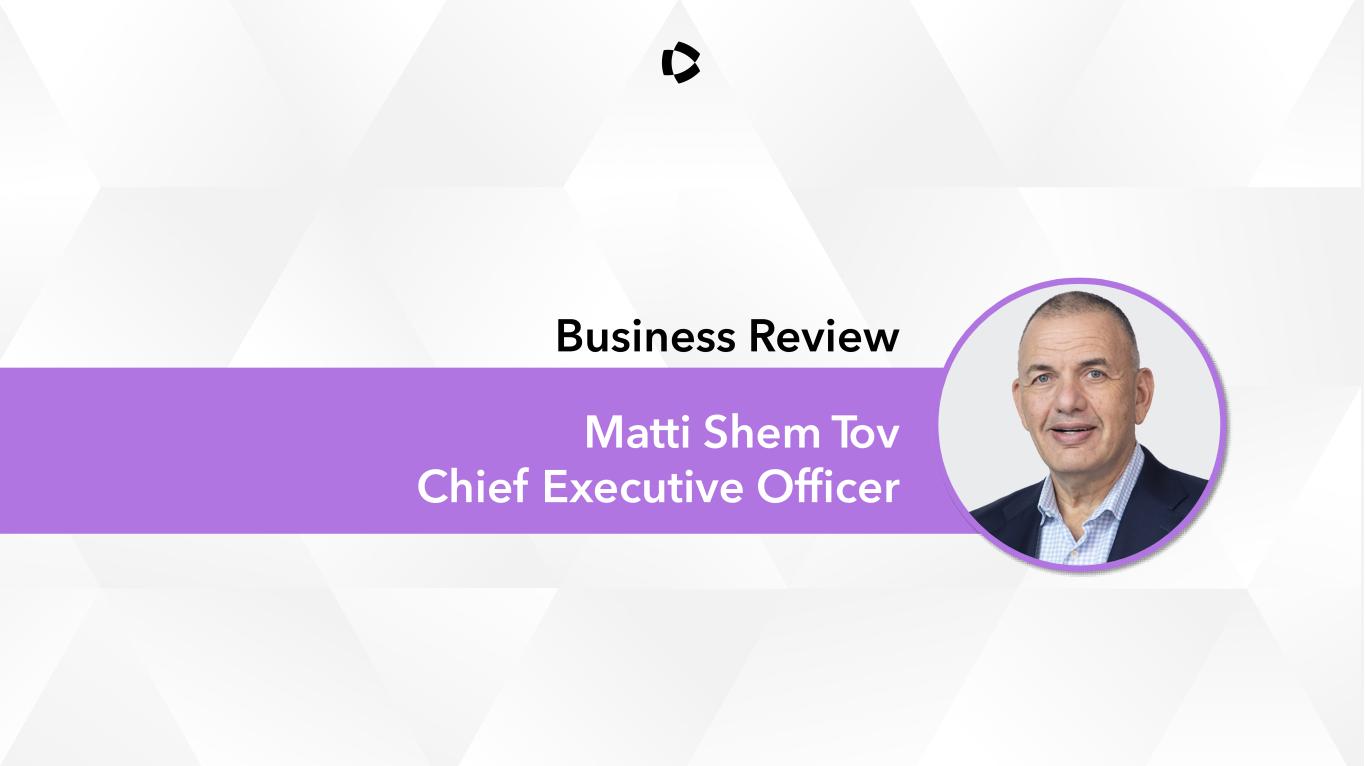
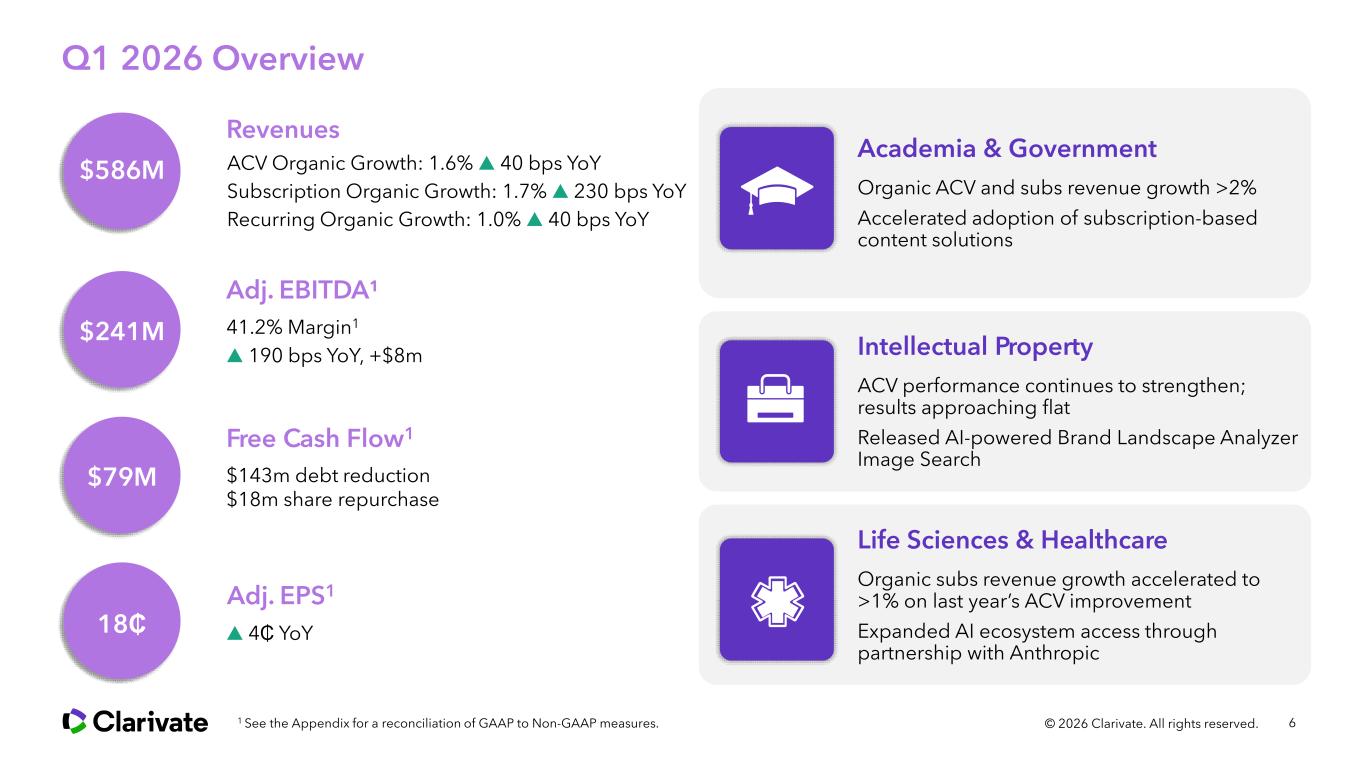
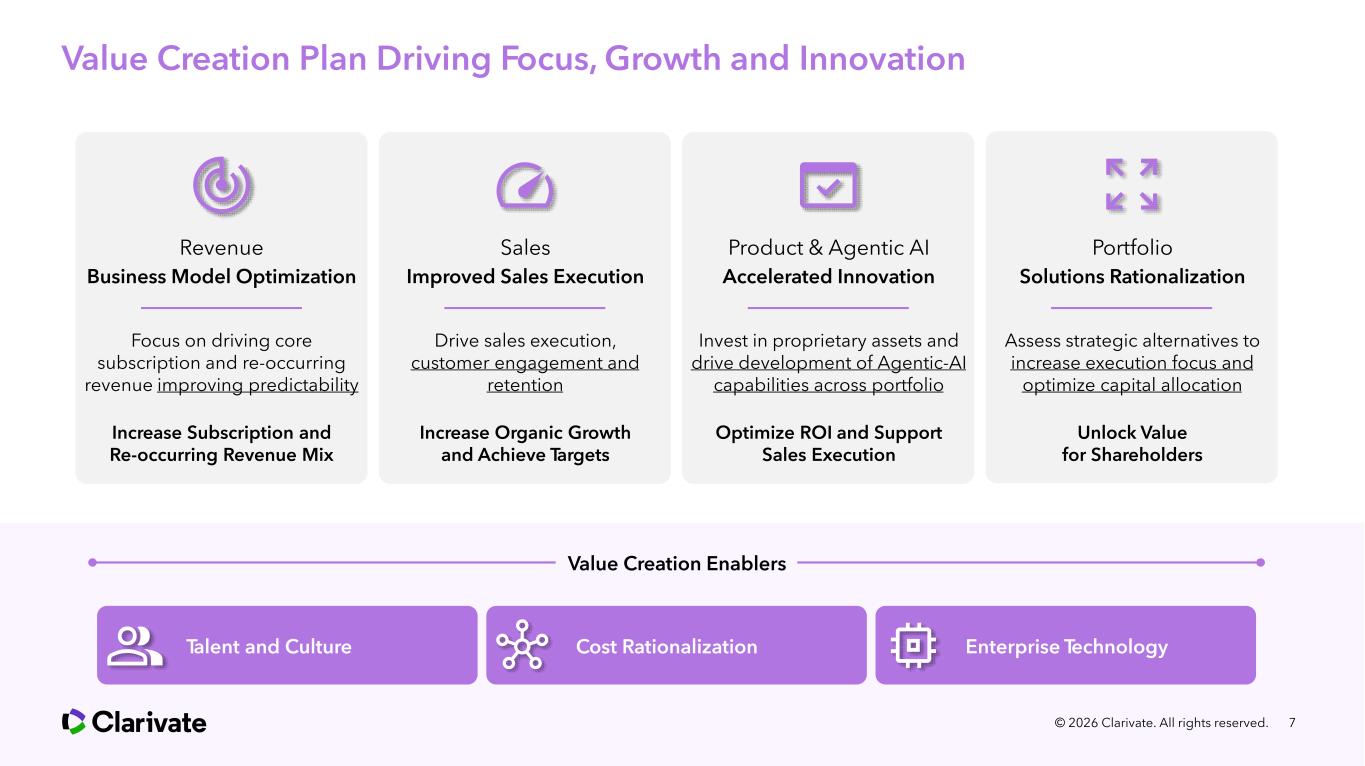
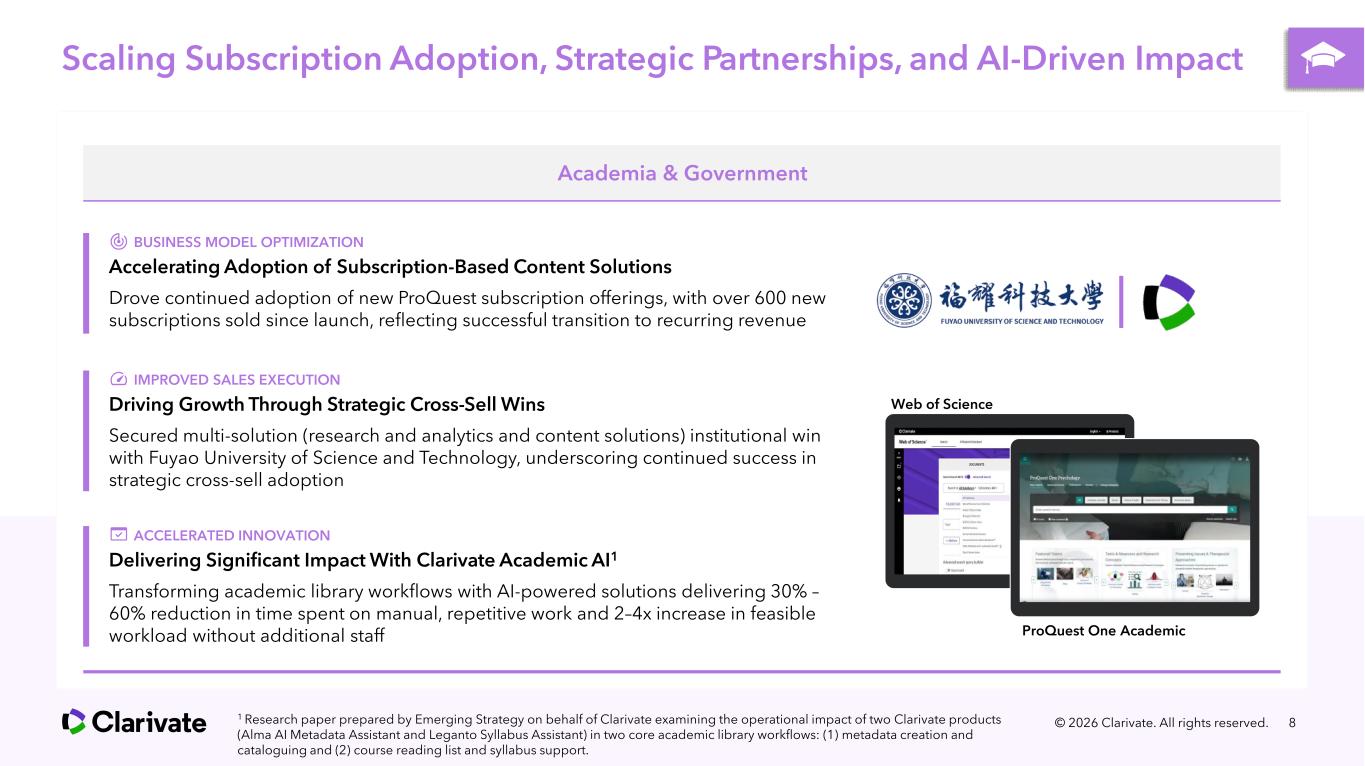
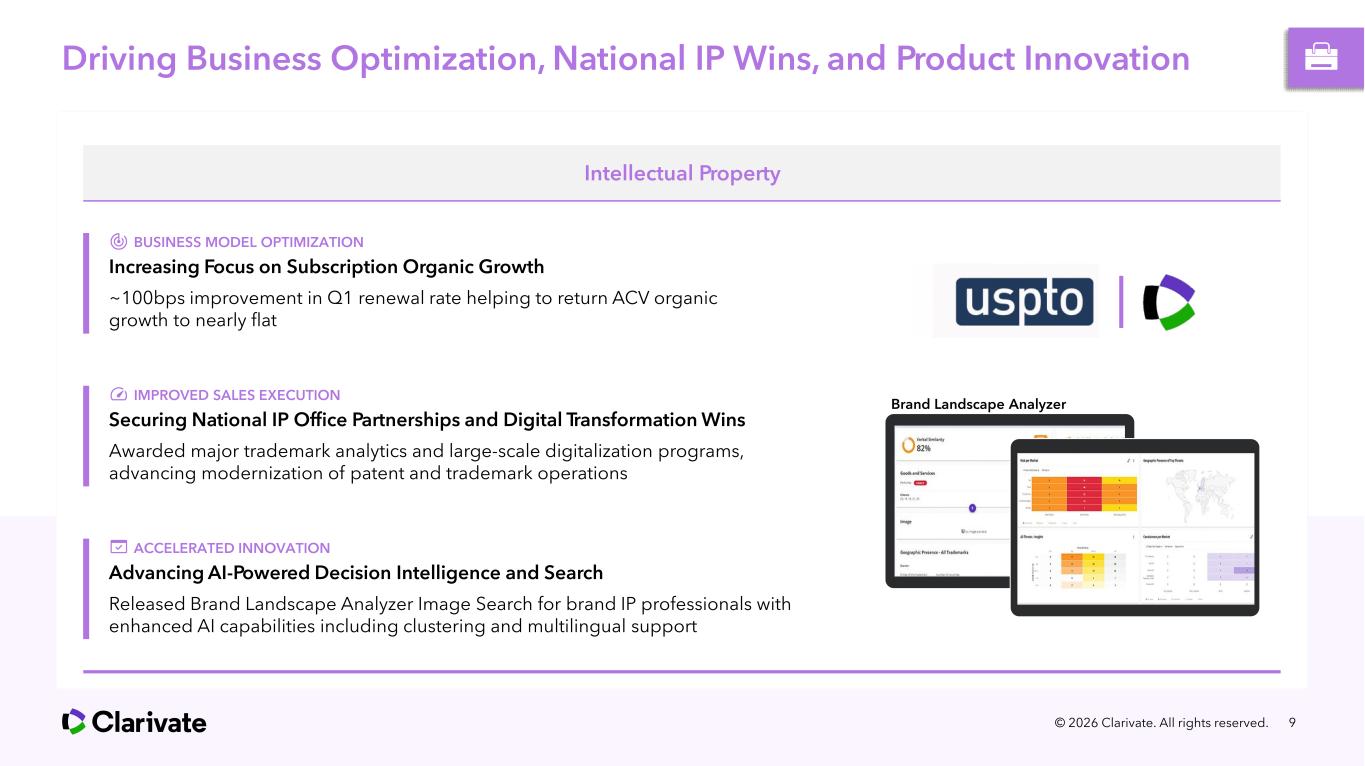
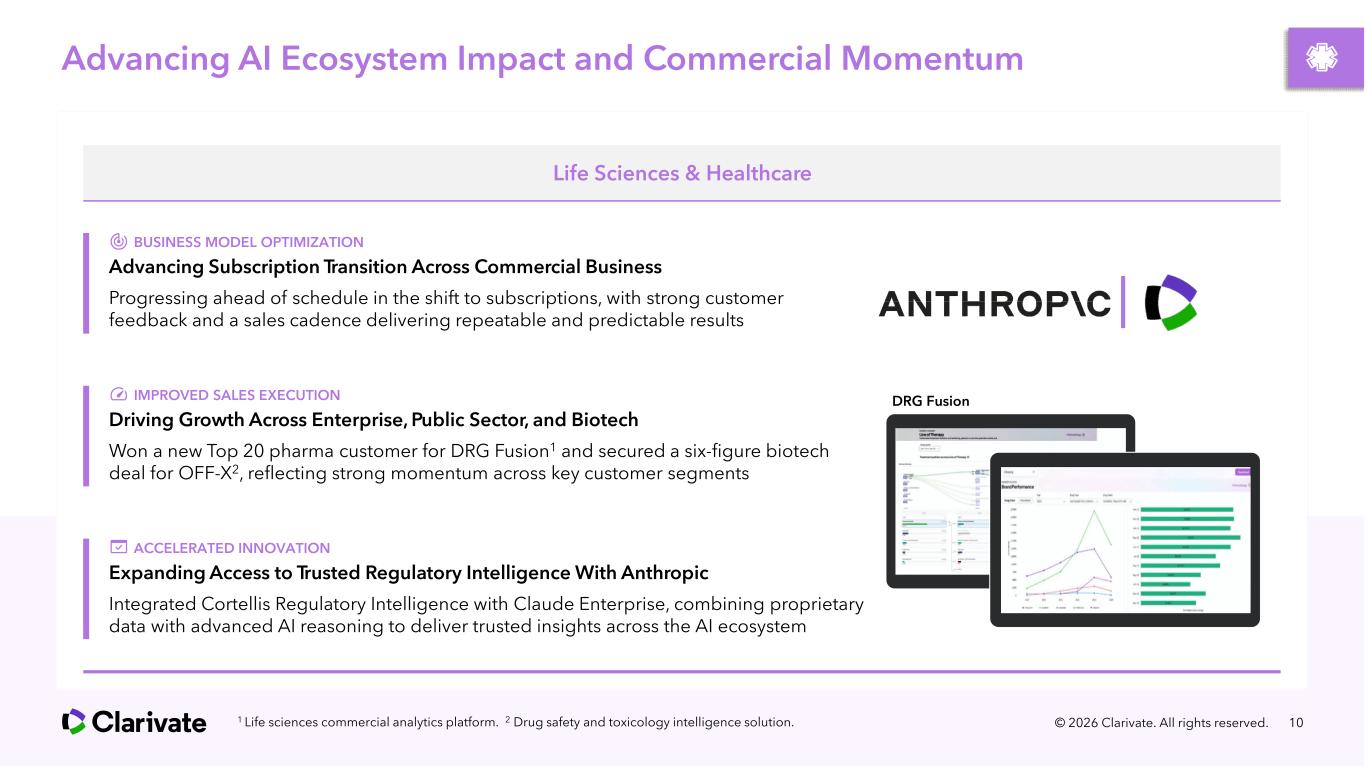
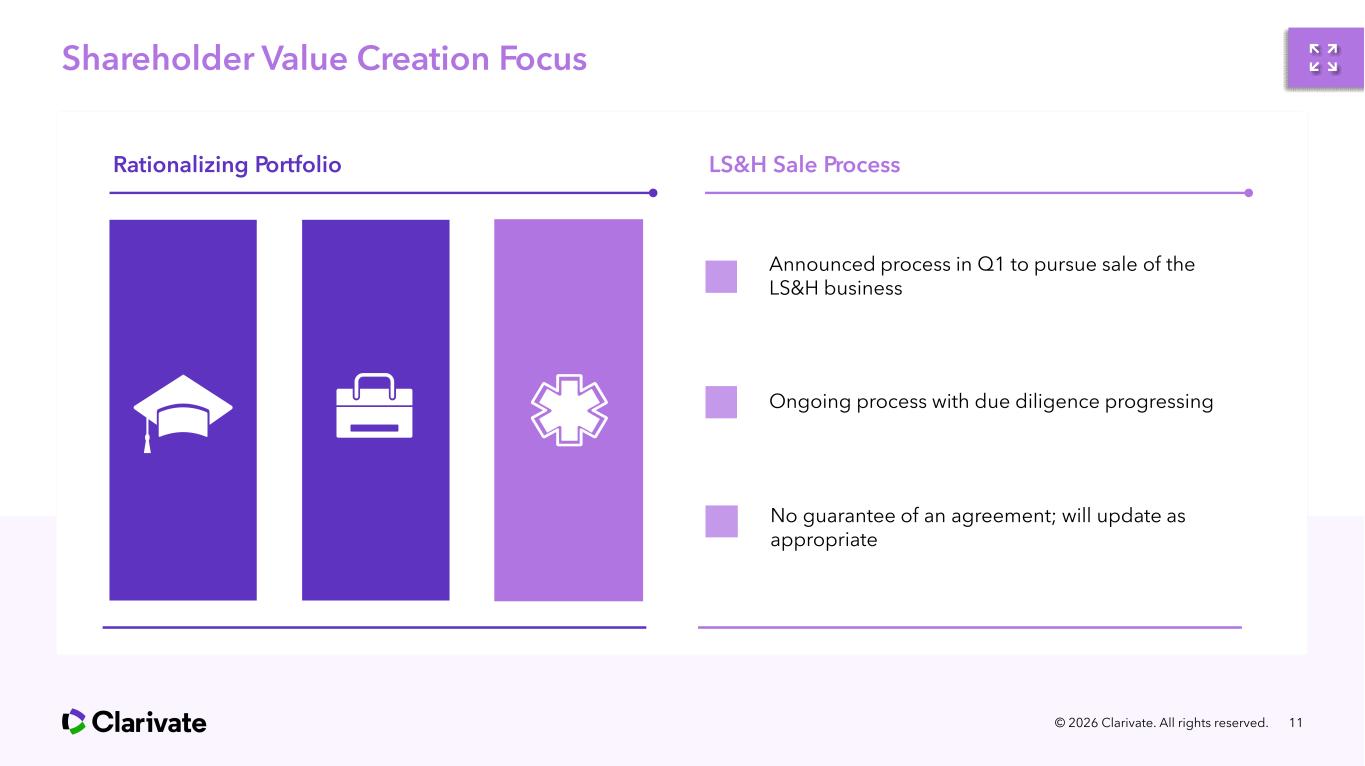
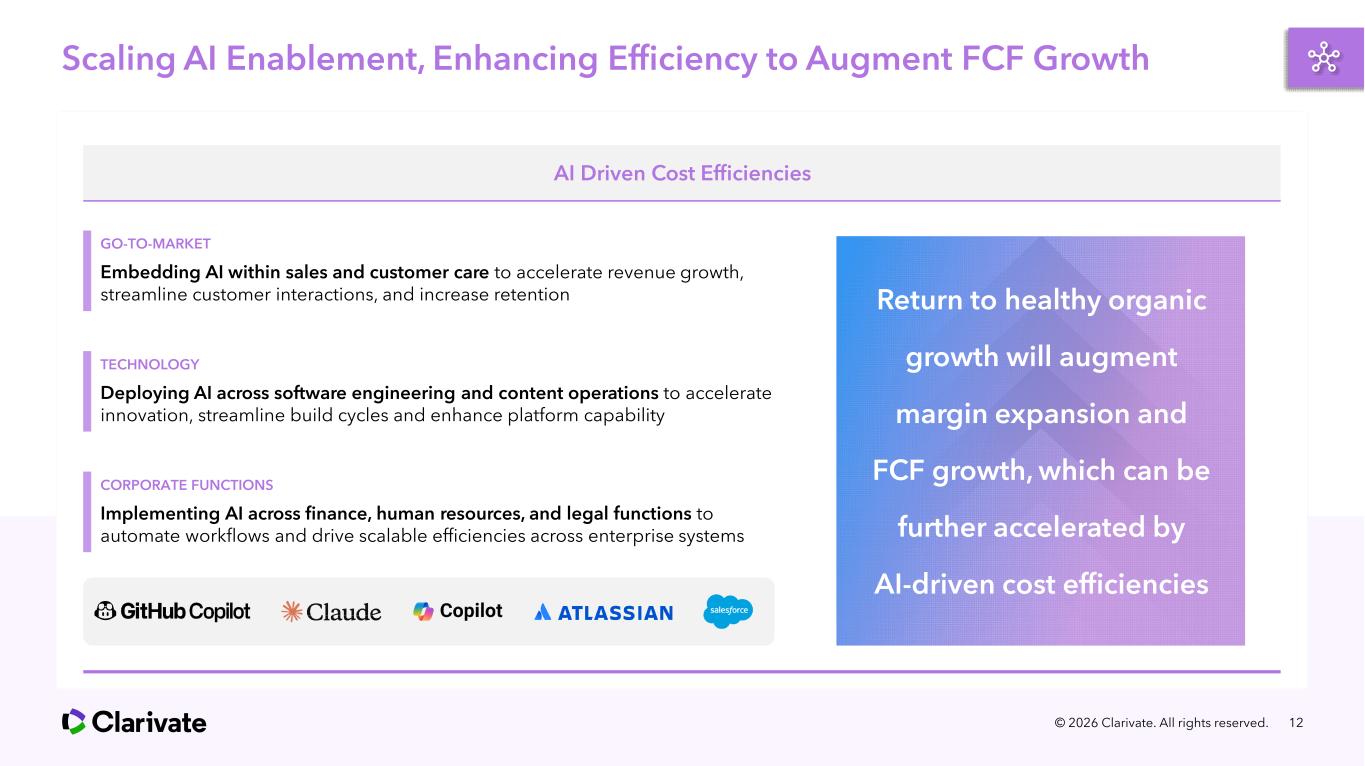
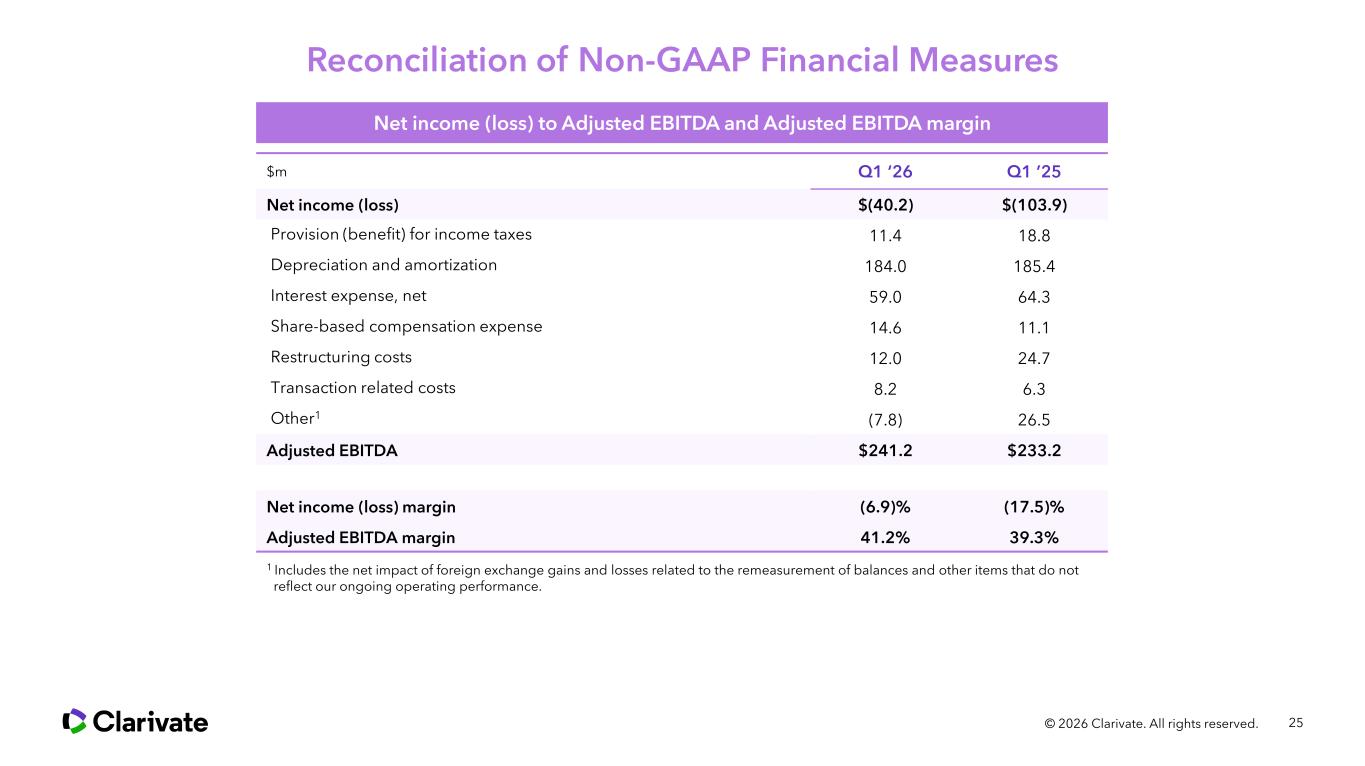
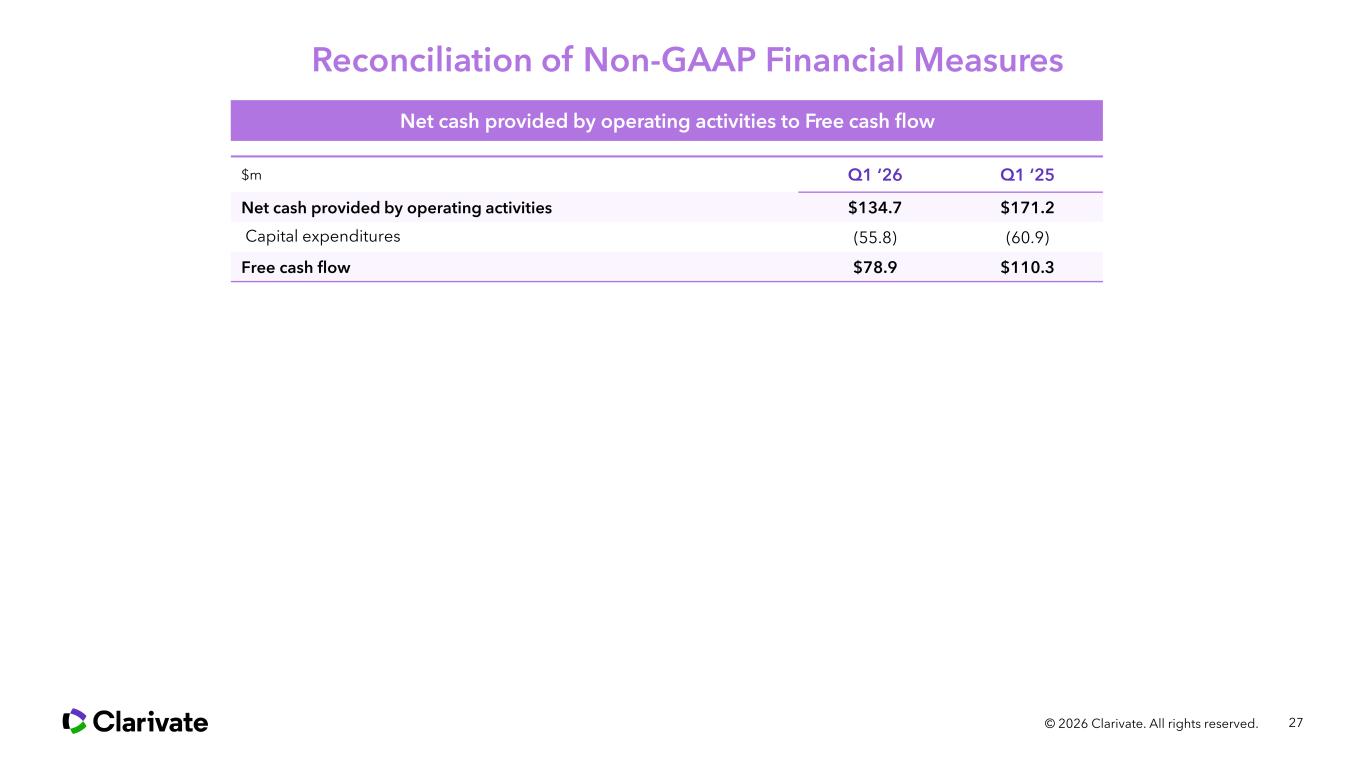
Today, I will walk through our first quarter performance, progress against our value creation plan, and how execution across the business is positioning Clarivate Plc for improved organic revenue growth, margin expansion, and stronger free cash flow generation. This is our fifth consecutive quarter of improved performance. We are off to a solid start to the year, and I am pleased to report that our first quarter financial results have us on pace to achieve our full-year guidance. Revenues were $586 million, supported by continued VCP progress and execution across the portfolio. From a growth perspective, the quality composition of our revenue continues to improve. Organic ACV growth was 1.6%, with subscription organic revenue growth of 1.7% reflecting increased adoption of subscription-based solutions across Clarivate Plc. We are encouraged by the underlying momentum we are seeing due to stronger alignment between commercial execution and product strategy. Adjusted EBITDA was $241 million, representing a 41% margin, up almost 200 basis points year-over-year, highlighting the benefit of our subscription-first strategy and disciplined cost management. Free cash flow generation was also solid at approximately $79 million, which allowed us to retire $143 million of debt during the quarter. Most important, the value creation plan is working. We are seeing positive execution across all pillars, demonstrated by accelerating product adoption, improving sales effectiveness, and an expanding cadence of new product introductions. This quarter reinforces our confidence that the actions we put in place are beginning to translate into more predictable performance, expanding margin, and strong free cash flow generation. As a reminder, we launched the value creation plan in early 2025 to sharpen focus, accelerate execution, and unlock long-term shareholder value. The plan is built around four core pillars: business model optimization; improved sales execution; accelerated AI innovation utilizing our proprietary data assets; and portfolio rationalization. You can see these pillars showing up clearly in the numbers: subscription mix, margin expansion, debt reduction. Academia and government continue to be a strong engine for recurring revenue growth. We are executing well across all three pillars of the value creation plan with clear evidence of progress. On business model optimization, we are accelerating the shift towards subscription-based offerings. Adoption of our ProQuest subscription solution remains strong, with over 600 new subscriptions sold in the last twelve months, reinforcing the durability and predictability of our revenue base. Sales execution is also improving, driven by more effective cross-sell execution across content, research and analytics, and software solutions. During the quarter, we secured several key wins, including a multi-product institutional deal with Spire University, a new research-oriented university in China. We are expanding our China footprint, and this demonstrates our ability to deliver integrated solutions that address broader customer needs. We are leveraging the power of AI, which is generating real, measurable value for customers. Clarivate Plc academic AI solutions are optimizing key library workflows, resulting in a 30% to 60% decrease in manual repetitive work and doubling or even quadrupling throughput. This demonstrates how combining AI with Clarivate Plc’s unique content and extensive domain knowledge leads to significant operational improvement for customers. Turning to intellectual property, our attention remains firmly on execution and fundamentals. We are seeing encouraging signs that our increased focus on new subscriptions and renewal discipline is producing results. For the first quarter, renewal rates improved approximately 100 basis points, helping organic ACV trends improve to nearly flat. This represents a clear improvement versus prior trends and supports our confidence that the IP business is moving forward and returning to sustainable recurring growth. Sales execution continues to strengthen, for example with national IP offices, including the USPTO, where we secured a major trademark analytics contract and large-scale digitization programs. These wins are advancing patent and trademark operations globally and reinforce Clarivate Plc’s role as a long-term strategic partner in the IP ecosystem and analytics. During the quarter, we released brand image search, adding advanced AI capabilities such as clustering and multilingual support. These enhancements are expanding how IP professionals uncover insights, assess risk, and make faster, more confident decisions at a global scale. Overall, the IP segment is operating with greater focus and discipline, and we believe this improvement positions the business for future growth. In Life Sciences and Health, we are seeing steady progress with the value creation plan. The shift from transactional sales to subscription is on track, supported by positive customer feedback and more consistent sales patterns. The successful changes we have made are reflected in an almost 1% rise in organic revenue during the first quarter. Notably, we won a new top 20 global pharmaceutical customer for DRG Fusion, our new real-world data analytics platform. This reinforces the strength of our value proposition with large, sophisticated customers. In addition, we secured a six-figure subscription win with a biotech company for OpEx, our platform for preclinical and clinical safety intelligence, demonstrating continued momentum across customer sizes and use cases. On innovation, we continue to expand access to our trusted regulatory and scientific intelligence through strategic partnerships. During the quarter, we integrated Cortellis regulatory intelligence with Anthropic Cloud Enterprise, combining cloud-based proprietary data with advanced AI reasoning to deliver trusted insights directly within customer AI workflows. The collaboration underscores how Clarivate Plc is extending the reach and relevance of its content across the broader AI ecosystem. In February, we announced that we are actively pursuing the sale of the Life Sciences and Healthcare business as part of a broader portfolio rationalization effort. This is consistent with our broader strategy to concentrate capital and management attention on areas where we see the highest returns. The process is ongoing. As always, there is no guarantee of the outcome; we will provide updates as appropriate. Our objective remains clear: maximizing value for shareholders while sharpening strategic focus on our remaining businesses. We have spoken on previous earnings calls about the investments we are making in AI product innovation. Today, I want to highlight how we are scaling AI enablement across Clarivate Plc to drive efficiency and support acceleration of free cash flow. This is a core enabler of the value creation plan and a key lever for margin expansion as we return to healthier organic growth. Let me provide some color and examples. Across go-to-market functions, we are embedding AI within sales and customer care to accelerate revenue growth, streamline customer interactions, enhance service quality and experience, and increase retention. In technology, we are deploying AI throughout software engineering and content operations to accelerate innovation and shorten new product time to market. Within corporate functions, we are leveraging AI across finance, human resources, and legal functions to automate workflows and drive scalable efficiencies. We expect the deployment of digital agents will reduce manual effort, improve accuracy, and create operating leverage. Taken together, these AI-enabled cost efficiencies reinforce our core messages. As organic growth improves, these AI efficiencies give us confidence in sustained margin expansion and growing cash flow. To close, the first quarter demonstrates that the actions we put in place through the value creation plan are translating into stronger execution, improving fundamentals, and a clearer path forward. We are operating with greater focus, strengthening our business model, improving sales effectiveness, and delivering innovation that matters to our customers, all while maintaining strong discipline around cost and cash generation. Thank you for your continued support. We look forward to keeping you updated on our progress. I will now turn the call over to Jonathan M. Collins for a review of our financial results and outlook.
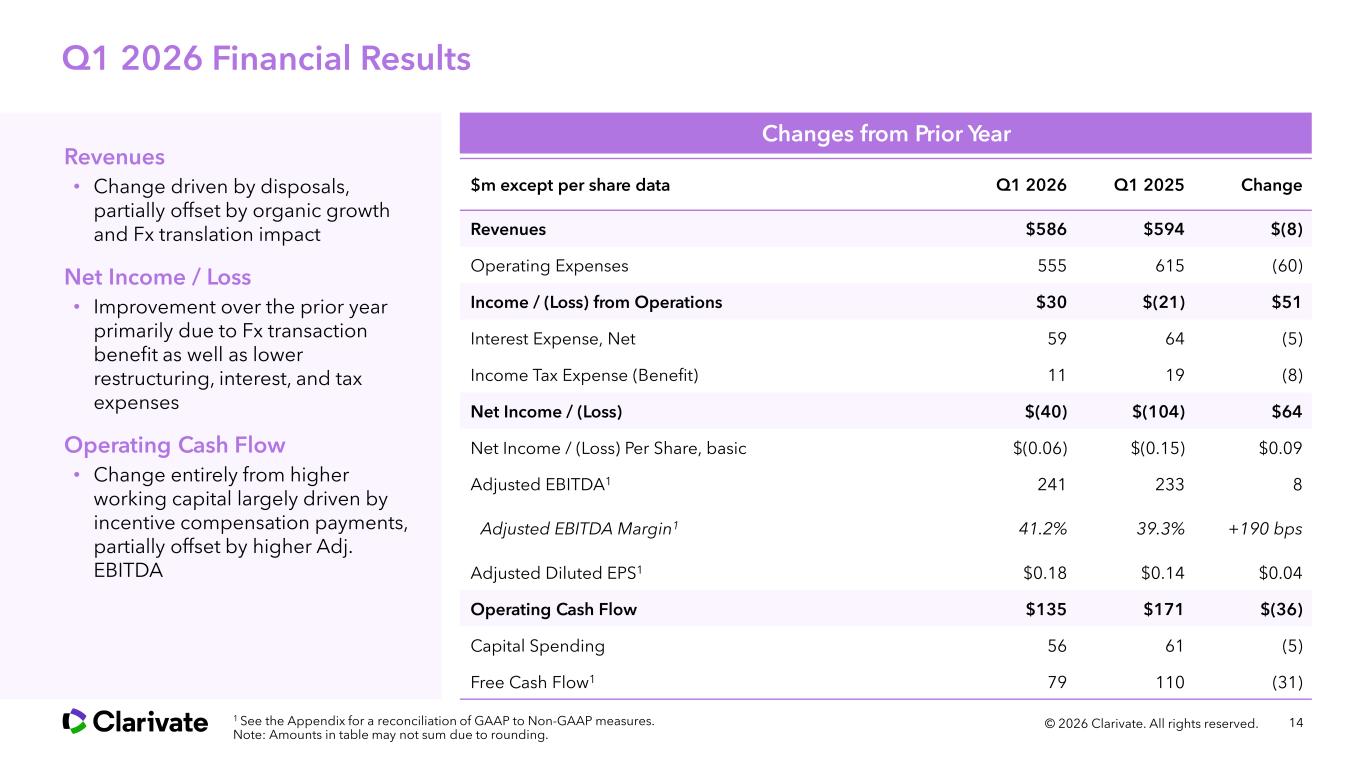
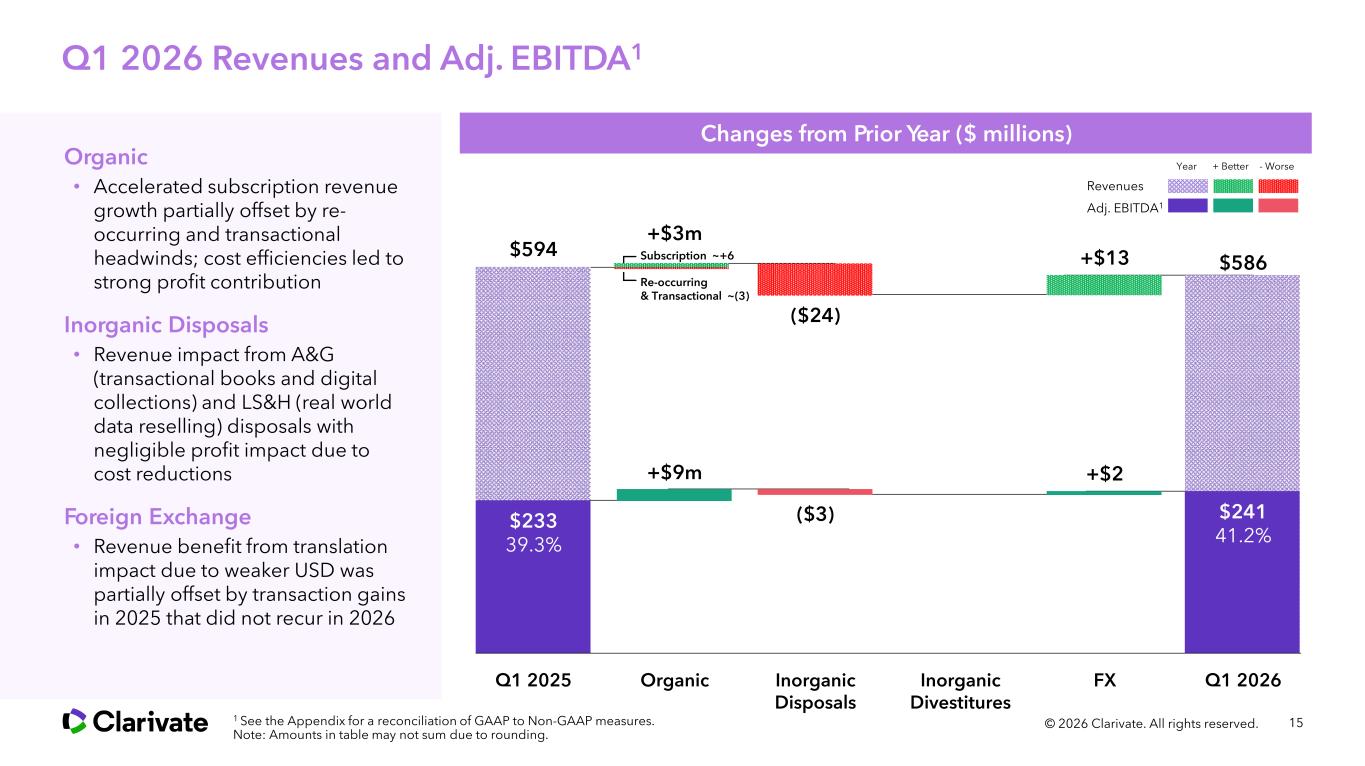
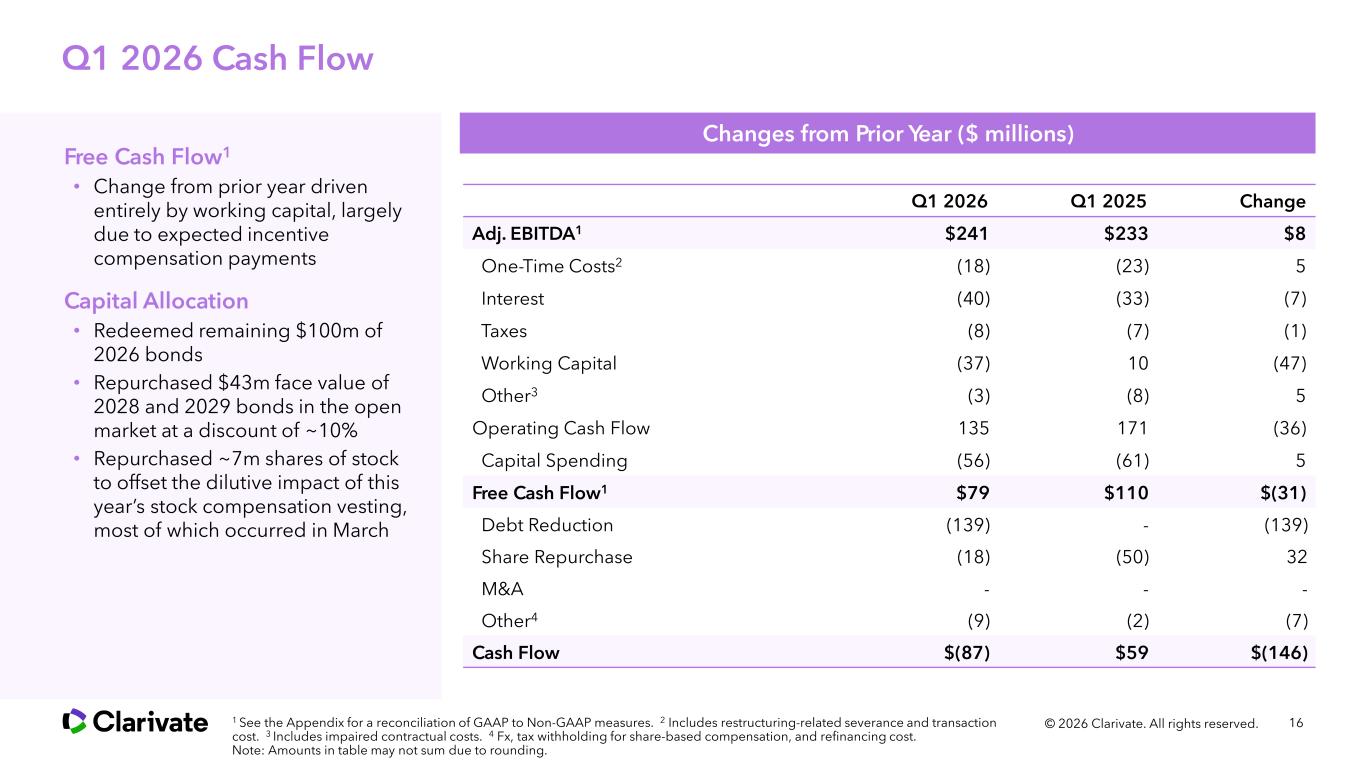
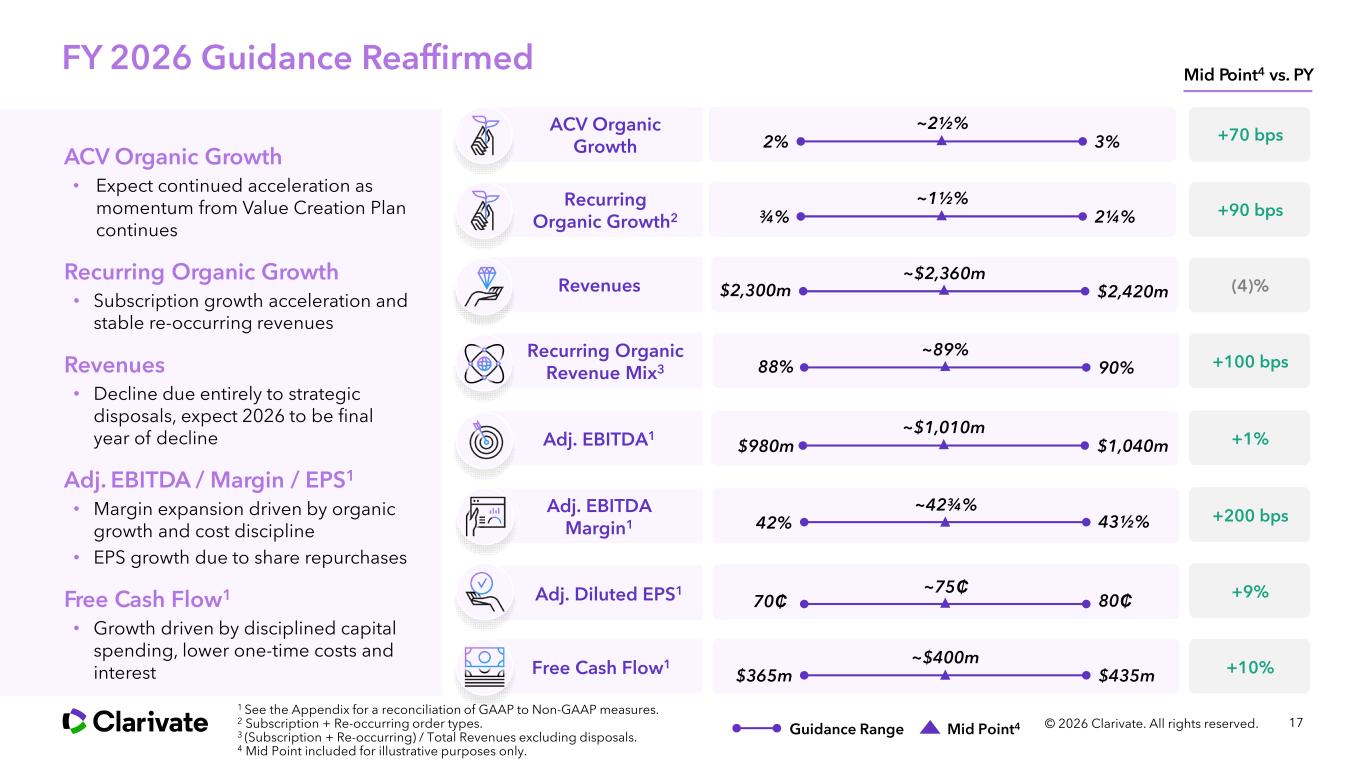
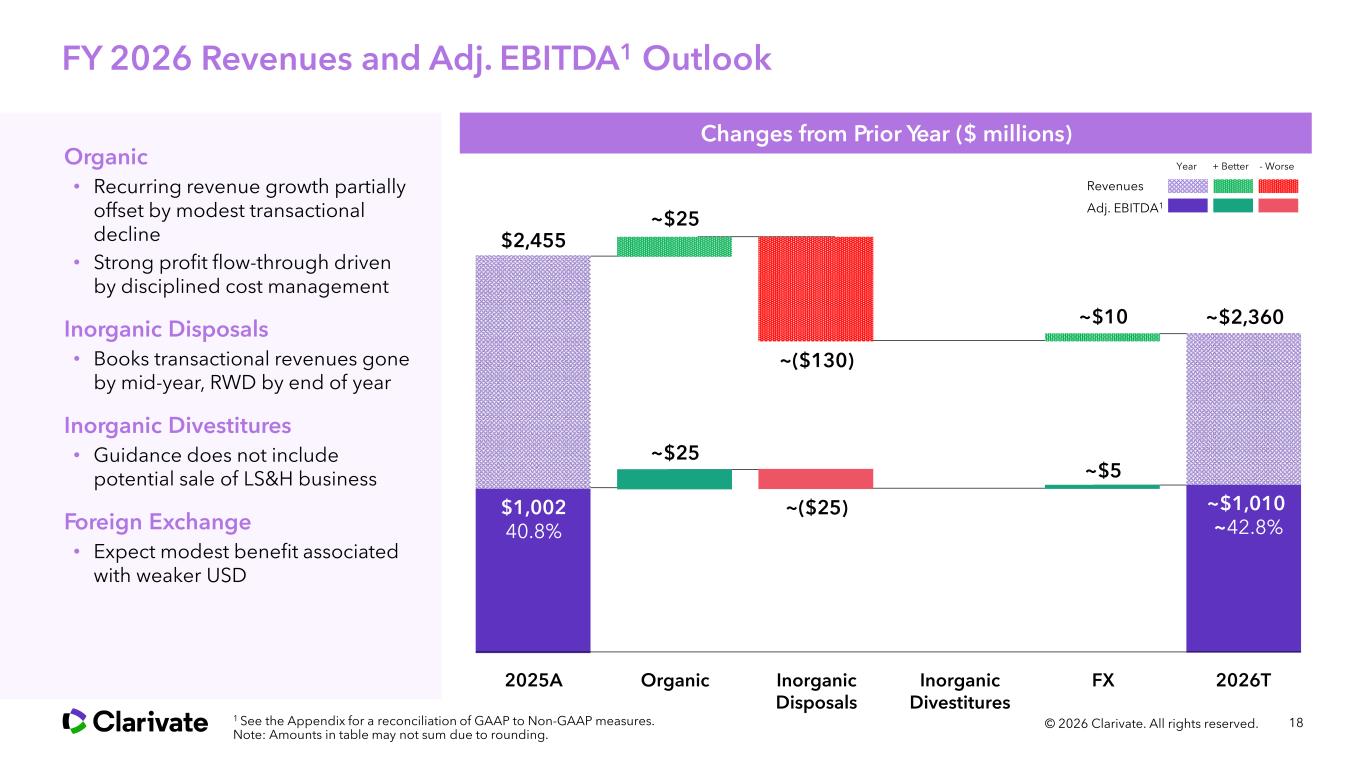
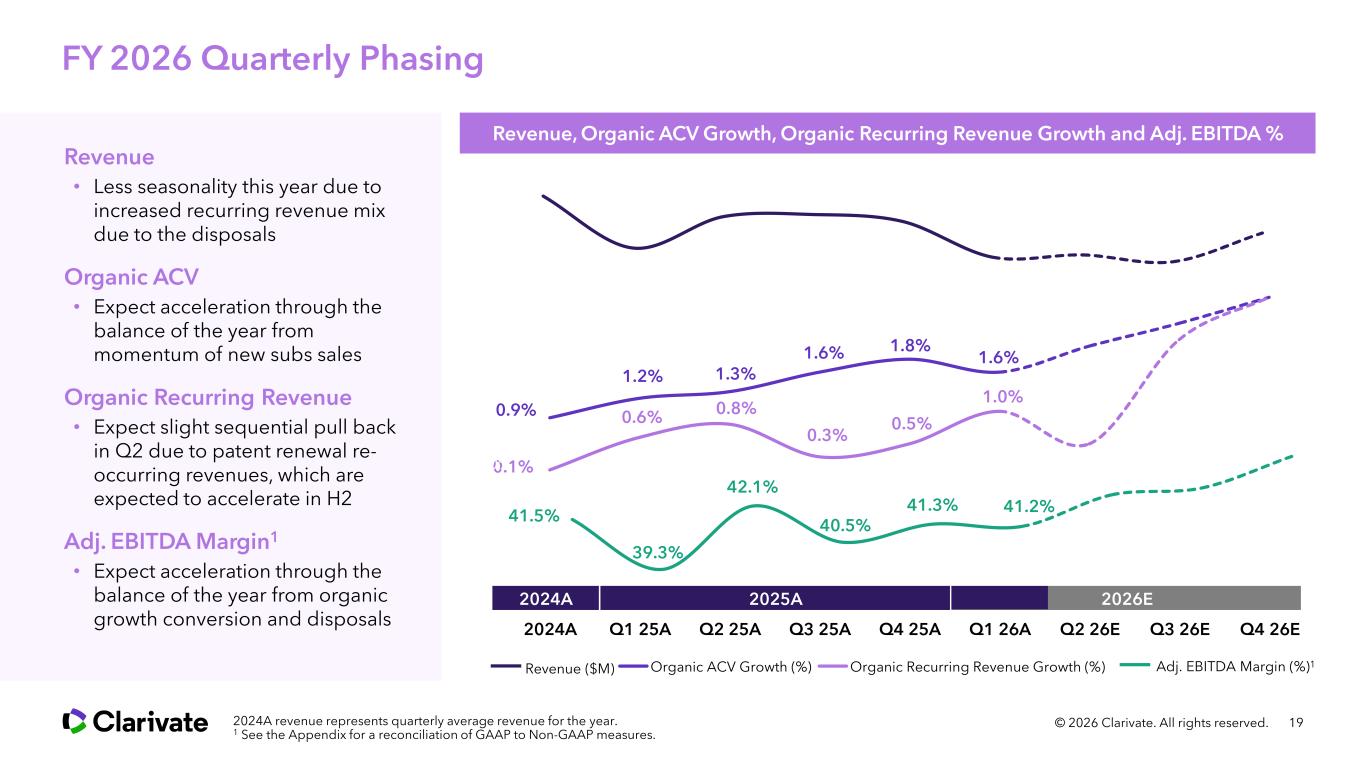
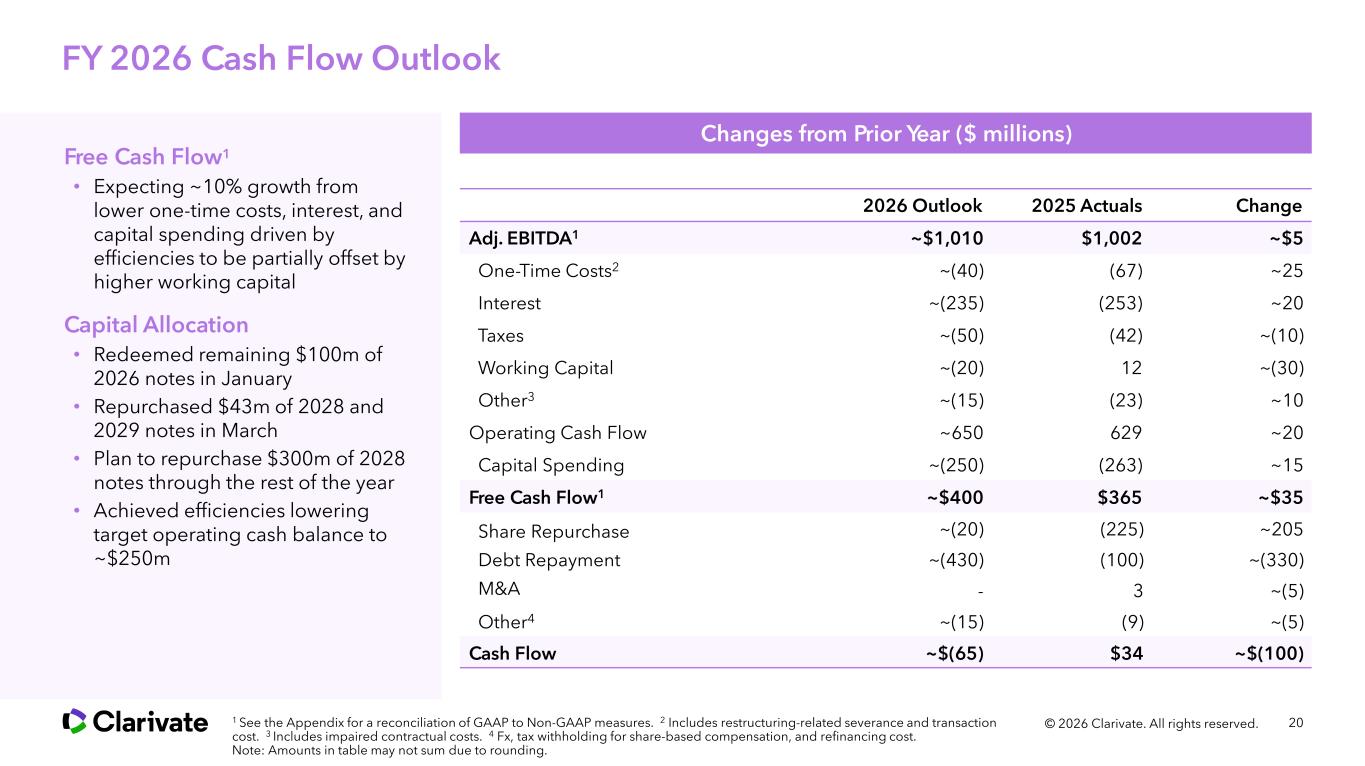
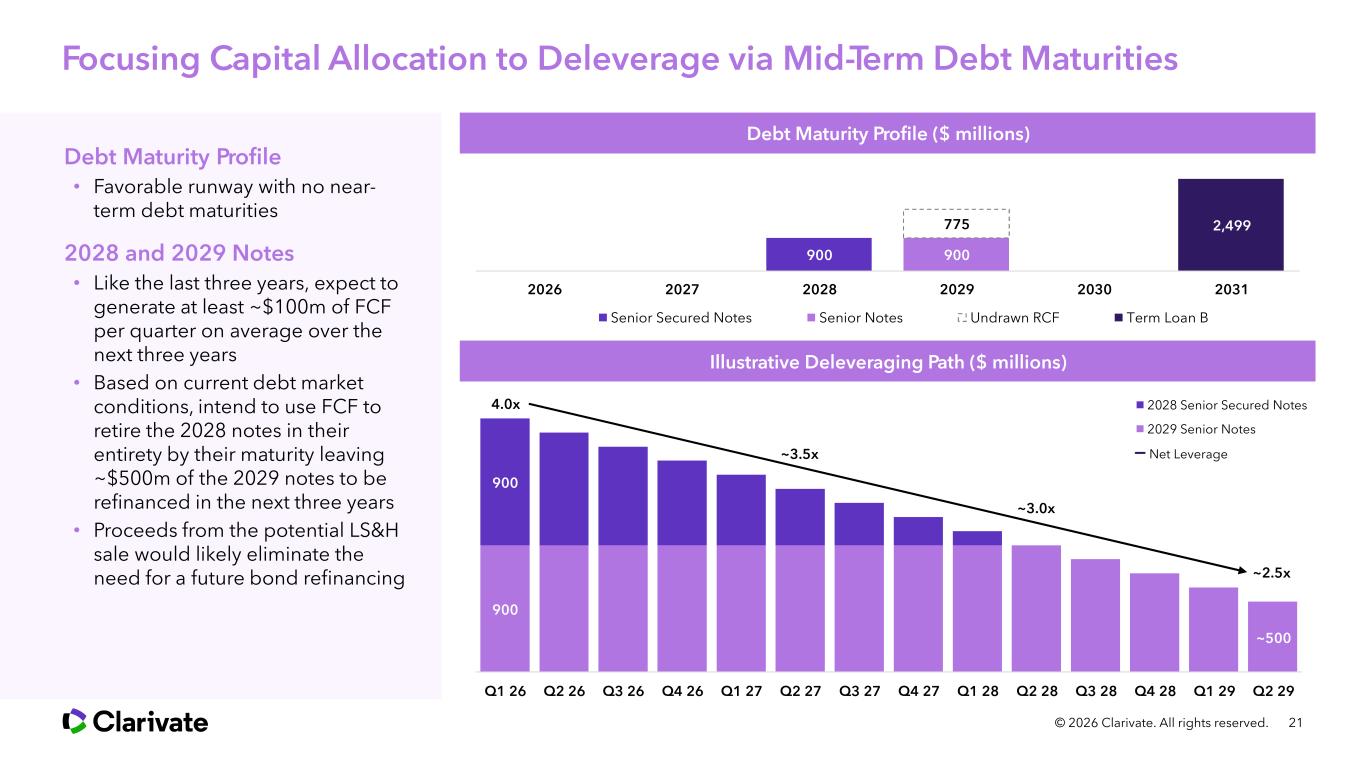
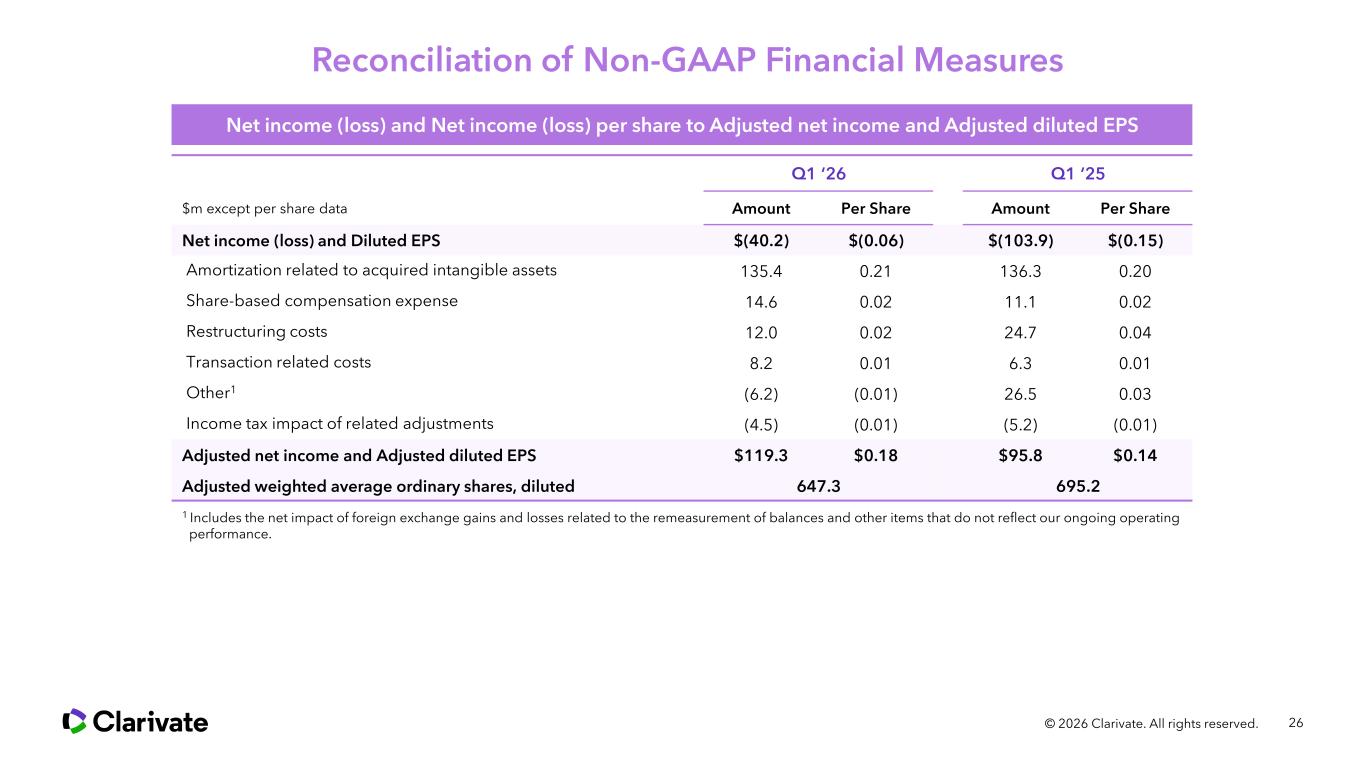
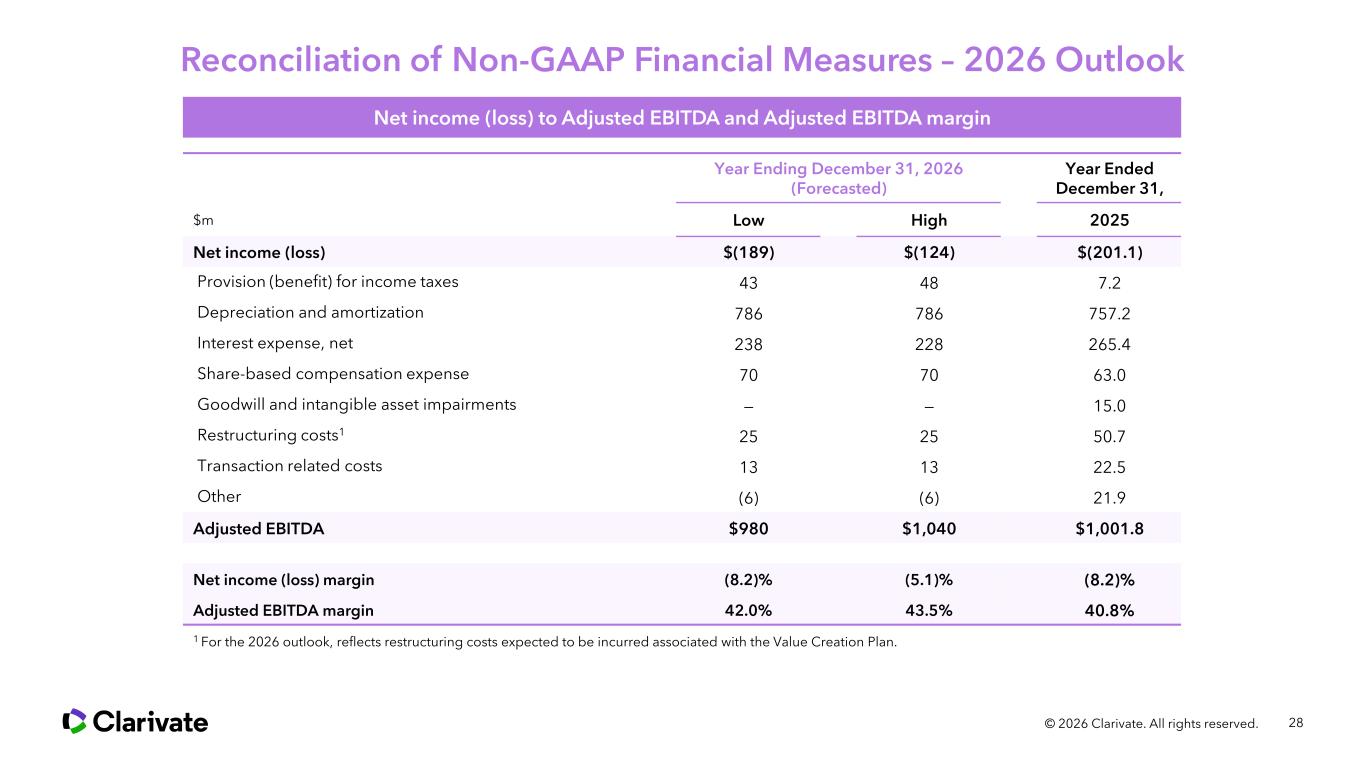
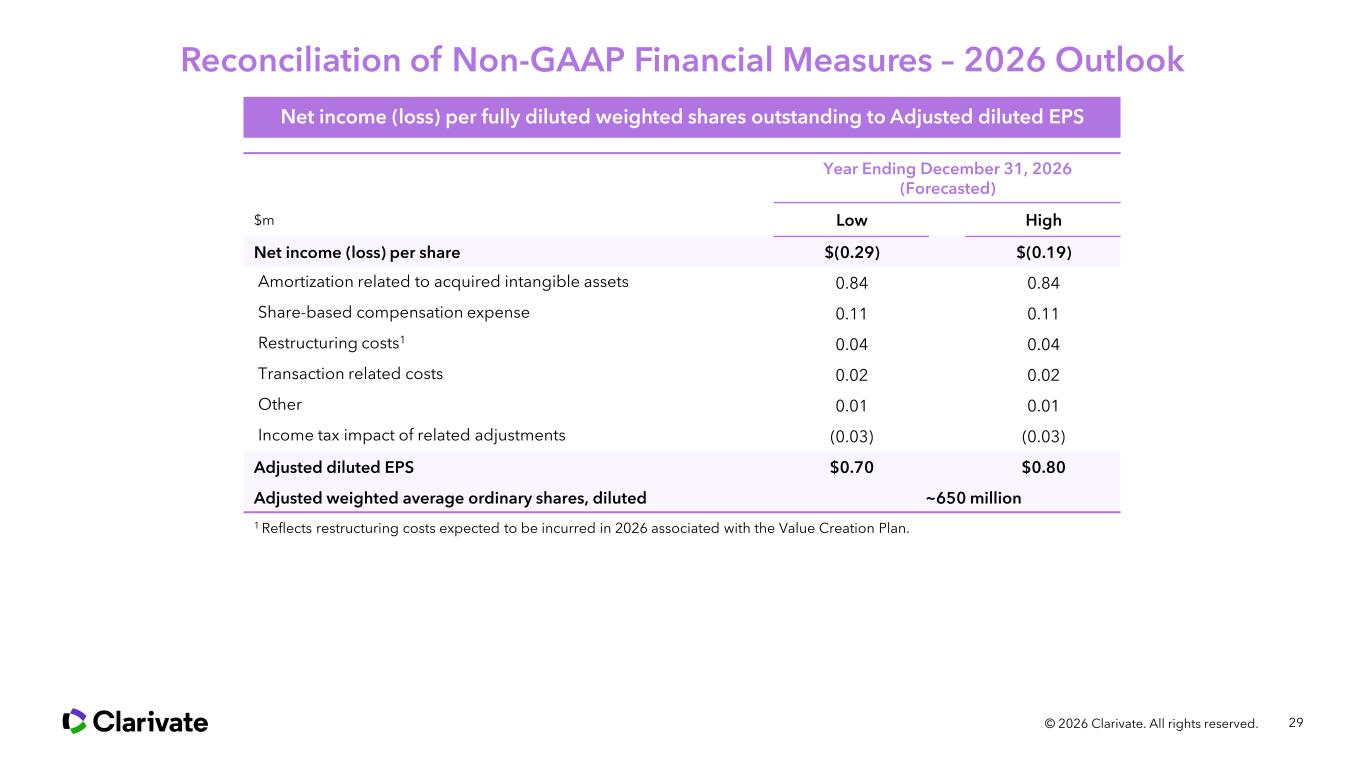
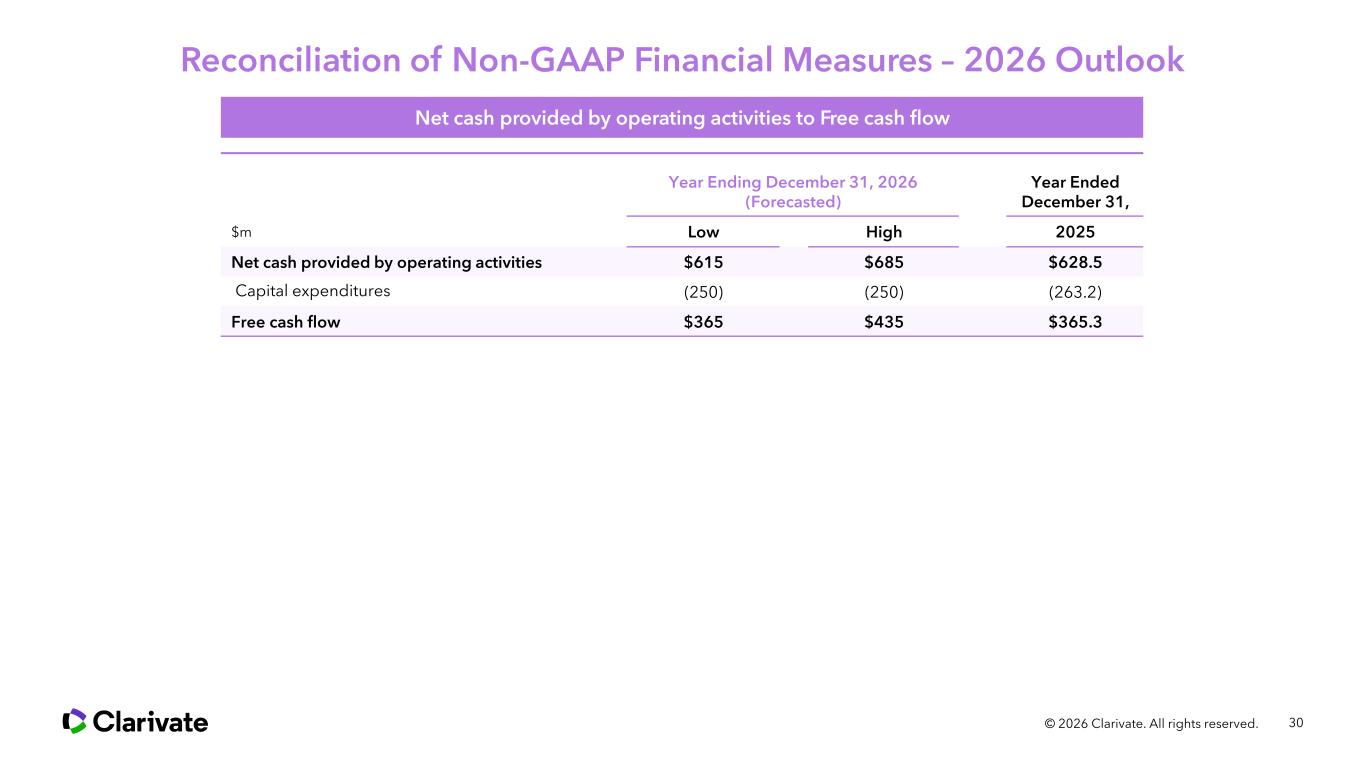
Thank you, Matitiahu Shem Tov. Slide 14 is an overview of our first quarter results compared with the same period last year. Q1 revenue was $586 million. The change over the prior year was due to the inorganic disposals, partially offset by organic growth and a favorable foreign exchange impact. First quarter net loss was $40 million; improvement over the prior year was driven by a foreign exchange benefit as well as lower restructuring, income tax, and interest expenses. Adjusted diluted EPS was up nearly 30%, or $0.04, over the prior year to $0.18. The increase was attributed to adjusted EBITDA growth, lower interest expense, lower tax expense, and a lower share count due to last year's repurchases, which each contributed about a cent to growth. Operating cash flow was $135 million in the quarter. The change compared to last year was driven by higher working capital due to incentive compensation payments, partially offset by higher adjusted EBITDA. Please turn with me now to page 15 for a closer look at the drivers of the first quarter top- and bottom-line changes from the prior year. The changes over the prior year were driven by three primary factors. First, organic revenues grew modestly as subscription growth of nearly 2% was partially offset by lower recurring and transactional revenues. We delivered a strong profit conversion on the growth as operating expenses were lower than the prior year despite the higher revenues as we achieved cost efficiencies across the business. Second, businesses we are disposing decreased revenue by $24 million but were almost entirely offset by cost reductions due to the wind downs, yielding a net $3 million reduction in adjusted EBITDA. And finally, the U.S. dollar remained relatively weaker against the basket of foreign currencies compared to the first quarter of last year, which caused a foreign exchange tailwind on the top line. The mid-teens profit conversion is due to transaction gains last year that did not recur this year. In total, disciplined cost management led to an adjusted EBITDA margin expansion of nearly 200 basis points, which is in line with our full-year guidance. Please turn with me now to page 16 for a look at how the adjusted EBITDA converted to free cash flow and how we allocated the capital. Free cash flow was $79 million in the first quarter, which was $31 million lower than the prior year. The change was due to higher working capital as a result of incentive compensation payments, partially offset by the adjusted EBITDA growth. We used the free cash flow and excess cash on hand to redeem the remaining $100 million of bonds that were due later this year, repurchase $43 million of bonds due in 2028 and 2029 at a blended discount of about 10%, and repurchased 7 million shares of stock to offset the dilutive impact of stock compensation investing. Please turn to page 17 for a look at our full-year financial guidance, which remains entirely unchanged from February. Today, we are reaffirming our full-year financial guidance for all metrics. Beginning at the top of the page, we anticipate the acceleration of our organic annual contract value last year will continue in 2026, resulting in growth of between 2%–3%, representing continued steady progress and an increase of about three-quarters of a percentage point at the midpoint of the range. We expect recurring organic growth of about 1.5% at the midpoint of our range, which is an improvement of nearly a percentage point over last year. Due entirely to the wind down of the businesses we are disposing, we expect revenue to decline by about $100 million at the midpoint of the range to $2.36 billion and that our organic recurring revenue mix, which excludes the impact of the disposals, will improve to between 88%–90%. Moving down the page, we expect adjusted EBITDA will grow modestly despite the lower revenue, increasing our profit margin to nearly 43% at the midpoint of the range. We anticipate adjusted diluted EPS will grow about nine percent at the midpoint of the range to $0.75, largely due to the share repurchases we completed last year. Finally, free cash flow is expected to grow by about 10% to $400 million at the midpoint of the range. Please turn with me now to page 18 for a reminder of the full-year top- and bottom-line changes we are expecting compared to last year. We expect adjusted EBITDA margin will expand by about 200 basis points at the midpoint of our ranges, driven by a return to organic growth, continued cost discipline, and completing the disposals. We anticipate organic growth of about 1%, led by subscription revenue growth from continued ACV acceleration. We have plans in place to achieve cost efficiencies to fully offset inflation, resulting in a full flow-through of the approximately $25 million of revenue growth to profit. This will account for about a third of the profit margin expansion. The inorganic disposals are expected to lower revenue this year by approximately $130 million, and we are reducing operating expenses by more than $100 million, which yields a profit impact of about $25 million, delivering the remaining two-thirds of the profit margin expansion. As a reminder, our financial guidance for this year assumes we will own the Life Sciences and Health business for the entire year, and if an agreement is reached to sell the business, a revision to our guidance for this potential divestiture may be necessary later this year. We continue to anticipate a modest foreign exchange translation benefit to the top and bottom lines of $10 million and $5 million, respectively, most of which we already experienced in the first quarter. Please turn with me now to page 19 to step through the expected seasonality of our revenues and profits this year, which we have refined based on our first quarter results. We continue to expect to make steady progress on the top and bottom lines as we move through the year. As we projected in February, we experienced a slight sequential pullback in our annual contract value organic growth in Q1 but anticipate steady acceleration through the balance of the year to arrive near the midpoint of our range. Recurring organic revenue growth in Q1 of 1% was higher than we expected, due largely to the timing of patent renewals. We do expect a slight pullback in Q2 as a result of this phasing, leading to accelerated growth in the second half of the year. We expect revenue will remain relatively stable over the next couple of quarters and then tick up in Q4 due to the normal seasonality of recurring and transactional revenues. We do anticipate profit margins will continue to expand as we move through the remainder of the year, due to the organic growth and the impact of the disposals. Please turn with me now to page 20 to review how we expect the more than $1 billion of adjusted EBITDA will convert to about $400 million of free cash flow and how we plan to allocate capital. At the midpoint of our range, we expect free cash flow to grow about $35 million, or 10%, over last year. One-time costs are expected to abate, primarily on lower restructuring costs. As noted a couple of pages ago, our guidance does not contemplate the sale of the Life Sciences and Health segment. If we reach an agreement, this is an area we would update later this year. We expect cash interest to improve by about $20 million over the prior year as a result of the debt we prepaid last year and last quarter, additional debt we plan to prepay the remainder of this year, and some savings associated with the projected forward base rate curve. Cash taxes are expected to be $510 million higher than last year due largely to the new corporate tax in Jersey. We anticipate the change in working capital this year will be a use of approximately $20 million, primarily due to the incentive compensation payments in Q1. We are also expecting a $10 million benefit associated with lower paired contractual cost. And while we remain committed to investing in product innovation, the disposals and cost efficiencies will improve capital spending by about $15 million. From a capital allocation perspective, we plan to use the free cash flow we generate in the remainder of the year for debt reduction. Please turn with me now to page 21 for more specifics on our deleveraging plan this year and beyond. The chart at the top of the page outlines our debt maturity profile. As you can see, we have a favorable runway with no near-term maturities. Over the past three years, 2023 through 2025, we generated $1.2 billion of cumulative free cash flow, just over $100 million per quarter on average. As I highlighted on the prior page, we expect to generate about $400 million this year at the midpoint of our range, and we expect to generate at least this amount next year and the following. This outlook results in a similar average quarterly rate of about $100 million. Given the current debt market conditions, we plan to use our free cash flow moving forward towards the early retirement of our bonds. Over the next nine quarters, we expect to retire our secured notes in their entirety before their maturity in July 2028. Once those have been redeemed, we plan to use our quarterly free cash flow to begin to retire the 2029 notes, leaving only $500 million of the $1.8 billion of midterm maturities to be refinanced in the next few years. It is worth noting that, as with all of our forward-looking guidance, this outlook includes our Life Sciences and Health business. If the potential sale does materialize, we expect it would eliminate the need for a future bond refinancing. We anticipate these debt reduction actions will lower our net leverage from four turns at the end of Q1 of this year to approximately 2.5 turns in a few years. We continue to be very encouraged by the improved results we are delivering as we implement the value creation plan and the durable cash flows we generate. I would like to finish by thanking all of you for listening in this morning. I will now turn the call back over to the operator. We will now open the call for questions. As a reminder, please limit yourself to one question and return to the queue for additional. Please go ahead.
Operator
At this time, if you would like to ask a question, press star followed by the number one on your telephone keypad. If your question has been answered and you would like to remove yourself from the queue, press star followed by the number one. Your first question is from the line of Toni Michele Kaplan with Morgan Stanley.
Speaker 4
Thank you. You have talked about your new AI capabilities that you have launched, and reducing some of the manual repetitive work through AI efficiencies. I was hoping you could talk about the traction of the new AI products, the reception from customers, how much growth you are getting from them at this point, and, similarly, any ability to quantify the efficiency benefits that you can get from AI as well. That would be great. Thank you so much.
Speaker 2
Thank you, Toni. I will start, and Jonathan M. Collins will continue. First of all, we are intensifying our investment in AI. Over the last fifteen to eighteen months, we have invested increasingly in AI, and it goes two ways. The first was major product introductions and innovation across the three segments, and now we are also focusing on internal cost efficiencies with AI. So I will start with internal cost efficiencies. There are opportunities in go-to-market, customer support, and sales operations; opportunities in technology to help us innovate and develop products faster with the support of AI; and also opportunities around corporate to rationalize some of our corporate costs, whether it is finance, general, or legal. So there are a lot of opportunities internally. Externally, the product dimension is delivering innovation to our customers where it really matters. So three buckets of product innovation that we have on AI. One is the first wave of products that we have improved with AI assistants. Product by product, in many of our products we have implemented research assistants. We have implemented in different products in A&G, then in Life Sciences, and we are now doing the same with IP. That was wave one. Wave two was agentic AI. We are implementing agentic AI capabilities across our products where it matters. And then, just coming back from some of the feedback we get from some measurements that we have done in implementing agentic AI within our Alma Prime library product, we have managed to reduce the manpower or to quadruple the throughput of some of our customers using agentic AI capabilities, and this is just a start. And the third wave is ecosystem implementation. Ecosystem implementation: we all know that this generation, especially students and researchers, but also lab scientists and IP professionals, are consuming AI through the major LLM providers. So we started the journey. We announced about a month ago that we are collaborating with Anthropic to provide AI capabilities within Anthropic Cloud Enterprise, taking Clarivate Plc proprietary products and data, and in collaboration with Anthropic we are enabling the consumption of this data in the Anthropic environment. In a way, we are turning the LLM to our sales agent, meeting our customers where they are. On top of this, yesterday we announced another product from A&G called Nexus Connect. If you think about universities, they subscribe to a lot of different content. And, again, students and researchers are consuming this content through different types of LLM. Nexus Connect is our new offering from A&G that brings the data—ChatGPT, Copilot, whatever your designated LLM—using our technology to bring our content, but also other providers’ content, very close to our customers. So overall, a lot of energy and a lot of resources are going into AI innovation. We have been recognized as a leader in AI innovation in the academic ecosystem. It has been a long answer, but I will move it over to Jonathan M. Collins to talk a little bit about the financials.
I appreciate the part of the question, Toni, with respect to the opportunity size in the AI efficiency internally. We outlined the areas that we are focusing on there, and at this point, we are confident that the opportunity set gives us a really good opportunity to continue to expand our margins and grow our cash flows. We are likely going to look to further dimension this probably later this year. Thank you for the question.
Operator
Your next question is from the line of Manav Patnaik with Barclays.
Speaker 5
Thank you. Matitiahu Shem Tov, I was hoping you could just give us an update on how you see the competitive environment out there. Presumably, they are using AI and enhancing their products as well, and I am just curious if you have seen any change and how you would compare your initiatives versus what you are seeing in the market?
Speaker 2
I think I just mentioned that we have been recognized as an AI innovator. We see great adoption for our AI products across the three segments. In A&G, we have more than 400 institutions using academic AI solutions. I mentioned Nexus Connect. In Life Sciences, over 10 thousand researchers and users are using some of our AI product innovation. We recently announced the cloud collaboration with Anthropic. We are doing well with IP as well, with the recent brand image search that we have introduced. We always look forward; we try to set the scene as opposed to looking at what the competition does, but we feel good about our product innovation. Many of us come from a background of products and engineering, and we are seeing a lot of improvement and great feedback from our customers across these three different segments.
Operator
Your next question is from the line of Scott Wurtzel with Research.
Speaker 6
Good morning. Thank you for taking my question. I think in your prepared remarks you talked about the China opportunity and expanding there. I am wondering if you can maybe just talk about that A&G space more broadly in China and the opportunity that presents to you?
Speaker 2
China is a great contributor to our A&G capabilities and performance. We just came back from a meeting with some of our Chinese top sales executives. We sold 15 new Web of Science businesses in China last year. There is a lot of great momentum for A&G in China, specifically in Web of Science, and more recently also in Web of Science Research Intelligence. We have some development collaboration we are doing with a few institutions. We feel very good about our top A&G prospects in China—not only A&G, also Life Sciences and IP. We have different ideas we are currently contemplating. We will share more as we have it, but we feel good about the China market.
Thanks for the question, Scott.
Operator
Your next question is from the line of Ashish Sabadra with RBC Capital Markets.
Speaker 7
Hey. Good morning, guys. This is William Qi on for Ashish Sabadra. Appreciate you taking our question. It is really great to see the continued sequential improvements on the organic sales metrics. I think IP continues to execute in a bit of a more muted environment. You have noted in the past that there are some expectations for that to improve maybe in 2026 into early 2027 as some of those historical batch renewal cycles come back. Is that the general trend that you expect for that segment? And you have had great wins as well—how do you combine all those together?
Speaker 2
I will start, and then I will ask Jonathan M. Collins to add. Just a reminder that we are the market leader in IP. We tend to forget this, and we are the only company that has all the three or four sub-offerings that we have in IP. We are very big on IPMS, and we have great intelligence products, both for trademarks and for patents as well. We have a new management team. We have enhanced focus—very strong focus on two things: sales execution—we have gone through some changes in our sales organization, renewals, territory alignment, and other things that we have done—and then AI innovation. There is very strong AI innovation momentum that we are building with the management team of IP. Brand Image Search was one product we mentioned. We are confident in the return for IP back to future growth. Jonathan, if you can give some more color here.
As Matitiahu Shem Tov highlighted, the continued investment in AI, we expect, will help accelerate growth in our subscription products there. We have made steady progress. We saw a slight improvement in renewal rates in the first quarter, and we have got an organic ACV that is getting pretty close to flat after a few years of decline, so steady progress based on the investments that we are making there. The biggest part of the IP business—the recurring revenue stream—which is our patent renewal business, declined a few percent two years ago. Last year, it was flat. The first half of this year, due to the comps and some timing from the first half of last year, will be down slightly, but we do expect that business to return to growth in the second half of this year and have a good trajectory heading into next year. Market conditions there—the patent stock growth—have improved over the last few years, which is a good leading indicator. And the team, as Matitiahu Shem Tov said, has done a very good job on sales execution, improving our competitive position in that part of the market. So it is continued progress, and we look forward to better performance from IP in the coming quarters and into next year. Thanks for the question, William Qi.
Operator
Your next question is from the line of George Tong with Goldman Sachs.
Speaker 8
Hi, thanks. Good morning. Transactional revenues were down this quarter because of lower A&G activity. Can you talk a little bit more about what you are seeing there and what would need to happen for A&G activity to rebound?
Thanks for the question, George. Our transactional revenues were down a couple of percent in Q1. As you noted, A&G was the primary driver in the quarter. I will start by saying we do expect, on a full-year basis, our guidance contemplates that the transactional business will be down slightly compared to the prior year, so it was as expected. In the quarter, some of that in A&G was due to the timing of software implementations. That can be a little lumpy quarter to quarter. And then, on a full-year basis, as we continue to have success in Life Sciences with the migrations to subscription, we will expect to see a little bit of a headwind there on the transactional side. But Q1’s slight decline was in line with what we expected and is in line with what we expect for the full year. As we move into next year, as we continue to build that sales pipeline on the software products, there is some opportunity to improve that heading into next year. But that was the primary driver in Q1.
Speaker 8
Very helpful. Thank you.
Operator
Your next question is from the line of Andrew Nicholas with William Blair.
Speaker 9
Good morning. Appreciate you taking my question. I was hoping to hone in a little bit more on A&G growth. That has been a segment that has hung in there pretty well over the past handful of quarters. Within that approximately 2% organic growth, and the expectation for improvement in 2026, is research analytics and content aggregation leading the way there, or is it a software-led growth, or are they all kind of around that 2% number? Just curious if there is an underlying subsegment where you have more expectation for growth acceleration. Thank you.
Thanks for the question, Andrew. The bright spot for us as of late in A&G from an organic growth contribution standpoint has been the success in our research and analytics category, which is led by our flagship product, the Web of Science. As Matitiahu Shem Tov touched on in his comments around AI innovation, this is where we have seen a lot of the new innovation come into the product. We are very encouraged by the adoption of the research assistant last year, some of the agents that we have deployed that we are getting great feedback on, such as the literature review agent. And we are also very thrilled about this year's growth that will be driven from the Web of Science Research Intelligence platform. That is the new AI-native multi-agent platform that helps measure research success across the university ecosystem. So we are really encouraged by what we have seen there. The content business has held in; that usually grows at or slightly below the average for A&G. And then the software business is doing well, with very high renewal rates. We have some new product innovation happening there that can help to catalyze further growth. Those are the three main areas, and the strong performance has been in our research and analytics category. Thanks for the question, Andrew.
Operator
Our last question comes from the line of Stifel.
Speaker 10
Hi. I am calling on personnel’s behalf. Apologies if I missed this, but in the slide deck, Life Sciences and Healthcare is progressing ahead of schedule in the shift to subscription. What is the current subscription mix of the business, and how should this shift move organic growth through the year? Thank you.
Thanks for the question. This is our segment that has the highest proportion of transactional revenue. Just as a reminder, our consulting practice for commercialization, which sits in the Life Sciences business, is an important part of the go-to-market motion for this, but it creates a lower organic recurring revenue mix within Life Sciences. What Matitiahu Shem Tov touched on is that we have continued to invest in product innovation to migrate some of these solutions to a subscription. We started to see progress on that last year. That continues into this year, and we expect to continue to make steady progress making that business more predictable with a higher renewal base every year to help accelerate it into growth. So it is a combination of the commercial motion—where we are focused in the marketplace—and the product innovation that is helping to lead that. We expect to see continued traction there, and over time, we think we can see the recurring revenue mix get into the low nineties in Life Sciences.
Speaker 2
Maybe just a few words of wrap-up. As I mentioned over the call, the VCP plan is working. This is the fifth quarter of improvement. Our subscription mix has gone to 88%–89%. We have better sales execution, and we are industry-leading in terms of AI. We are very pleased to be here today, and thank you for your time.
Thank you all for your time today. That concludes our call, and we look forward to speaking with you with any follow-up questions in the coming days. Thank you.
Operator
This does conclude today's call. Thank you for joining. You may now disconnect your lines.