Operator
Good morning, everyone, and welcome to the Encompass Health's first quarter 2026 earning conference call. At this time, I'd like to inform all participants that their lines will be in a listen-only mode. After the speaker's remarks, there will be a question-and-answer period. If you'd like to ask a question during this time, please press star 1 on your telephone keypad. You'll be limited to one question and one follow-up question. Today's conference call is being recorded. If you have any objections, you may disconnect at this time. I will now turn the Call over to Mark Miller, Encompass Health's Chief Investment Relations Officer. Please go ahead.
Thank you, Operator, and good morning, everyone. Thank you for joining Encompass Health's first quarter 2026 earnings call. Before we begin, if you do not already have a copy, the first quarter earnings release supplemental information and related form 8K filed with the SEC are available on our website at EncompassHealth.com. On page two of the supplemental information, you will find the safe harbor statements, which are also set forth in greater detail on the last page of the earnings release. During the call, we will make forward-looking statements, such as guidance and growth projections, which are subject to risks and uncertainties, many of which are beyond our control. Certain risks and uncertainties, like those relating to regulatory developments as well as volume, bad debt, and cost trends that could cause actual results to differ materially from our projections, estimates, and expectations are discussed in the company's SEC filings, including the earnings release and related Form 8K. The Form 10-K for the year ended December 31, 2025, and the Form 10-Q for the quarter ended March 31, 2026 when filed. We encourage you to read them. Your caution not to place under reliance on the estimates, projections, guidance, and other forward-looking information presented, which are based on current estimates of future events and speak only as of today. We do not undertake a duty to update these forward-looking statements. Our supplemental information and discussion on this call will include certain non-GAAP financial measures. For such measures, reconciliation to the most directly comparable GAAP measure is available at the end of the supplemental information, at the end of the earnings release, and as part of the form 8K filed yesterday with the SEC, all of which are available on our website. I would like to remind everyone that we would adhere to the one-question-and-one-follow-question rule to allow everyone to submit a question. If you have additional questions, please feel free to put yourself back in the queue. With that, I'll turn the call over to President and Chief Executive Officer Mark Tarr. Thank you, Mark, and good morning, everyone.
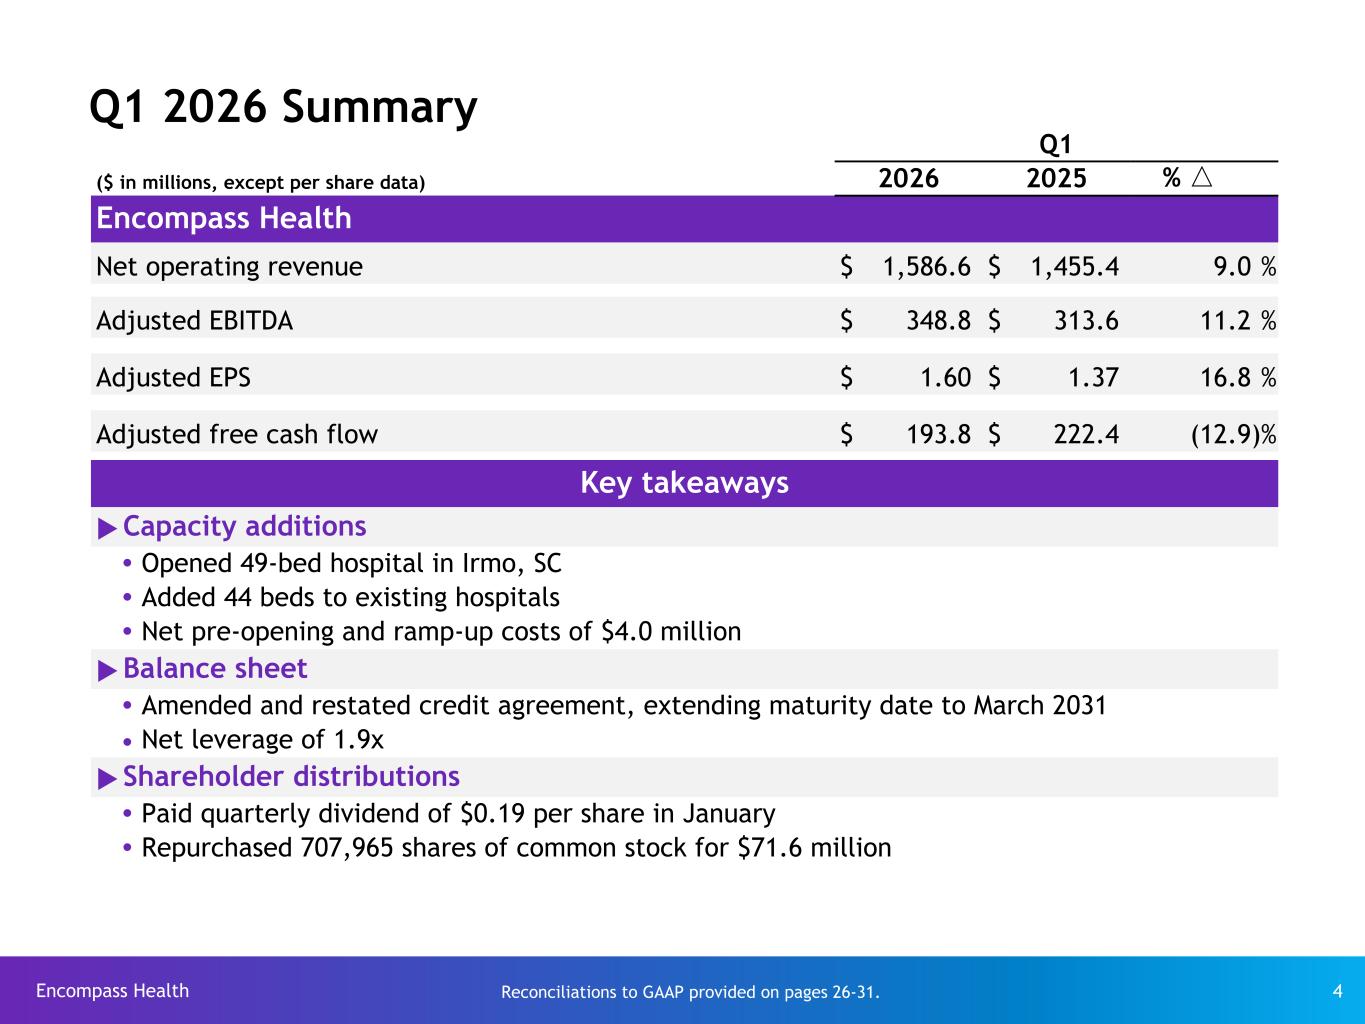
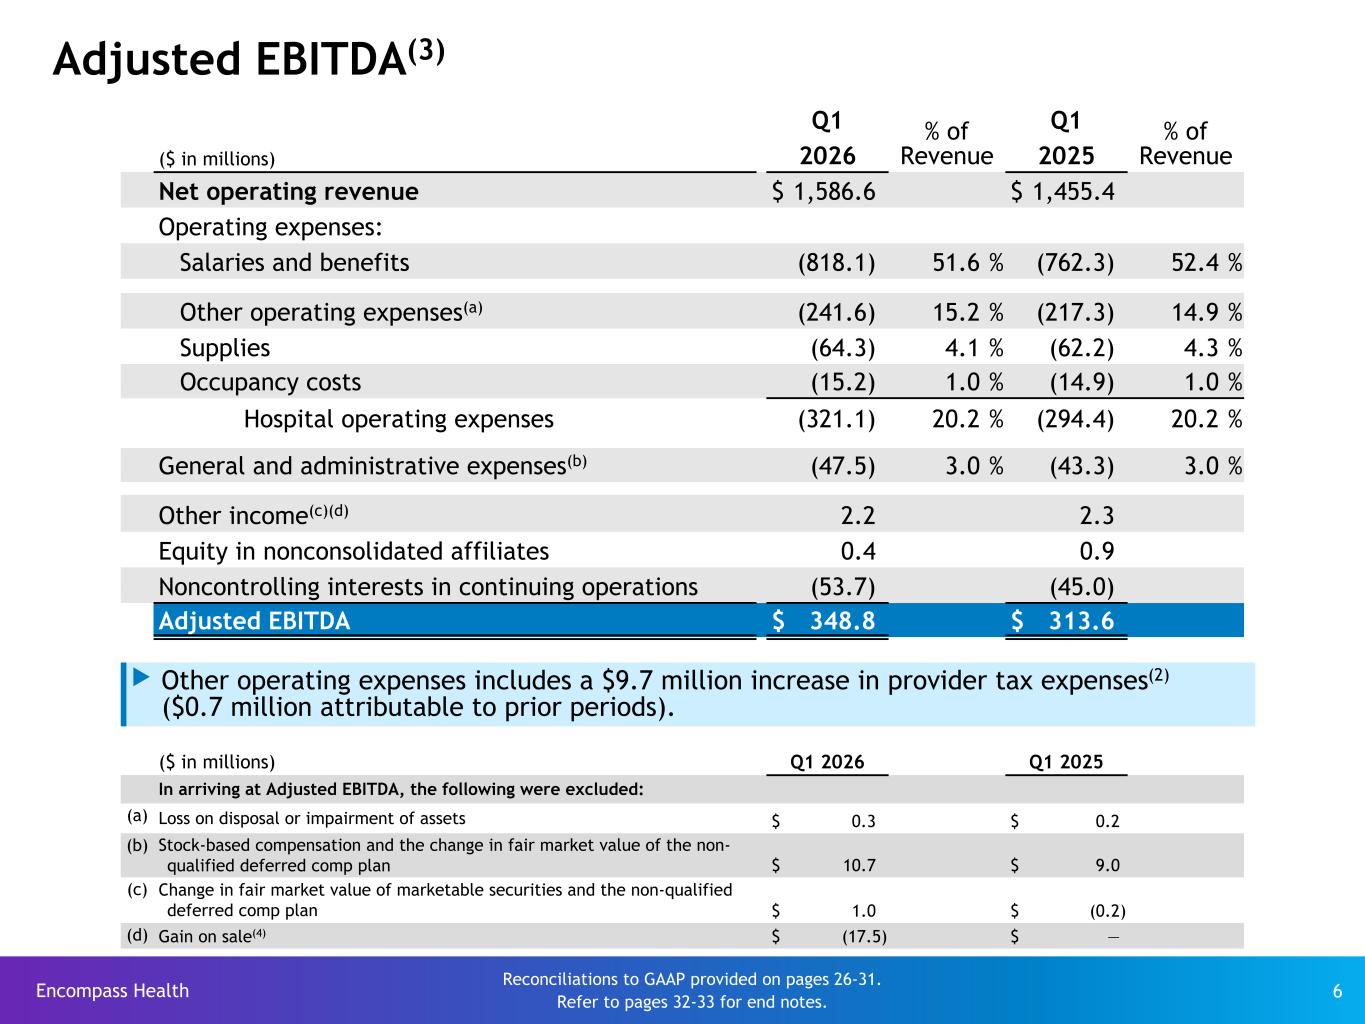
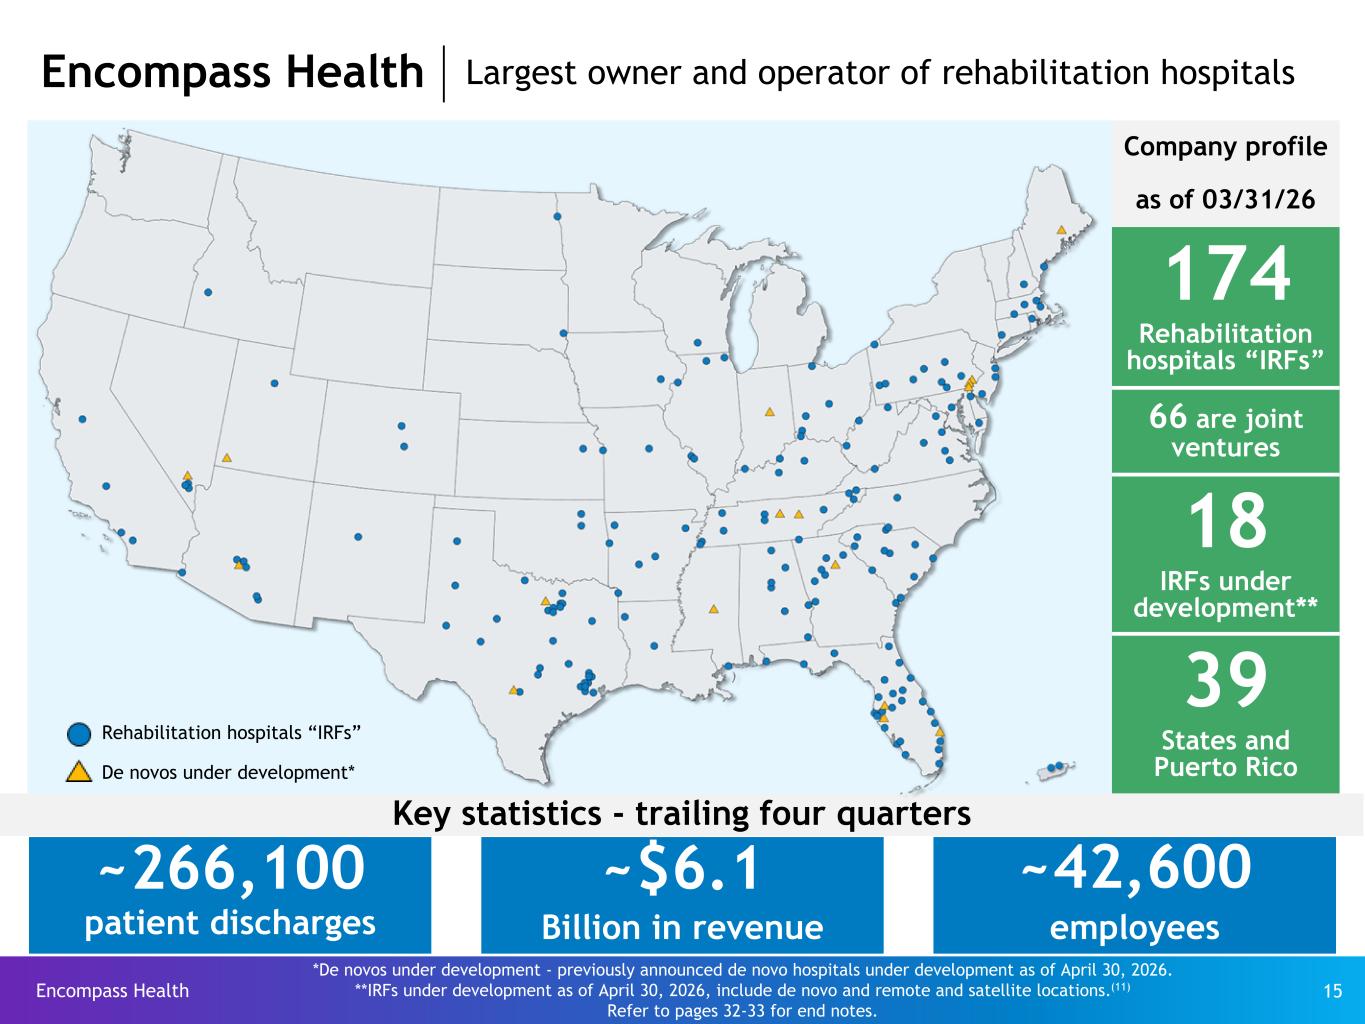
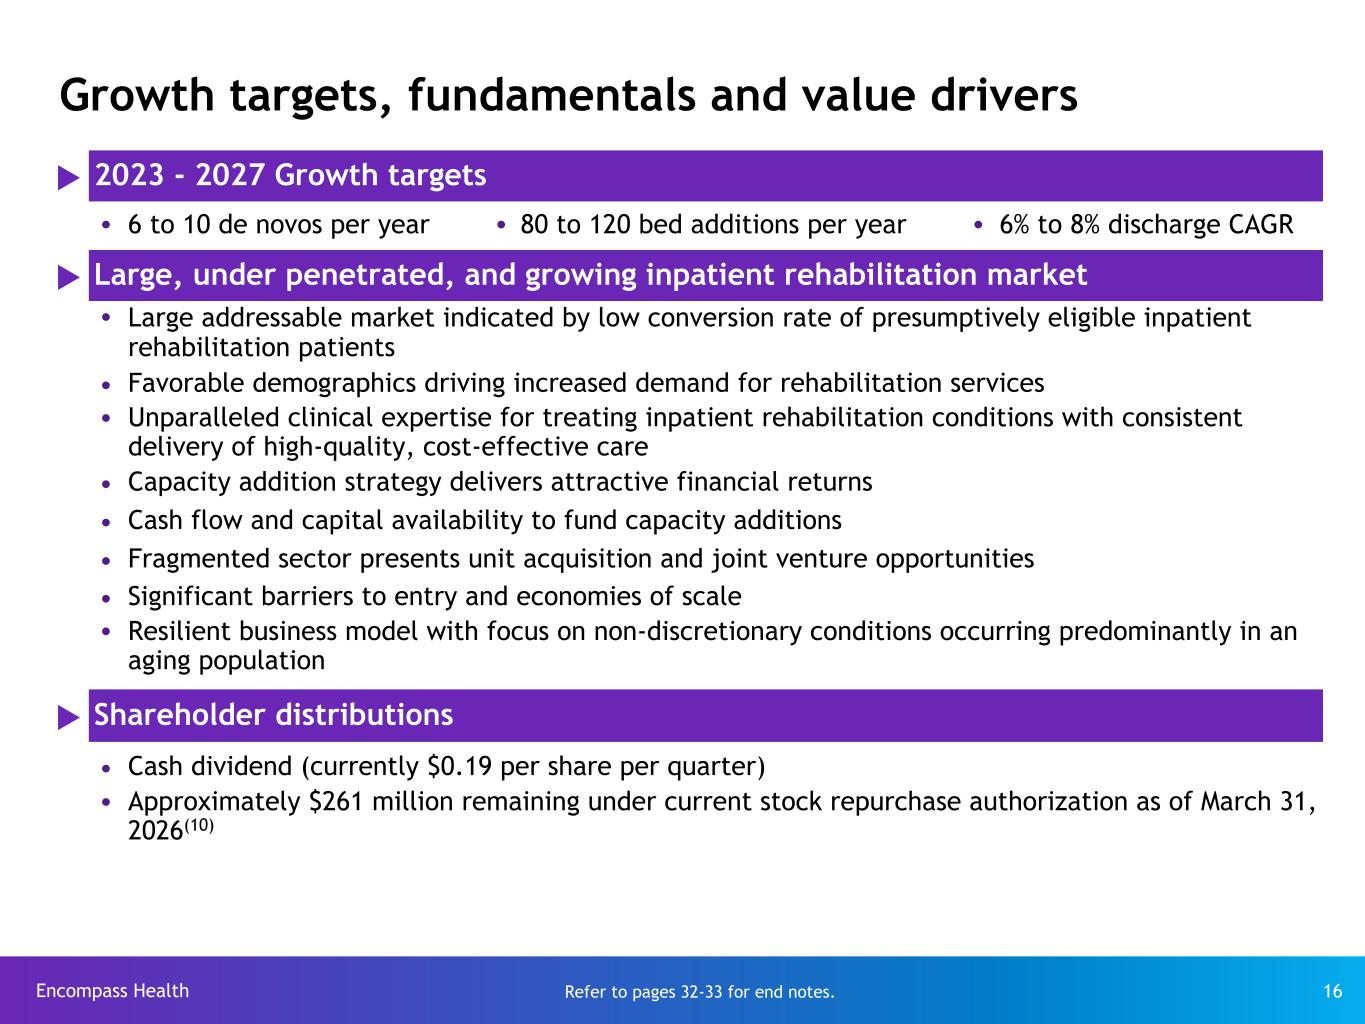
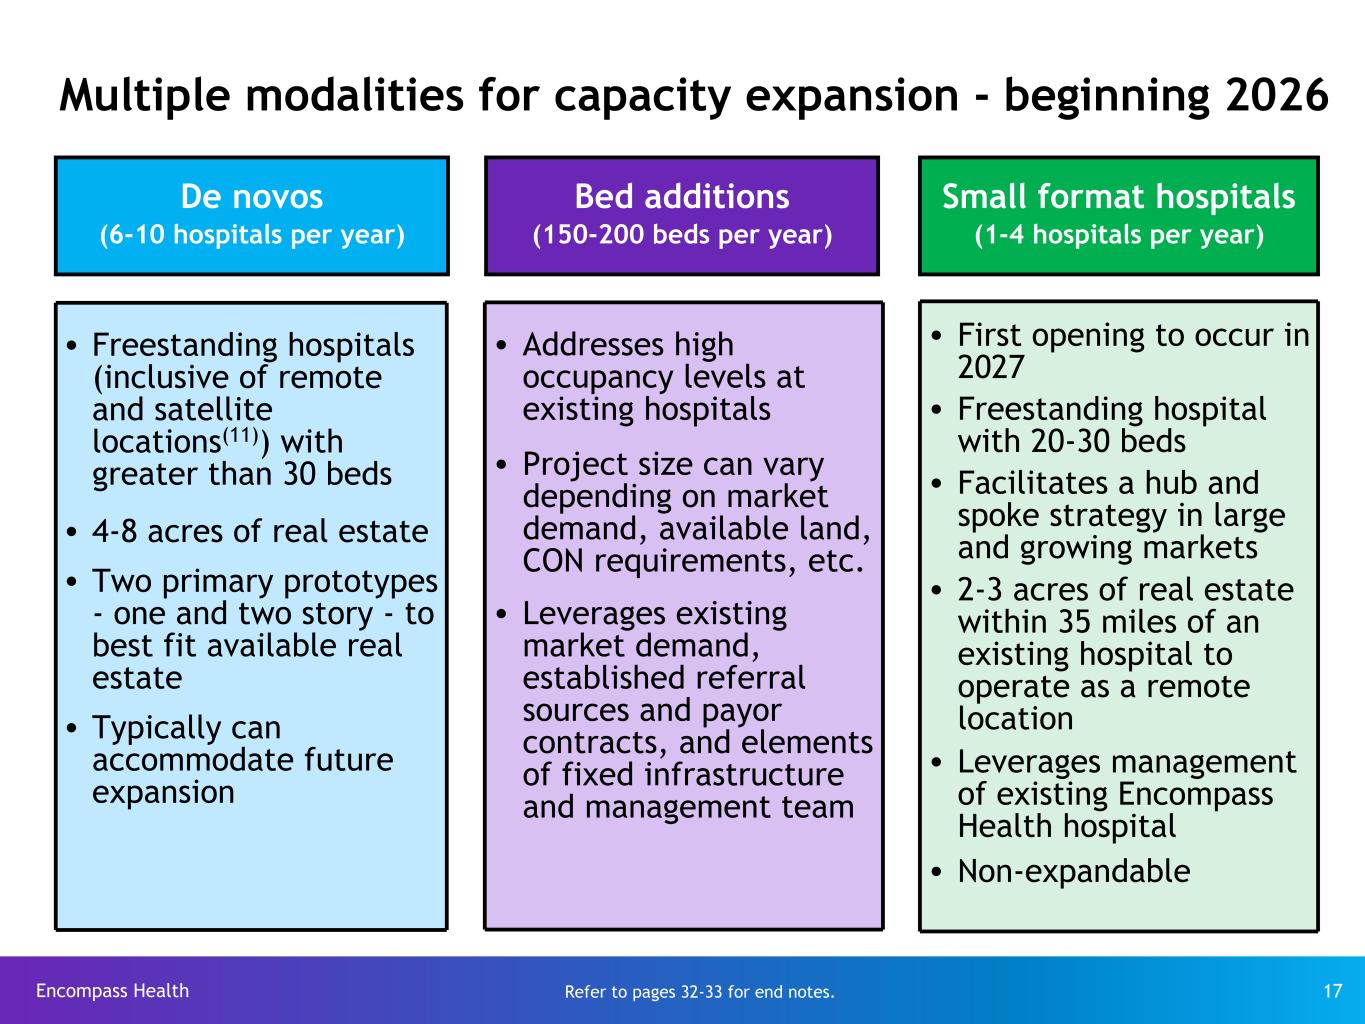
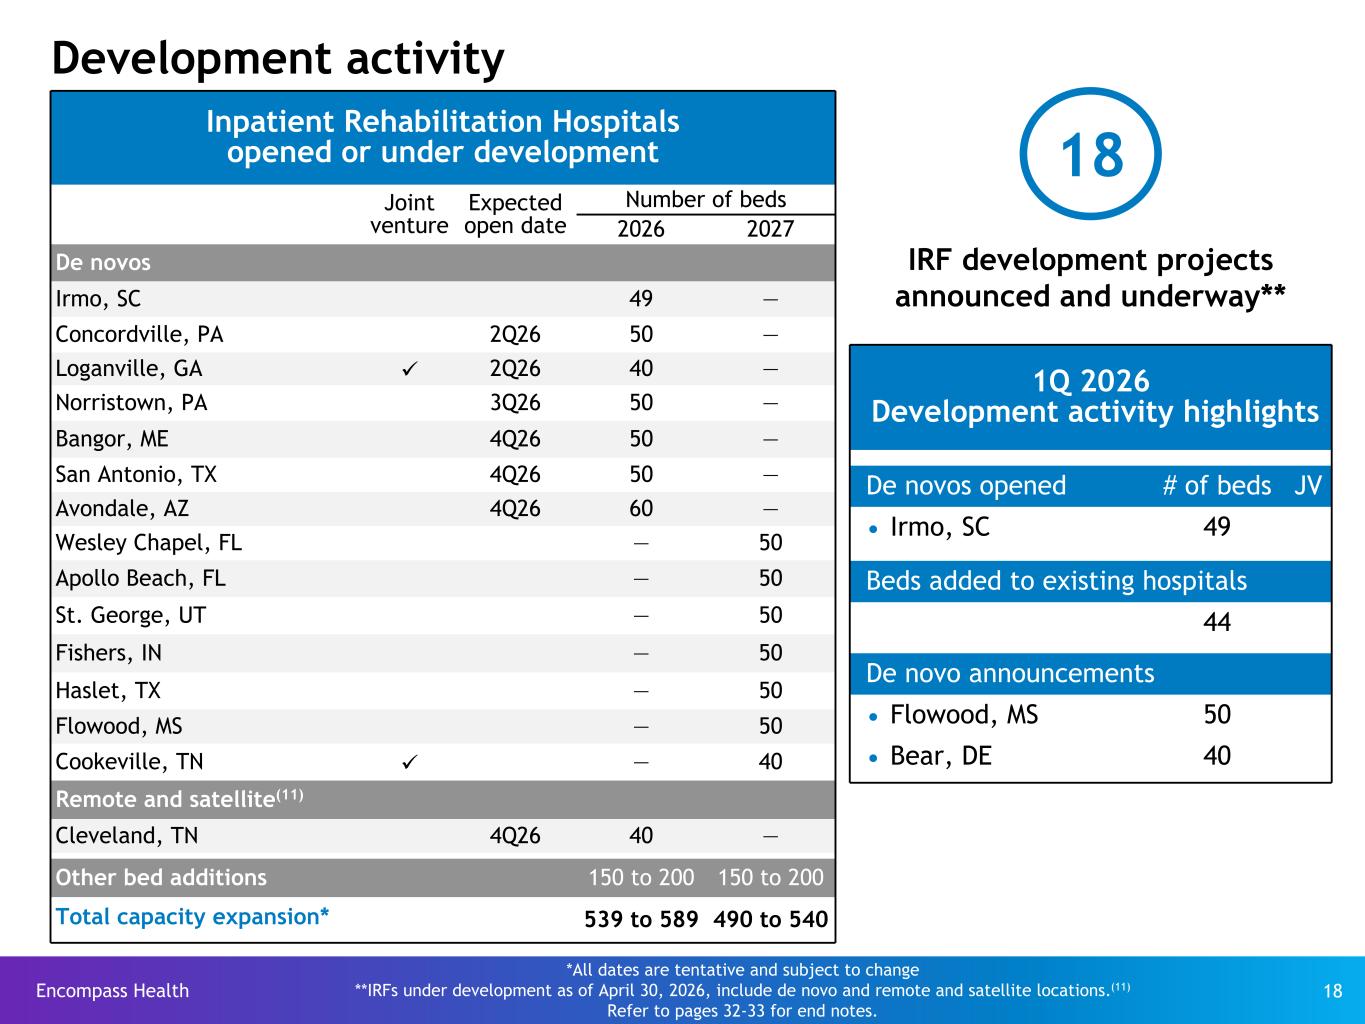
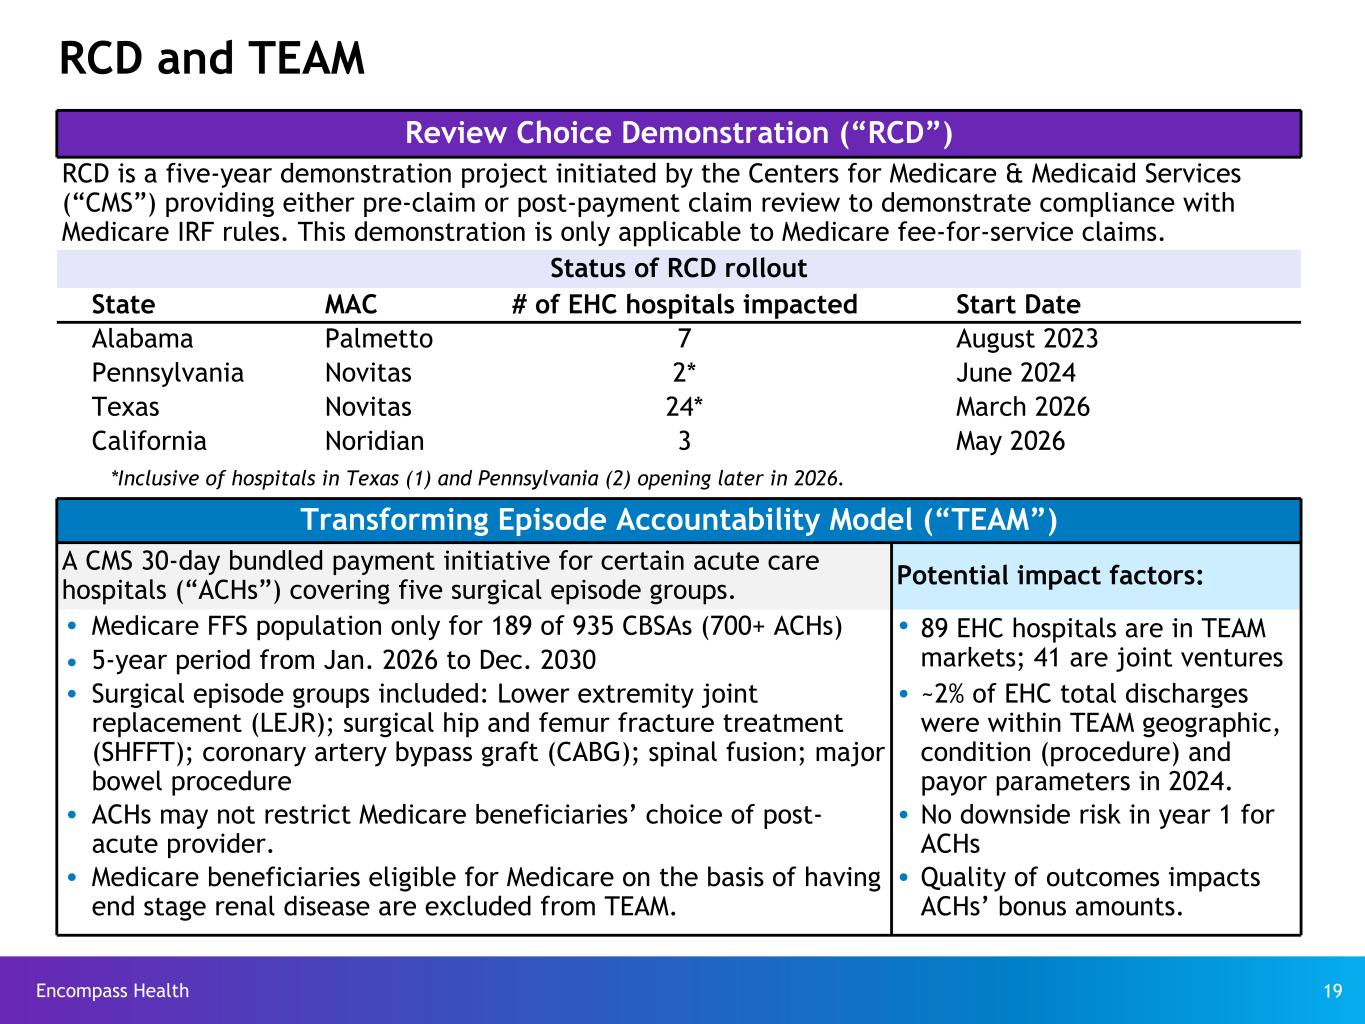
We are pleased with our start to 2026. As first quarter revenue increased 9% and adjusted EBITDA increased 11.2%. Based primarily on our Q1 results, we are raising our guidance for 2026. Doug will review the details in his comments. We achieve these strong results while once again delivering outstanding patient outcomes. Compared to Q1 to 25, our discharge community rate improved 50 basis points to 84.5 percent. Our discharge acute rate improved 30 basis points to 8.6 percent and our discharge SNF rate improved 20 basis points to 6.2 percent. Our performance on each of these quality metrics exceeds the industry average. We continue to invest in our clinical staff by providing professional growth and development programs such as our career ladder programs, providing nurses with support to attain certified rehabilitation RN certifications, and offering in-house continuing education opportunities. We've seen increased participation in and benefits from these development programs. We believe our success in these programs contributes to the continuing improvement in our clinical staff turnover trends. Q1 26 annualized RN turnover was 17.8% down from fiscal year 25's 20.2% and annualized therapist turnover was 6.4% down from last year's 7.8%. This represents our lowest RN turnover rate since at least 2012 and helped drive a 9.4% decline in premium labor spend compared to Q1 of 2025. We also believe that our clinical advancement programs and reduced clinical staff turnover further enhance our abilities to serve high acuity medically complex patients and increase patient satisfaction scores. Demand for IRF services remain strong and we are continuing to invest in capacity additions to meet the needs of patients requiring inpatient rehabilitation services. In Q1, we opened a new 49-bed hospital in Irmo, South Carolina, our 11th hospital in that state. We also added 44 beds to existing hospitals. Over the balance of the year, we plan to open seven more hospitals with a total of 340 beds and add an incremental 100 to 150 beds to existing hospitals we continue to build and maintain an active pipeline of new hospital development projects both wholly owned and joint ventures while also executing on bed expansion opportunities as dictated by occupancy trends and market dynamics our pipeline of announced new hospital projects with opening dates beyond 2026 currently consists of 11 hospitals with 520 beds and we anticipate additional projects including small format hospitals will be announced over the balance of the year we have previously discussed the innovation of our small format hospital which will serve to facilitate a hub and spoke strategy in large and growing markets. We're confident we will open at least one small format hospital in 2027 with the potential to add more depending on the timing of pending real estate transactions. Small format hospitals will operate as remote locations under the same medicare provider number as an existing in-market hospital and will share certain administrative services with that hospital small format hospitals will complement our existing de novo and bed expansion strategies this is a particularly active year on the regulatory front with inflammation of team beginning on january 1st and the expansion of rcd into texas effective to March 1st and California beginning today. We will work to address these developments as we have the numerous other regulatory challenges we have successfully navigated in the past through extensive preparation and proactive refinements of our operations. This is not to say that we will be immune from short-term transitory impacts to our business. Nonetheless, the fact remains that demand for inpatient rehabilitation services remains considerably underserved and is growing as the U.S. population continues to age. We are uniquely positioned to address this important societal need. On April 2nd of this year, CMS released the 2027 IRF proposed rule. The proposed rule included a net market basket update of 2.4%, which we estimate would result in a 2.4% pricing increase for our Medicare patients beginning October 1, 2026. We expect the IRF final rule to be released in late July or early August. With that, I'll turn it over to Doug.
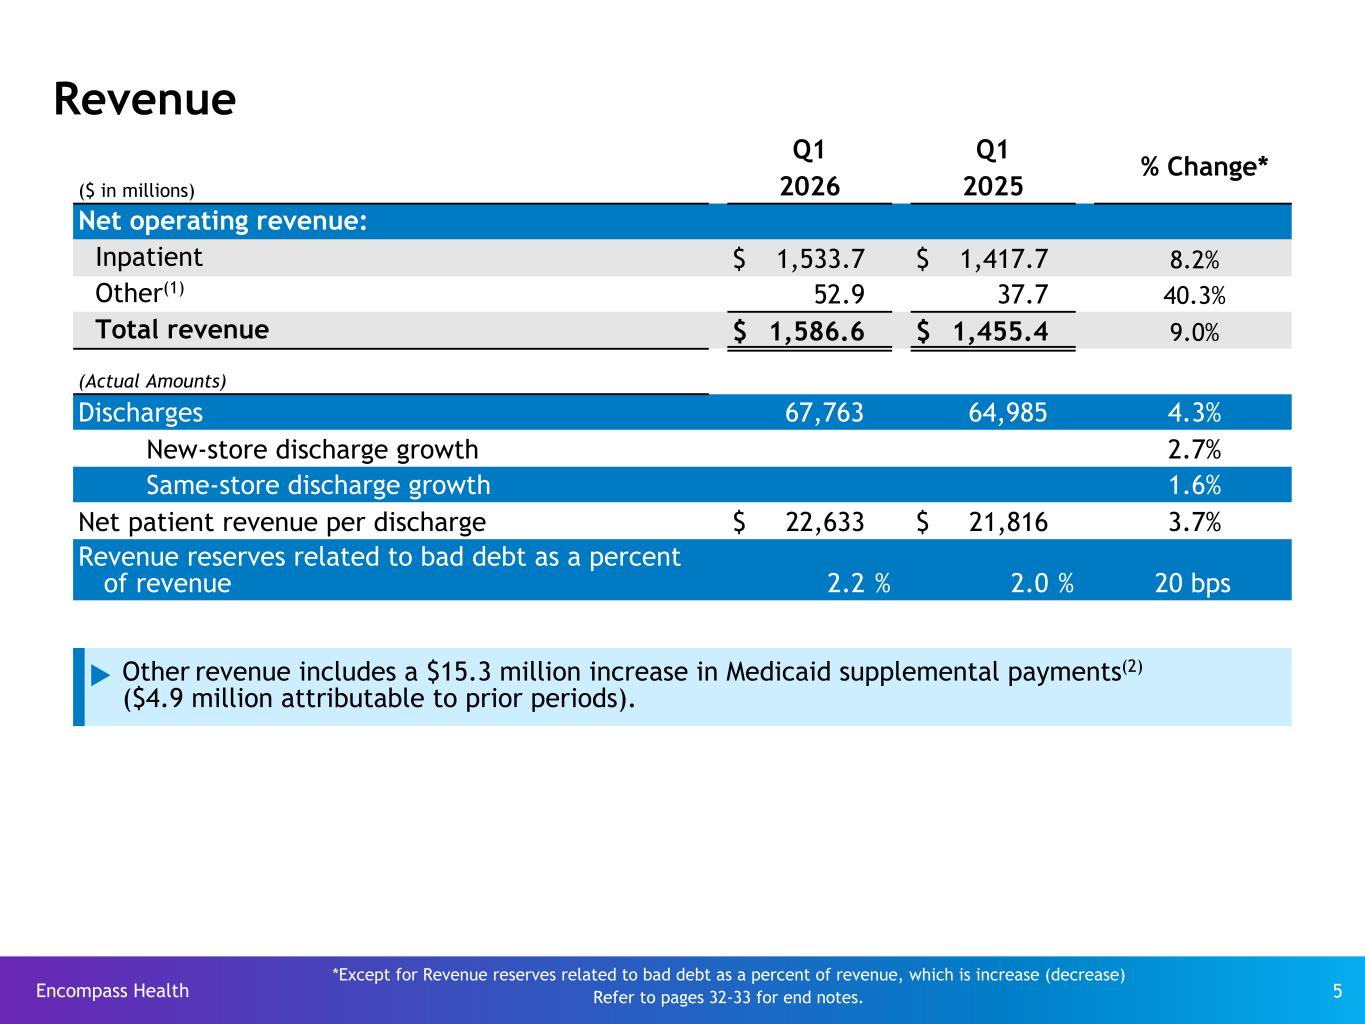
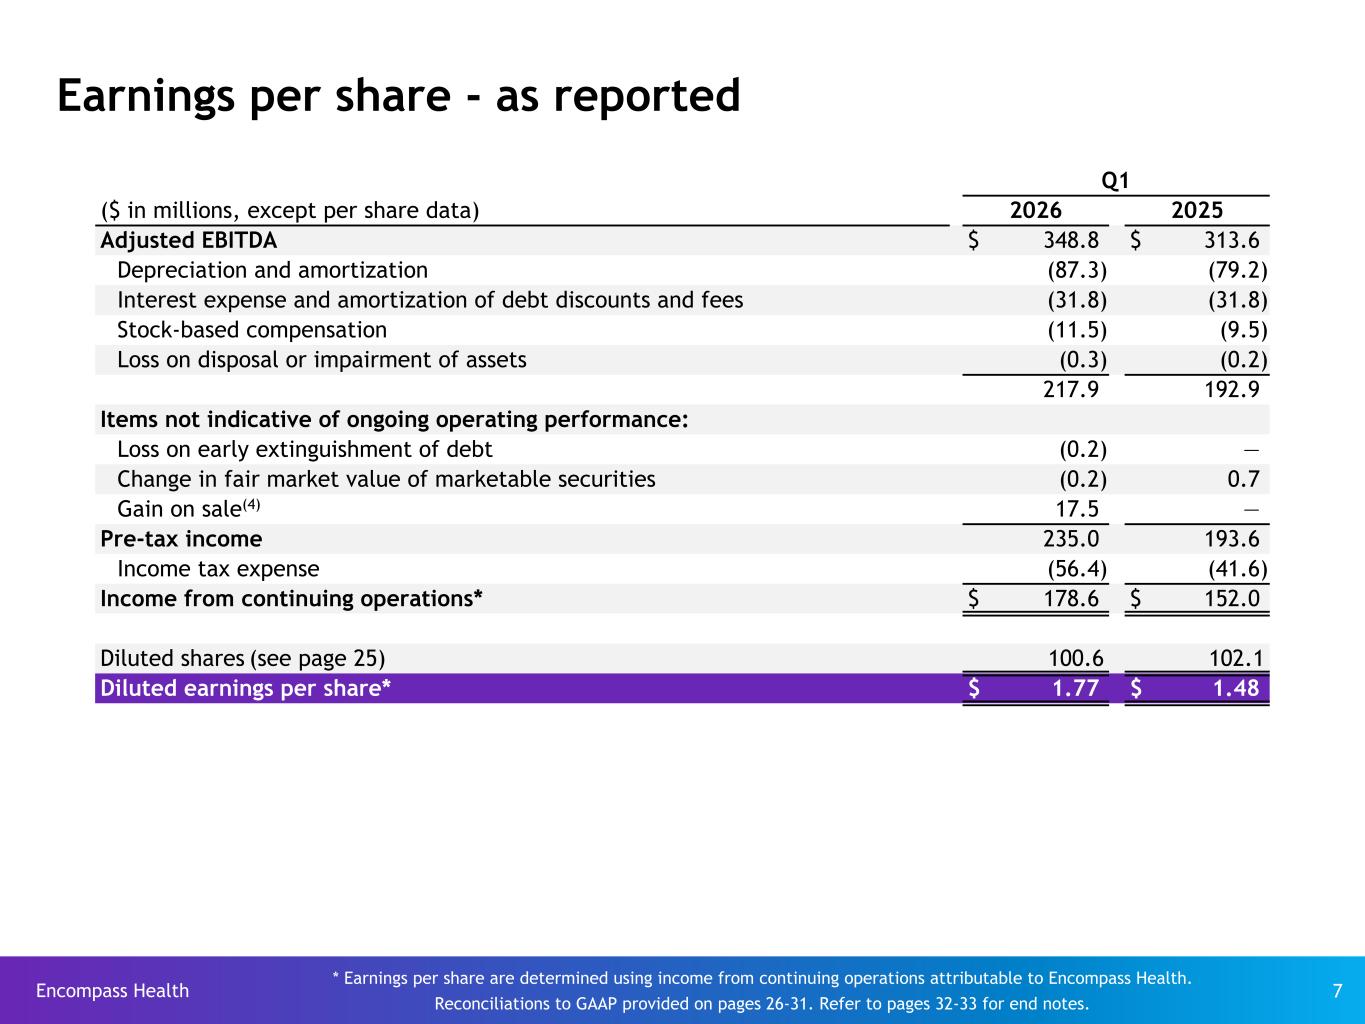
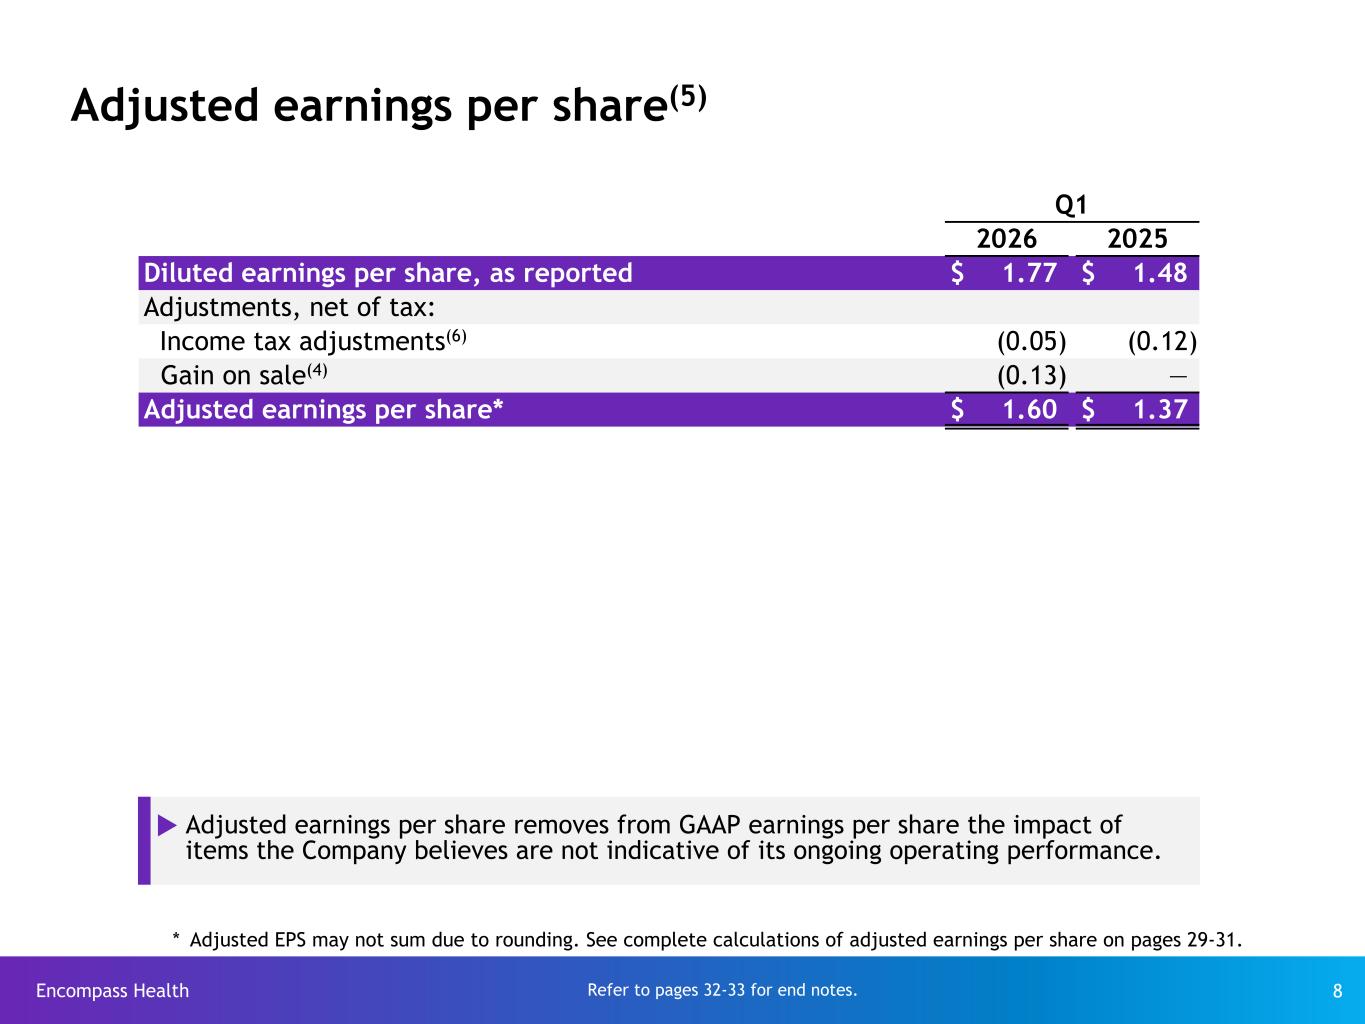
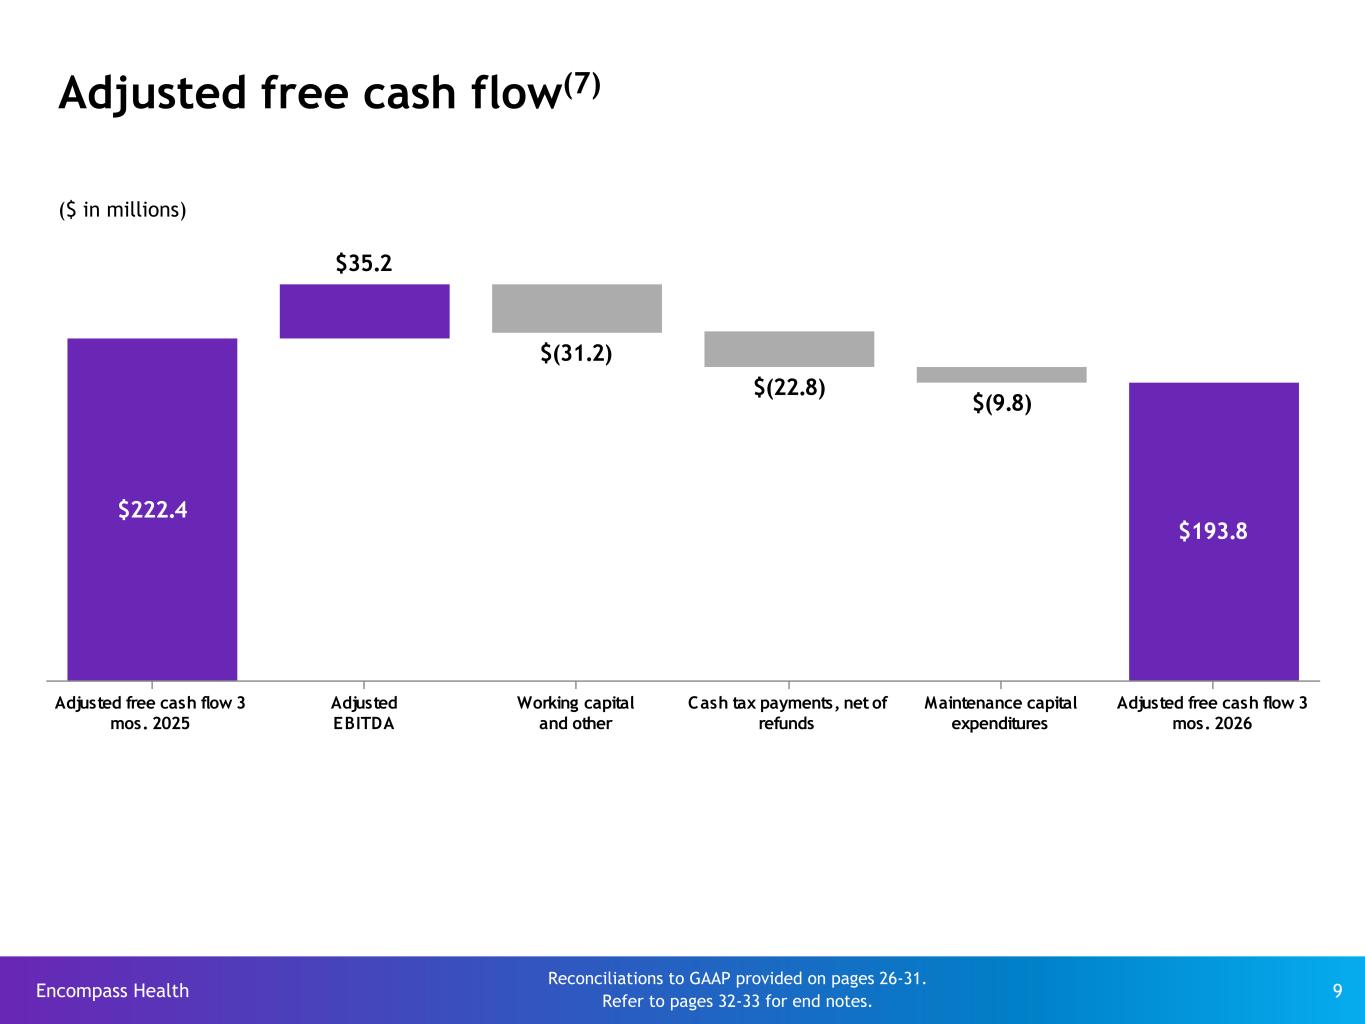
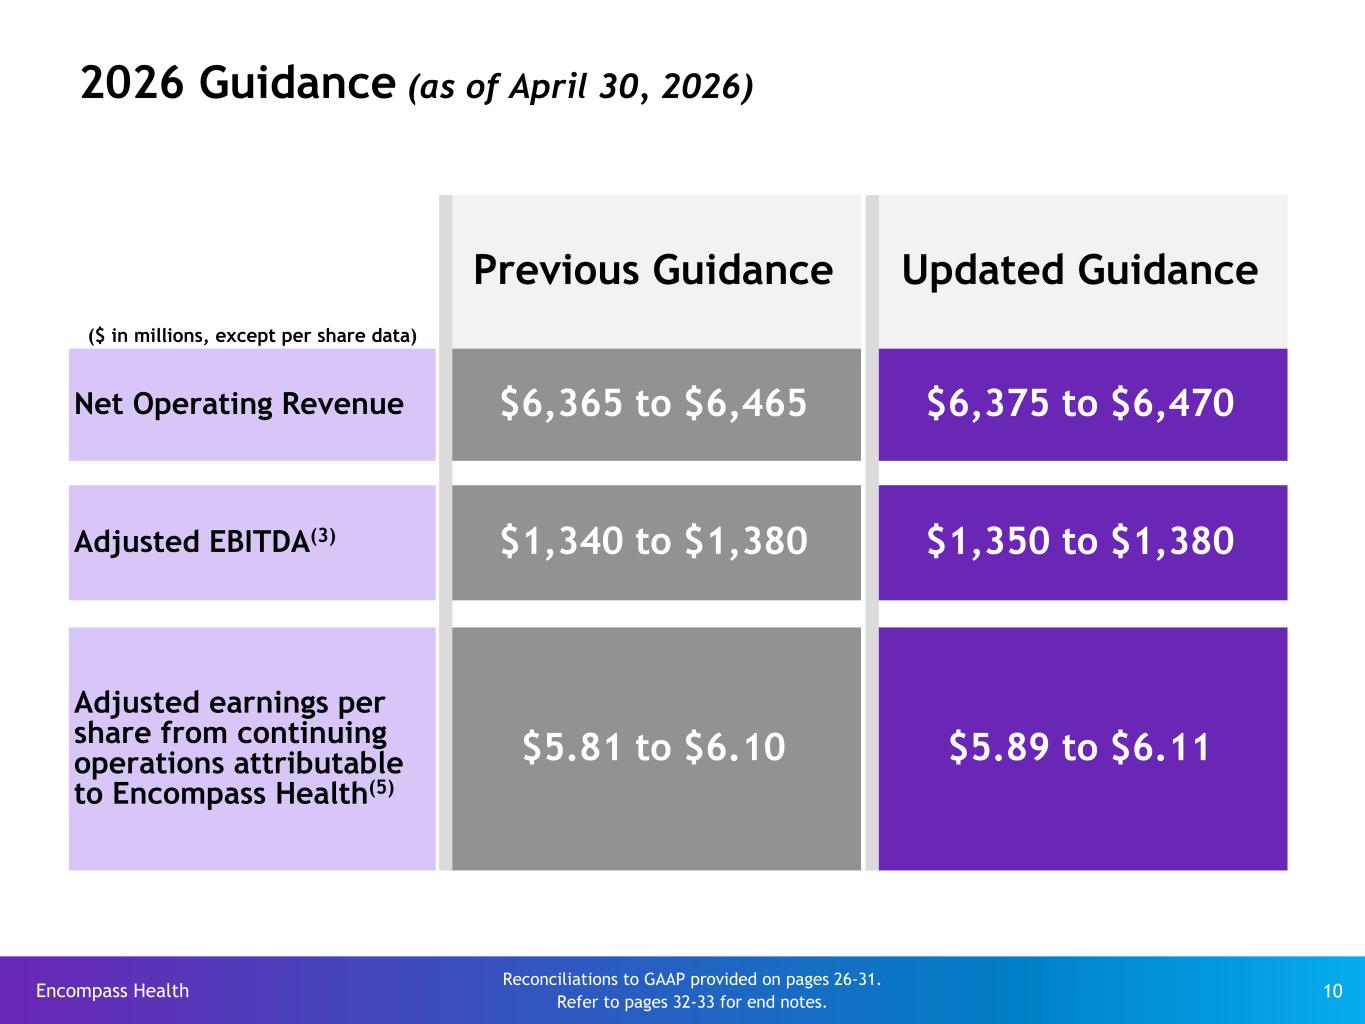
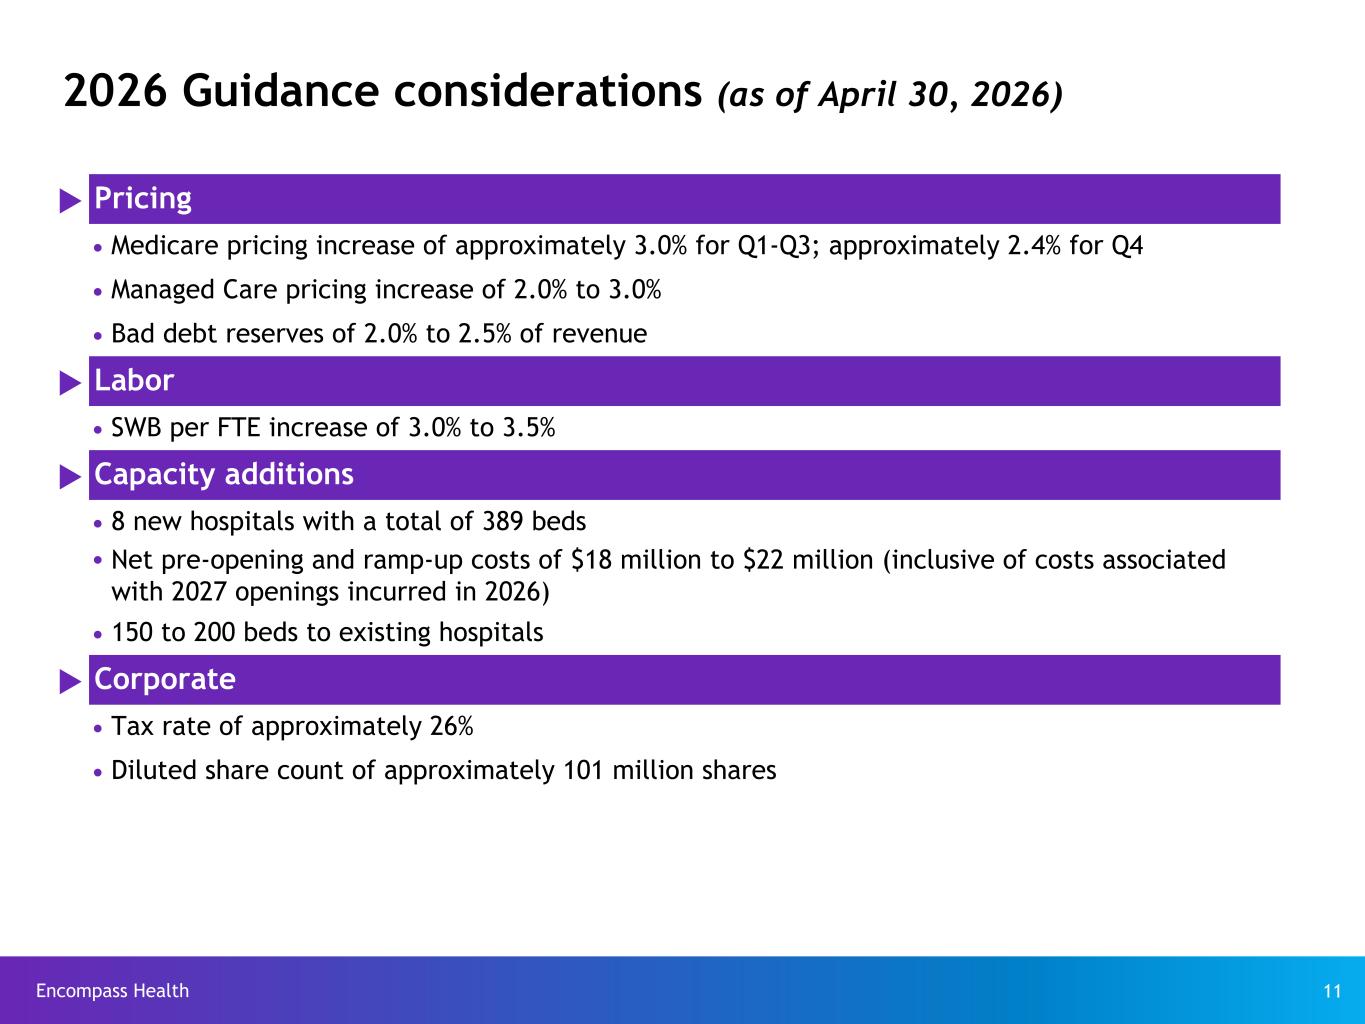
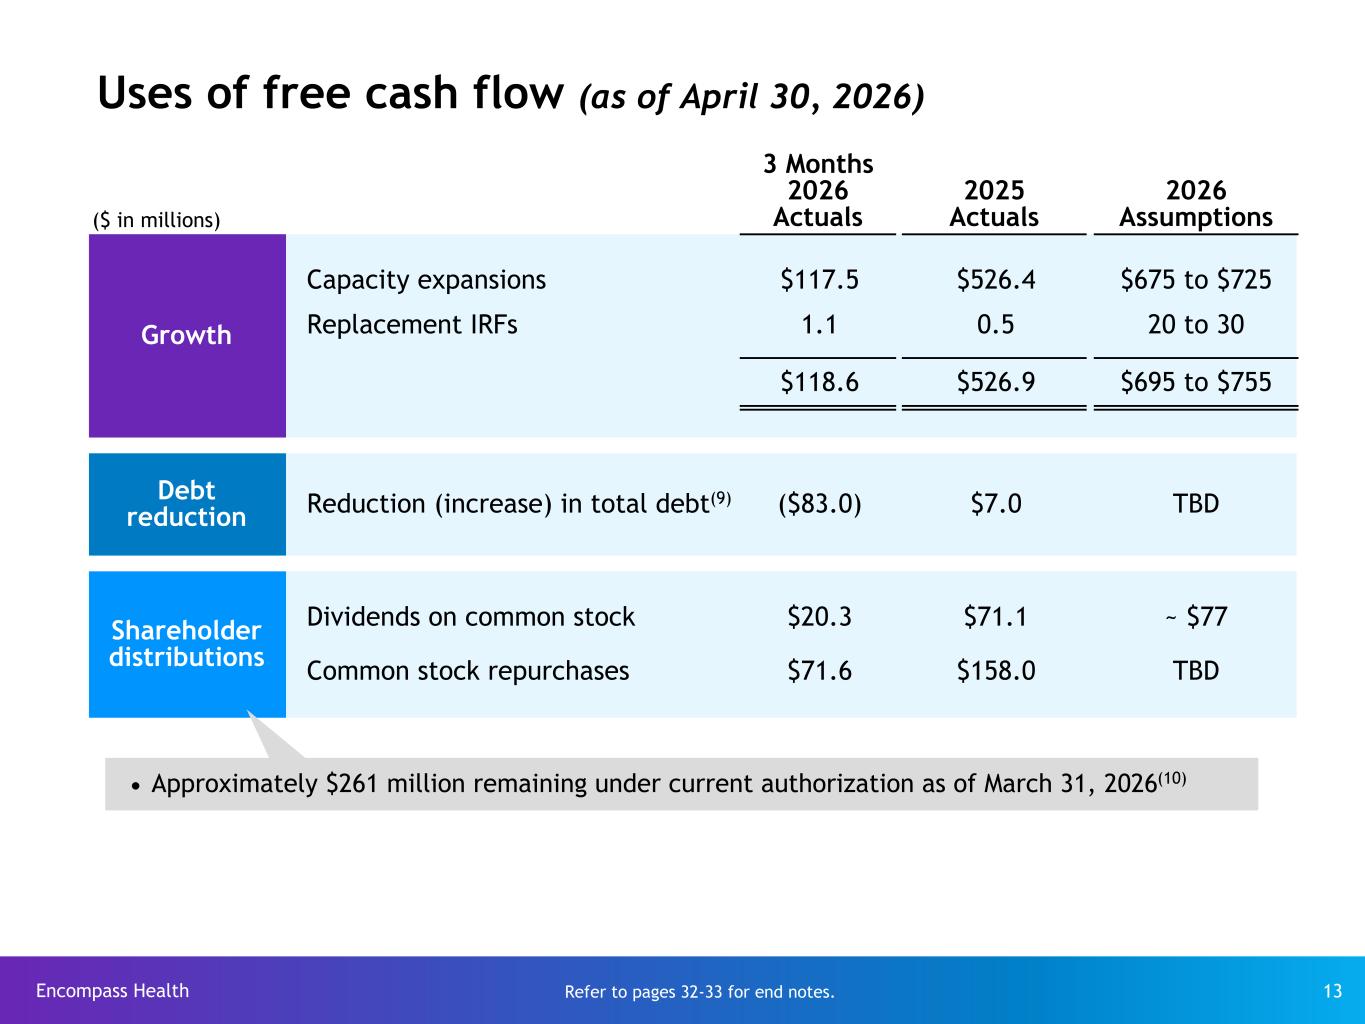
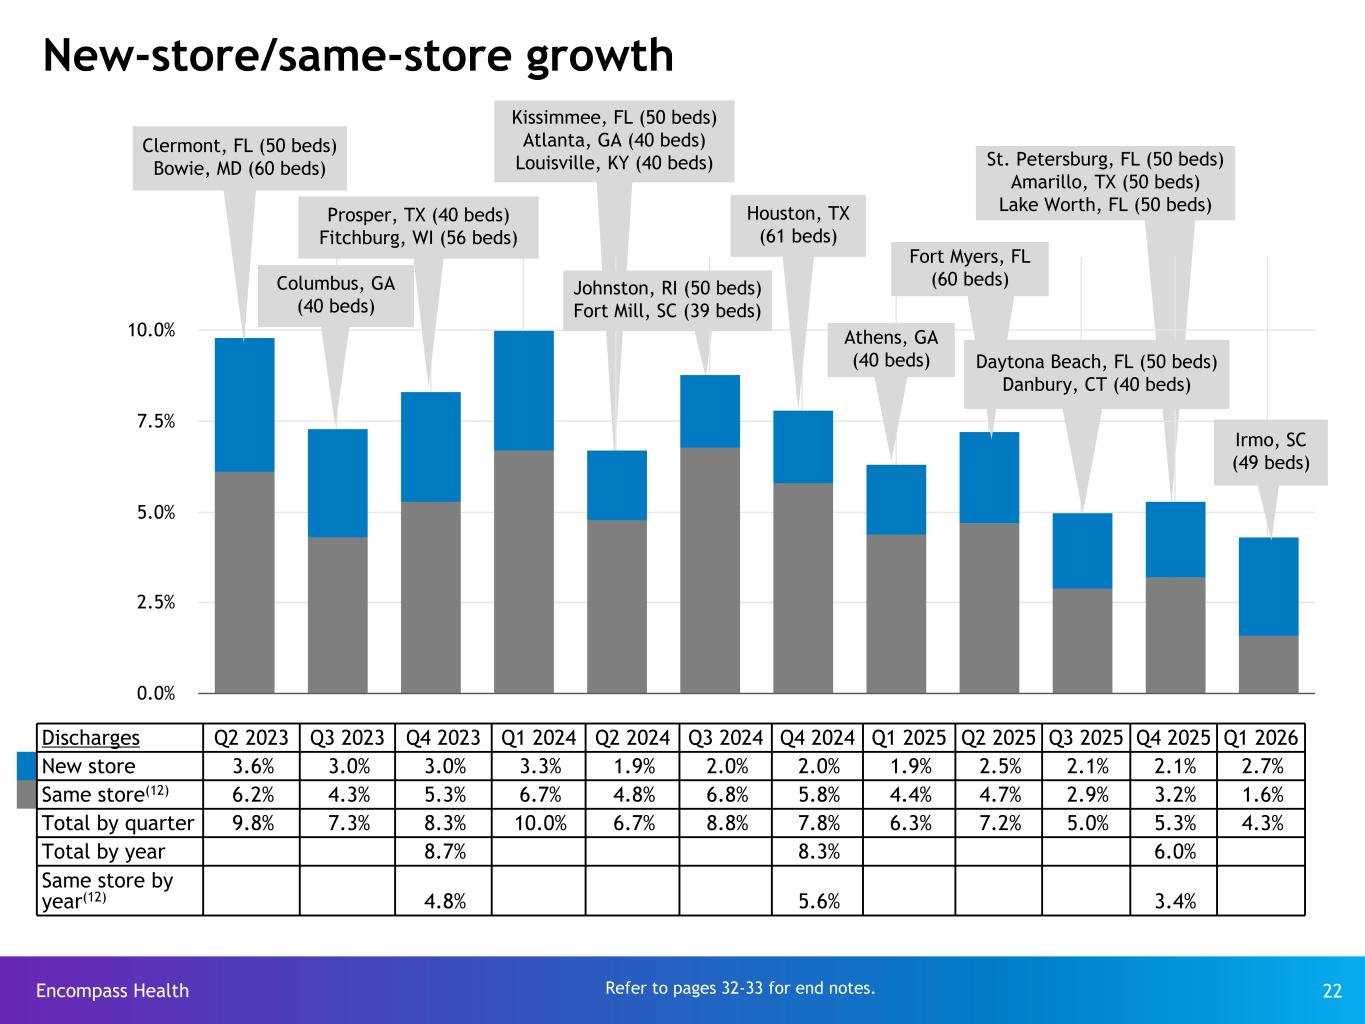
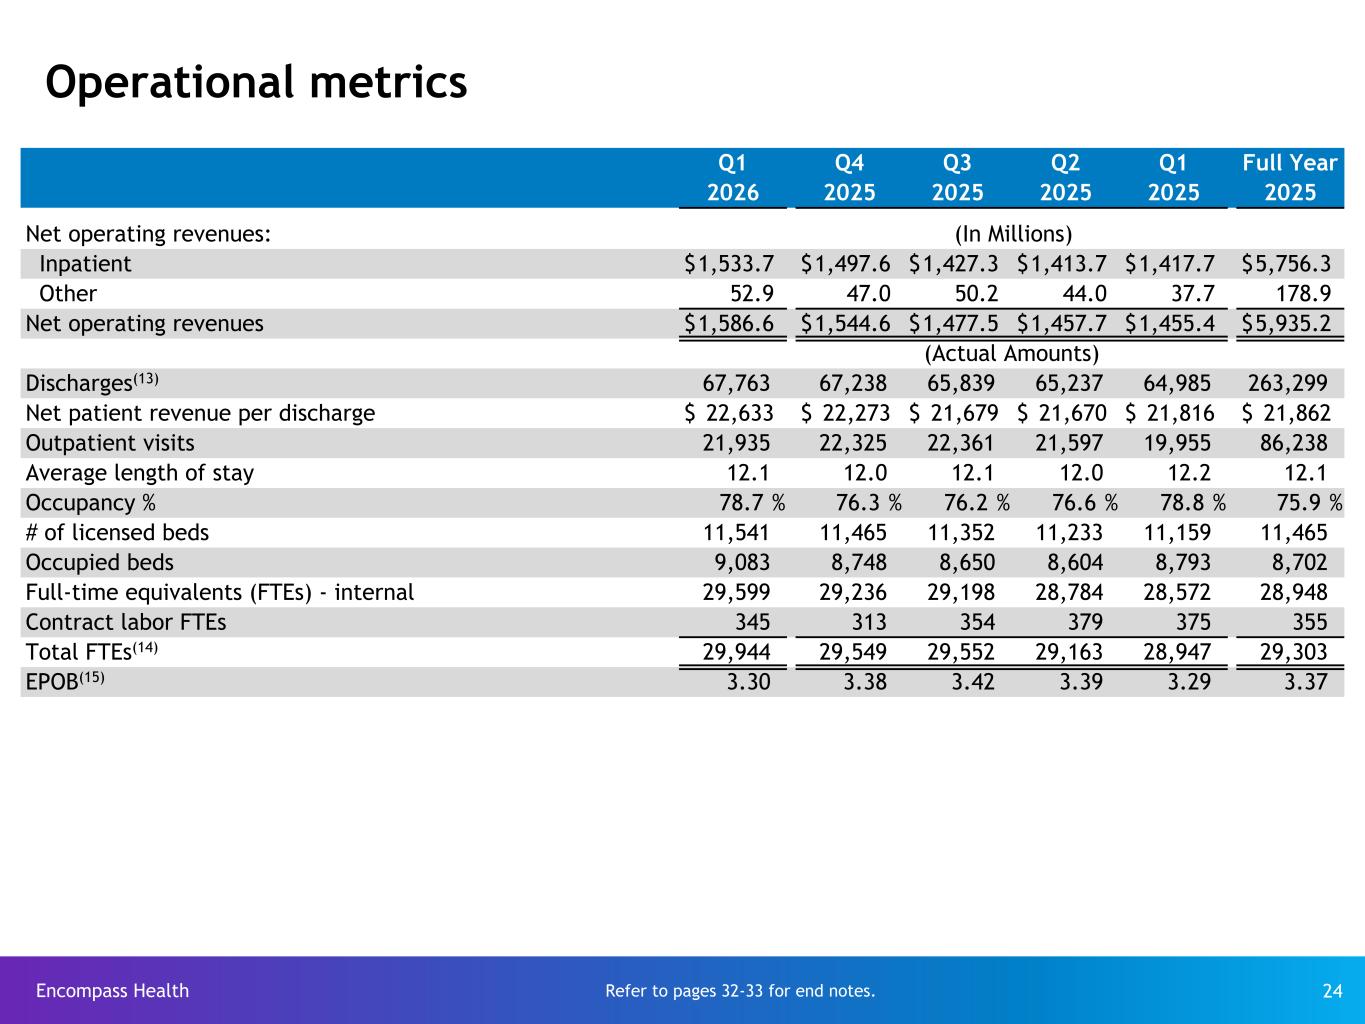
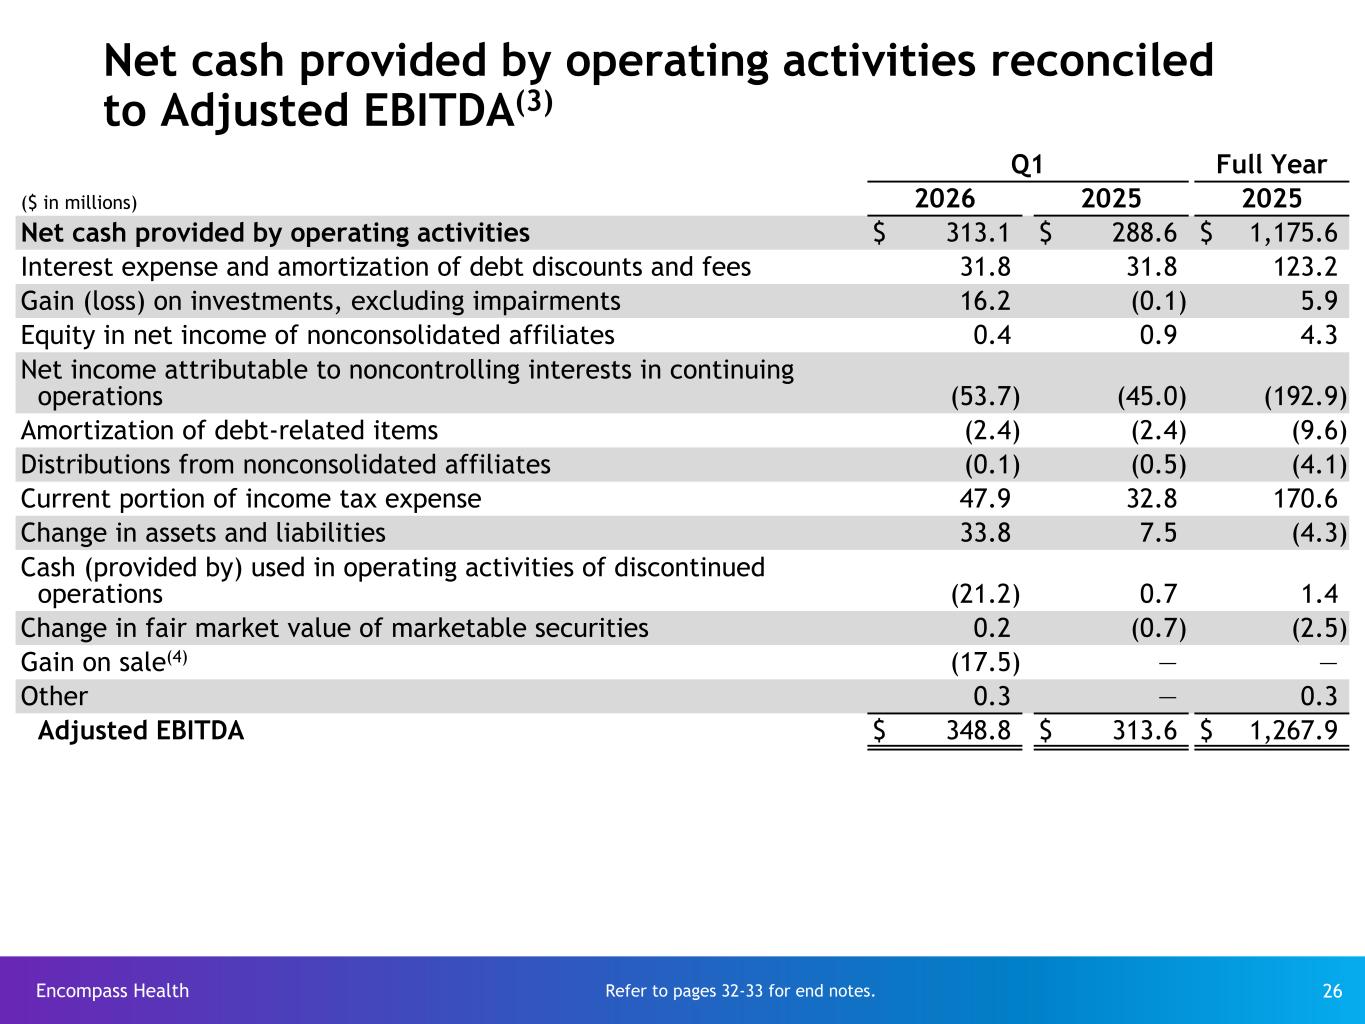
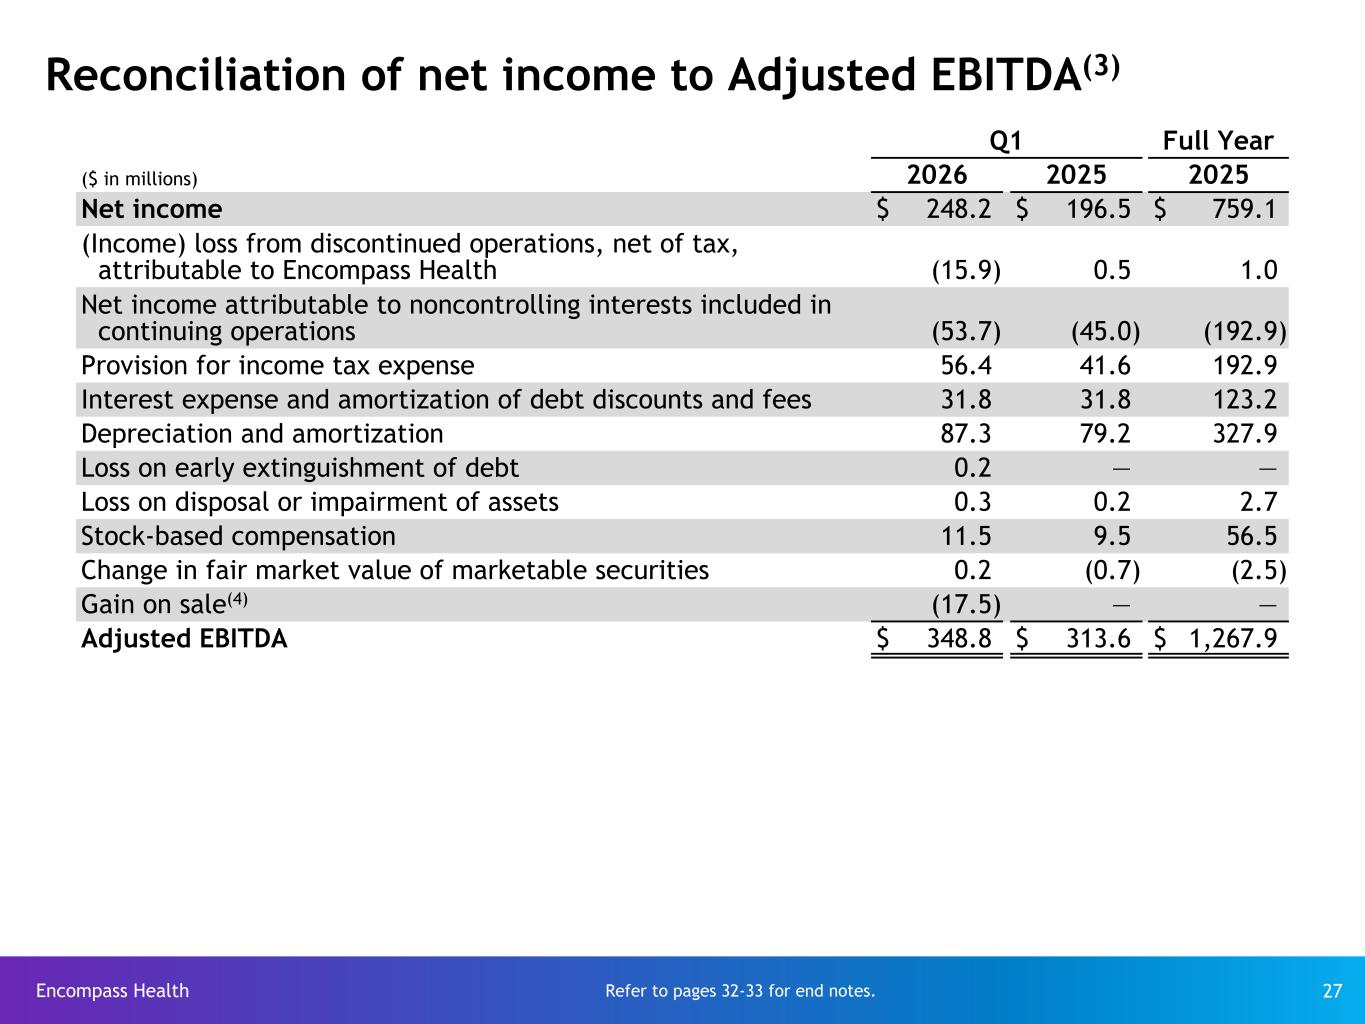
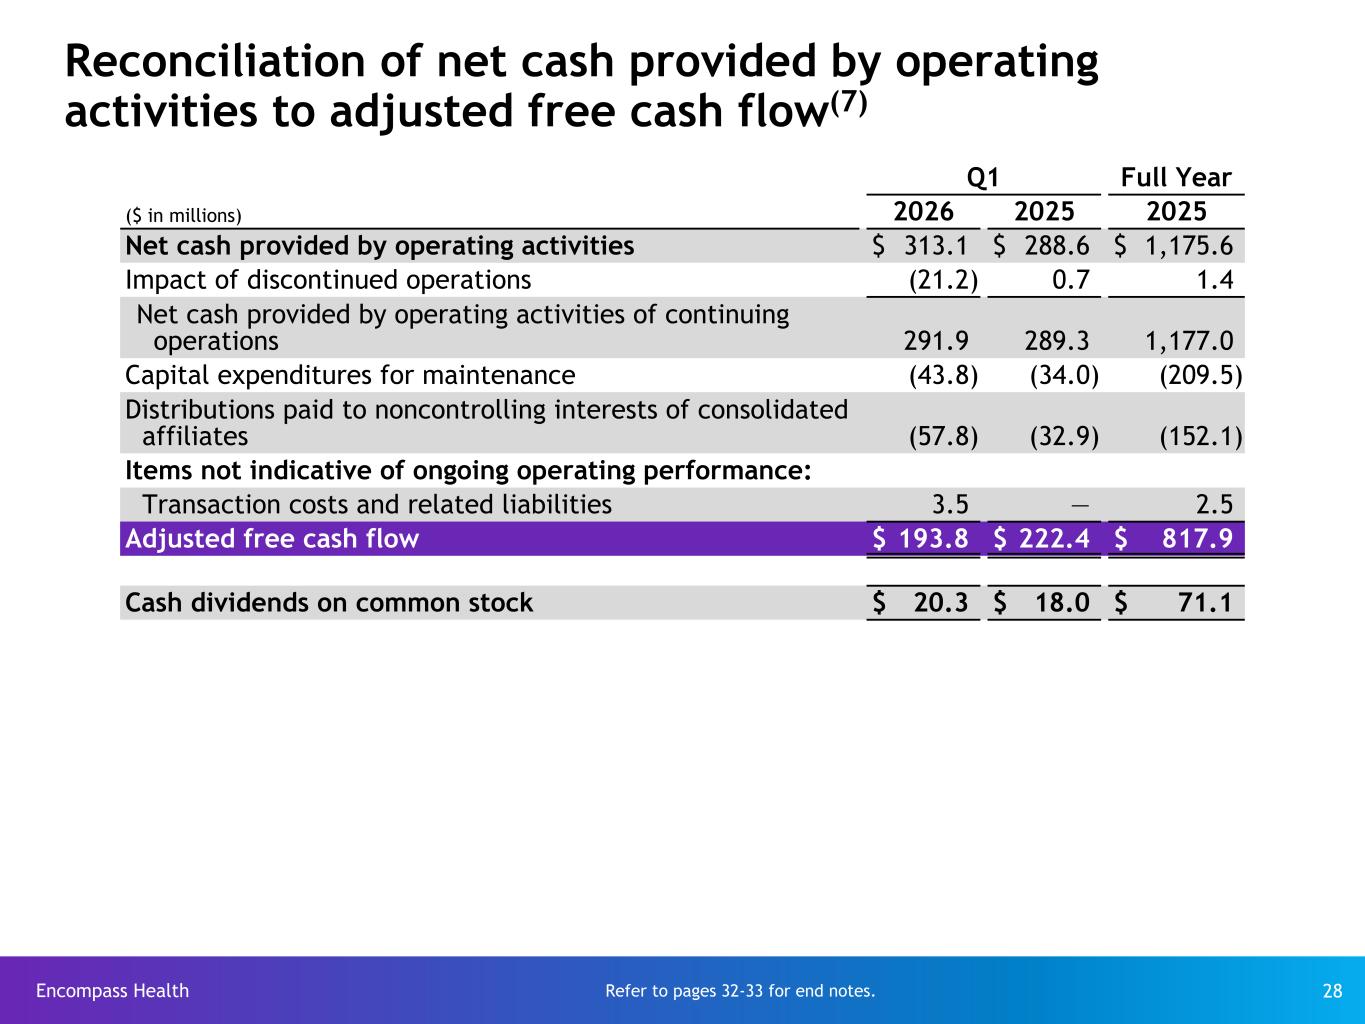
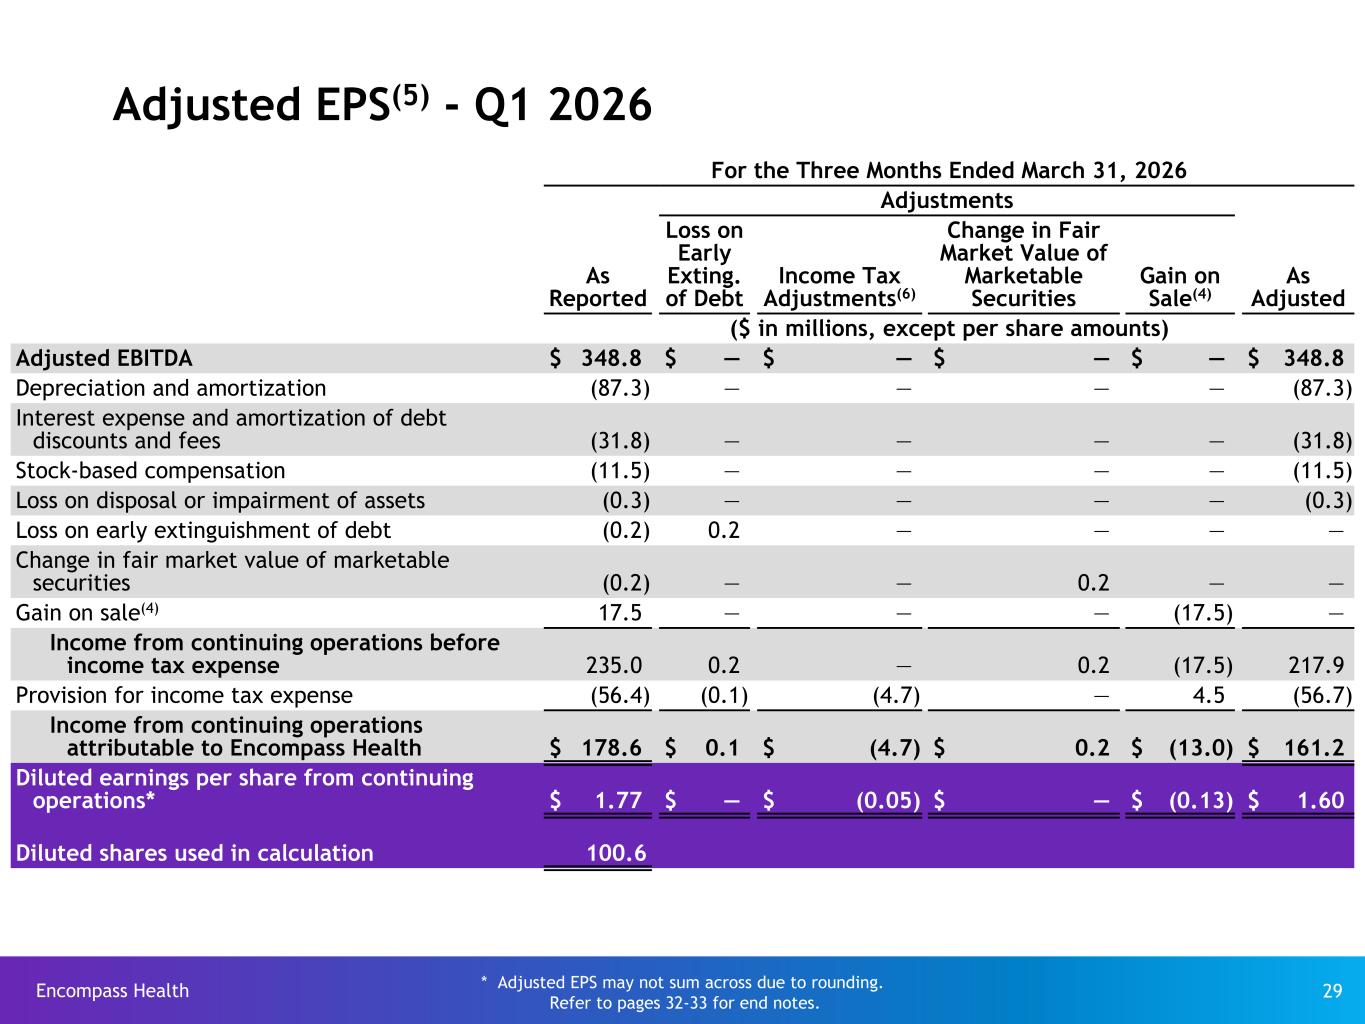
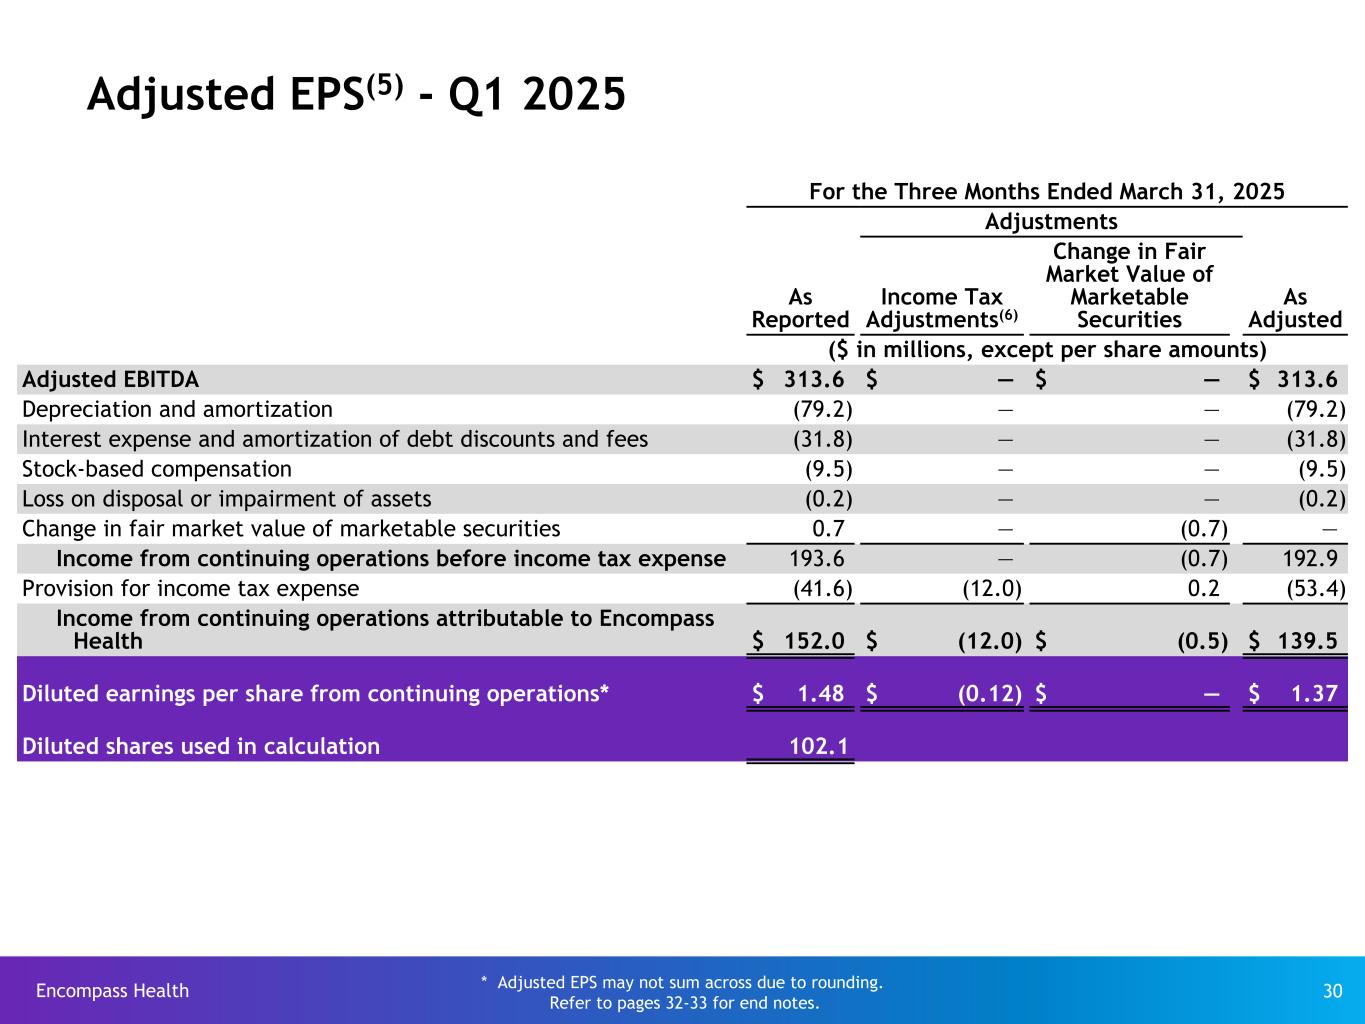
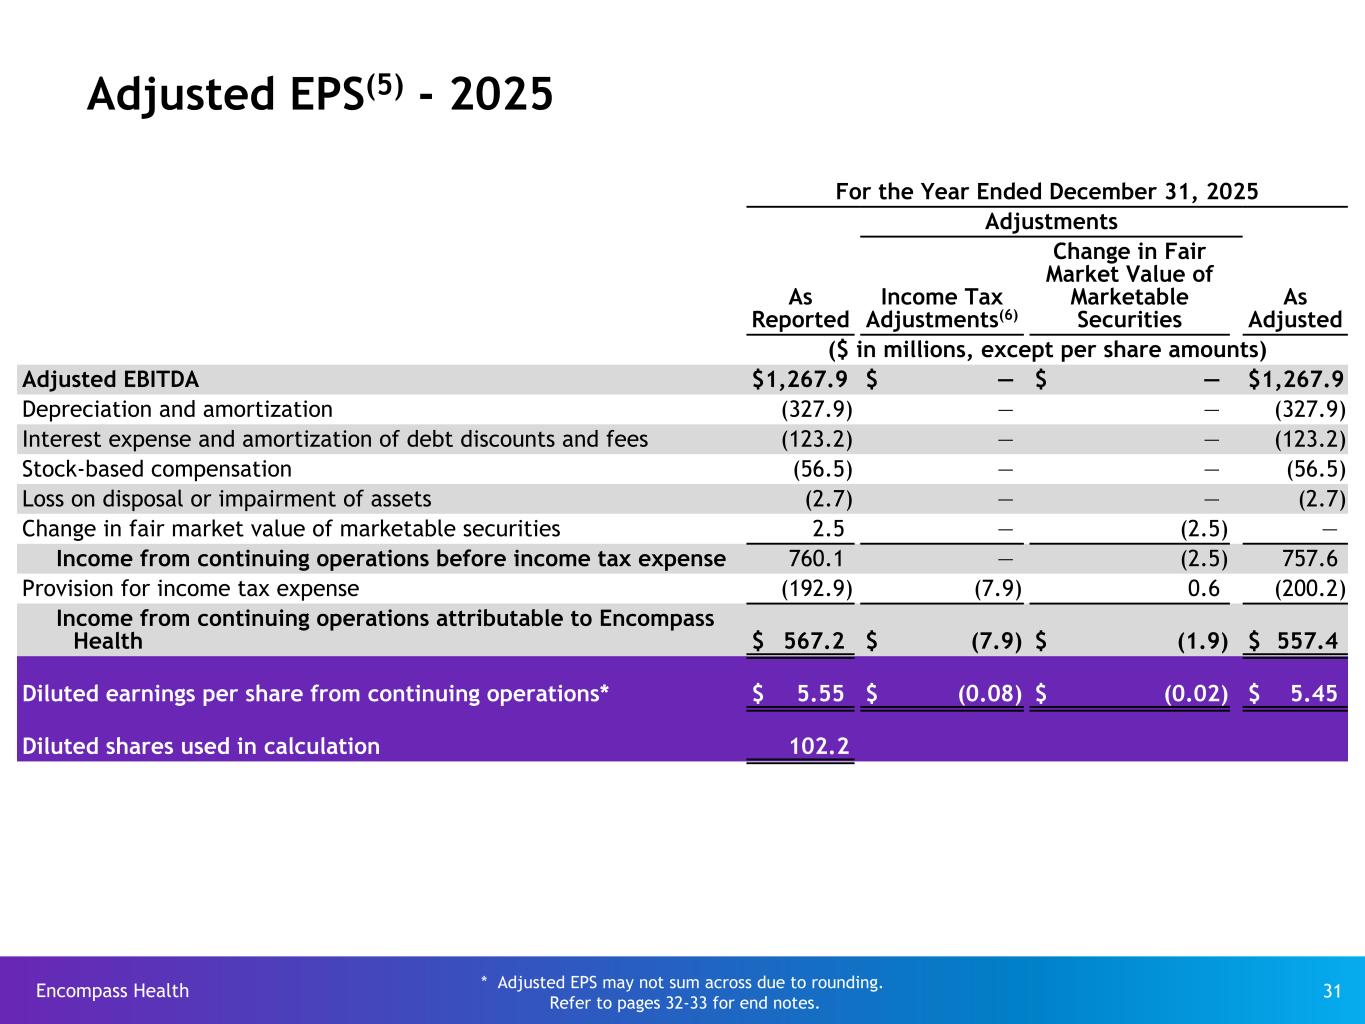
Thank you, Mark, and good morning everyone. Q1 revenue increased 9% to $1.59 billion, and adjusted EBITDA increased 11.2% to $348.8 million. The revenue increase was comprised of 4.3% discharge growth, inclusive of 1.6% same-store discharge growth, and a 3.7% increase in net revenue per discharge. Net revenue per discharge growth benefited both from patient mix and a favorable year-over-year comparison in the annual Medicare SSI adjustment. Bad debt expense increased 20 basis points to 2.2%, primarily as a result of writing off claims from 2013 associated with a legacy audit appeal. As a reminder, since the end of Q2 2025, we have closed three IRF units hosted within acute care hospitals, as well as our lone SNP unit hosted within one of our freestanding hospitals. Together, these four units were essentially break even in terms of adjusted EBITDA. The unit closures impacted total and same store discharge growth in the quarter by approximately 85 basis points. The impact on future period discharge growth will diminish as we consolidate this volume into other proximate hospitals and as we anniversary the unit closure dates. We expect to add 66 beds to our existing hospitals in these markets. We previously announced the closure of our 18-bed unit hosted within our acute care hospital JV partner in Evansville, Indiana. This closure will occur in early 2027 and represents another market consolidation opportunity. We are in the process of adding 40 beds to our existing freestanding hospital in this market to support the consolidation and future growth. These incremental beds are expected to be operational in late 2026. Following the Evansville unit closure, we will have nine remaining hospital and hospital locations with no further closures currently planned. The hospital-in-hospital format remains a viable strategy to capitalize on market opportunities. Over the next two years, we expect to open three additional hospital-in-hospital locations in existing markets. These three projects are already in our bed addition assumptions and will address needed capacity in these markets. Q1 SWB per FTE increased 3.7%, driven in part by the increased participation in our career ladder programs Mark discussed earlier. Greater participation in career ladder programs leads to more of our clinical staff obtaining higher licensing and compensation levels. Over time, we believe this drives financial and operational benefits, primarily in the form of reducing turnover in premium labor costs. Premium labor costs comprised of contract labor and sign-on and shift bonuses declined $2.7 million from Q125 to $25.9 million. Contract labor FTEs as a percent of total FTEs was 1.2% in Q1, down 10 basis points from Q125. Net pre-opening and ramp-up costs were $4 million. We continue to expect net pre-opening and ramp-up costs of $18 to $22 million for the full year 2026. We continue to generate significant free cash flow. Q1 adjusted free cash flow was $194 million. Our primary use of free cash flow continues to be capacity expansions. During Q1, we repurchased approximately 708,000 shares of our common stock for a total of $71.6 million. We paid a 19 cent per share cash dividend and declared another 19 per share cash dividend that was paid in April. Our leverage and liquidity remained well positioned. Net leverage at quarter end was 1.9 times. Based primarily on our Q1 results, we have raised our 2026 guidance as follows. We now expect net operating revenue of $6.375 to $6.470 billion, adjusted EBITDA of $1.35 to $1.38 billion, and adjusted earnings per share of $5.89 to $6.11. sense the considerations underlying our guidance can be found on page 11 of the supplemental slides and with that operator will open the line to the q a thank you if you'd like to ask a question press star one on your keypad to leave the queue at any time press star two once again
Operator
let's start one to ask a question in the interest of time we ask you please limit yourself to one question and one follow-up and we'll pause for just a moment to allow questioners a chance to enter the queue. And we'll take our first question from Anne Hines with Mizuho Securities. Please go ahead. Your line is open.
Yep. Thanks for the question. So, I know your organic volume of discharge growth was impacted by closures. Do you have a number what that would have been if you exclude the closures?
Yeah. As I mentioned in my comments, the impact of the closures was approximately 85 basis points, and that would be the same for both total and same store and again we would anticipate that that impact will diminish through the course of the year because we're going to be consolidating some of that volume and in certain instances adding beds to those markets the existing hospital in those markets and then we'll also be anniversarying the closure date and then just a reminder there's no impact on EBITDA that was just uh uh just started to zone um and then just a comment around nursing.
You had the lowest nursing turnover in 2012, which is very impressive. What do you think is driving that? I'm sure there's internal factors and external factors like inflation, but any observations you can provide on why you think that's so low?
Ann, I want to ask Pat Tuer to weigh in on that.
So, Ann, a couple things on that. We talked about our centralized talent acquisition team before, and they have done a great job bringing talent into our organization. Net hiring for the quarter was higher, in fact, than the first two quarters combined last year on a same-store basis. And on the turnover front, our ladders are really starting to take hold. So we have about 35 percent of our nursing staff is now on clinical ladders that's up about 300 basis points from last quarter turnover if if we can get a nurse on the ladder in q1 the turnover for that group was a little over two percent it was two point six percent compared to twenty point seven percent for non-laddered nurses so really our our hospital teams are doing a great job engaging our staff to become more organizationally rooted and get into these ladder programs and as a result earn more compensation. I would say more broadly the dynamics around the labor environment can be unpredictable, but we have seen a lot of positive momentum from a hiring and retention standpoint.
And as Pat noted, having that centralized talent acquisition here in Birmingham frees up the local hospital staff then to do nothing but really focus more on retention. So there's a lot of other programs involved, but certainly clinical ladders are an important part of the tools they've added in the last couple of years.
Operator
Thank you. We'll take our next question from Matthew Gilmore with KeyBank. Please go ahead. Your line is open.
Morning, Matt. Hey, thanks for the question. Hey, good morning. Maybe following up on Anne's line of questioning on the same store volumes, the 2.6 number, if you adjust out the 85 bits is still a pretty healthy number, but slightly moderated from the trends you saw in 2025. Curious if there were any other sort of puts and takes to think about and how you're sort of thinking about things for volume performance for the balance of 2026.
Yeah, and Matt, we don't want to make it sound like a litany of excuses, but since you've asked for further insight on volume, I think we would cite four factors in the first quarter. The first was the unit closures, which we've already covered. The second is occupancy levels, and I'll go through that in more detail in just a moment. The third is something that you've heard from the acute care hospitals reporting, which was it was a relatively light, meaning low severity, flu and respiratory season. And the fourth is some continuation of the MA trends that we experienced in q4 to dive a little bit deeper on the occupancy story our q1 average occupancy of 78.7 percent was essentially flat with our record high levels in q1 of 25 and that was up 200 basis points from q1 of 24 and up over 500 basis points from q1 of 23 and that's reflective of our strong growth and as Mark pointed out, the underlying demand for inpatient rehabilitation services. To meet that demand, we've obviously been adding beds via de novos and bed additions, and we've been seeking opportunities to convert semi-private rooms to private rooms. That's something we've talked about quite a bit before. At the end of the first quarter, 58% of our beds were private, and that compares to 41% being private at year-end 2020. But in spite of those efforts, occupancy has become a bit of a constraint in certain markets. In Q1, approximately 35% of our hospitals had occupancy in excess of 90%, with that cohort having an average occupancy of 95%. A subset of that group is comprised of relatively recent de novos that have been growing quickly, and they crossed the 90% threshold in Q1. More than half of our hospitals within Q1 that had occupancy in excess of 90% are slated for bed additions between 2026 and 2028, and we anticipated adding more of those hospitals to the list, as well as introducing small format hospitals per more discussion in certain of those markets. So, you know, we probably fell a little bit behind because the growth was faster than we anticipated, but we got a plan to address that. Just a little bit more commentary on the flu and respiratory season. The ability for us is a proxy for the severity of the flu season and also for respiratory illness. And as, you know, as you've heard from the acutes, Q126 was relatively light in that regard. Debility is approximately 11% of our patient mix, and it only grew by 70 basis points in total for the quarter and actually declined 1.5% on a same-store basis. That's purely a seasonal item, and it's going to fluctuate from year to year. And then, again, MA continued to be a bit of a struggle as we moved into the quarter. You know, I'd probably there point to some things on a longer trend. We can talk about obviously the success that we're having with regard to the admit and appeal strategy that we began implementing at the end of February. That's very early on. It's only in nine hospitals, but we're seeing some good traction there. But some of the things that you've probably been hearing nationwide on an MA basis that are worth underscoring is that nationwide MA penetration appears to have peaked at approximately 52 percent and it's now actually receding slightly and as a matter of fact if you look at the year that ended in March of 26 20 states experienced the decline in MA penetration from the prior year and we have hospitals in 12 of those states and if you drill down even further to our home counties 48 of our 154 home counties or 31 percent had a year-over-year decline in MA penetration. So we're not necessarily suggesting that there's going to be a wholesale abandonment of MA, but what we would point to is there continues to be a very large population of Medicare fee-for-service patients that continues to grow that remains considerably underserved.
Just to add a little bit to that, Matt, this is Pat. that Doug talked about how half of the hospitals are being, have capacity expansion plans underway. You know, that could beg the question, what about the other half? And those are all under evaluation as well. Some of those are landlocked. Some of those are in competitive markets where it makes more sense for us to consider a small format hospital. But we're looking at a lot of options in those markets as well. In addition, one of the things that we've found is, you know, we have ramped up in many of these markets faster than anticipated. And as a result of that, you know, we've historically talked about how we have looked at hospitals to have an occupancy between 80 and 85 percent for us to start that expansion process. Well, you know, that worked for a long time. But what we're seeing now is that the process can take a little longer. The permitting process takes longer than it used to. The regulatory process can take longer than it used to. So we have lowered the threshold internally where we're now looking at 70% to 75% from an occupancy standpoint. And that, what we're hoping, is going to allow us to time these capacity additions a little better so that when the capacity is available, when the occupancy is reaching to the point where we actually need it. The other thing that I'll mention is, you know, we typically build a 50-bed hospital, and, you know, we've been talking internally about, you know, in some markets, should we be looking at larger footprints? And that's something that we're also evaluating currently. So we have several plans to address these occupancy challenges and constraints moving forward.
I will say with regard to occupancy, it meets the definition of a high-quality problem.
Yeah, I agree with you. Thanks for all those details. That's great. Let me try one follow-up on the Medicare proposal. you know, within that proposal, there was an RFI to potentially make some adjustments to the payment model. You know, from our perspective, it seemed pretty neutral, but I was curious if you all had any initial reaction, or maybe it's even too soon to kind of give an educated guess, but any perspective there would be great.
Yeah, this is Pat again, and, you know, I think we're aligned with some of the points you made in your question. So, this is a concept at this point. It's not a proposal, and it lacks many of the details necessary for us to model out what the particular impact could really look like. But it's not any sort of site-neutral concept, and in fact, it would look more to change the SNF PDPM buckets to account for the unique and more complex patient populations that are treated in IRFs. And the new process would ultimately be based on ICD-10 coding for both levels of care. so it's more just trying to make things uniform from how things are are coded and classified rather than any type of site neutral push but too soon to tell not really a concern for us right now Matt we as we always do we'll we'll be responding to the proposed rule with our comments as a company as well as working closely with the trade associations to contribute to the feedback CMS okay thank you thank you we'll take our next question from andrew mok with barclays please
go ahead your line is open morning andrew morning andrew hi good morning just wanted to follow up on those comments around ma trends so you previously called out aggressive you know utilization management from a large national medicare advantage payer is this issue broadening out to other payers, or is more of the MA drag coming from the higher fee-for-service volumes? And if the latter, why is that the case?
I'm not sure I fully understood the second part of your question. The first part of your question, has it extended other payers? No, the trends from Q4 to Q1 remain pretty consistent. And again, I want to highlight that, as we mentioned last quarter, we did begin implementing a strategy for MA patients in certain markets of admit and appeal. As a reminder, whereas previously, for a very high percentage of the patients on which we received an initial denial, we would simply not admit the patients and move on and not attempt to take that any further. Towards the end of February, in nine of our hospitals thus far, on certain MA patients where we believe we have a very strong case that a referral is appropriate. We are now admitting those patients, even with an initial denial, and taking them through the five various levels of appeal. We've started to see some positive results there, and we anticipate rolling that out further. It's important to note that that is not targeted at any one particular MA plan that is based more on the specific patients and not the plans. Andrew, could you help clarify me on the second part of your question regarding fee-for-service?
Yeah, I think you made a comment that the slower MA membership growth, industry membership growth, is creating maybe a little bit of a volume drag. I guess, why is that the case if fee-for-service penetration is a little bit higher?
I was going the opposite. I think, you know, for many years, what we were observing is that an increasing percentage of newly minted Medicare beneficiaries were signing up for MA, and so the total MA penetration of the MA beneficiary population had been increasing, but it appears that it peaked at about 52%, and it's actually backing up now. And I was giving some specificity about how MA penetration in some of our home markets has receded, which means that a higher percentage of those patients are fee-for-service. which, generally speaking, is a good thing for us.
Just to add to that, Andrew, this is Pat. Sequentially, our conversion rate with MA actually went up, but it was down versus Q1 a prior year. And just a little more color on Doug's comment around the admit and appeal strategy. It is way too early to form an educated opinion about this, but in the nine markets that we are piloting this, We have seen some nice improvement in the approval rate of claims that we submit for authorization. So we're encouraged by what we're seeing. We have a number of cases that are pending an ALJ hearing, and we'll wait until we have several of the decisions around those before we make a decision on when and if to scale this up further.
Got it. And then as a percentage of revenue, it looks like SWB is the lowest levels we've ever seen, which is even more impressive given 1Q, SWB tends to be the highest in the year. Beyond low turnover, are there any other factors driving the strength in SWB this quarter? And how should we think about sort of the seasonal progression from here given that starting point?
Yeah, I mean, you had a couple of things depending on how you're looking at it as a percentage. First of all, we had a pretty significant increase in state-directed payment revenue because that included some out-of-period stuff. Now, we believe that the net provider tax impact on EBITDA for the quarter had some seasonality to it, and we continue to believe that for the full year, it's going to be relatively flat with last year. And then also, part of our pricing increase, as I mentioned in my comments, was a favorable year-over-year impact from the Medicare SSI adjustment. And so you're pulling in incremental pricing revenue without any labor required to offset that.
You know, there's always some seasonality in our labor.
First quarter, just because of the higher occupancy rate, tends to be one of the more efficient quarters. It's also going to be impacted by the timing of de novos when that capacity comes on.
And as was the case last year, we're pretty back-end loaded this year. one other comment on on that on a same store basis and we don't we don't give out same story epob but to doug's point the ramping de novos and the timing of de novos can really impact epob and we look we look really good for q1 but on a same store basis we we are showing incremental improvement year over year and that's just a product of us continually working to to make sure that our hospitals are as efficient as possible without sacrificing any type of clinical or quality outcome. And, you know, with an organization of our size, you'll have some variation from hospital to hospital or region to region. And those are the markets that we work to get in line with our expectations.
The last thing I'd point out that had an impact there, Andrew, is that the closures had a favorable impact on that because, as we mentioned, We were taking out the revenue and the volume, but they were break-even from an EBITDA perspective, which leads you to conclude that the SWB associated with that volume was a substantially higher percentage than we run on average.
Operator
Thank you. We'll take our next question from Pito Chikarin with Deutsche Bank. Please go ahead. Your line is open. Good morning, Pito.
Hey, good morning, guys. Thanks for taking my questions here. Shockingly to you guys, I want to go back to that occupancy question. And if you give some good details around the facilities that are capped in occupancy, with half of those, you can expand the next few years and half of them you can't because they're landlocked. What do you think is a ceiling for same-store discharge growth over the next year or two until those beds are getting added just because you're…
Yeah, I want to be clear, and I think Pat elaborated on this. We've identified bed expansion opportunities for half of that cohort. It's not that we can't do the other half. some of those just moved into that category faster than we anticipated so we're evaluating those and even in those where we are landlocked there's a good chance we'll be able to solve for that equation with a small format hospital so i would actually anticipate that for those high occupancy markets there's only going to be a relatively small percentage that over time we can't address with incremental capacity in some way in terms of a theoretical cap on discharge growth again this is another reason and the introduction of the small format hospital goes into this category where we believe it is increasingly irrelevant to think about the breakdown between total discharge growth and same store discharge growth because you're going to have buckets that move in and out so with regard to total discharge growth it's just a matter of you know how quickly can we add new capacity and continue to fill in and boost the occupancy rates as we do so and we certainly believe that that number is greater and perhaps substantially greater than that which we've posted in the last two quarters you know if you look at the track record of our real estate and our design and construction team i'm very proud of the way they've been able to bring these projects on plan, on schedule, and within budget.
So, it's got a lot of confidence. The team that we have in place here will help us to address the occupancy and capacity issues.
Yeah, these are all pretty high-quality problems, to your point. I guess if I'll hear from a CapEx question then, what's the right level of CapEx in order to keep on filling this demand? And does CapEx's percentage of revenue go up, is it going faster than you guys think, or is this sort of the right level?
You know, I think it's going to increase the percent of revenue relatively modestly over the next two to three years and peak at probably about 15% and then start to recede back towards the, call it 10% to 12%, which is probably going to represent a longer-term run rate.
Operator
Thank you. We'll move next to Whit Mayo with Lee Ring Partners. Please go ahead. Your line is open.
Hey, good morning, Whit. Good morning, Whit. Hey, good morning. Hey, Doug, was the Medicaid DPP, the supplemental, known when you gave guidance? I believe that it was. And then just how much more incremental directed payments do you have within your plan for the rest of the year? And then are there any states that you're looking out for that may not be in the plan?
Yeah, so we're not aware of any new states coming online. Q1 was larger than we anticipated. largely due to a significant portion being out of period, and we called that out. The EBITDA impact from the out of period was about $4.2 million. In our Q4 call, we suggested that we anticipated for this year that the EBITDA impact from net provider taxes would be roughly flat with last year, which was $21 million. And we continue to believe that the increase in Q1 was really a timing issue, and that the full year will be in that range. As a reminder, the peak that we had in last year was in Q3, where we had a $10 million favorable impact from provider taxes at the EBITDA level, and $6 million of that was out of period. So again, we just think that's a flow between quarters, and that the EBITDA impact should be flat on a year-over-year basis.
Okay. And then my follow-up is I just wanted to kind of take your temperature on buybacks again with leverage now. Drifting to probably one and a half times soon just seems like you could add a half turn, maybe a full turn of leverage in the next year or two, deplete a lot of the market cap, maybe move the investor focus away from EBITDA to EPS. So just wanted to hear the latest thinking about the longer-term buyback strategy.
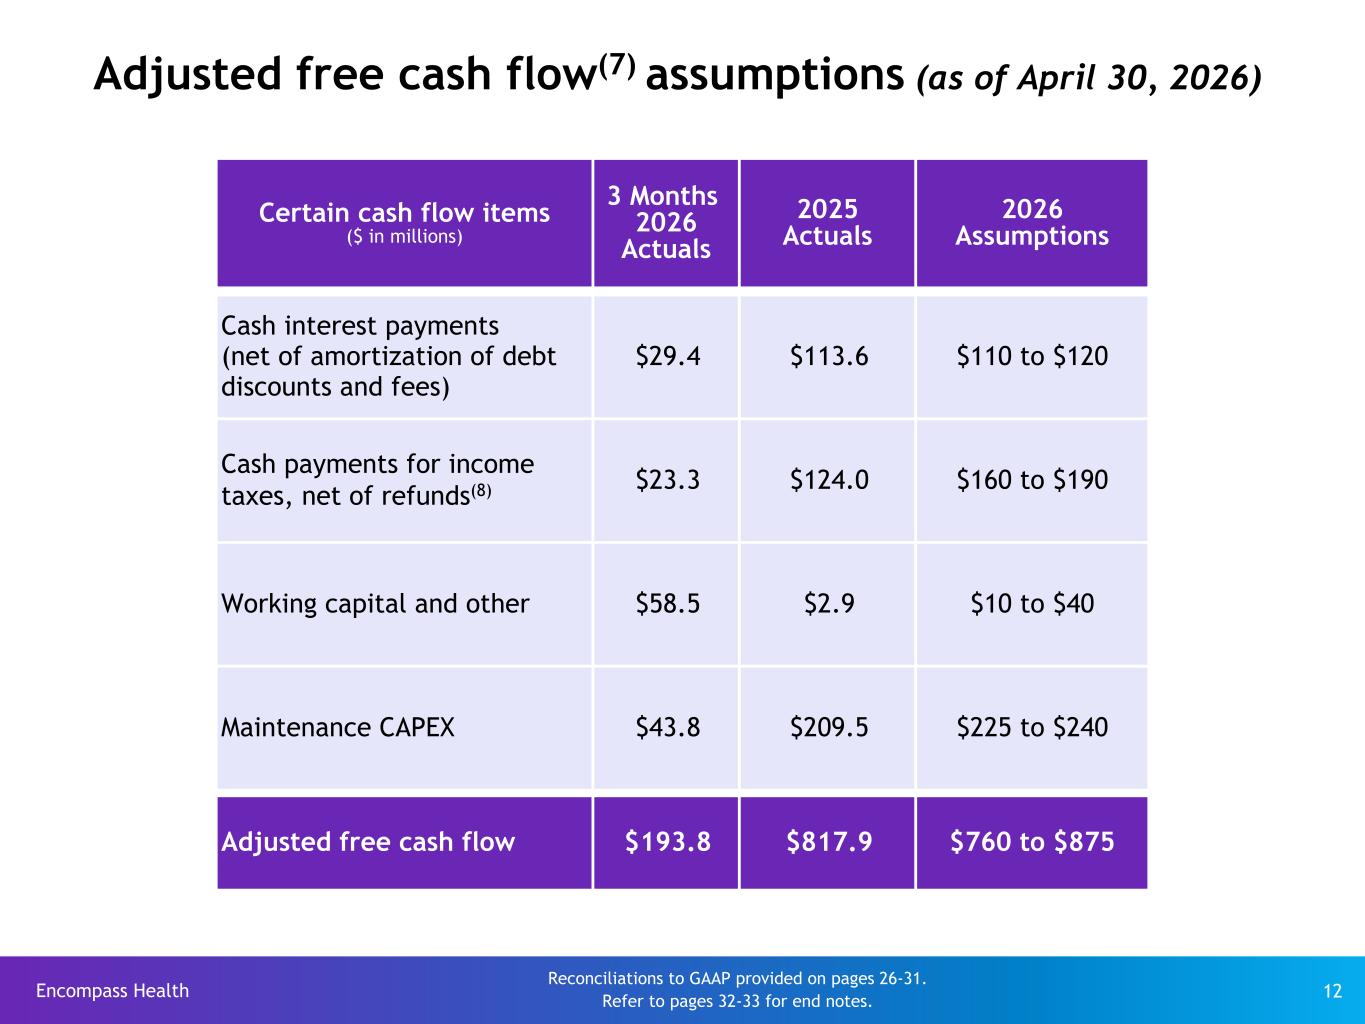
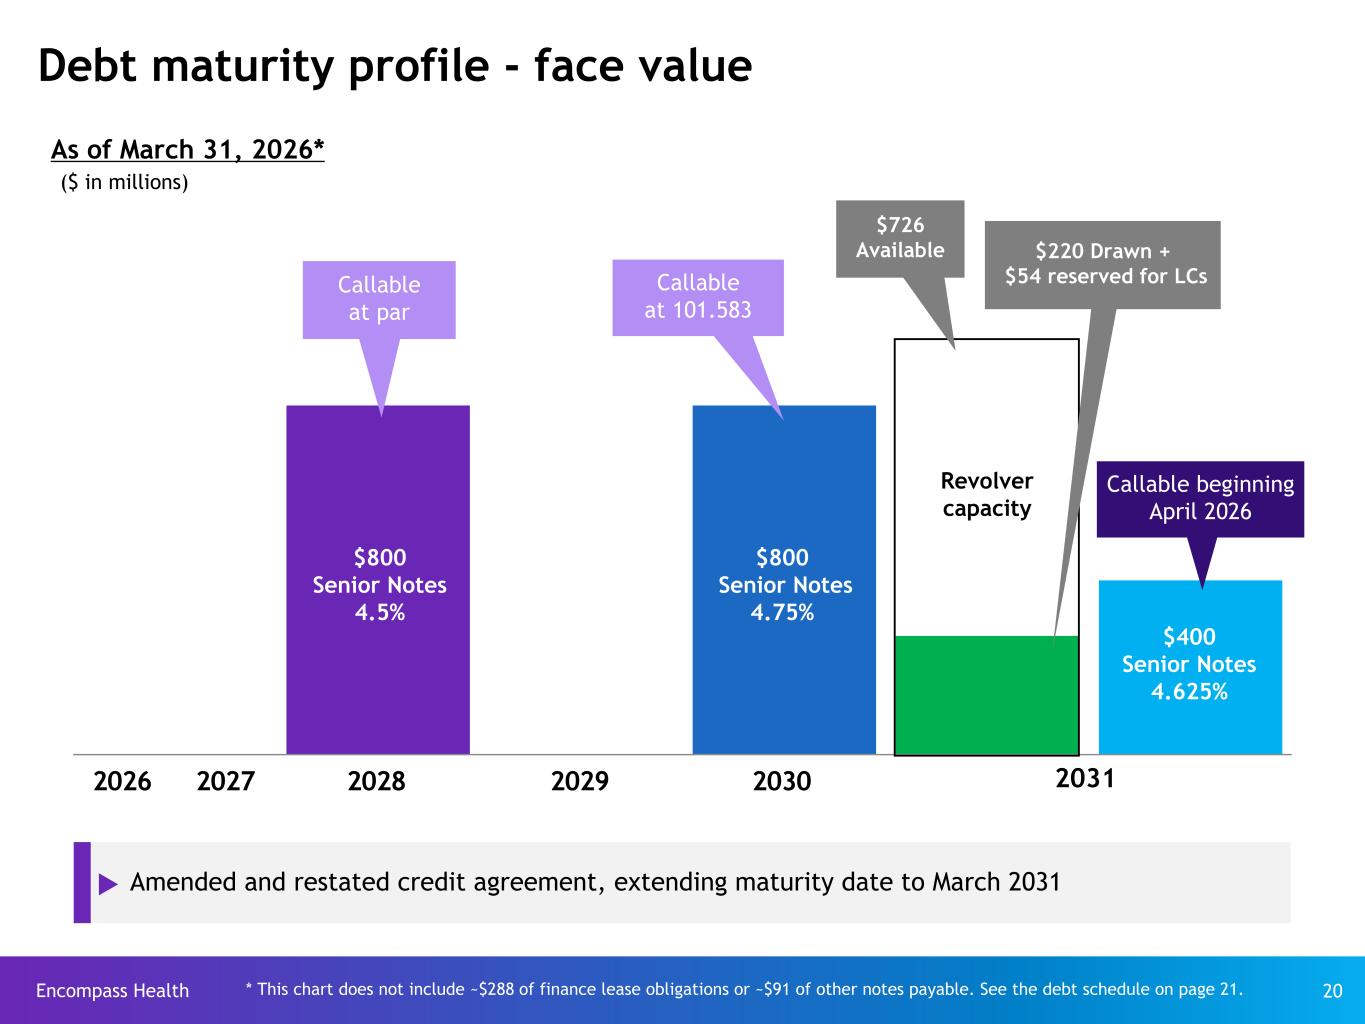
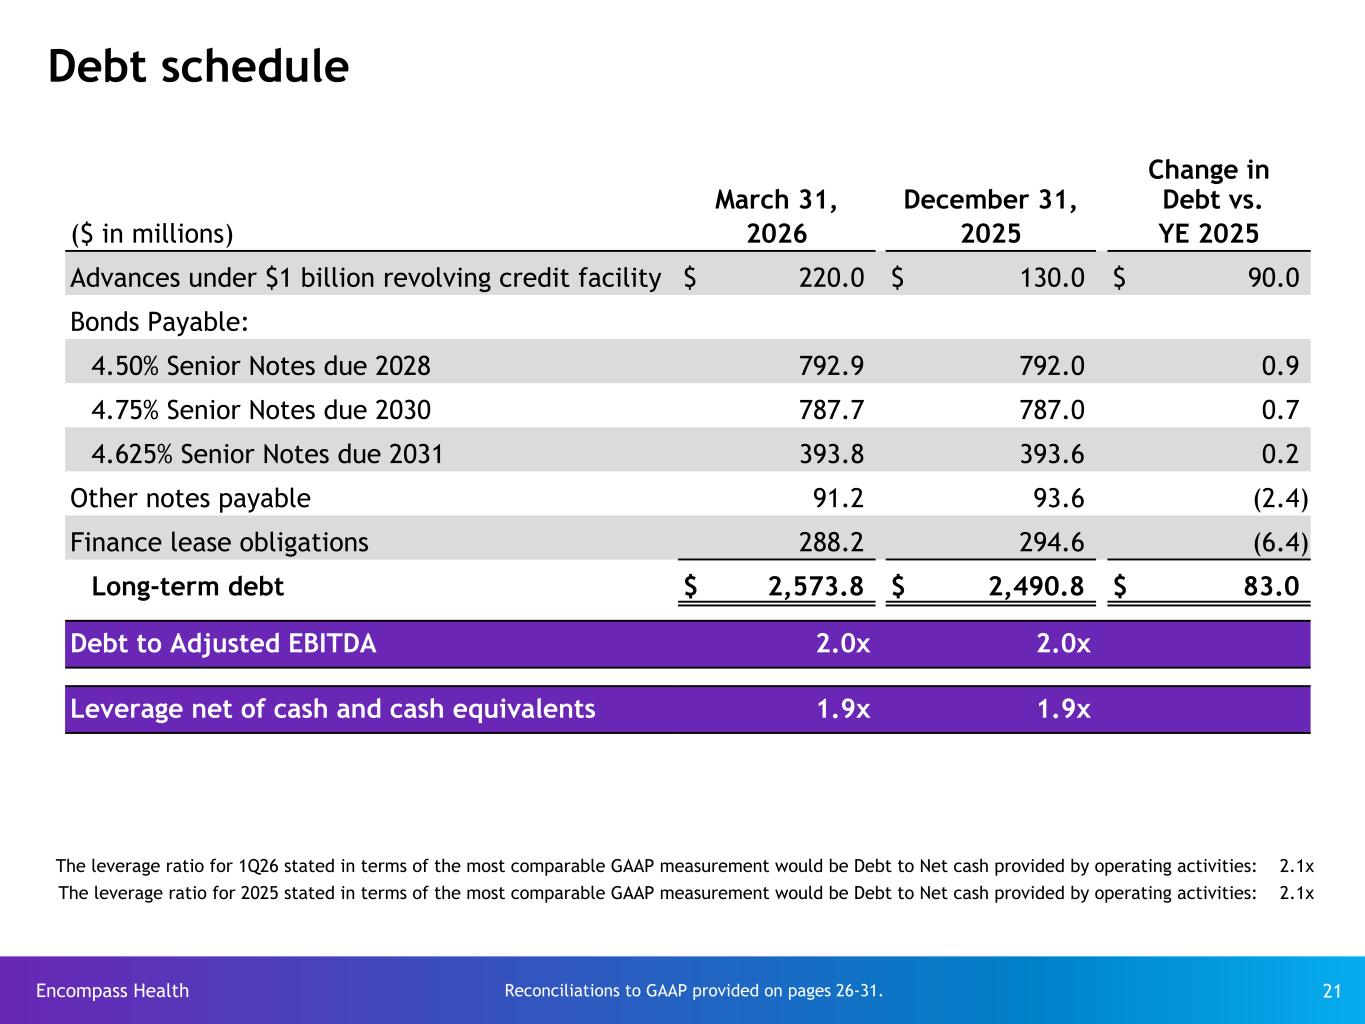
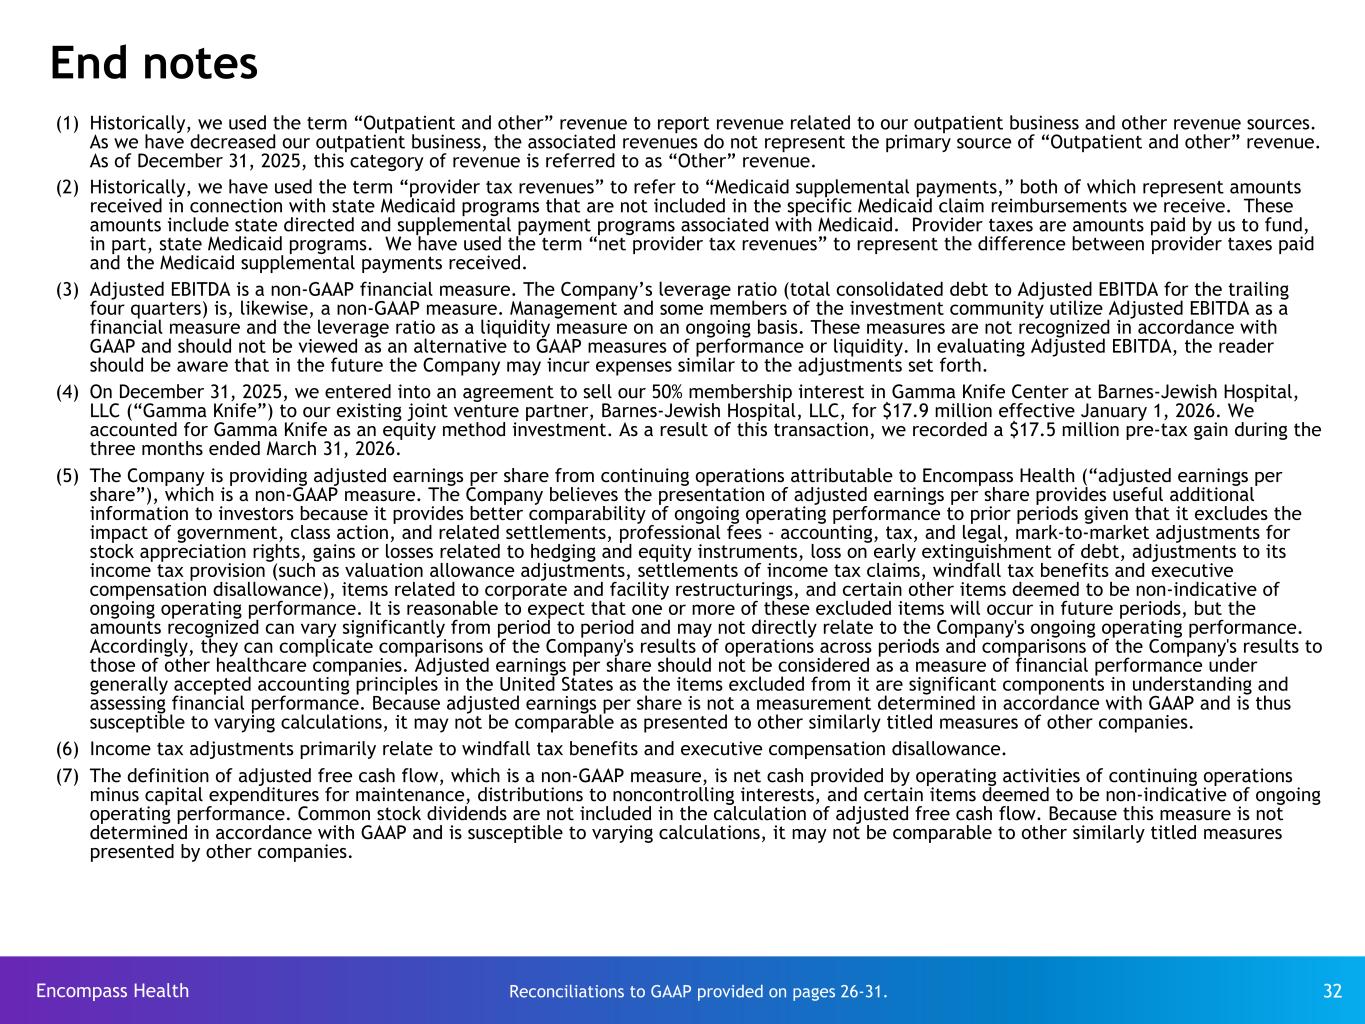
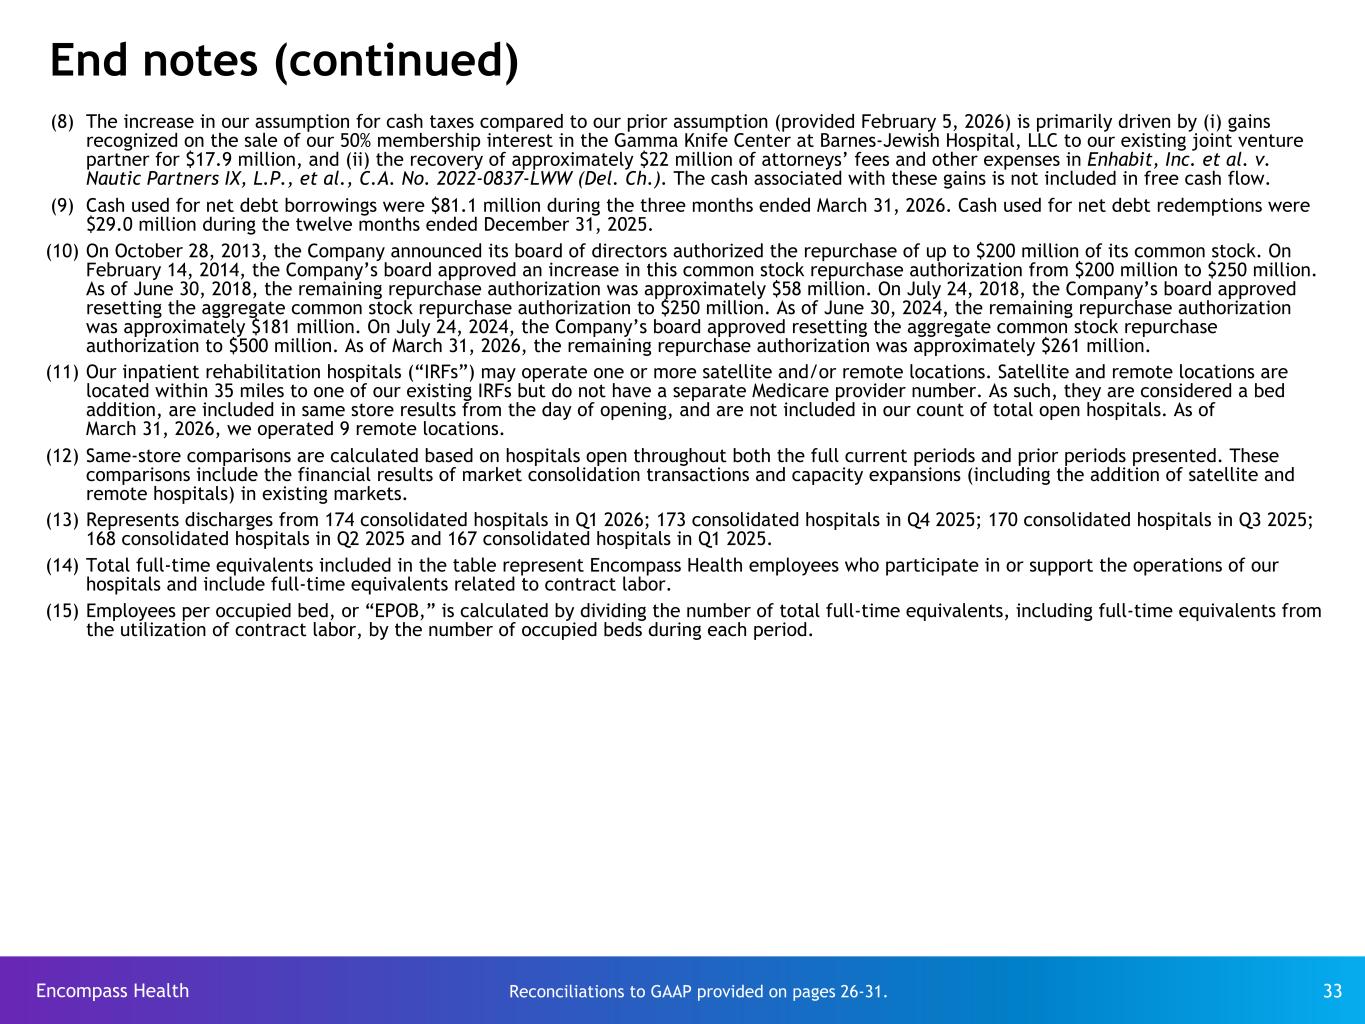
Yeah, I'll leave it to you guys to decide whether you want to move the focus from EBITDA to EPS. We do feel like using some of the capacity in our balance sheet and buying back shares, particularly at the levels we've been trading at here more recently, represents a really attractive complement to our overall strategy. And so if we just do some math around that, and you look at the guidance assumptions that we've included in our supplemental slides, the midpoint of our free cash flow estimate for the year is roughly $818 million. dollars and what's not included in that number and by the way the reason that the taxes went up was predominantly as you can see from that end note was predominantly because of the proceeds we received on the sale of the gamma knife and then also on the receipt of legal proceeds or of legal fees in the delaware litigation that adds another 40 million dollars of cash and so that would take you to cash available for investment of roughly 858 million dollars the midpoint of our growth capex estimate is 725 million dollars you hold the dividend constant that's 77 million dollars so at those levels even without utilizing any capacity in the balance sheet you've got roughly 56 million dollars that would otherwise be available if you look at the end of the first quarter our funded debt was roughly 2.575 billion dollars and the midpoint of our EBITDA range based on the updated guidance is a billion 365. if you simply took the leverage up to two from 1.9 that would suggest total incremental capacity of 212 million dollars for share buyback we did 71 million dollars in the first quarter so you've got at least 140 million dollars available then could do the math in a similar fashion if you decided that you wanted the leverage to flow between two and two and a half times so i mean that's the simple way that the math works and we believe that sharing purchases will continue to be part of our allocation of free cash flow hey this is pat just going back to the state directed payment question for a second we do think this represents an opportunity for us in certain states to uh work with our acute care partners to get additional Medicaid volume.
There's about 20% of our markets are in states that have a pretty attractive Medicaid reimbursement structure that, on the surface, it doesn't look like it covers our costs, but when you factor in the other dynamics, it does, and that represents an opportunity for us on the volume growth side as well. Thank you.
Operator
Thank you. We'll take our next question from Joanna Kyuk with Bank of America. Please go ahead. Your line is open. Good morning, Joanna.
Hey, thanks for taking that question. So, I just want to follow up on the discussion around the proposal. Thanks for sharing your initial views about this RFI that CMS included in the proposal. So I know it's early, there are no details, but also in that document, CMS actually quotes MacBank analysis, and they talk about, like, the mix varies by the ownership, and they talk about, you know, aligning payments with costs. So, you know, kind of what are your top houses there? Like, what exactly CMS is trying to kind of allude here to, and would you expect, you know, something specific they have in mind as they're thinking about, you know, 28, because obviously 27 like they cannot add anything but like you know i guess in a year from now sort of uh you know would you expect something in that proposal hey joanna this is pat it's it's hard for us to to to tell and to discern the um you know for a long time you know what has been issued by medpac has not historically been followed or or or given given much attention um so the fact that something was quoted now.
It's hard for us to be able to speak on that intelligently. What I can tell you is this proposed rule is relatively benign. There's some pieces of the proposed rule that could create some minor burdens from a logistics perspective. I'm not really sure what it does to help patient care, but you know in any case we will provide comments by June 1st as Mark Mark said, and we will adapt and be prepared to meet any changes that are included in the final rule.
Joanna, just in general, as you know, we're always quite active in D.C. and have our own resources up there and remain part of the discussion with CMS and members of Congress and others about just making sure that people understand the value proposition that comes with inpatient rehabilitation, and we are the leader within that sector. So we'll always be part of those discussions. There will be thoughts that are shared from CMS and other types of proposals. As you know, a lot of times these things are discussed, but actually implementing them is a major challenge. So we'll be part of any of those discussions and give our feedback, and And I want to make sure that we're ahead of the curve.
And we do believe that CMS is aware and is sympathetic to the amount of change that they're inflicting on any one particular sector at a time. And it's not lost on them that team implementation began on January 1st and that RCD is being extended this year in a significant way, as well as some of the specific provisions in the proposed rule regarding the therapy evaluations and treatment, the pre-admission screening, and then also the timing of the interdisciplinary team meeting.
Speaker 13
There's already a lot underway.
Operator
Thank you so much. Thank you. And as a quick reminder, if you'd like to ask a question, please press star 1 now. We'll take our next question from A.J. Bryce with UBS. Please go ahead. Your line is open.
Hi, everyone. how are you guys um so obviously you've had a nice uh pacing of your jv opportunities i wondered if you'd update us uh on how that pipeline looks is it still uh pretty plentiful and obviously your leading peer uh and competing for those jvs is in the mystical and private does that maybe even create more opportunities maybe the potential partners a little hesitant because of that or maybe they're just pulling back because they're going to focus their cash flow elsewhere any thoughts well i uh look we've had this business model in place now for for well over 30 years in
terms of joint venturing with acute care hospital system as i noted in my prepared statements we have a nice mixture of both wholly owned and joint venture projects uh that are that are in the pipeline. I like our chances when we go out with other providers as we show what we can do. And the fact that we have about a third of our overall hospitals are partnerships. We have a lot of partners that can validate what a great partner we are and what a great manager we are.
So, AJ, I'm not concerned about what others are doing, but I am very confident in our ability to move forward you know if you look on slide 18 of the materials we distributed this morning we note that we have 18 earth development projects underway now only one of those is currently identified as a joint venture opportunities and that's our loganville georgia hospital which will open as part of our partnership agreement with piedmont but as you've seen with us over the last several years as we've ascended the learning curve with regard to neurodevelopment we've gotten and increasingly comfortable going ahead and forging ahead on an individual basis in a market, even as discussions with potential joint venture partners are underway. So I think there's a better than even prospect that some of the development projects that are listed on that page will ultimately turn out to be joint ventures. With regard to Select Medical, we don't expect any change in their appetite for incremental growth. Their strategy is somewhat different from ours in that they are 100% JV focused and they tend to focus a lot on HIHs as well, so we would expect them to continue to be a viable competitor, but the pool is big enough for both of us.
AJ, I think one of the trends you do see within our joint venture partners is building multiple hospitals within that partnership. Piedmont is a prime example of that. We've done that with Vanderbilt. We've done it with BJC and a number of other providers where we are building multiple hospitals within that same partnership.
The last thing I would say there, and this also relates back to some of the high occupancy doors, Some of those are joint ventures, and as we have gone back to some of our joint venture partners and introduced them to the potential for a small-format hospital, we're getting a very favorable reception.
Okay. My follow-up, I wanted to ask you about the small-format hospitals. Is the ROI on those materially different than the regular-sized facilities? Is there any ability to get around certificate of need or more flexibility on certificate of need with the small format hospitals? And just how are you going to think about those versus the traditional size?
Yeah, so the ROI falls squarely between a bed expansion, which is our highest ROI, and a de novo. So better than a de novo, not quite a bed expansion because of the infrastructure leverage. In CON states, the addition of beds is almost always subject to CON requirements. Because you're operating under the same Medicare provider number and because you're dealing with less than the number of beds associated with the de novo, that tends to be, not always, but it tends to be a lower hurdle to get over. It is not a substitute for a de novo hospital. It is a complement to DeNovo hospitals and is a bit of a substitute for a bed edition at an existing hospital.
AJ, just in terms of how we're thinking about the scale of this opportunity, you know, you could have markets that have three or four of these, you know, at maturity. You could have markets that have one or two, and some markets won't have any. It gives us a lot of flexibility in how we approach markets. But we are currently evaluating dozens of markets and building out a robust pipeline, similar to what we've done with our bed expansion process and our de novo process. We're doing the same thing for small-format hospitals.
And we are actually developing an enhanced market analysis tool that includes all aspects of the market, including projected growth and real estate aspects in conjunction with Palantir. that's going to help us be a lot more prescriptive when we're entering in the new market about what should be the initial size and location of the de novo that's going to anchor that market, and then what would be potential sites prioritized in terms of timing for augmenting that with small format hospitals. So that's going to allow us to be much more proactive with regard to our real estate strategy. And hopefully, even as occupancy ramps up quickly with new capacity coming on board, it's going to alleviate some of these concerns we have when we've fallen behind with regard to bed expansions.
Okay, great. Thanks so much.
Operator
Thank you. We'll take our next question from Brian Tanquillet with Jeffries. Please go ahead. Your line is open.
Brian, Brian. Hey, good morning, guys. Maybe, Doug, since you mentioned Palantir, so when I look at what your hospital, you know, the acute care hospitals are doing, rolling out a lot of AI here, just curious, I mean, what are the initiatives that you're doing right now? And then when I think of where something like a Palantir can come into place, you know, I look at your length of stay at 12 days right now. Is there room for AI or analytics to improve, you know, on the clinical and operational side beyond just kind of like back office stuff?
But, yeah, I think there's a lot going on. Pat, do you want to speak to maybe some of the clinical and operational aspects of it?
Yeah, the first thing I'll say in regards to Palantir on the length of stay front, you know, we're not actively trying to get our length of stay down further. You know, what we're trying to do is make sure that each patient has an appropriate care plan for their needs. That just happens to average around 12 days. And, again, we're not trying to pressure our hospitals to get that down. So we're really focused on appropriate patient care for each patient. But we are, on the same note, looking for opportunities to make sure that our care plans are as efficient as possible. You know, we've talked about our partnership with Palantir on pre-screen narratives, appeal letters. But we are looking at and are in various stages of implementation of documentation efficiency for our physicians and providers around histories and physicals, face-to-face notes, discharge summaries, and we're evaluating other opportunities as well. And this is all in an effort to give our physicians and our clinical staff time back so that they can do direct patient care instead of documenting. And I think there's going to be operational benefits that come along with that, and we're excited to see where that goes. We're really encouraged by some of the things we're seeing and how efficient it is allowing our providers to be.
I would further say, just kind of in summary, in the queue with Palantir, we have the real estate analysis and the market analysis project I mentioned before. We've got a substantial CRM opportunity. We've got a revenue cycle management opportunity, and we've got a clinical staffing opportunity as well. Those are all in the queue.
Brian, just as a follow-up on the length of stay discussion, we've seen our length of stay over the years come down from 14 to 12. as Pat noted. And you get to the point where you want to be careful on pushing it down much lower because some of these quality metrics that I mentioned in my opening comments relative to the ability to have 84 plus percent of our patients go back home to the community, have very few of them go back to the hospital on the acute care transfers or skilled nursing discharges.
Those all kind of tie to that length of stay so we're very careful in terms of you know trying to really push that down yeah i think it's important to note that much of the reduction from 14 days to 12 days had less that was much more to do with removing the friction on the discharge process than any change to the uh the care that the patient has been treating the volume and the intensity of it while while in our facility now that makes a lot of sense and then maybe doug last one for me so when i think of four million dollars of pre-opening cost in the quarter is that kind of in line with expectations and how should we think about the back half given the timing of bed ads and then maybe just in the same vein you know the free cash flow guidance was
revised down just curious you know what we need to be thinking about as it relates to that adjustment Thanks.
Yeah, absolutely. So, with regard to the pre-opening, $4 million to the quarter. We anticipate for the full year, it's going to be $18 to $22 million. Midpoint of that is $20 million. It's going to be a little bit more heavily weighted towards Q3 and Q4, probably following a little bit of the same pattern that we had last year. Q3 will probably be the most significant on that you know the free cash flow came down because of upward revisions in two items one was interest expense which moved up by about five million dollars that's simply reflective of the fact that as we're as our capex is rolling out and as we're spending a little bit more money on sherry purchases we're carrying a larger balance on the revolver but not overly significant the Second piece is that cash taxes went up. That estimate went up solely because of the tax payments that are due against the gain on the sale of the gamma knife and also the taxable portion of the recovery of legal fees on the Delaware litigation. As I mentioned previously, what you don't see from an accounting perspective in that table is the $40 million benefit from the receipt of proceeds. So net net the actual cash available for us in spite of the increases in those two categories actually increased for the year.
Operator
Thank you. We'll take our next question from Jared Hasse with William Blair. Please go ahead. Your line is open.
Hey, good morning, Jared.
Hey, good morning. Appreciate all the details thus far. Maybe I'll take a step back for a little bit of a bigger picture question on the market landscape, but you know, obviously a lot of what you've messaged today is demand clearly remains very strong, and you're seeing that show up in all of the occupancy dynamics. But I am curious, just, you know, as we think about this long-term kind of structural thesis that you've had around capturing some share away from skilled nursing facilities over time, moving that volume to IRFs, are you seeing some of these competing SNFs in your markets, you know, increasing their investments around clinical capacity programs, other services that would help them, you know, move further into higher acuity patients this is pat you know i i think much like every level of care is probably trying to improve what what they do and how they operate i'm sure the snips are doing the same thing but it's an entirely different level of care you know they don't have the staffing
intensity or the clinical oversight that we do the investment that we have in in our programs technology. It's just apples and oranges. And there's a time and a place for skilled nursing facilities. But, you know, I've talked before on these calls that, you know, across the country, in markets that we're in, patients are still twice as likely to end up with a CMS-13 diagnosis to end up in a nursing home. And, you know, we have an opportunity to continue to add capacity to address that. You know, our average age patient's around 78 years old. The oldest baby boomer turned 80 in January. There's a few years of baby boomers that haven't even hit Medicare eligibility. So there's a lot of volume dynamics for a long period of time that we can serve. And, you know, again, I still see a lot of opportunity for us to continue to capture market share away from SNFs.
Okay, that's really helpful. And then, you know, this is invariably a small nuance here, but I thought I'd just clarify, it looks like there was a slight change in your guidance assumption for the bet expansions that went from approximately 175 to now 150 to 200. And so I guess obviously just in light of everything you've shared with what's going on from an occupancy perspective, just, you know, is there anything we should be thinking about as to why maybe a slightly lower end is in play here from bet expansions this year? is that mostly just a timing dynamic?
It's exactly that. So, you know, the midpoint of 150 to 200 is obviously the 175 point estimate that we used previously. We've got two fourth quarter projects with both, which have the potential just based on timing and weather conditions to flip over into the first quarter of next year. And so we just hedged a little bit with the range. Okay.
Operator
Thank you. Again, if you'd like to ask a question, you may press star one now. Our next question comes from Rosh Kumar with Stevens. Please go ahead. Your line is open.
Speaker 13
Hey, good morning. Yeah, maybe just kind of thinking about, you know, sticking to the kind of MA versus fee-for-service dynamic. You know, you typically called out that, you know, your MA patients tend to exhibit just a higher average acuity versus your fee-for-service population. I guess, you know, given more payer intervention or just kind of more stringency around that have you seen that kind of acuity gap grow maybe over the past couple years and then i guess maybe also on the kind of the admit and appeal strategy would be curious on kind of what the you know win weight target is or what that's kind of demonstrated early into the program yeah so i'll start and i'm sure pat will want to chime in as well we have seen more of a concentration within the MA in our highest acuity categories.
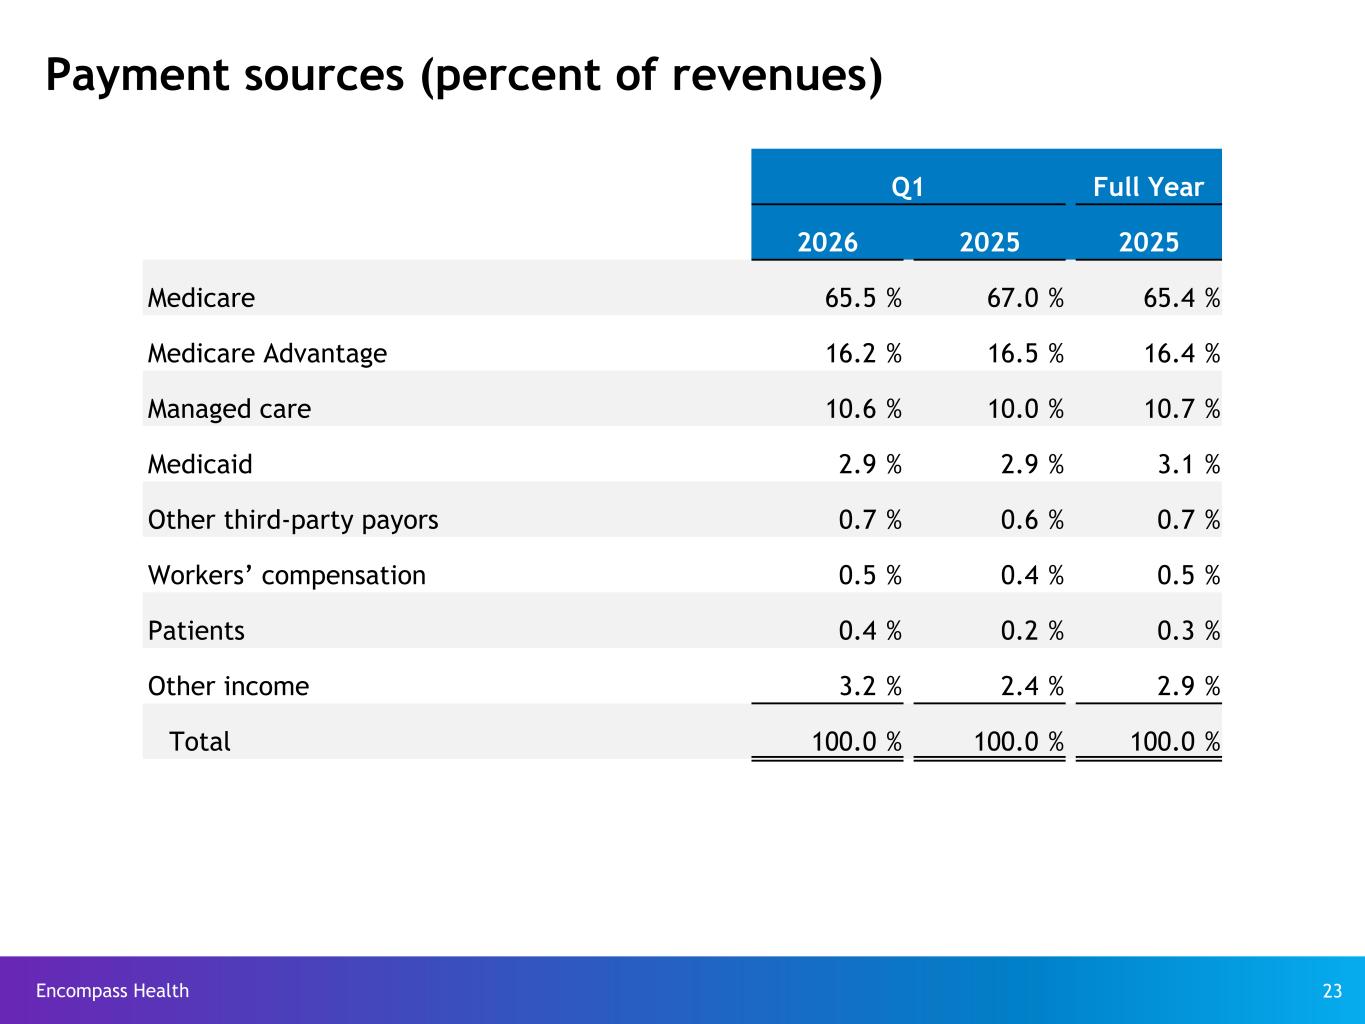
In the first quarter, stroke was almost 36% of our MA volume. That's not surprising. Those tend to be non-jumpball cases as well. And so the favorable aspect of that is because reimbursement across all payers is tied to acuity, the average reimbursement gap between Medicare Advantage and Medicare fee-for-service shrunk to 1% for the quarter. So we continue to think that there are opportunities and necessities for us to serve as a broader spectrum of acuity of MA patients. With regard to the appeal and admit strategy, you know, again, we are seeing favorable results even at the first level of appeal, which is an expedited appeal right back to the plan itself. We don't have enough of a universe yet to understand how we're going to succeed at the various levels of appeal beyond the Maximus decision, which tends to be a bit of a rubber stamp. But there's reason for optimism.
Raj, this is Pat. Just a couple points. So on MA, this remains grossly underpenetrated, And, you know, if the dynamics around that ever change, you know, we'll have a lot of opportunity to continue at even more capacity. The higher acuity dynamic of the MA patient, I don't necessarily view it as a positive. You know, it's great from a revenue perspective. But what that signals to me is there's a lot of other patients that should be coming to us that just aren't giving the opportunity to do so. and that's something we'll continue to focus on. On the admit and appeal strategy, we really got that up and going kind of mid-February, March. We started to see some significant improvement in those markets. Doug talked about Maximus. We did have our first overturn at the Maximus level, so that's encouraging, and it's probably going to take us about six to eight months to really get our arms around and have a better sample size of what our success rate is at the ALJ level, what, you know, if we want to take cases beyond that, you know, that could extend the time a little further. So, I would say six to eight months will be in a better position to, you know, make a decision on scaling up or increasing the size of the pilot and probably, you know, within 12 to 18 months, we'll have a lot of clarity around this.
And just to maybe dimensionalize this as well with regard to MA and all, by 2030, it's projected that 20% of the U.S. population is going to be age 65 and older. So that means 70 million Americans by 2030 will be Medicare beneficiaries. If you assume for a moment that the MA penetration rate, based on recent trends, stabilizes at around 50%, that means that you've still got 35 million Medicare beneficiaries who are not MA patients, which means that they're likely to be fee-for-service. That's a total addressable market. Some portion of those are going to be CMS-13 eligible of 35 million individuals. our total discharges on the last 12-month basis were $266,000. So there's a really big pond out there for us to fish out of.
Speaker 13
Great. And maybe as a follow-up, just kind of going back to Pat's comment on the kind of Medicaid side of the business and, you know, with the funding environment being supported there. And then I think, you know, outpatient visits for the first time in a while grew positively year over year.
And so I kind of think about that business, even though it's a smaller part, just kind of thinking about, uh you know if the one q is a good baseline for that business kind of going from from a volume perspective uh just given how the funding environment is has been kind of supportive to from an economics perspective as well hey raj this is pat again i wouldn't read too much into the outpatient volume in q1 it's really not a core business of ours and we've we've continued to ramp down the number of outpatient clinics that we have i would anticipate that we'll continue to uh assess the the clinics that we're in and if um if they're not profitable or not there's not a good business case for them uh to be in operation we'll we'll continue to look at opportunities to to further bring that count down um and then the uh what was the second part of medicaid yeah medicaid is uh you know this is a newer opportunity for us i know it's been a big tailwind for the acute providers and it just has not been a big focus for us and we are starting to see some of the benefits in those states so we are like we do anything else developing strategies around how we can serve those patients more effectively and I'm excited about some of the early progress that we're seeing and on that point Raj what's really changed there is
if you rolled back the clock as recently as maybe three or four years ago, on an annual basis, our net provider tax impact to EBITDA was essentially zero. It would be plus or minus a million dollars. And with the implementation of new programs by states over the last several years, that's increased to the point, again, where we're estimating $21 million this year. That's obviously not evenly distributed across all states. So when we look at some states where historically, the on-its-face rate that we were paid for IRF services didn't cover our variable costs. If you include the directed payment portion of that with the actual reimbursement that we get, it puts it in a position where in some of those states, it is a profitable patient for us to treat. And so we'll look at handling those referrals perhaps in a slightly different manner.
Speaker 13
Great. Appreciate the call.
Operator
Thank you. This does conclude our question and answer session. I'd like to now turn the call back over to Mark Miller for any additional or closing remarks.
Thank you, operator. If anyone has additional questions, please call me at 205-970-580. Thank you again for joining today's call.
Operator
Thank you. This brings us to the end of today's meeting. We appreciate your time and participation. You may now disconnect.