Operator
Greetings and welcome to the FinWISE Bancorp First Quarter 2026 Earnings Conference Call. At this time, all participants are in a listen-only mode. A question and answer session will follow the formal presentation. If anyone should require operator assistance, please press star zero on your telephone keypad. As a reminder, this conference is being recorded. It is now my pleasure to introduce the FinWISE team. Please go ahead.
Speaker 12
Good afternoon, and thank you for joining us today for FinWise Bankrupt's first quarter 2026 earnings conference call. Earlier today, we filed our earnings relief and investor deck and posted them to our investor website at investors.finwisebankrupt.com. Today's conference call is being recorded and webcast on the company's investor website, as previously mentioned. On today's call, management's prepared remarks and answers to your questions may contain forward-looking statements that are subject to risks and uncertainties that could cause actual results to differ from those discussed today. Forward-looking statements represent management's current estimates, expectations, and beliefs, and FinWise Bank Corp. assumes no obligation to update any forward-looking statements in the future. We encourage listeners to review the more detailed discussions related to these forward-looking statements, including factors that may negatively impact them, contained in the company's earnings press release and filings with the Securities and Exchange Commission. Posting the call today are Kent Landvatter, Executive Chairman, Jim Noon, CEO, and Bob Wallman, CFO. Kent, please go ahead.
Good afternoon, everyone. I want to briefly comment on the executive transition we recently announced. Earlier this month, Jim Noon assumed the role of CEO of FinWise Bancorp in addition to serving as President and CEO of FinWise Bank. This reflects the successful execution of a deliberate multi-year succession plan developed by our board, with Jim progressing from bank president in 2023 to company CEO today. As Executive Chairman, I will remain actively involved in long-term strategy, board governance, and investor relations. This transition does not change our strategic direction, and both the board and I have full confidence in Jim's leadership. With that, I will turn it over to Jim to discuss our first quarter results.
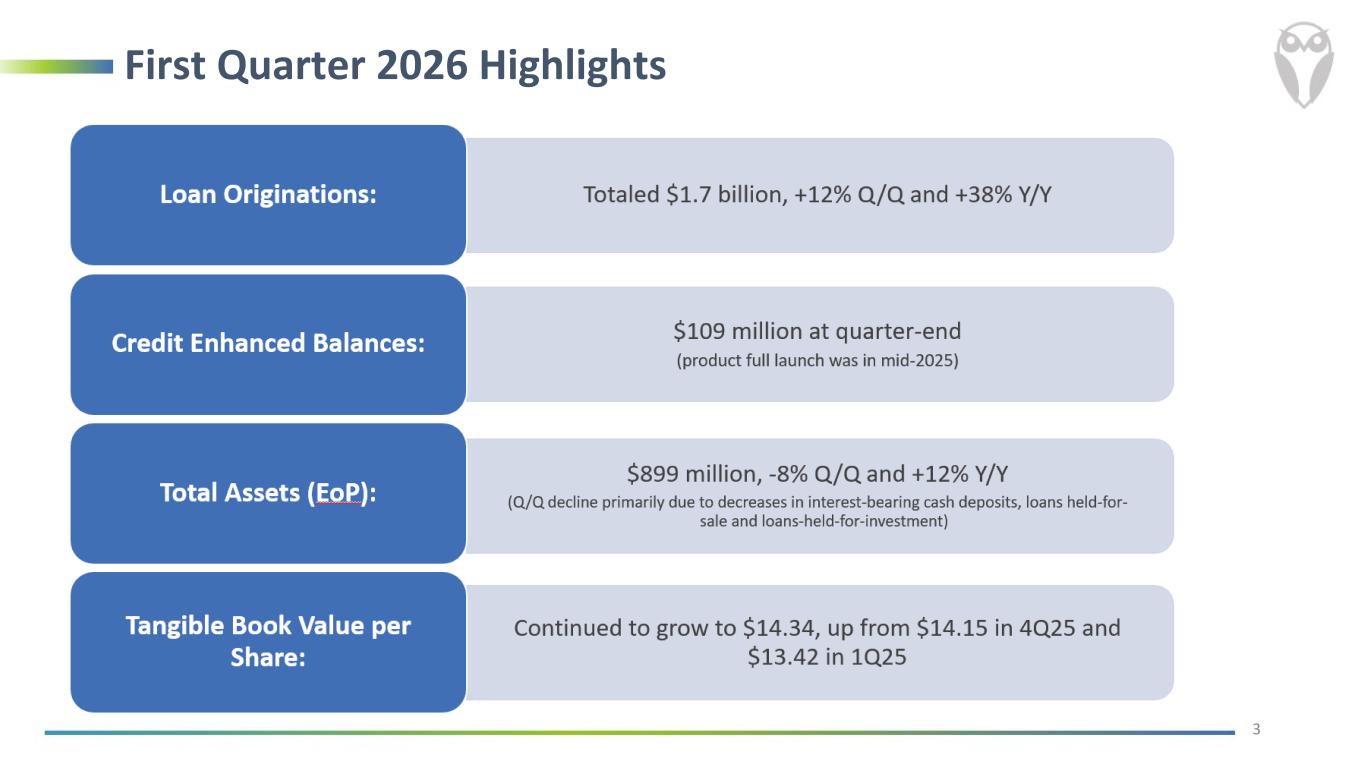
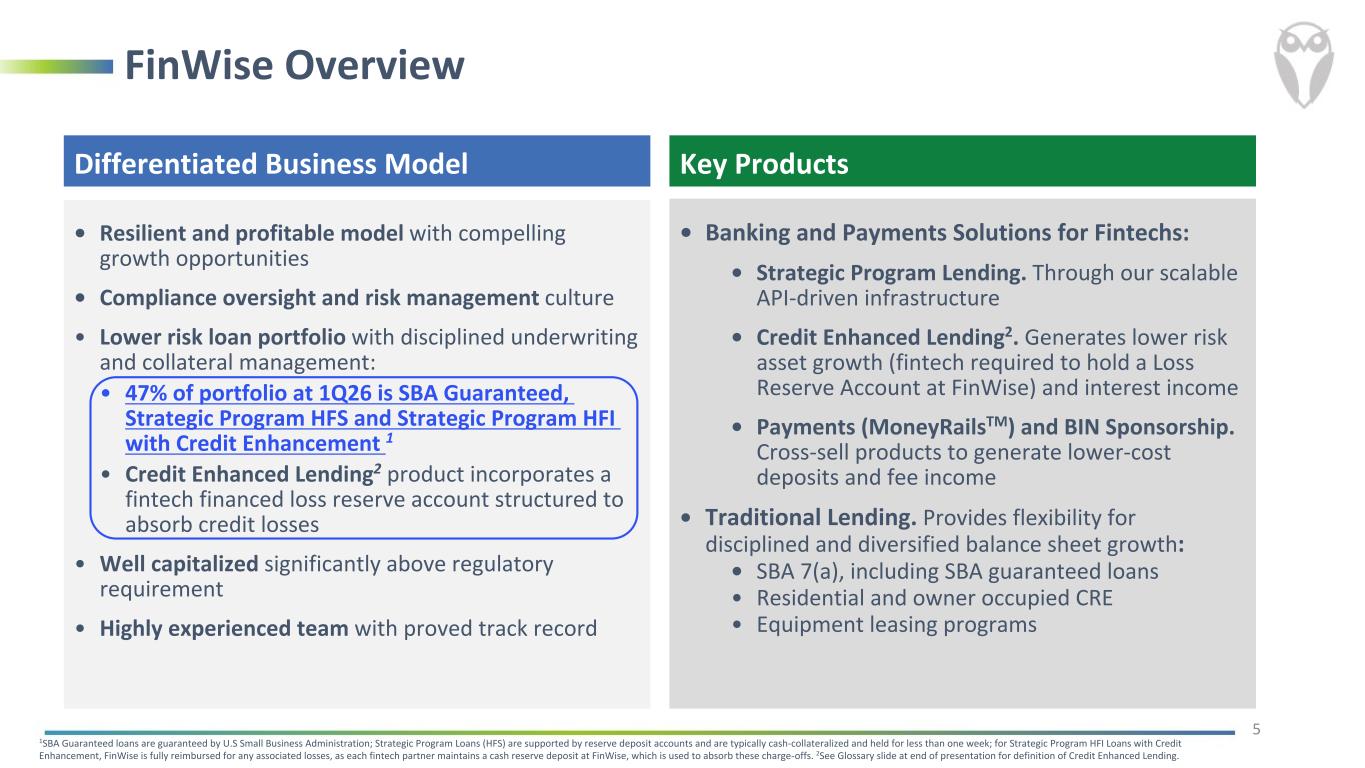
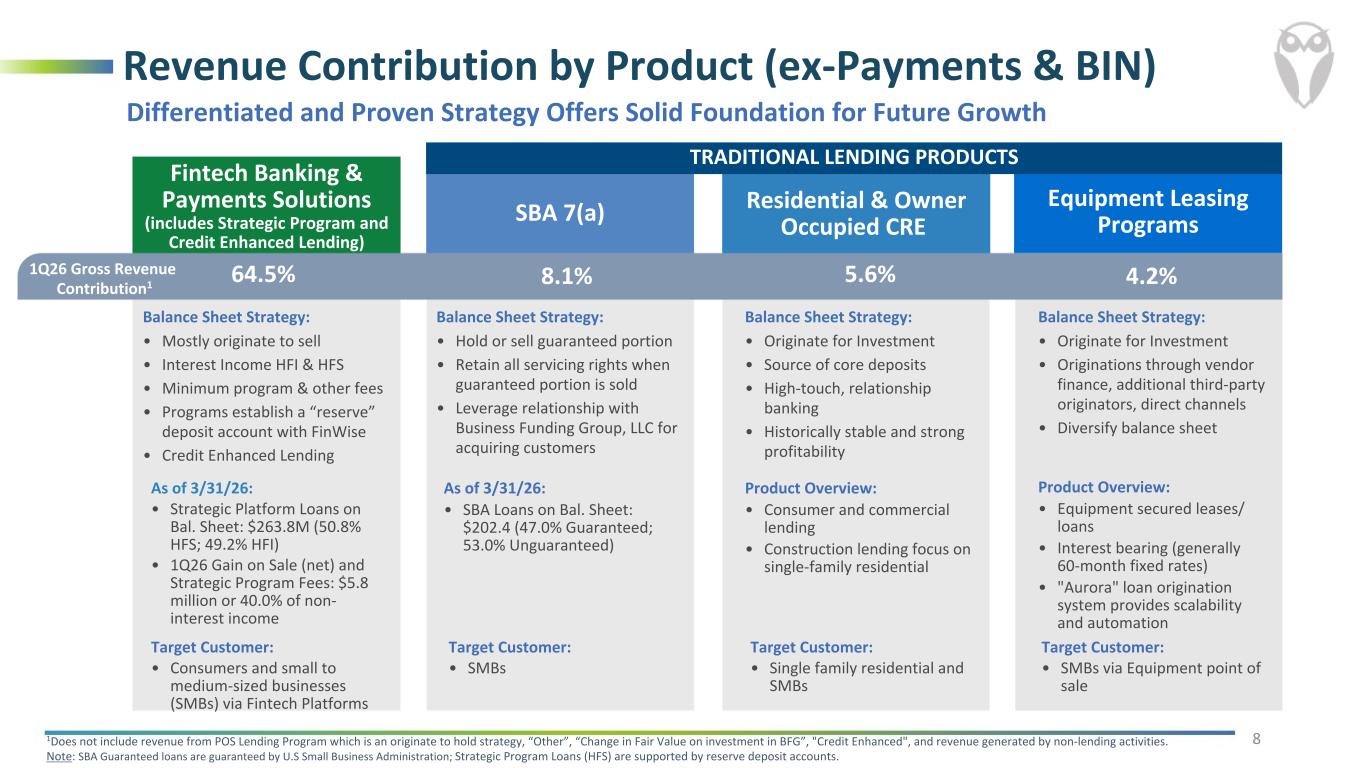
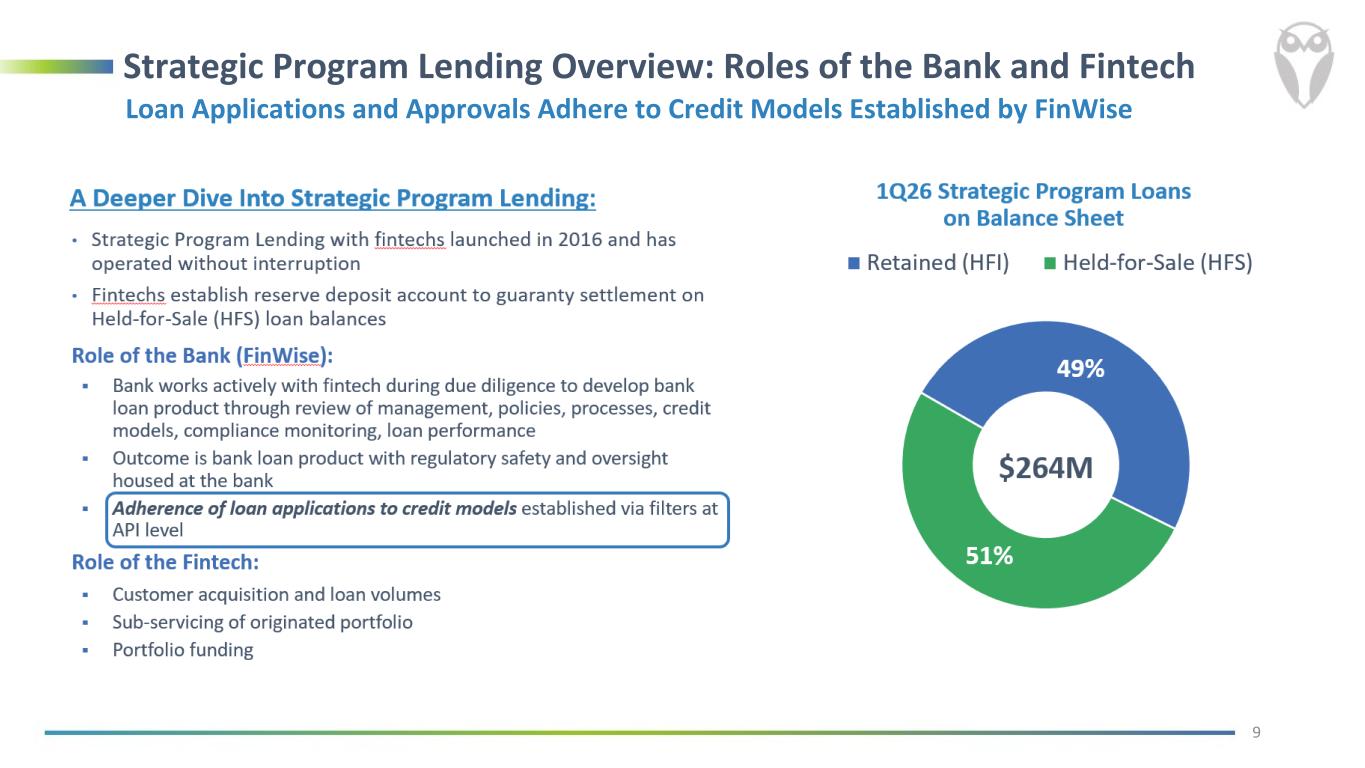
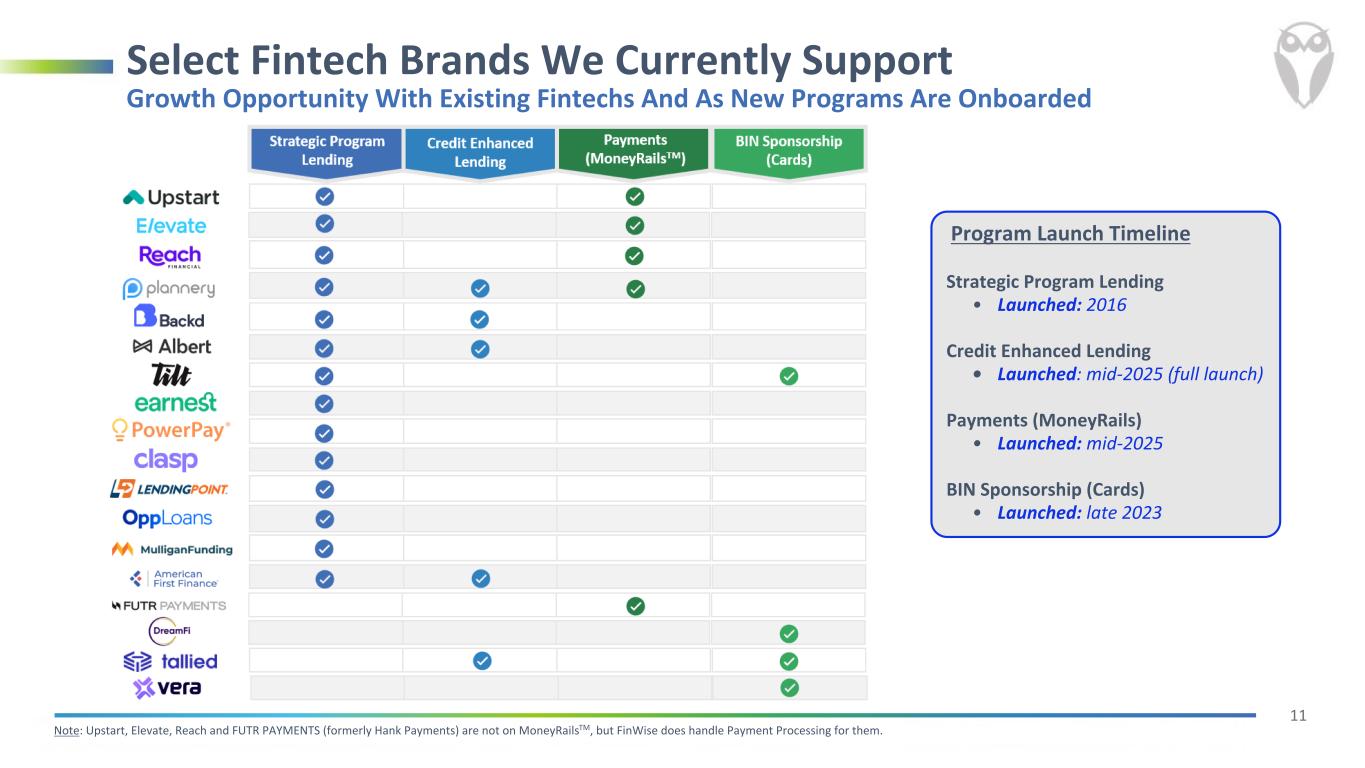
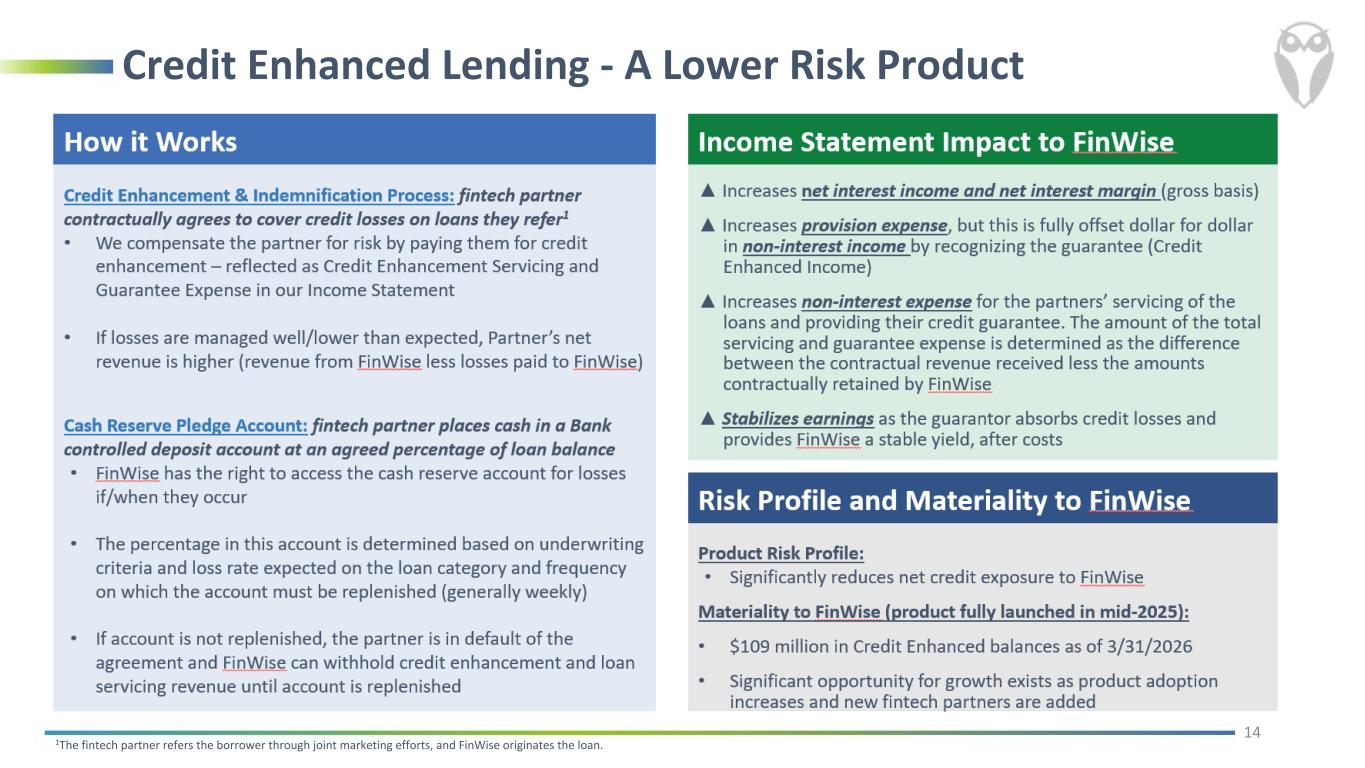
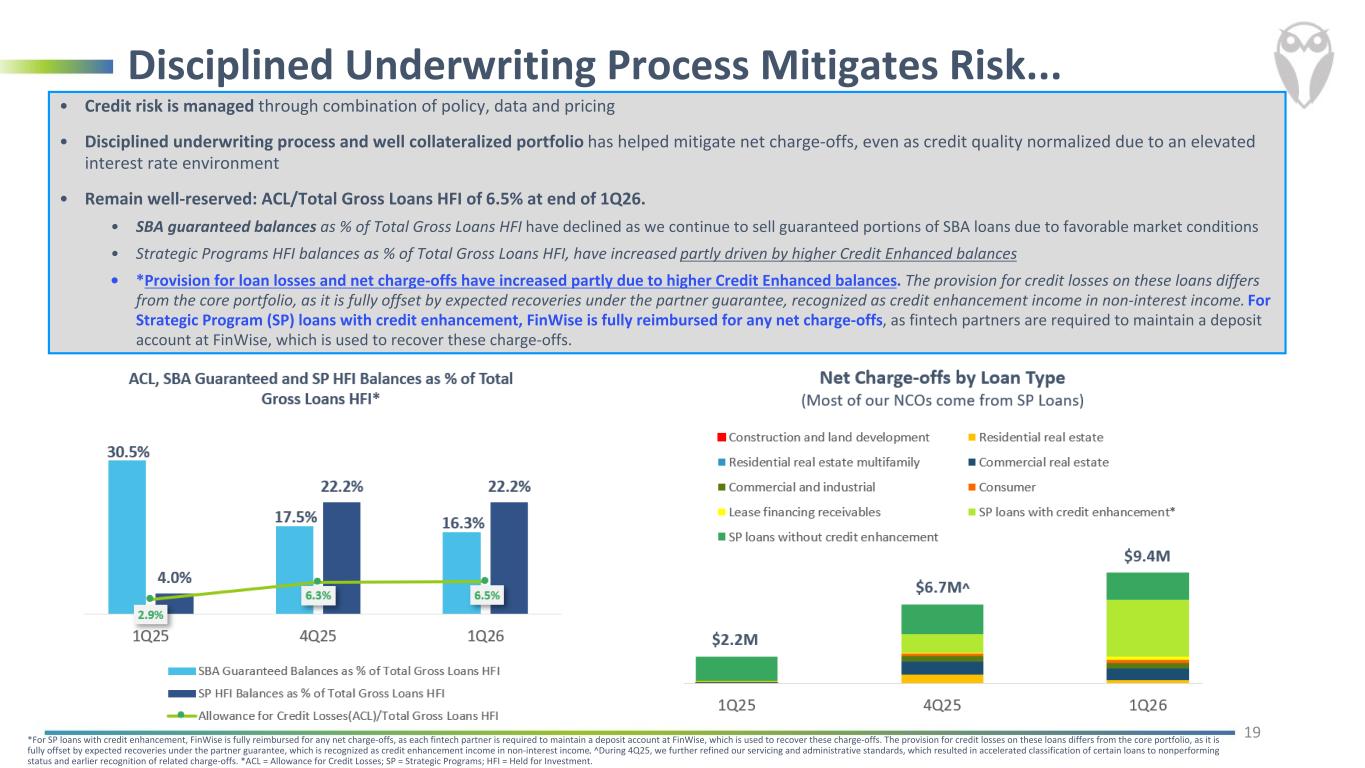
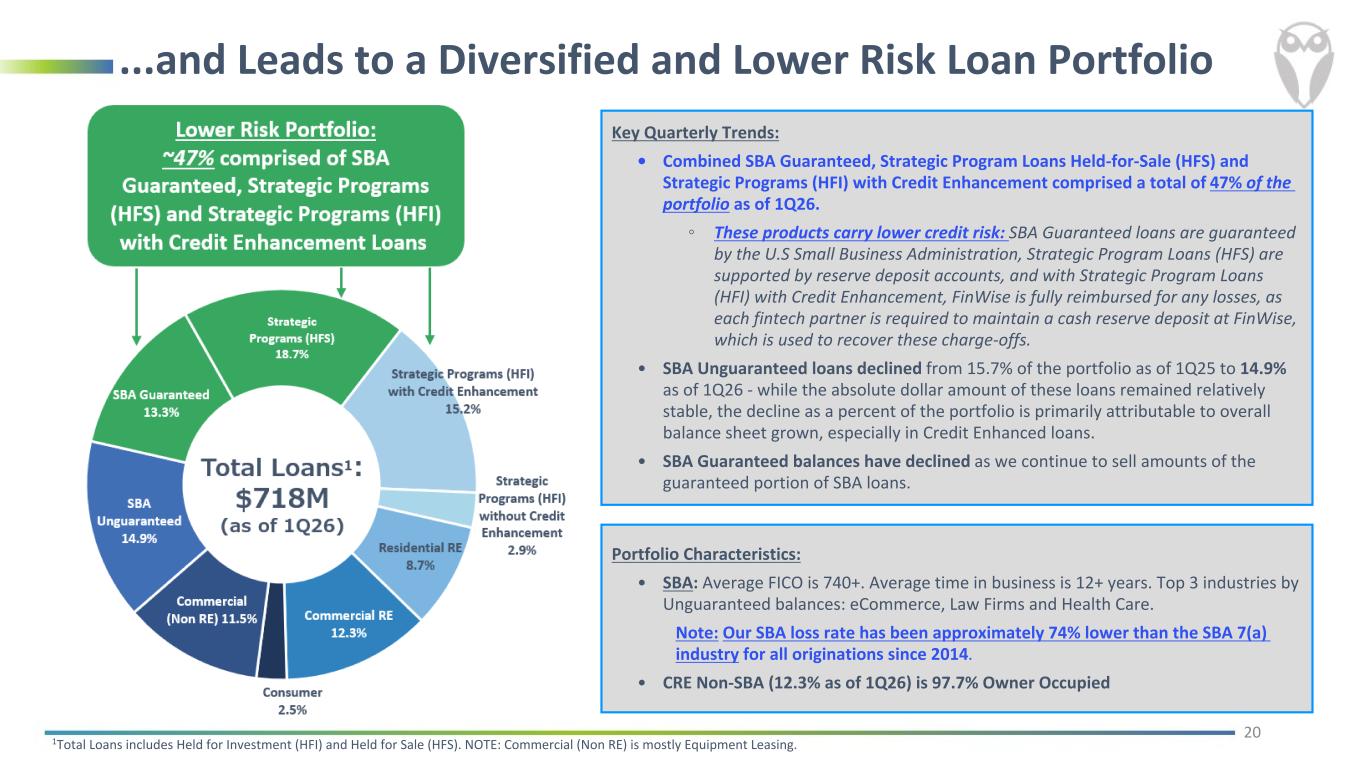
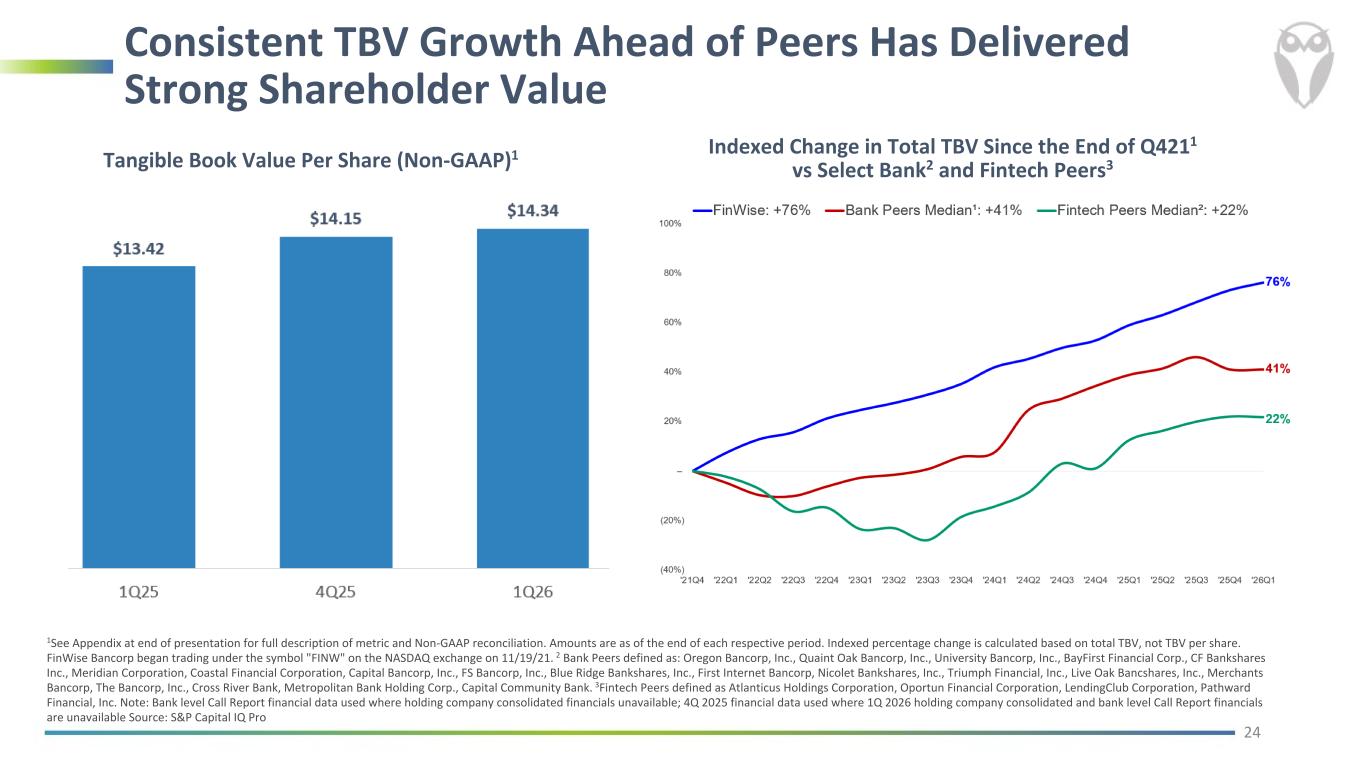
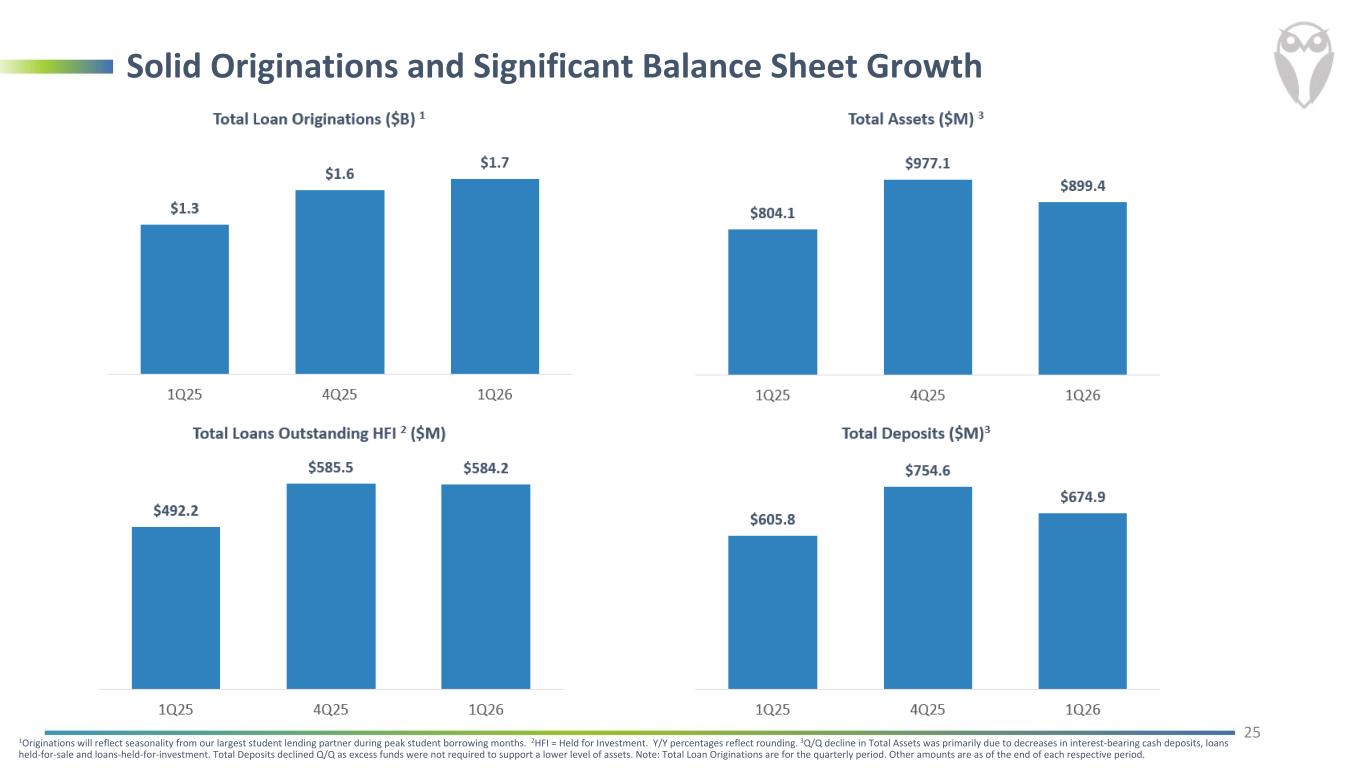
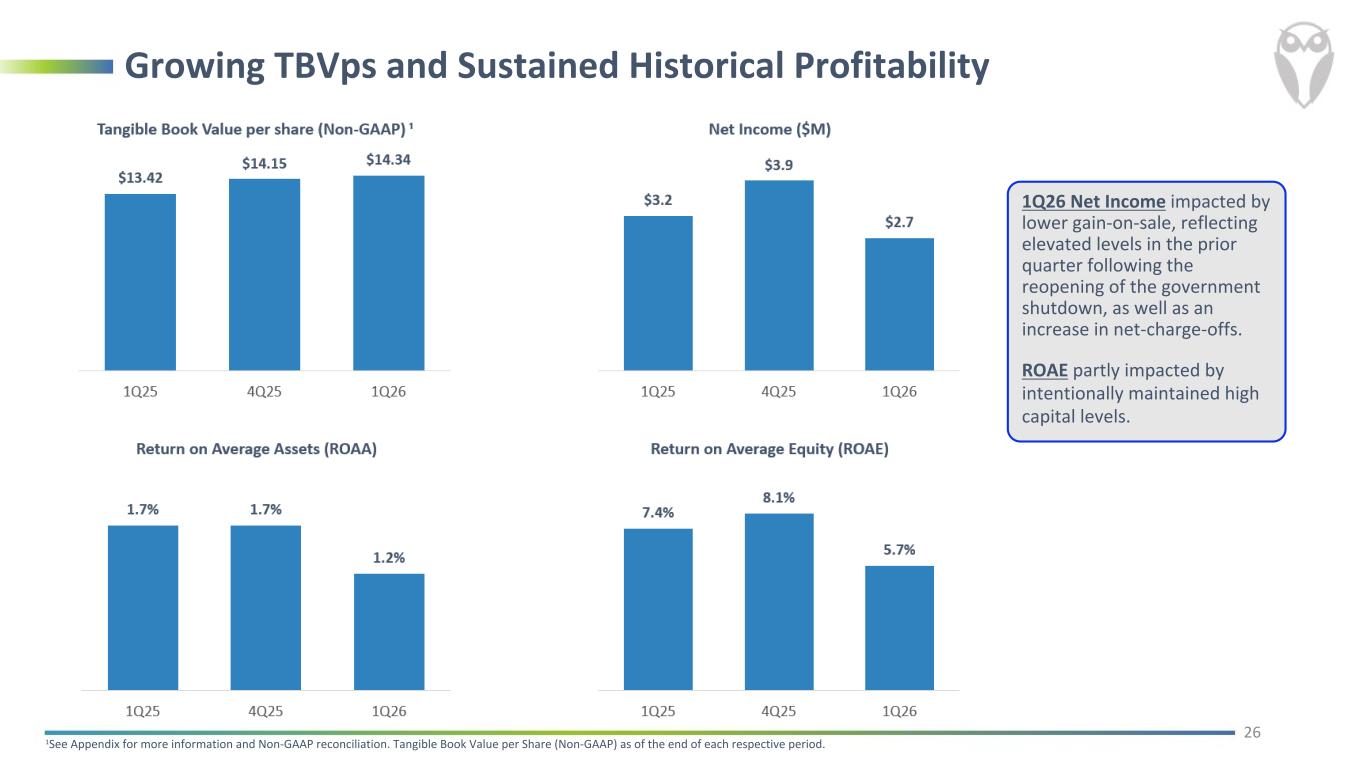
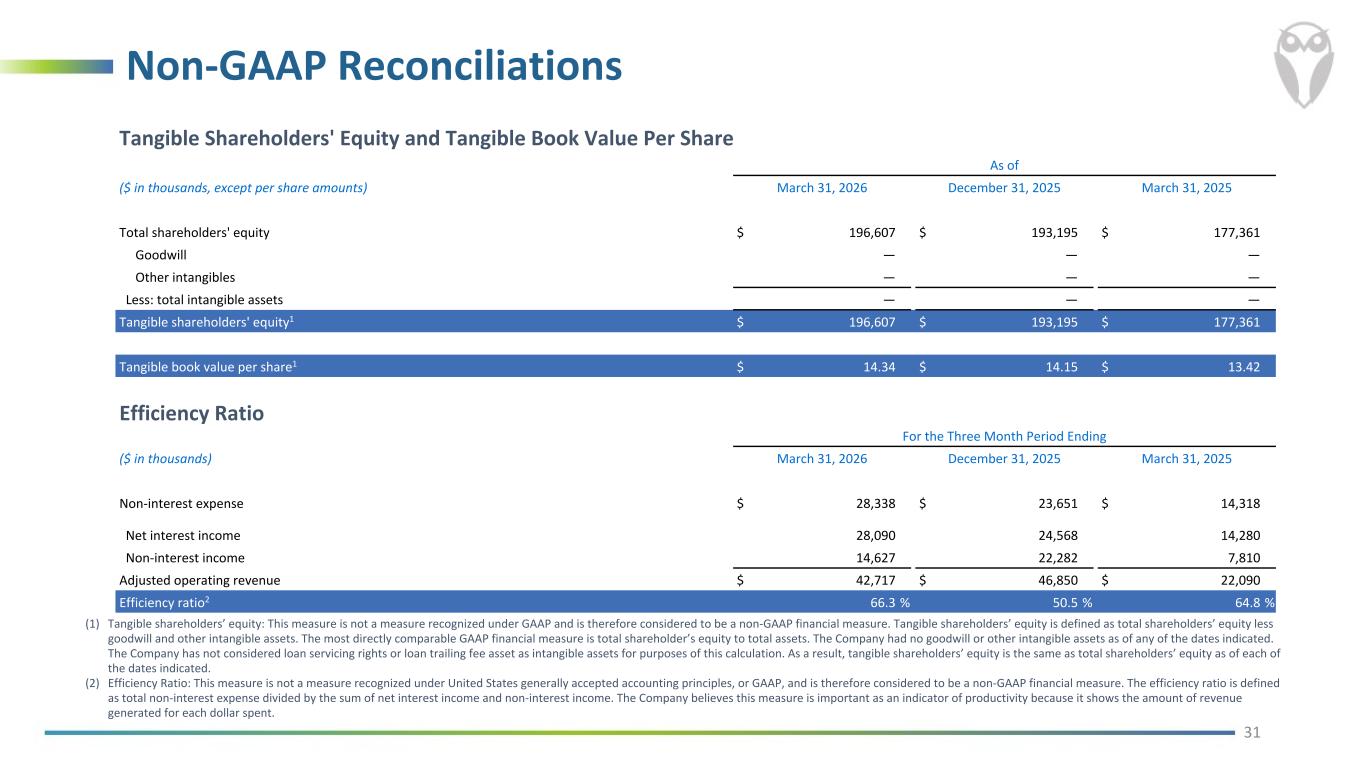
Thanks, Ken. Before discussing our results, I want to say that I'm honored to step into the role of CEO of Finwise. and grateful for the trust the board and Kent have placed in me. This was a thoughtfully planned transition, and I've been fortunate to work closely with Kent for many years. With a strong team, clear strategy, and disciplined operating model, I will remain focused on executing our strategic plan and building long-term value for our stakeholders. So, I want to start by addressing our earnings shortfall this quarter. It was primarily driven by an increase in charge-offs in our SBA portfolio, concentrated in a narrow set of legacy credits. While we are confident in our overall portfolio, we expect these charge-offs to remain elevated over the next few quarters as those credits continue to be actively managed. I'll walk through more details of that segment during the credit section. I also want to provide my perspective on the business. FinWise has multiple growth engines, and they're at different stages of maturity. We manage 16 lending programs today. Our credit enhanced portfolio scaled from virtually zero to over $100 million in under a year. And cards and payments are just beginning to contribute. This quarter, originations were strong at $1.7 billion, and core expenses held flat, enabling us to grow tangible book value per share to $14.34 at the end of Q1. But from a broader perspective, our partner pipeline continues to strengthen, the platform is scaling, and the long-term trajectory of this business is exciting. Turning to quarterly trends, first quarter loan originations totaled $1.7 billion, up 38% year over year. Performance reflected contributions from both established, maturing partners and newer launches. Our strategic partners platform continues to scale effectively. This enables us to pursue larger and increasingly impactful opportunities and offers the flexibility to absorb partner and product changes over time. As with any growing platform, quarterly volumes will vary with partner mix and seasonality, but the underlying trajectory is clear. As a reminder, 2025 was a very strong year, during which we announced seven new strategic partners across lending, cards, and payment programs, including our first major credit card program. Our partner pipeline is growing materially, both with new partners and new products from existing partners. We are increasingly sourcing more mature loan origination opportunities and we are gaining traction with new card and payment programs. To support this effort, we recently added two seasoned professionals to our business development team, both of whom bring deep industry relationships and are well positioned to manage the opportunities that are coming in. Credit enhanced balances at quarter end stood at $109 million, an increase of $1 million during the quarter. We recognize this was below our guided pace of $8 to $10 million per month, and I want to address that directly. The slower sequential growth this quarter was driven by the pace at which newer partners ramped originations. This is not a change in demand for the product or in our partner's commitment to the program. We continue to expect organic growth of $8 to $10 million per month on average for the full year, with the growth now skewed toward the middle and back half of 2026, as Bob will detail in his outlook. The long-term economics and growth potential of this product remain central to our plans. Turning to our bin and payments business, we continue to build traction. Earlier this month, we announced a new program with Vera, an early-stage fintech led by an experienced management team. The introduction to Vera originated through Zeta, a card processing partner of the bank. We are encouraged by the opportunity to further develop our relationship with both companies over the long term. As fintech partners increasingly value broad product capabilities, we are expanding relationships through both new programs and incremental cross-selling. The growth in interchange income this quarter to $703,000 from $310,000 last quarter reflects the early contributions from our credit card portfolio and reinforces the cross-sell thesis, as this came in conjunction with a credit-enhanced balance sheet partner. On the AI front, we have established a dedicated AI and innovation team to centralize and accelerate use cases already in demand across the bank. initial deployments are focused on developer productivity automation and increasingly operational workflows we will continue to provide updates on our progress throughout the year turning to credit quality quarterly net charge-offs were 9.4 million in q1 compared to 6.7 million in the prior quarter net charge-offs included 4.8 million from strategic program loans with credit enhancement, $2.3 million from strategic program loans without credit enhancement, and $2.2 million from our core portfolio, primarily SBA 7A loans retained balances. I'll now provide a bit more detail on each net charge-off category. Starting with SBA net charge-offs, these were concentrated in a small subset of legacy credits, primarily within the e-commerce vertical and certain origination years. This largely reflects a backdrop of still elevated interest rates continuing to impact certain origination years and, to a lesser extent, certain industry and loan attributes that we have implemented material policy tightening and restrictions on. Importantly, as I noted earlier, these charge-offs are likely to remain elevated over the next few quarters. We remain confident in the overall portfolio and will continue to update you on this. With respect to charge-offs from strategic program loans with credit enhancement, the sequential increase in charge-offs primarily reflects the normal seasoning of a rapidly scaling portfolio and FinWise is fully reimbursed for any losses. Each fintech partner with credit enhancement is required to maintain a cash reserve deposit at FinWise, which is used to recover these charge-offs. As a reminder, the credit-enhanced portfolio grew materially from virtually zero 12 months ago to over $100 million today. It is reasonable to expect charge-offs to rise as the portfolio matures and grows. Before a FinTech partner is approved for the credit-enhanced program, we thoroughly analyze their high water loss experience and stress it by 50% and 100% to confirm the cash flows from the loans are sufficient to absorb losses even under those stress scenarios. Lastly, net charge-off activity in strategic program loans without credit enhancement reflects normal repayment behavior for the balances we are managing. Net charge-offs for this portfolio were $2.3 million in Q1 versus $2.6 million in the fourth quarter of 2025. Provision for credit losses was $10.6 million for the first quarter, compared to $17.7 million for the prior quarter. This decrease reflects elevated provisioning in the prior quarter related to the ramp-up of credit-enhanced loan programs, with credit-enhanced balance growth moderating in the first quarter. Of the $10.6 million in provision this quarter, $5.9 million was from credit enhancement loans, with the remainder reflecting the previously described net charge-offs within our core and strategic program portfolios. As a reminder, the provision for credit losses on the credit enhanced loan portfolio differs from the core portfolio, as it's fully offset by the recognition of future recoveries recorded as credit enhancement income in non-interest income. The estimated future recoveries are reported as a credit enhancement asset on the balance sheet. From a reserving standpoint, we continue to take a conservative approach. Our allowances for classified loans reflect the projected net realizable value of collateral and are reviewed at least quarterly. During Q1, NPL balance is increased by $6.1 million sequentially, bringing our total NPL balance to $49.8 million at the end of the quarter. Of that total, $26.7 million, or 53%, is guaranteed by the federal government, and $23.2 million is unguaranteed. Quarterly SBA 7A loan originations increase sequentially, driven by the normalization of business activity following the typical Q4 slowdown and the reopening of the government after the November shutdown. During Q1, we continued selling the guaranteed portion of our SBA loans, though at a slower pace than the elevated level in Q4. We expect to continue selling guaranteed portions as long as marketing conditions remain favorable. Our SBA guaranteed balances, strategic program loans held for sale, and our credit enhanced balances, all of which carry lower credit risk, collectively accounted for 47% of the total portfolio at the end of Q1. So just looking ahead, the platform is scaling, the pipeline is strengthening, and the trajectory of this business has not changed. Charge-offs were elevated this quarter. We identified the segment, have updated our policies, and will continue actively managing it. We have the capital, the partners, the team, and the infrastructure to support continued growth, and that is exactly what we intend to do. I will now turn the call over to our CFO, Bob Wallman, to provide more detail on our financial results.
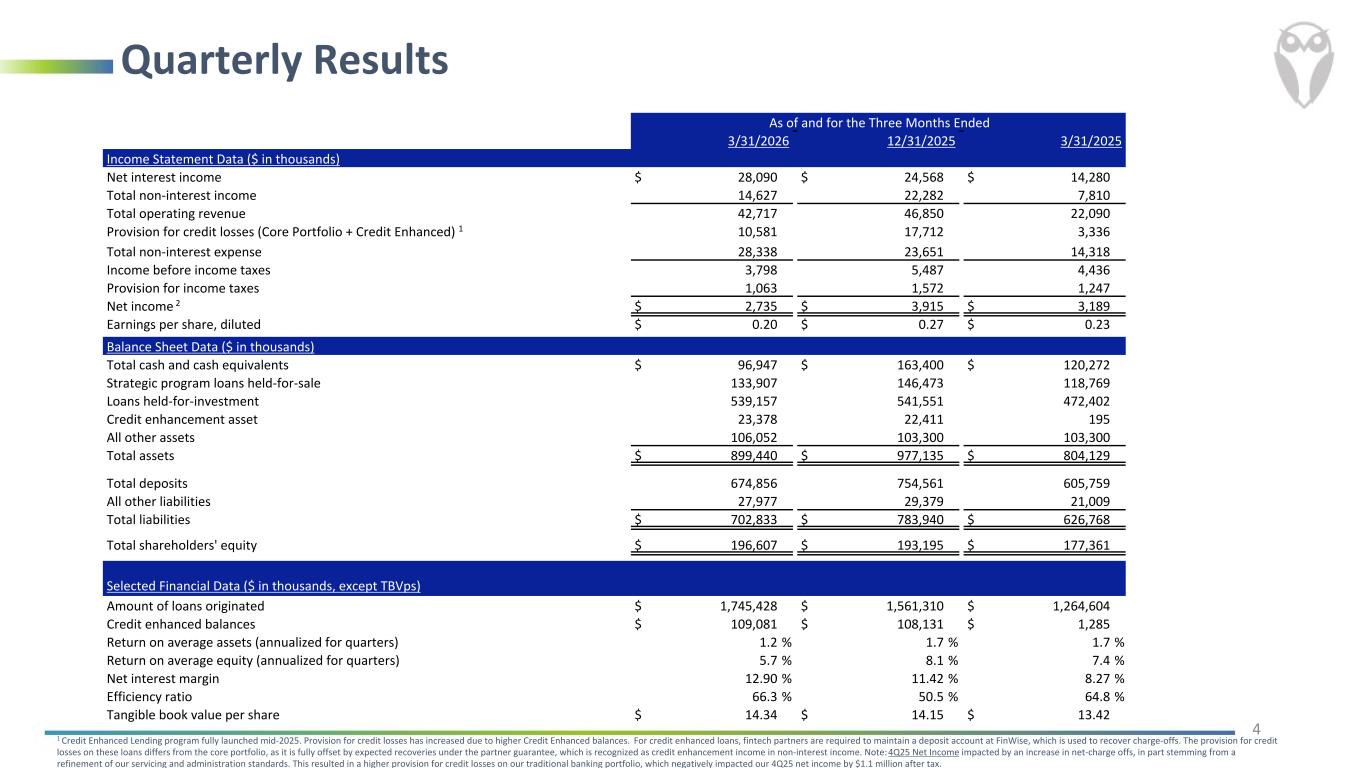
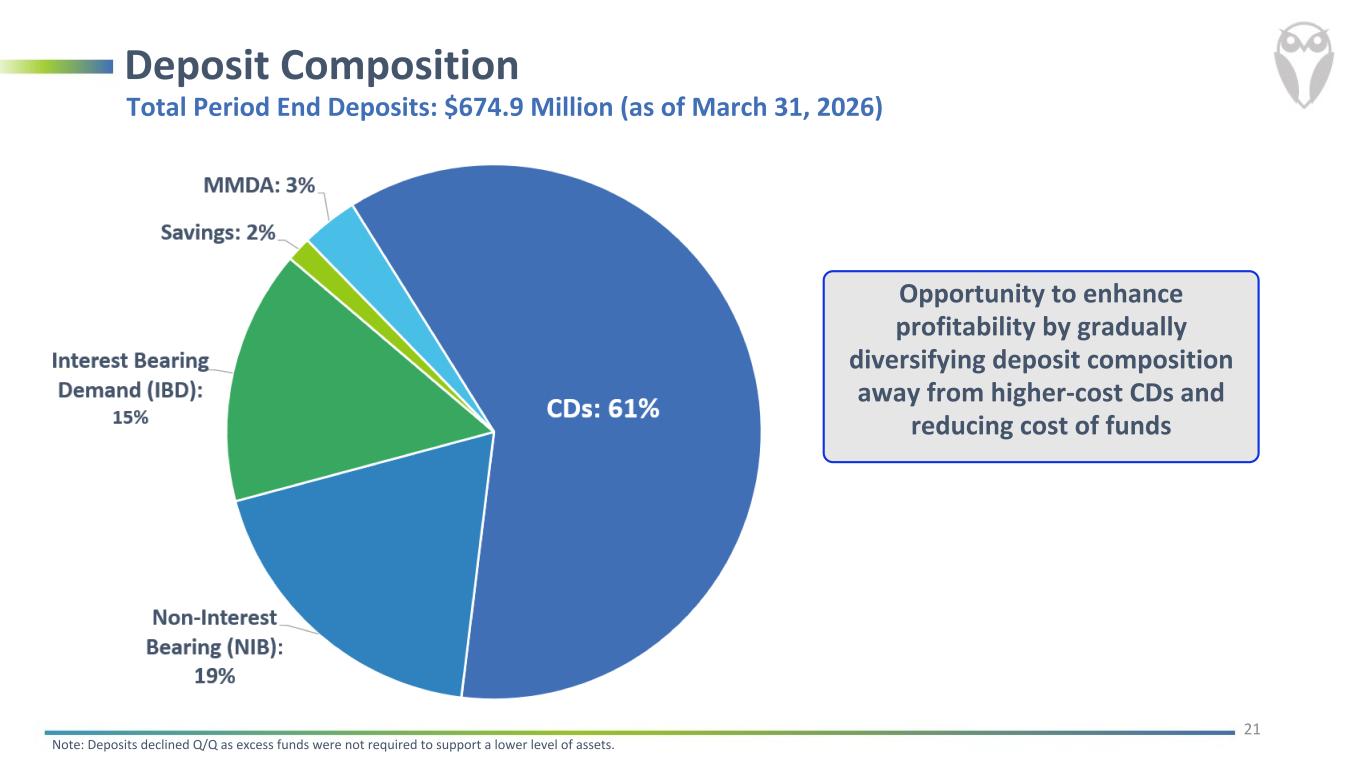
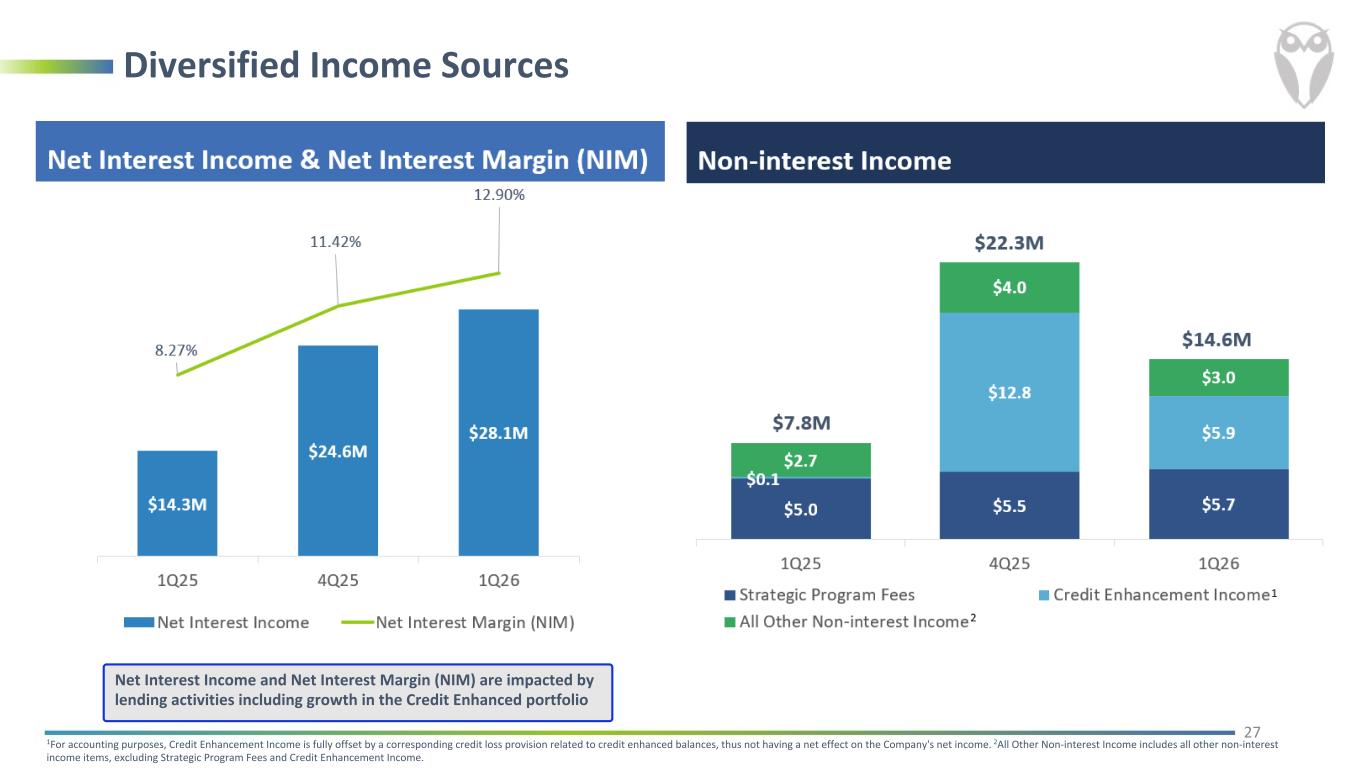
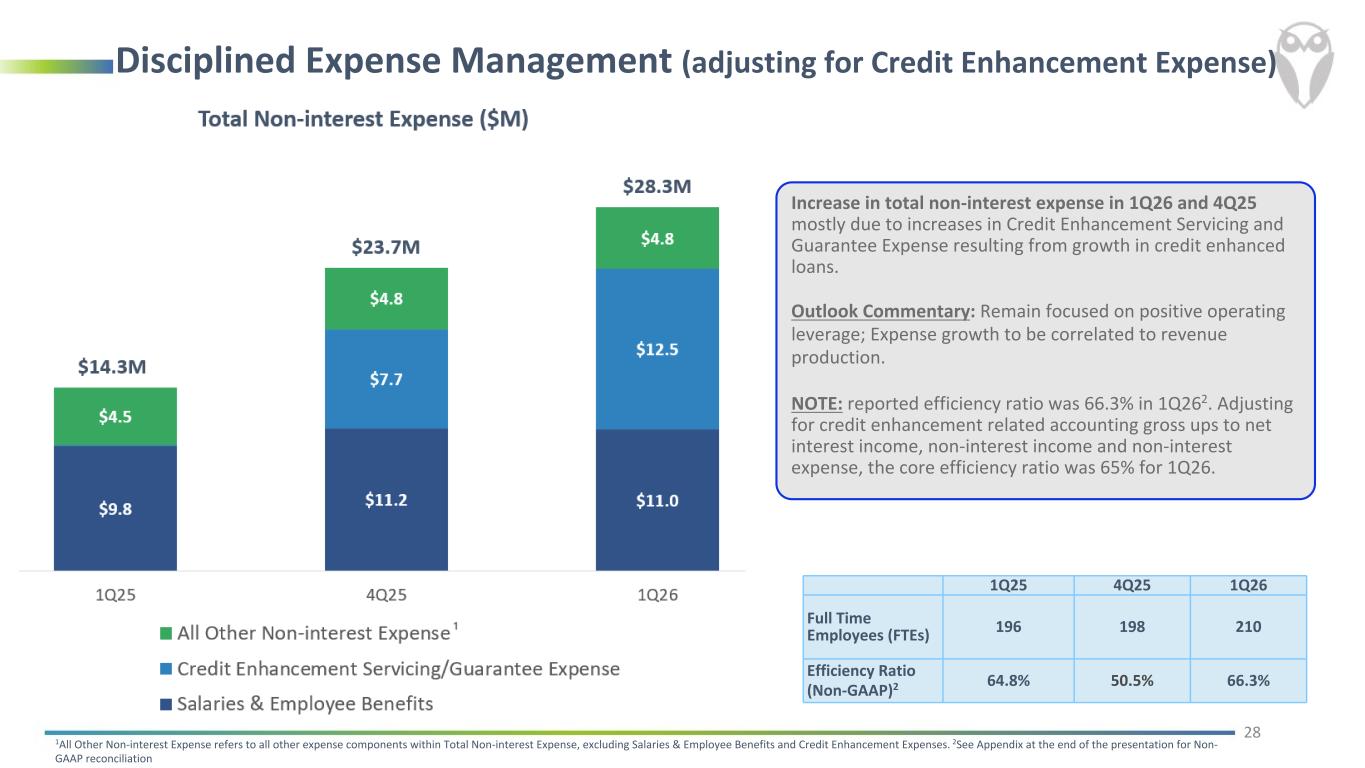
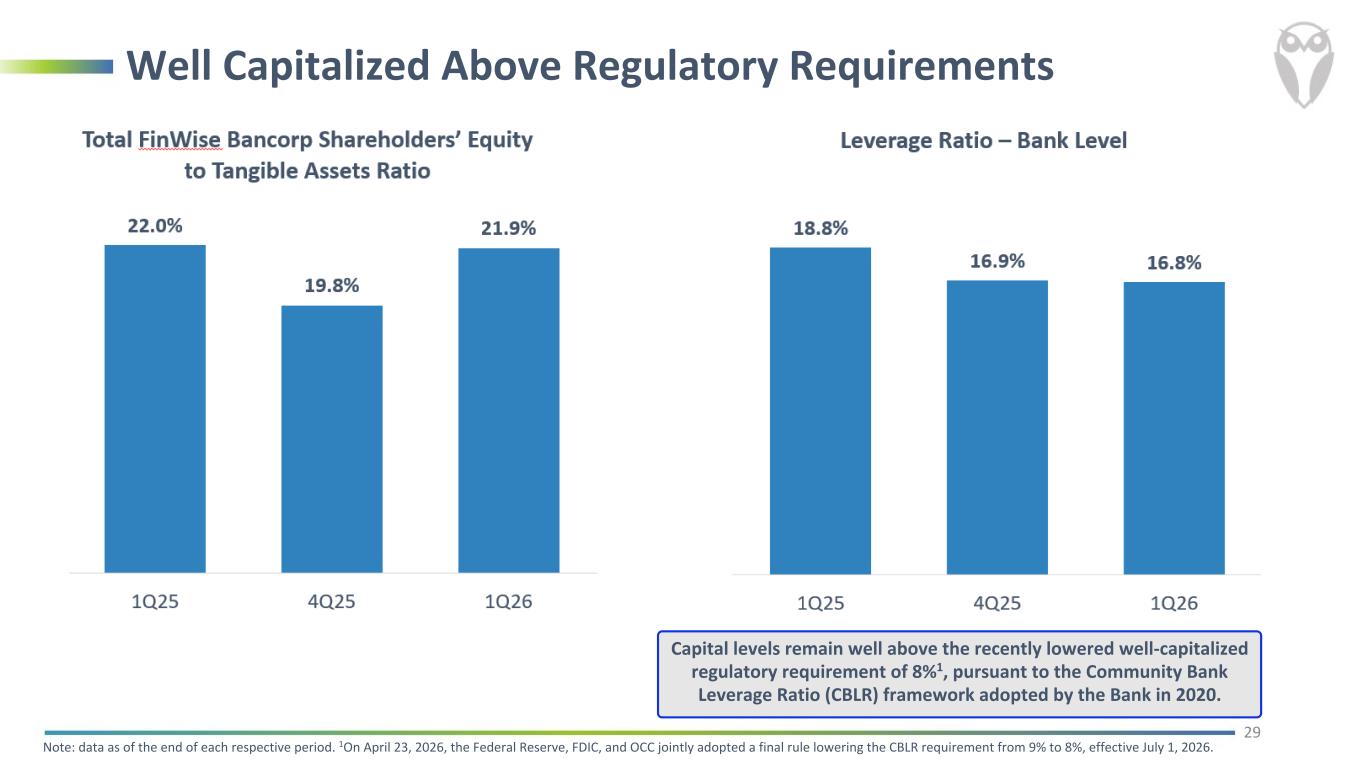
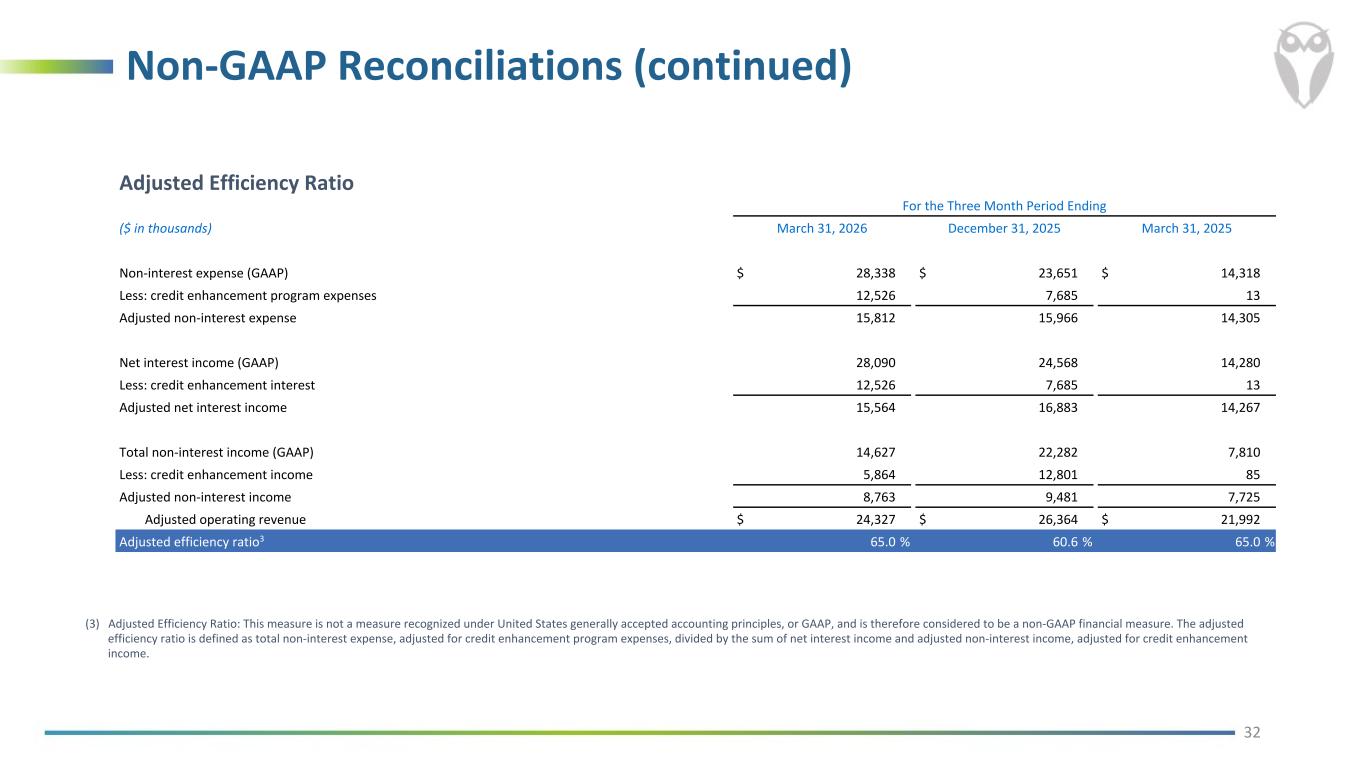
Thanks, Jim, and good afternoon, everyone. FinWise reported net income of $2.7 million for the first quarter and diluted earnings per share of $0.20. sense. Key positive drivers during the quarter included strong loan originations, growth in net interest income and interchange income, and continued disciplined expense management. First quarter results were adversely impacted by lower gain on sale income, a negative change in our BFG investment valuation, and a large provision for credit losses with our traditional banking portfolio. Net interest income grew to $28.1 million from the prior quarter's $24.6 million, primarily due to a change in our estimate of the allocation of interest received on credit-enhanced loans and excess of the interest FINWISE retains, referred to as the excess spread, from origination costs, which are reported as net with interest income, to credit-enhanced servicing and guarantee expenses, as well as an increase in average credit-enhanced balances in the health for investment portfolio, lower average balances, and reduced interest rates paid on CDs. Net interest margin increased to 12.9% compared to 11.42% in the prior quarter. The increase was driven by the change in estimate of the credit-enhanced loans excess spread allocated to origination costs, which is a reduction of income, to credit-enhanced servicing and guaranteed expenses, as well as an increase in average balances in the credit-enhanced portfolio. Net of the adjustment for credit-enhanced program expenses net interest margin was 7.15 percent compared to 7.85 percent in the prior quarter consistent with our ongoing risk reduction strategy and fourth quarter 2025 onboarding of a new credit enhancement program for which our compensation includes both interest income generated by credit cards and a portion of the interchange generated by the card usage as we've noted on prior calls we suggest thinking about our net interest income and net interest margin in two distinct ways, including and excluding excess credit-enhanced income. Non-interest income was $14.6 million compared to the prior quarter's $22.3 million. The sequential quarter decline was primarily driven by lower credit-enhanced income and gain on sale revenue, as well as a decline in the fair value of our BFG investment, reflecting a broader pullback in private company valuations observed in March following heightened global market volatility. As a reminder, credit enhancement income mirrors the provision for credit losses on credit-enhanced loans. Partially offsetting the sequential decline in non-interest income was higher interchange income driven largely by a full quarter of contributions from the credit card portfolio acquired in mid-November 2025. Non-interest expense was $28.3 million compared to $23.7 million in the prior quarter. The increase was primarily due to higher credit enhancement guarantee and servicing expenses resulting from the change in estimated allocation of excess spread on credit-enhanced loans from contra-income origination costs to servicing and guarantee expenses, as described earlier, as well as an increase in average balances of credit-enhanced loans and the resulting growth in the excess spread. Excluding credit enhancement-related items, core operating expenses remained well-controlled. The reported efficiency ratio for the quarter was 66.3% versus 50.5% in the prior quarter. Excluding the offsetting accounting effects of the credit-enhanced loans, the efficiency ratio was 65.0% for Q1-2026 and 60.6% for Q4-2025. Total assets were $899.4 million as of the end of the quarter compared to $977.1 million in the prior quarter. The decline was primarily due to decreases in interest-bearing deposits with small declines in loans held for sale and loans held for investment. Total end-of-the-period deposits were $674.9 million compared to $754.6 million in the prior quarter. The decline was primarily due to runoff of funding, principally non-interest-bearing deposits and brokered CDs that were not needed to support the lower level of assets. Finally, we continue to operate with a very strong capital position, reflected in a bank leverage ratio of 16.8%, nearly double the current well-capitalized minimum requirement to be well-capitalized. Let me provide forward outlook on some key metrics, as we've done in prior quarters. Loan originations for Q2 2026. Originations through the first four weeks of April are tracking at a quarterly run rate of approximately $1.4 billion. Loan originations for the full year 2026. While there may be variability quarter to quarter, we are reaffirming $1.4 billion in quarterly loan originations as a baseline, reflecting typical seasonality from student lending partners. Annualizing this baseline and applying a 5% growth rate provides a reasonable outlook for full year 2026 originations. We will continue to update our originations outlook each quarter as the year progresses. Origination levels are influenced by several variables, including new partner additions and contributions from both established programs and newer launches. Credit enhanced balances for full year 2026. We remain comfortable with organic growth in credit enhanced balances of $8 to $10 million on average per month for 2026. Quarterly results may be lumpy with growth skewed toward the middle and back half of the year. SBA loan sales. We will continue to follow our strategy of selling guaranteed portions of our SBA loans as long as market conditions remain favorable. That said, we expect this quarter's gain on sale of loans to better reflect a sustainable quarterly run rate for the year. Quarterly net charge-offs. We anticipate an approximate range of $4 to $5 million in net charge-offs for non-credit-enhanced loans is a good quarterly number to use in your models for the remainder of this year. Non-performing loan balances for Q2, 2026. We think there is potentially as much as $10 million in watchlist loans that could migrate to non-performing loans in the second quarter. Net interest margin. We remain comfortable with our prior outlook that, when including credit-enhanced balances, the net interest margin is expected to increase, driven by growth in credit-enhanced balances and efforts to lower funding costs. This upward trend is expected to persist until growth in these balances begins to moderate. Conversely, excluding excess credit-enhanced income, we anticipate a gradual decline in margin consistent with our ongoing risk reduction strategy. The efficiency ratio. We remain focused on driving sustainable, positive operating leverage with a long-term goal of steadily lowering our core efficiency ratio, that is, excluding the credit enhancement accounting effects. That said, there may be periods in which the efficiency ratio may increase. Tax rate. While multiple factors may influence the actual tax rate, we suggest using 27% in your modeling.
Operator
With that, we would like to open the call for Q&A. Operator?
Operator
Thank you. We will now be conducting a question and answer session. If you would like to ask a question, please press star 1 on your telephone keypad. The confirmation tone will indicate your line is in the question queue. You may press star 2 to remove yourself from the queue. For participants using speaker equipment, it may be necessary to pick up the handset before pressing the star keys. We asked it, and we'll pause for just a moment, and our first question we'll hear from Joe Yanchunas with Raymond James.
Operator
Hey guys, how are we doing? Good Joe, how are you?
I'm doing well. So I was wondering, can you help with size the remaining pool of these legacy SBA credits? And you know, how should we think about the difference between proactively cleaning up, you know, this specific cohort versus there being some fundamental softening in the industry? And then also, I understand that you called out the e-commerce industry, but is there any specific vintages you could point to where they're concentrated?
Yes. Let me just walk through. Hey, Joe, this is Jim Noon. Let me just walk through, I think, the couple of pieces there. So, to just bound it, it's about $50 million in performing outstanding balances at the end of Q1 that carry these attributes. As far as, you know, what the attributes are, you know, we had a surge in SBA originations back in 22 and 23, specifically in some of the consumer-focused businesses like e-commerce. There's six attributes from a few cohorts there that we zeroed in on. Like I said, it's about $50 million in remaining outstanding and performing balances at the end of Q1. Really importantly, you know, these attributes are what has led to 75% of the MCOs and a similar amount of the unguaranteed MPAs over the last three years. So we feel like we've identified it, we've segmented it, we're actively managing it.
So I think we're in good shape with it. um okay so shifting gears here just kind of want to understand um or make sure i'm thinking about what's going on with the nim here so it benefited from the change in estimates on that excess interest allocation within the credence portfolio but that also flowed through higher servicing and guarantee expenses so one is that right and two what's the cleanest way to think about kind of the normalized earnings contribution from the credit enhanced portfolio after this change or has there been any change to that outlook?
So, Joe, I think that you are understanding it properly. The change in estimate grosses up or increases the interest income and flows through all the way through net interest income, and an exact offsetting amount is recorded as an expense, and so that grosses up the expense, so you understood it exactly. In regards to the performance of the credit hands portfolio, nothing really changes from this change in estimate. It's just, you know, when we first started the program, we thought that this would be the distribution of the expense, particularly a portion that relates to origination, which offsets net income, which offsets interest income, but a year later, now we have some experience with it, and we're looking back at it. We changed that estimate, and we've shifted those expenses entirely to guarantee expense and servicing expense.
Okay, and was that changed, was that recommended by, like, your accounting firm or any of the regulators, or was this just done kind of internally?
This was done based upon our own review, but it has been reviewed and discussed with our external accounting firm.
Okay. Just a couple more for me here. So, with respect to your credit enhanced strategic partners, you know, what's the general duration of these loans? And, you know, have your partners changed their credit box or were there any partners that experienced, you know, outside losses that might have surprised them? And then just also some color on the health of these fintechs that are supporting these loans.
Yep. So there's five programs right now that are live in that program, Joe. As far as the average term, you know, they vary because they are five different programs and products that are being managed there. But I would tell you that they are on the shorter end generally. I would say on average it's probably like 15 months. Um, if you look at the pool in total, um, as far as like the health of the partners that are there, uh, and the results in this quarter, you know, we grew this from virtually zero to a hundred million in a year. Um, and we were able to beat the high end guidance at the end of 25. But we were, you know, I was disappointed in the Q1 balances that they didn't grow, you know, from year end. The product is still central to our long-term plans. And we know our business well enough that we know this stuff is lumpy sometimes. The guidance is intact for the full year. We are expecting one of our partners to grow meaningfully, you know, in that program here in Q2 and Q3. We'll update you again next quarter. as far as you know the other partners they did moderate during the quarter so you know where the growth is going to come from of those five partners you know over the next call it two quarters is likely from one of our partners the others have kind of uh slowed down on their on the growth in that product um or at least they did in q1 i'd like to add one other slow down be because of demand for the product or, you know, appetite around kind of the current credit environment or the losses that we're seeing in the portfolio? No, it has to do with normal balances and kind of like the trajectory of that product with those three partners. You know, we knew about where they would start to plateau out in their balances, at least for the products that we have with them right now.
Operator
So that's the answer.
Okay, then last one for me here. So if we were to look out two to three years, or you could pick a duration, where do you see credit-enhanced loans as a percent of loans held for investment?
There's no way for me to forecast that for you, Joe. I would just tell you that, you know, the balances were virtually zero nine months ago. We are still on the beginning of that growth curve, but it's incumbent on me to bring additional partners in and work with our business development team and our fintech team to bring those partners in to grow our balances. This is central to the strategic plan that we have that's been approved by the board, that we've talked to investors about, and I feel good about the program. Like I said, our guidance for the year is still intact. but we didn't have the growth that we thought we would have in Q1. We had more growth than we thought we would have, you know, for fiscal year 25.
Operator
All right. Well, I appreciate you taking my questions. No problem.
Operator
And next, we'll move to Andrew Turrell with Stevens, Inc. Hey, good afternoon.
So, just thinking on the last point, you know, If I were to take the kind of original 8 to 12 a month kind of guide, you know, you should by the end of the year be $215 million or so to $250 on credit enhanced balances. Do you still feel like you can achieve that by the end of the year?
That is still our expectation, Andrew.
Okay. Okay. And, Bob, are you able to quantify the – I think I understand what's going on with the excess spread. We talked about it a minute ago, but are you able to quantify the dollar amount that that impacted the guarantee and servicing expense lines by this quarter?
Operator
I certainly can, but I don't have that with me, Andrew.
Okay. I can follow up. Um, I think last quarter, Bob, we talked about a 56, 57% type efficiency ratio in 2026. I know the, the, the excess spread kind of change impacted a little bit of efficiency, but even accounting for that running, you know, well North on efficiency versus those expectations. So I just wanted to hear from you, you know, updated kind of expectations around either full year efficiency or where you think you can manage efficiency at moving forward.
Um, certainly I can do that. I think the important part to note first is that by increasing the revenue and the expense when you do the efficiency ratio, you know, that portion of it is, you know, one for one. So, you know, that does make the – getting the efficiency ratio down to the level that we had previously stated or previously forecast, it makes it more difficult. But I do think that, you know, the key, you know, we have been controlling our expenses, I think, very well over the past three or four quarters, and we'll believe we continue to explore expenses. The key, then, to getting that efficiency ratio down is going to be growing our revenues, which we are focused on at this point in time. Given the expense numbers that we have right now, you know, considering that they're inflated, it would require us to have about a $2 million increase in revenue, you know, to get that efficiency ratio down to 60%. I think that's still possible. I think that's very possible for this year. And I would expect to be able to continue that going forward. When we are bringing on new partners, we are looking at the efficiency ratio, the operating leverage ratio, and most of those partners will be coming on well below that, call it the 50% mark. And so I think that we'll continue to work on it.
Operator
We'll get it down to – it's just going to take a little bit longer, but we will get it back down to the mid-50s.
Okay, understood. Good. Maybe for Jim, I think in your opening remarks, I think you made a comment to the tune of you were increasingly sourcing more mature lending opportunities or lending partner opportunities. Can you maybe unpack that a bit for us, both on the lending side, but then more broadly, just what you're seeing top of funnel, how the SKU is changing from smaller to larger, if it is, and I know, you know, there's, it takes some time to onboard new partners, but just want to get a sense of kind of what you're, what you're working on, how you feel about the pipeline right now.
Sure. Yeah. So based on what we're seeing, Andrew, you know, the lending pipeline is stronger than I've seen it, you know, in my eight years at the bank, you know, we, we intend to keep executing to convert that pipeline into contracts and announcements. You know, we announced a new product with Albert at the end of February. We're very supportive of Enon and Malcolm and their team there. They do a great job. And just generally, our business development team has their hands full right now. As far as, like, color on the, you know, on the growth in pipeline there, I would say, you know, where historically we had, you know, we had invested in cards and payments. And historically, we continued to have success from lending partners that wanted cards and payments rather than those as standalone products. I think that that's likely to continue to be the case for another quarter or two. But we are starting to see meaningful opportunities on both of those new products. Overall, I characterize the pipeline as probably about 50% lending, 50% split between cards and payments. And I think by the end of the year, we'll have some good announcements on winning a couple partners here. So, I should be able to give you a better update next quarter.
Okay, great. Thank you for taking the questions.
Operator
And next, we'll move to Manuel Navas with Piper Sandler.
A quick follow-up on some of that last commentary. Where will we see card and payment wins? Is that only in the interchange line? Where else will we see that in fees?
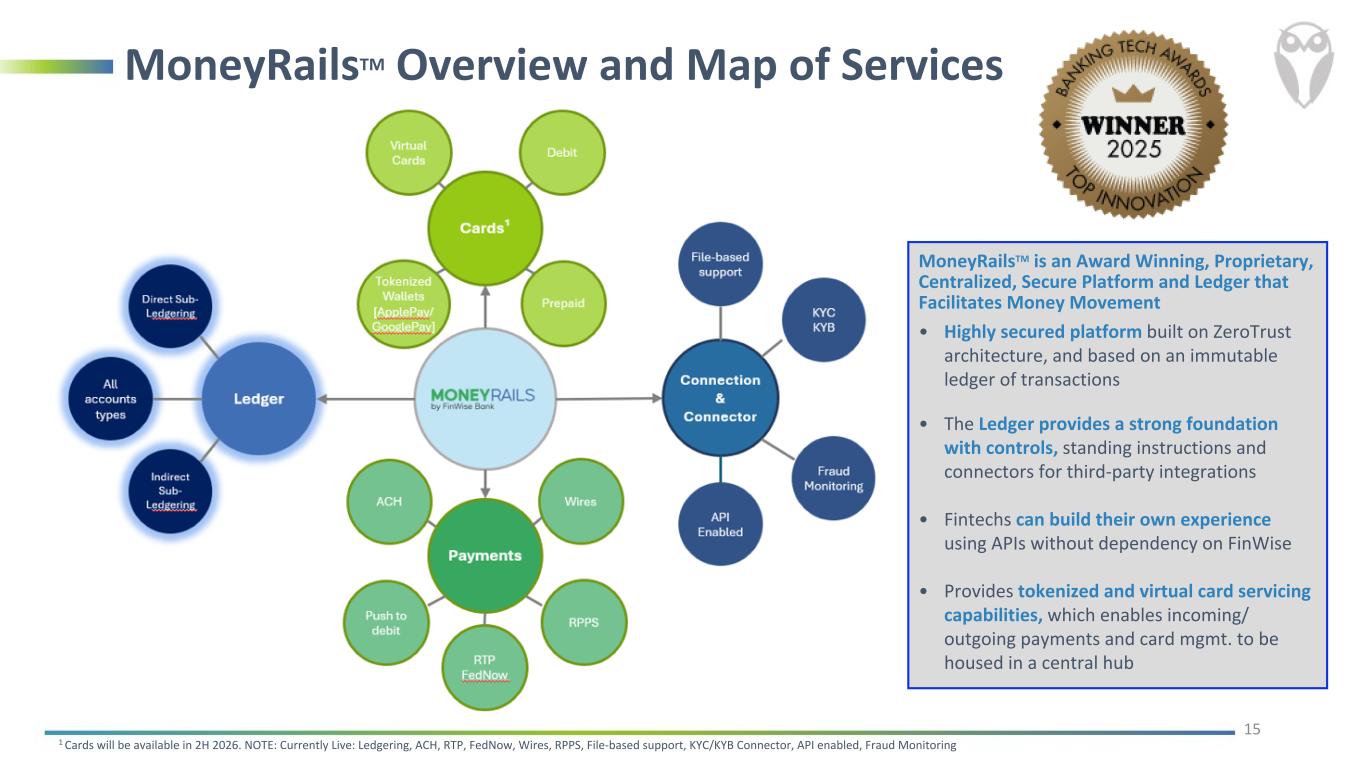
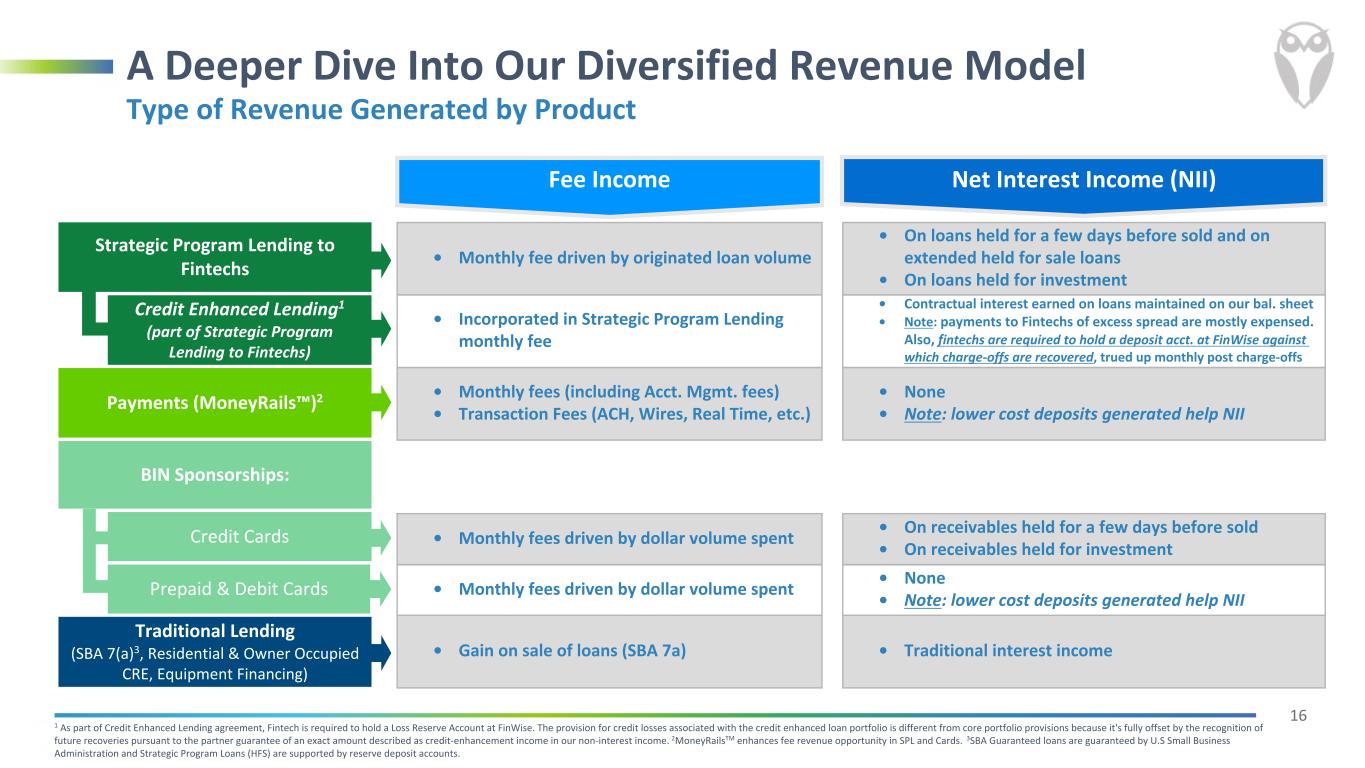
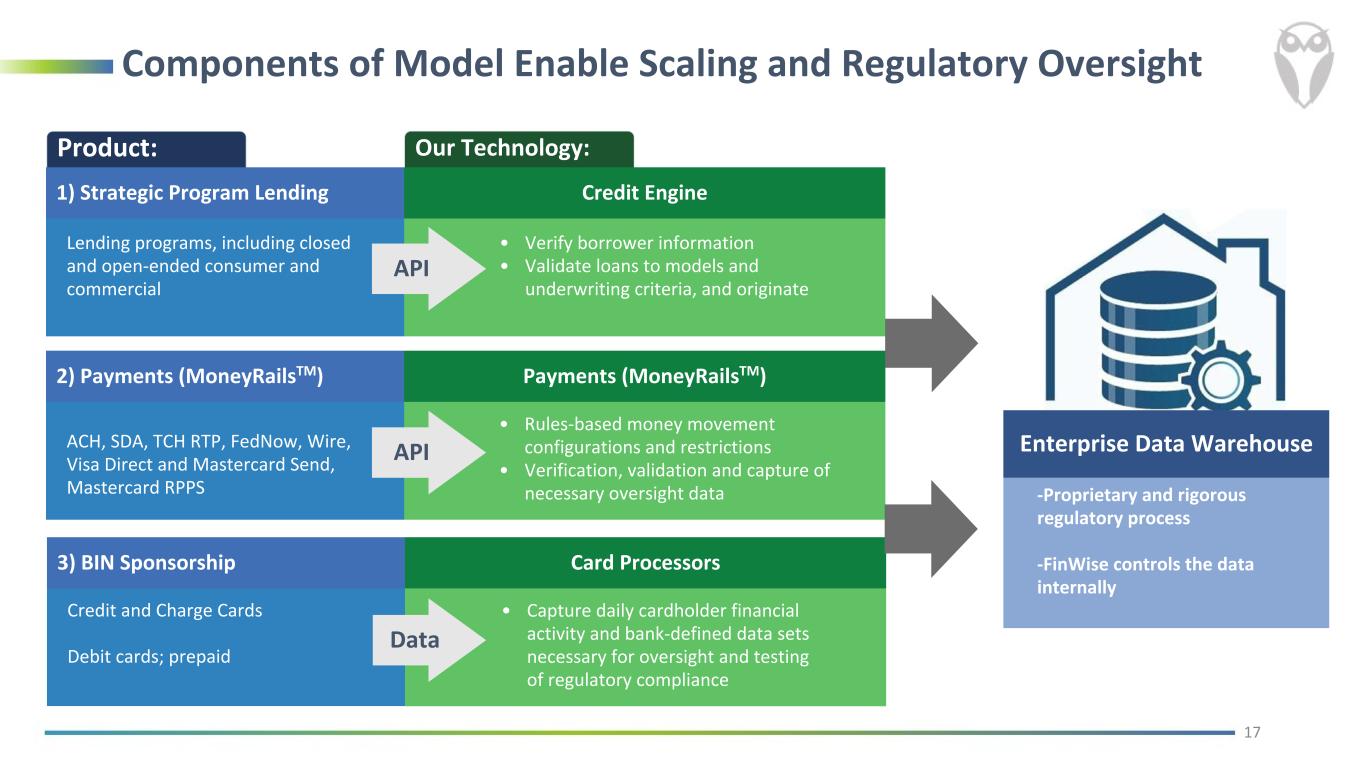
So with the cards and payments, you will see, I mean, on the payments, it's going to be coming through that fee line. On cards, it's going to come through depending upon a couple of different things. One, if they are interested in the credit-enhanced balance sheet and balance sheet some of that, we'll see some of that come through in interest income. If they are, you know, it's that they, and in that particular case, if they're doing credit-enhanced, they'll also need to supplement that with some interchange, so we'll see some revenue there. Other than that, it will be processing fees.
Operator
Processing fees.
And I also want to mention, I also want to mention one other very important thing, particularly on the payment side, that business is frequently accompanied by significant deposits. And so we will look to see significant deposit increase, which will allow us to change our funding structure some. If we can get several of these new partners in here, we could significantly decrease our broker deposits and our cost of funds.
I appreciate that. Can you give any color on what was the makeup of originations this quarter? and what pieces of it kind of stepped down towards the lower rate for the rest of the year?
Yeah, no problem, Manuel. This is Jim. So the originations were really strong in the quarter at $1.7 billion. You know, that exceeded our guidance of $1.4. And it's up, you know, 38% year over year. As far as the composition, it's the seasonality of student lending that surged. And that was a big portion of the quarterly uptick. The higher rate lenders were down in the quarter, which is also typical in Q1. And then the rest of our lending partners, it was kind of a mix with nothing that, you know, stood out one way or the other materially. The one thing I would point out, you know, you're continuing to see this, you know, gradual step up. And I just want to remind everyone, you know, we were at $850 million in originations three years ago, in quarterly originations three years ago. So I'm really happy with the consistent increase that we've managed in getting to $1.7 billion this quarter.
Where is some of the higher headcount in the quarter? Is it compliance, operations?
Operator
Oh, you're talking about the increase in the headcount in the quarter?
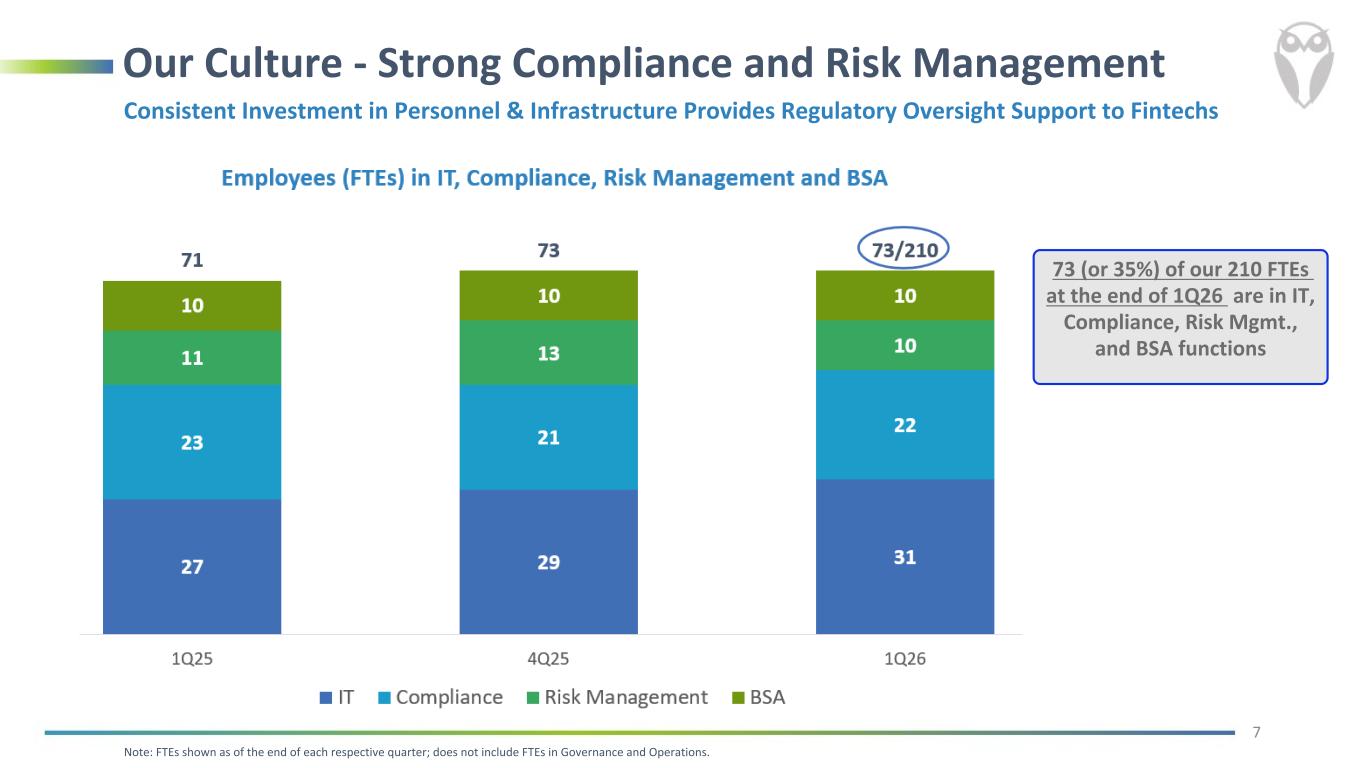
The headcount that we had in the quarter, we brought on a few additional people focused on facilitating growth, as Jim has talked about, and also to facilitate improved efficiencies through AI adoption. So when you take a look at the particular areas, we saw that FinTech business development. So that would be the marketing side increase. You also saw a little bit of an increase in technology for that is the AI, as we are emphasizing that across the organization. And you also see a few headcount increase in the onboarding program, excuse me, in operations where we have the onboarding program for the new programs we anticipate coming through here in the next couple quarters.
Thank you. I'll step back into the queue.
Operator
Next, we'll take a follow-up question from Joe Yotanis with Raymond James.
So, I just wanted to revisit your guide for origination. So, on an annual basis, you annualize the $1.4 billion. You still have a 5% growth rate on that. But then when you remove what happened in 1Q, it seems like you're kind of calling for, you know, $1.4 billion over the next few quarters, which would include the seasonal step-up in student loan originations that occur in the third quarter. I mean, is that just a conservative view, or is there something that might have impacted or that could impact that seasonal uptick that we see in the September quarter?
You're correct, Joe. You know, the $1.4 billion is the baseline that we proposed to use for modeling and it strips out the student lender the student lending seasonality and then you annualize that apply five percent growth and that's what we've used as far as guidance for the year so you're correct in that it's the student lending seasonality that we are not accounting for okay so assuming that seasonality does occur you know that annual guide is probably lower than what you're kind of expecting.
The best way to say it, seasonality would pull from 2Q and 4Q of 26.
Yeah, there's nothing specific to student lending that indicates that, you know, private student lending is certainly going to be in any sort of contraction mode. I think it's the opposite. But, you know, what we are comfortable with giving as guidance is $1.4 billion quarterly with a 5% growth rate as far as the annual 2026 originations.
Operator
Okay, thanks. You're welcome.
Operator
We do have a few questions via email, and I will turn the call over to Juan Arias, Head of Investor Relations.
Thanks, Operator. We got a couple of questions that came in. First one, can you comment on if you see a potential impact to your business from fintechs pursuing bank charters?
Operator
Yes, no problem, Juan.
There's been a number of developments with fintech banking and charters the last three months, so I think it's good to address a couple of the items first. Generally, the industry of bank sponsorship, it's always changing. Right now, there's some large diversified fintechs that are seeking bank charters during a window that appears open. You know, that path works for a handful of large diversified players. But for the vast majority of fintechs, partnering with an experienced sponsor bank remains the faster, more capital-efficient path. And that's driving a growing wave of inbound interest towards banks like ours. Charters pull a few large players out, but I would say simultaneously, they also, they validate the model and drive dozens of others towards sponsor banks. And the investments that we've made over the past several years position us really well to capture that demand. I did want to just say, you know, Upstart filed its bank charter in March, and OpFi announced its agreement to purchase BNC National Bank on Wednesday. There was no immediate change to our business from the regulatory applications they have filed, and we were in contact with both of them ahead of the public announcement. As they work through their regulatory process, we will continue to support them. And I don't know how many fintechs in our industry will apply for charters, nor how many will receive them, but the lending pipeline at FinWise is stronger than I've seen it in my eight years here, and that is what we managed to.
Thanks, Jim. We got another question, and it's actually for you. As you look ahead to your first 12 months in the CEO seat, what are your top three priorities?
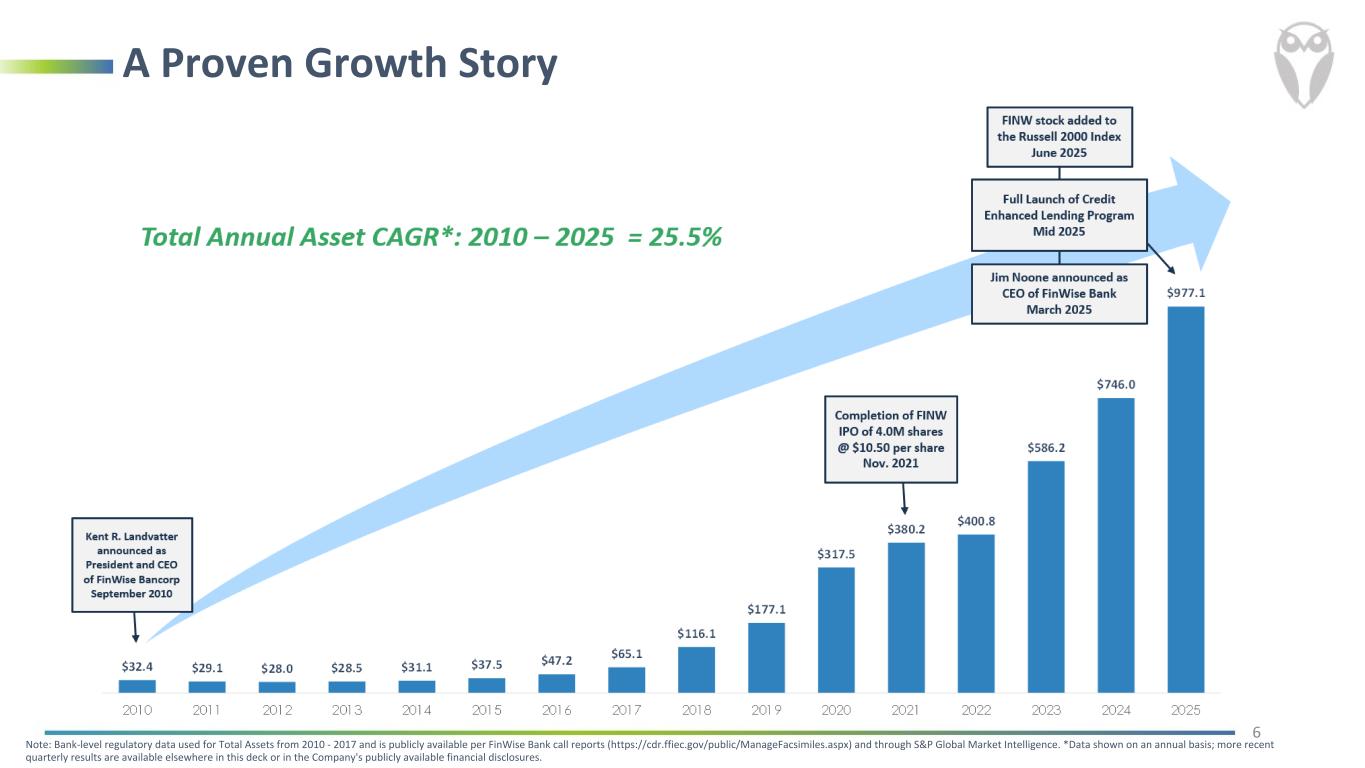
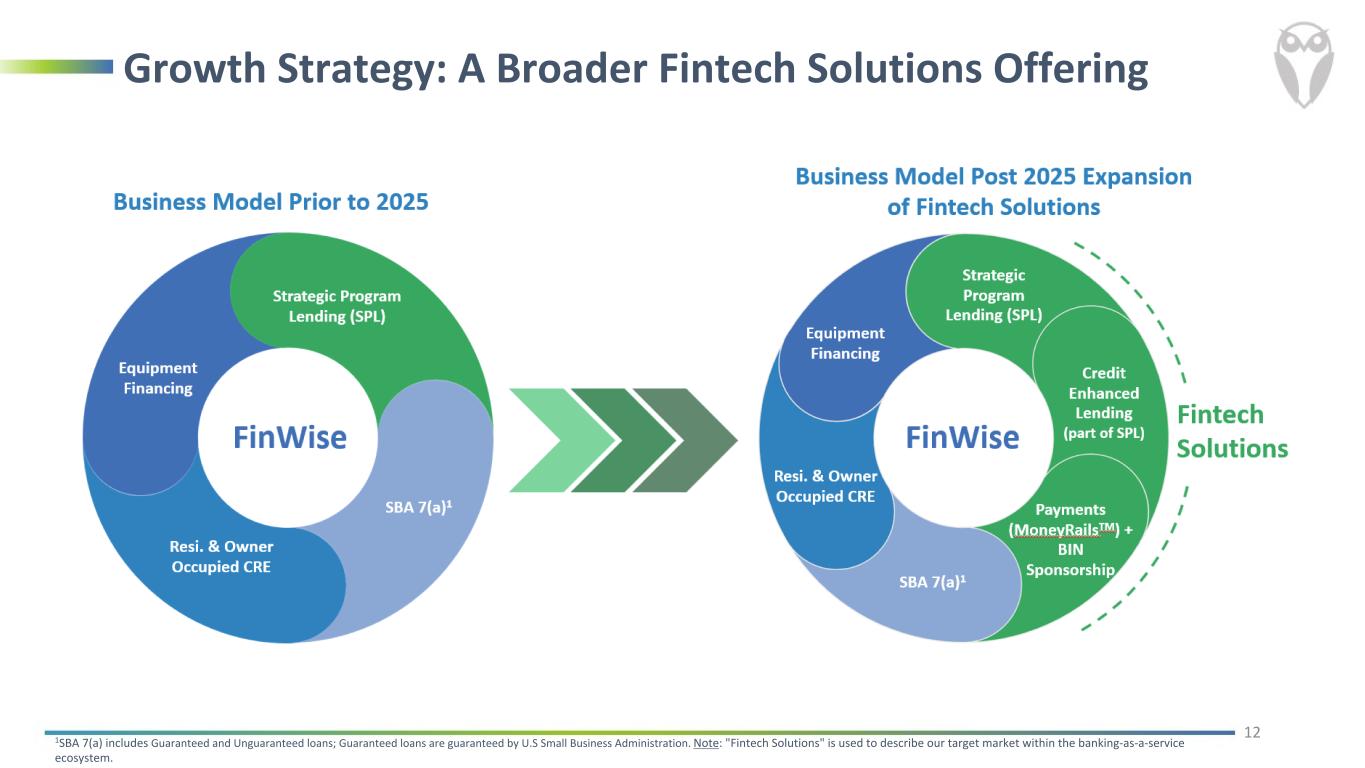
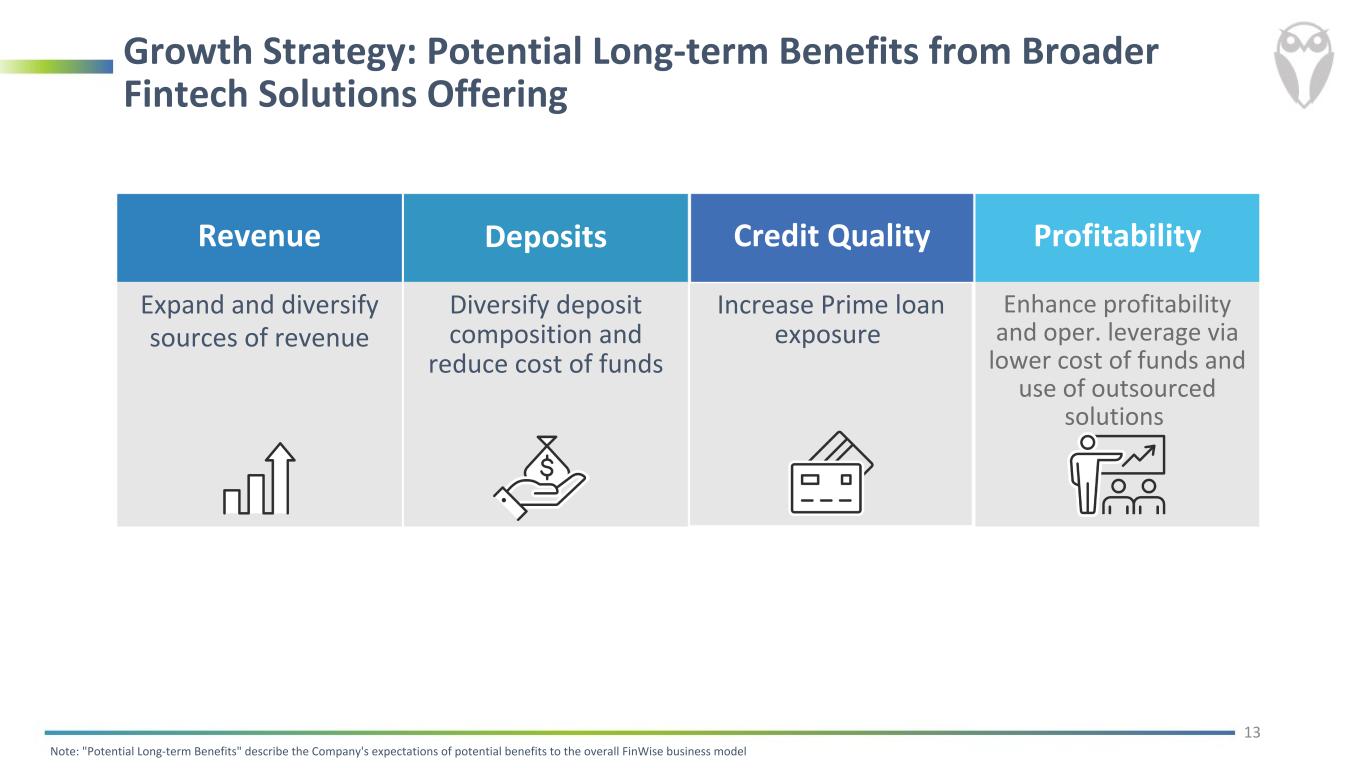
Happy to address that. I think first, some context on the transition itself. You know, this was deliberate. It was a multi-year succession plan developed by the board. I've worked alongside Kent for many years, and I'm grateful to him and the board for their trust and confidence. My role as CEO is straightforward. board, align our quarterly and annual execution with the strategic plan approved by our board and filed with our regulators, and set the tone across the organization to deliver on And I want to be direct about my commitment. I moved my family across the country eight years ago because I believed in this company and wanted the opportunity to be in exactly this seat. We had $65 million in assets at the time. We now have the capital, the partners, the team, the products, and the infrastructure. My focus is making sure that those pieces work together with discipline and speed to create meaningful value. In terms of specific priorities, you heard much of it in our prepared remarks. First, we need to support the momentum that's already coming through our business development team. Originations were $1.7 billion in the quarter, and our pipeline for both new partners and new products is strong. Second, we will continue to empower our credit and compliance teams to identify and prune risk proactively. You're seeing that right now in a segment of our SBA program, but this is not new for us. We took similar disciplined actions in our fintech programs in 2019 and again in 2022. active oversight and risk management is part of who we are and it will continue and then third being a multi-product platform carries enormous value for our bank and our shareholders we saw this with credit enhanced lending where we built the product capability onboarded the partners and in 12 months grew that portfolio from zero to over 100 million that same model building the infrastructure piloting it marketing it and then beginning to launch the right partners is just now turning the corner in cards payments and deposit sponsorship so in the same way that our compliance investments positioned us during a previous cycle these product investments are positioning us for exactly the cycle we're now aren't entering then finally with more fintech seeking sponsorship and our platform now offering lending cards payments and deposits. I believe that we are entering a very strong period for new partnerships over the next 12 to 24 months. So to answer your question simply, the strategic direction doesn't change. What's changing is the pace of opportunity in front of us, and it's my job to make sure we capitalize on it for the long-term benefit of our shareholders.
Operator
That will conclude today's question and answer session. In addition, it does conclude today's teleconference. We thank you for your participation, and you may disconnect your lines at this time.