Operator
Hello, and welcome to today's Shift 4 Payments, Inc. Q4 2025 Earnings Conference call. At this time, all participants are in a listen-only mode. Later, you will have the opportunity to ask questions during the question and answer session. To register to ask a question at any time, please press star 1 on your telephone keypad. We will be standing by should you need any assistance. It is now my pleasure to turn the meeting over to Thomas McCroen, EVP, Investor Relations. Please go ahead.
Thank you, Operator, and good morning, everyone, and welcome to Shift4's fourth quarter 2025 earnings conference call. With me on the call today are Taylor Larber, our CEO, and Christopher Cruz, our chief financial officer. This call is being webcast on the investor relations section of our website, which can be found at investors.shift4.com. Today's call is also being simulcast on X spaces, which can be accessed through our corporate X account at Shift4. Our quarterly shareholder letter, quarterly financial results, and other materials related to our quarterly results have all been posted to our IR website. Our fall and earnings materials today include forward-looking statements. These statements are not guarantees of future performance, and our actual results could differ materially as a result of certain risks, uncertainties, and many important factors. Additional information concerning those factors can be found in our most recent reports on Forms 10K and 10Q, which can be found on the SEC's website and the Investor Relations section of our corporate website. For any non-GAAP financial information discussed on this call, the related GAAP measures and reconciliations are available in today's quarterly shareholder letter. With that, let me turn the call over to Taylor. Good morning.
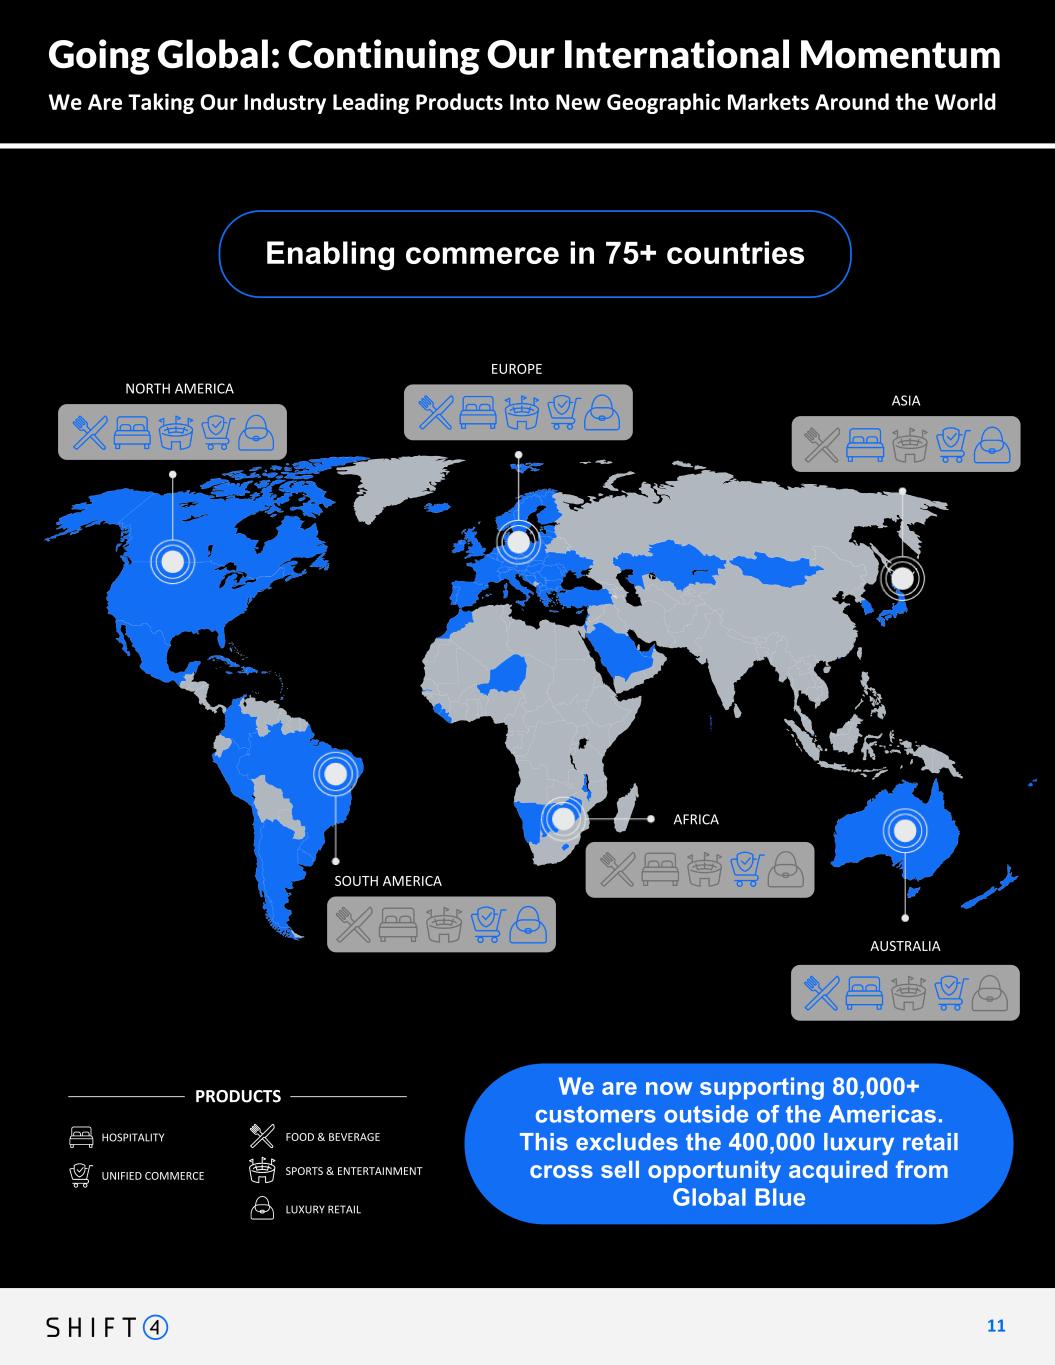
It's great to be speaking with you all. 2025 was yet another pivotal year for Shift4. We produced record results, executed on transformative M&A, grew nicely, and diversified the quality of our business. That's all while overcoming the occasional setback in more ways than one. We also fundamentally strengthened our global footprint, our technology capabilities, and organized our talent around our priorities that will continue to move the needle in 2026. As mentioned in my shareholder letter, the rapid expansion across multiple verticals has created confusion as to exactly why we win and who we compete with. This is understandable, but from our perspective, each vertical we serve is carefully selected based on the lessons we've learned over 28 years. Contrary to popular belief, we are in these verticals because we view the competitive landscape as narrow and, as such, typically have one or fewer good competitors in each vertical. To simplify things for everyone, I will succinctly say that we power the experience economy. We enable businesses to deliver the moments that matter and can be found anywhere you shop, dine, stay, or play. These experiences demand high availability and often in-person engagement and come with high expectations from both the guests and the merchant. What as little as five years ago might have been shipboard powering a night out at your favorite local restaurant has evolved into us earning the responsibility to power some of the largest global resorts operating 24-7, championship matches, and so much more. In a world of constant innovation, now to touch on some highlights for the quarter and the full year. We closed on the acquisition of Global Blue back in July, marking our entry into the luxury retail vertical. As a quick reminder, Global Blue is a market share leader of tax-free shopping capabilities to merchants selling luxury goods with the number one market share globally and a 4x relative market share to their nearest competitor. Global Blue's business remained resilient despite the weakening U.S. dollar and rising tensions between China and Japan. While a weaker U.S. dollar translates into higher prices for those traveling to Europe, having a business over-indexed to wealthy consumers remains a key benefit in this case. The integration of Global Blue remains on track, including the timing of revenue synergies, to begin being realized this year as expected. As you can see from our materials, we continue to add many new merchants and can increasingly be seen anywhere you shop, dine, stay, or play, with many of these wins a direct result of us successfully cross-selling payments. We powered payments at the big game at Levi's Stadium in early February, so congrats to all you Seahawks fans. And we are constantly renewing key merchants and recently signed a five-year renewal with Choice Hotels. Some other key milestones. In Europe, we continue to add many thousands of new SkyTab POS merchants across the UK, Ireland, and Germany, ending the year with over 80,000 merchants outside of the Americas, which is before cross-selling any global blue merchants. Canada is also a focus, as we've only recently had full-stack capabilities in the region, but inherited many world-class customer relationships from both the Eigen and GiveX acquisitions. We entered the Australian and New Zealand markets and now have a substantive sales force via the acquisition of SmartPay. This progress translated into solid financial performance, including nearly $2 billion of total gross revenue less network fees, representing 46% year-over-year growth. And that's excluding – when you exclude the contribution of Global Blue and SmartPay, we delivered roughly 23% year-over-year growth in gross revenue less network fees during 2025. $970 million of adjusted EBITDA, representing 49% adjusted EBITDA margins, and $500 million of adjusted free cash flow. We are proud of both of our margins in light of ongoing investments we're making in both products and expansion. We introduced an all-in-one payments, DCC, and tax-free shopping terminal last year that we began piloting in several European countries. We also invested heavily in making our restaurant, sports, and entertainment and other products suitable for the global stage. I want to stress that our story is not a complicated one. We are experts in handling software, hardware, and payments, in demanding verticals, and in the most competitive market in the world, the United States. We've grown from an SMB, restaurant-oriented technology business to powering commerce across the experience economy, and our most meaningful growth has been as a public company for all to see. We are now taking those lessons learned and our industry-leading products out into the world. One only needs to study our evolution in the U.S. to understand what we will be doing in less mature and often less competitive markets. Unlike our history in the U.S., we are aided by excellent beachheads provided to us by acquisition and already have a presence in over 75 countries around the world. As we look to 2026, the macro environment remains dynamic, but we view the diversity of our end markets, our disciplined approach to customer acquisition, and healthy operating margins as affording us a degree of resiliency and optionality relative to many of our peers. In terms of priorities, I'm focused on the following. We only just begun delivering our all-in-one payment terminals throughout Europe. As mentioned previously, the Global Blue tax-free shopping product is unrivaled, and when combined with eligibility detection at the point of payment, adds meaningful utility to retailers of all sizes. We believe we can add many thousands of merchants as a result of this capability and are targeting 15 countries for launch in 2026. Our go-to-market motion across these countries will allow us not just to win retail merchants, but also deliver our restaurant, hotel, and stadium products and replicate the vertical success we've had in the U.S. While on the topic of the U.S., we still have plenty of market share to win across our key verticals, and enabling DCC across our merchant base will be particularly valuable in anticipation of the World Cup this year and the Summer Olympics in 2028. We continue to leverage our restaurant merchant estate to inform our roadmap for SkyTab, which has been growing nicely in both customer counts and volume per merchant. To better leverage the larger Shift4 brand and our presence in the broader experience economy, we will be rebranding SkyTab to Shift4 Dine later in the year. Asia and the Middle East are also increasingly becoming important strategic markets for us, and in particular, Japan and the Kingdom of Saudi Arabia. These are large markets that align perfectly with our core competencies and yet only offer one of our products. And lastly, our AI roadmap is extensive on both the operational and product fronts. We've partnered with XAI for broad-based adoption of GROC in virtually every area of our business. We've deployed AI assistance within our key products to help resolve inquiries more quickly and with less human intervention. These tools have recently been expanded to providing operational insights to our merchants as well. We are building predictive models that analyze merchant signals to prevent churn before it happens, while leveraging the vast trove of data we collect from customer interactions to identify and resolve customer pain points more rapidly than ever before. On the productivity front, we've seen a doubling in our code production as a result of broader adoption of AI tools within our technology teams. and many of you know that Palantir has been powering our mission control platform for several years at this point, so none of this should be a big surprise. Before I turn the call over to Chris, I want to summarize the simplification transaction announced earlier this year. We've successfully collapsed all B and C shares previously held by our founder into Class A Common. As a result, Ship4 is no longer a controlled company under the NYSE rules. Going forward, Jared will own approximately 27% of our outstanding Class A shares, with voting rights that are purpose to all other shareholders. Additionally, Jared has agreed to transfer all future benefits of his tax receivable agreement to the company, permanently eliminating an estimated $440 million of future TRA payments. We believe these improvements to our governance and capital structure significantly broaden our appeal to the investment community. In summary, 2026 marks a new chapter defined by a simplified corporate structure, improved disclosure, and clear strategic focus. As we expand our footprint globally, we are laser-focused on execution, ensuring we deliver our immediate financial goals without sacrificing the balance that comes between growth and And with that, I'll turn the call over to Chris.
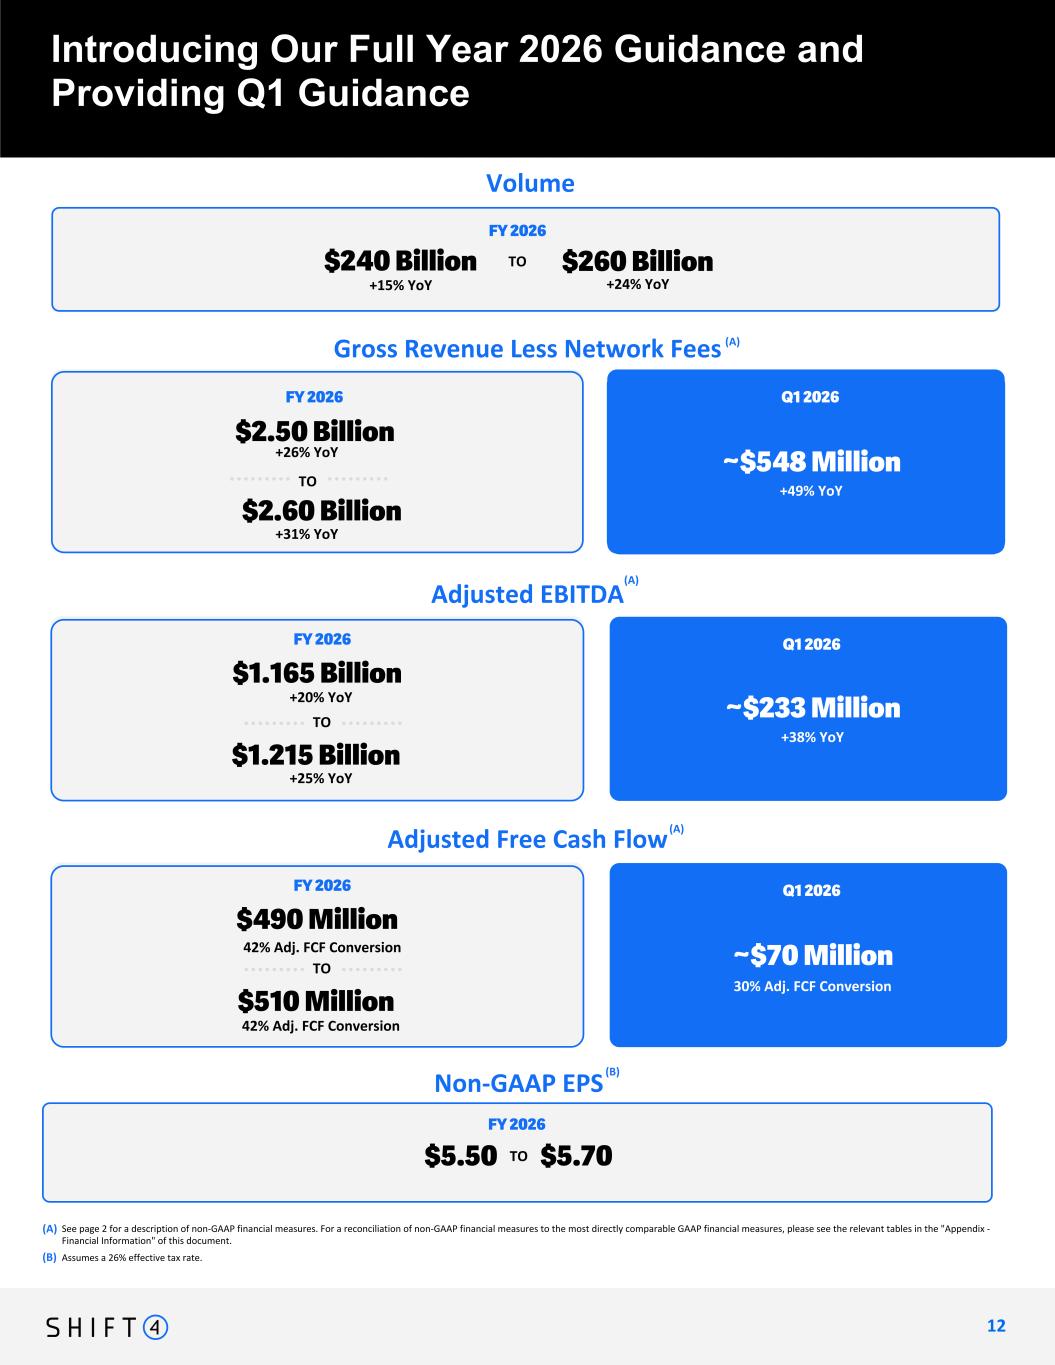
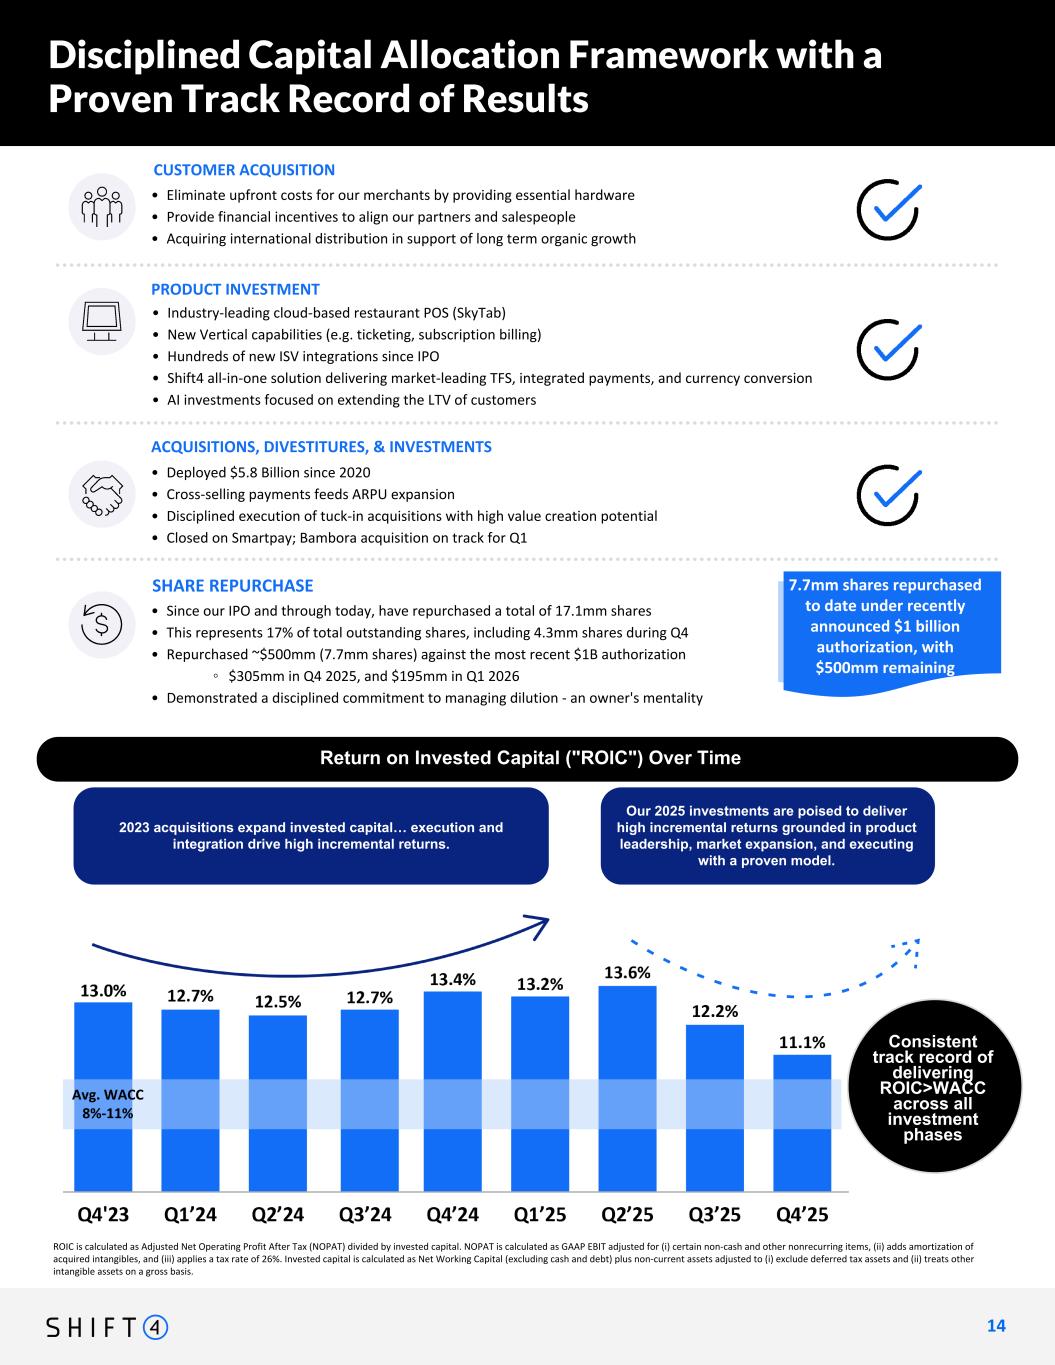
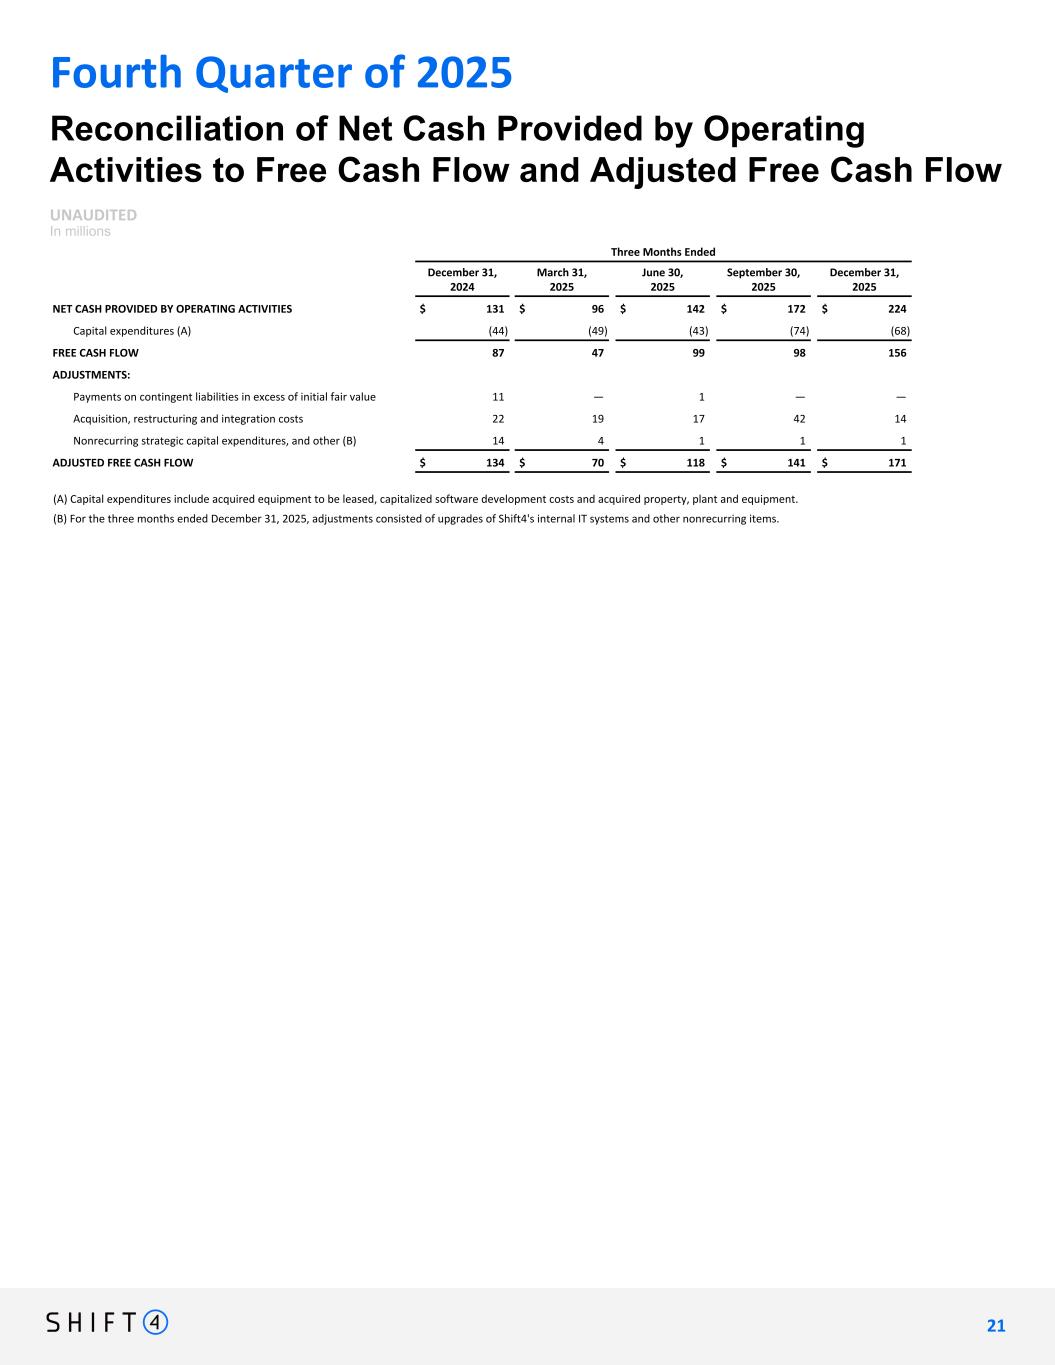
Thanks, Taylor. 2025 was another record year for Shift 4 across all financial metrics. underpinned by strong execution, integration, capital allocation, and continuing to achieve scaled diversification both geographically and across multiple verticals in the experience economy. We delivered record results with full-year gross revenue of $4.18 billion above the high end of the range we provided last quarter, volume of $209 billion, again near the high end of last quarter's guided range. Blended spreads came in at 61 basis points, exceeding our guidance of above 60 basis points. Gross revenue less network fees, or GRLNF, of $1.98 billion, representing 46% growth year-over-year. Adjusted EBITDA of $970 million, representing 43% growth year-over-year at a 49% margin. And adjusted free cash flow of $500 million, which exceeded our guided adjusted free cash flow conversion range by 150 basis points. Now let's move on to our quarterly performance and then shift to 2026 guidance and close with our capital allocation framework. For fourth quarter results, gross revenue increased 34% year-over-year to $1.189 billion. Volumes grew 23% year-over-year to $59 billion, towards the higher end of guidance range. Q4 volume mix was influenced by a few enterprise go-lives with strong seasonal volumes. Blended spreads came in at 57 basis points, influenced by the aforementioned few enterprise go-lives with strong seasonal volumes, such as the Altera Icon Pass. This enterprise volume outperformance has an inverse mix shift impact on our blended spreads. That said, our full-year 2025 blended spreads delivered in line with our previously communicated guidance of greater than 60 basis points, and we anticipate blended spreads to continue above 60 basis points for the full year in 2026 as well. GRL&F grew 51% to $610 million, which was towards the lower end of our guidance range as the aforementioned outperformance in enterprise did not offset the continuation of Q3's same-store sales trends, particularly amongst SMBs in the Americas region, which were further impacted by late Q4 weather events. Going forward, we will disaggregate our revenue into three categories. One, payments-based revenue reported on a gross basis to arrive at the relative contribution to GRL and F. Two, tax-free shopping revenue, and three, subscription and other revenue. We have consciously chosen to report these three disaggregated revenue categories in order to let investors focus on our North Star of growth in payments-based revenue and clearly break out the tax-free shopping revenue for transparency as investors acclimate to the performance of this line of business. Adjusted EBITDA grew 48% to $304 million, delivering a 50% margin. Non-GAAP EPS came in at $1.60. Our adjusted free cash flow in the quarter was a record $171 million, representing year-over-year growth of 28% and free cash flow conversion from adjusted EBITDA of 56%. On a non-GAAP per share basis, this results in $1.76 of adjusted free cash flow per share. As of year-end, our net leverage pro forma for the full-year effect of Global Blue was 3.4 times and includes the effects of our November activity of repaying the 2025 convertible notes, issuing incremental Euro-denominated senior notes under our existing 2033 indenture, and repricing our term loan, generating 50 basis points of run rate savings. Our leverage guidance remains unchanged, with a view that the business should not exceed three and three quarters net leverage on a sustained basis. Now, for full year's 2026, we are introducing the following guidance ranges. Volume of $240 billion to $260 billion, representing 15% to 24% year-over-year growth. We are anticipating stable spreads in 2026, remaining above 60 basis points for the full year. GRLNF range of $2.5 billion to $2.6 billion, representing 26% to 31% year-over-year growth. And to help you model our trajectory to 2026, we are introducing a growth algorithm bridge, providing further transparency on the disaggregated GRLNF growth categories. As mentioned, we're reporting desegregated revenue across three categories, payments-based revenue, tax-free shopping, and subscription and other. Within our payments-based revenue, less network fees, we think it noteworthy to appreciate the difference between our two geographic regions of, one, the Americas, and two, the worldwide region, excluding Americas. For the Americas market, this is our most mature region where all of our market-leading experience economy commerce solutions are present and is a market where in 2026, there will be minimal impact from prior year M&A annualization. In this region, we expect payments-based revenue, less network fees, to deliver mid-teens percentage growth. We view this growth rate as being more than three times the baseline growth of the comparable market. The worldwide, excluding America's market, is our faster-growing market where multiple high-growth themes exist, such as, one, bringing our market-leading solutions proven in the competitive America's market into the region, two, disrupting a largely unintegrated bank-distributed card-present market with our proven bundled value proposition that we pioneered decades ago, and three, the region is benefiting from our excess capital allocation through the acquisitions of Global Blue and SmartPay, which provide both their attractive business attributes but also serve as the infrastructure accelerant from which we will deploy our market-leading solutions into the region. In this region, we are expecting high 20s percentage growth. On tax-free shopping, we expect mid-single-digit pro forma growth. We are cautious going into 2026 with a few headwinds that include a weakening outlook on the U.S. dollar relative to the euro, albeit with diverging views across major banks, as well as cross-border travel tension in Asia. Additionally, it's noteworthy that the business delivered low double-digit growth last year on the high end of its medium-term outlook range disclosed when Global Blue was an independent public company, and thus is growing over a strong comparable period. On subscription and other, we expect low single-digit growth, with quarterly fluctuation as we anticipate less impact from applying our carrots and sticks against acquisitions than in prior years, while continuing to prioritize growth in our core payments-based revenue. When you sum these parts, it builds to our guidance range of $2.5 to $2.6 billion in GRL&S. We are guiding an adjusted EBITDA range of $1.165 billion to $1.215 billion, representing 20% to 25% year-over-year growth, and representing margins of approximately 47%. We are introducing a non-GAAP EPS guidance range of $5.50 to $5.70. Our EPS range assumes an effective tax rate of 26%. We are guiding adjusted free cash flow of $490 million to $510 million. We anticipate free cash flow conversion to moderate in 2026 and average approximately 42% as a result of three factors. One, the annualization of interest expense. Two, lower interest income due to relative cash balances. And three, global blue-related impacts, such as integration investments and the impact of Global Blue's seasonality on our year-over-year results, given the timing of the close in the second half of 2025. If you isolate the incremental flow-through of adjusted free cash flow, the implied conversion is expected to be 59 percent. And overall, this guidance includes the close of Bambora because we expect it to take place in the next couple of days. And now for Q1 quarterly guidance. For the upcoming first quarter of 2026, we are introducing guidance as follows. GRLNF of $548 million, adjusted EBITDA of $233 million, and adjusted free cash flow of $70 million. Additionally, gross revenue for the quarter is expected to be $1.05 billion. Our shareholder letter materials provide a detailed bridge on these various components to our guidance to help you model these specific impacts. Consistent with our commentary in Q3 earnings, as we looked at our capital allocation options in Q4, we found the most attractive risk-adjusted return was repurchasing our own stock. Between Q4 and year-to-date Q1, we have repurchased 7.7 million shares and now have a remaining $500 million against the $1 billion share repurchase authorization recently announced. In light of the current market environment and the continued opportunity it presents for share repurchases, we think it more appropriate to base the previously stated goal of $1 billion of exit rate Q4-2027 adjusted free cash flow to being viewed on a per share basis through the lens of a long-term owner of the business. Last, on capital allocation, as mentioned, we repurchased a total of 7.7 million shares, of which 4.3 million shares were repurchased during the fourth quarter, and the remaining 3.4 million shares were repurchased during Q1 of this year. We have $500 million remaining under our existing authorization. As a reminder, we allocate capital on a comparative assessment basis of our four priorities, customer acquisition, product investment, acquisitions, and share repurchases. We've utilized buybacks recently due to the clear relative value, and while our valuation remains attractive, we are mindful of the associated relative value balance and net leverage ratios. Our focus in 2026 will be to continue employing our balanced approach to capital allocation using this relative framework. That said, this quarter we wanted to provide investors with insight into our capital efficiency. In our view, the textbook financial formula for value creation is driving sustainable positive spread of return on invested capital, or ROIC, greater than weighted average cost of capital, or WAC. A couple of key takeaways from this. One, we have a historical track record of value creation. Throughout 2023 and 2024, our ROIC averaged approximately 13%, consistently exceeding the midpoint of our WAC range by 300 to 400 basis points. This demonstrates that our historical acquisition strategy has been accreted not just to top line, but to shareholder value. All of this while deepening our durable competitive advantages, scaling, and diversifying the business as a whole. Second takeaway, we have been able to maintain this value creation spread across the investment cycle. Even in historical periods of invested capital expansions in our history, we have maintained a positive ROIC over WAC spread and expect this to continue. Our track record shows that we have been here before and experienced the integration phase of an investment with ROIC experiencing short-term dilution, followed by very high incremental returns. Now, before turning the call back to Taylor, I want to sincerely thank our fellow shareholders, the broader management team, and especially the finance organization for supporting a seamless transition. I'm energized by the momentum we've built and look forward to the year ahead. And with that, let me now turn the call back to Taylor.
Operator
Thank you. If you would like to ask a question, please press star 1 on your telephone keypad. To leave the queue at any time, please press star 2. Once again, that is star 1 to ask a question. We'll pause for just a moment to allow callers to queue. Thank you. Our first question will come from Darren Peller with Wolf Research. Your line is open.
Hey, thanks, guys. You know, let me just first start with a question on guidance, and then I'm going to shift to a question on free cash, if that's okay, as a follow-up. But just on guidance, when we look at the outlook you're giving now, and I understand, Chris, you probably tried to build in an element of safety and conservatism given the macro uncertainty. So maybe just touch on how you built it up, what the organic assumptions were embedded in it for overall organic revenue growth rates, and how we should think about the potential cross-sell integration in there for the year ahead of us.
Yeah, thanks for that, Darren. So to kind of unpack the pieces, I think one of the things that we definitely wanted to provide some visibility into is the GRLNF growth algorithm to give a sense for how some of the parts in our pre-disaggregated revenue categories are expected to behave in the year, in the 2026 guide. And so to look at that piece within the bridge in the materials is probably a place I'll reference and cite everyone's awards. And within that, you can see that you've got the payments-based revenue piece split out between kind of the new disaggregation of giving visibility into our two geographic regions of Americas versus the worldwide ex-Americans. Then we give our tax-free shopping, which is obviously a new disaggregated revenue disclosure that we'll be providing, and give that on a pro-forma basis as expecting that to be on the mid-single digit. And then, of course, the sub and other. But maybe the incremental piece that you're asking within what's inside of these guidance points might be a bit more related to...
Well, I'm trying to understand, really, if you think you've built in a layer of effectively considered as around macro or even your own bottoms-up assumptions, just given, you know, the results last year have been a little challenging versus your prior guide. And so I'm curious to hear where you built that in. And then, again, I understand your sub-segments, but as a company-wide, I think we're coming I'm curious if that's about right.
So let me – so when I think about what is inside of the guide, obviously, you're right to point out that last year had a little bit of a volatile macro backdrop, and maybe more specifically within the world of in the Americas, so inside of the payment shopping, both heading at is the volatility that was the result of the Triple F, namely in the Americas amongst SMBs, lodging, and retail. There's a continuation of January, some of that with weather events at the end of the year, how that impacts the tax-free shopping business. I think we allude to it a couple of times that a weakening USD translation, it has been a fit on demand, continues sort of weakening within USD relative to expense. Now, there's a pretty divergent view, even among... A quick follow-up on free cash, if I understand it right, the interest expense, interest income
changes, given the combination of buybacks and cash available for interest income, and the integration costs are causing free cash to be roughly flat. Was there, if you could help quantify those variables, and then anything on chip costs or memory costs potentially impacting the free cash guidance this year? I just want to make sure we're still on track for the exit rate of 27 to be the billion-dollar range you guys had indicated. Thanks again, guys.
Yes, thanks, Darren. So let me unpack three parts. So first, the quantification around each of the components in the building blocks of the free cash flow variance. What we tried to do was provide people in the materials with a bridge page that gives a view on the kind of the year-over-year outlook and guidance around free cash flow. And what you see on that bridge page is, or in materials, is the effect of each of kind of the components, the largest of which you pointed out well, right? Like the annualization of the capital structure, the annualization of the interest expense, year-over-year interest income is on a year-over-year basis. We highlight integration and investment.
So from our perspective, even though we are seeing and maybe try to say in how payment devices are manufactured and the landscape is hitting like a material.
Operator
It comes from Dan Dola with Mizuho. Your line is open.
Hey, guys. Great job here. Thank you for taking my question. Really appreciate it. You know, Chris, I know you were asked before about the assumptions for 2026, but can you maybe just elaborate a little deeper on the exact macro assumptions and how you kind of frame the low end and the high end of the guide when it comes to your macro assumptions? I think that would be really helpful, and thanks again.
Yeah, sure. Thanks for that, Dan. So, look, I'd say if I was to break out, If I was to categorize the macro into three parts, there's probably, one, thinking about the impact of our Americas and largely impacting SMBs, lodging, this idea that we have an assumption of a fairly neutral year, denominated. Weakening USD has a financial translation. So to the extent there is a weaker USD relative to the euro as a for the demand side. And so that's something that we're monitoring and we're watching, in particular because the market within tax-free shopping, we have to be having less of an effect.
Helpful and great job again.
Operator
Thank you. Our next question will come from Timothy Chiodo with UBS. Your line is open.
Thanks a lot. I want to see if we can dig in a little bit to the fiscal 2026 guide around the spread staying relatively stable in that 60 bps or potentially slightly higher range. I'm assuming that some of that is related to dynamic currency conversion, which I gather has been going well. And I want to see if you could talk a little bit about that assumption in terms of supporting the spread and maybe any of the contributions from either SmartPay or we already have with the Global Blue acquiring business and those spreads. Maybe there's some mixed shift factors as well, but really just any of the underlying drivers of the spread staying stable, at least on an overall fiscal year basis, and then a quick follow-up.
Yeah, sure, Tim. I'll hit the first part of that, and then Chris can layer on. You know, Q4 was slightly anomalous in terms of how it spread. If you recall, even back to our relatively cautious.
We're in the next shift dynamics. Thank you, Taylor and Chris.
So it sounds like DCC might not be too large of a component there, but a quick follow-up on DCC. Last quarter, you gave a really helpful disclosure in terms of the contribution to net payments revenue from DCC. Is it fair to assume that in Q4, there was directionally in that same ballpark? I believe last quarter it was around $11.5 million.
I was just going to – sorry. One thing I was going to say, though, Tim, was that when we talk about the blended spread across the product, I don't want there to be a takeaway that it doesn't include a positive benefit from, you know, like FX-based spread revenues such as DTC or other types of products like DTC. There definitely is a benefit that comes through, and so you're right to point it out as a positive. It's definitely been one of the nice components of having acquired a business like Global Blue where we now have that capability and competency in-house and are able to kind of bring that into the value proposition and the bundle-facing merchant. So I just want to clarify that as a starting point.
Maybe just to illustrate how we're rolling. The blended spread of those merchants would include that they're coming in as a net new merchant in the U.S. on DTC, in the back, so really specific.
Yeah, that's what I was getting at, partially in terms of the U.S. cross-bill. So sounds like a good opportunity. Thank you, Chris. Thank you, Taylor. Thanks, Tim.
Operator
Thank you. Our next question will come from Will Nance of Goldman Sachs. Your line is open.
Hey, thanks for taking the question. I wanted to circle back on the free cash flow and come back to the bridge that you guys provided. So I think we get most of the moving pieces around interest expense and cash balances. Could you speak to the $30 million of integration and investment spending? How long do you expect that spend to persist? And if we think about the flow-through of free cash flow, kind of excluding some of these items, being at 60 percent like is it possible we could be at north of 60 percent into 2027 as the
integration spend winds down yeah i'll break down you know a significant portion of that 30 is you know in-year integration expansion where we anticipate in different geographies so it sounds
like you know a good portion of that should kind of run off into 2027 and then uh just a follow-up you know you're talking about the kind of uh organic versus inorganic trade-off how are you guys feeling about just capacity to do further M&A, particularly given the lower level of free cash flow this year? You're thinking about half a billion of free cash flow against four and a half billion of debt. What is sort of leverage capacity today? And is the thought to take a pause on M&A this year as you digest the several large deals from last year? Thanks.
Yes. Thanks for the question. I'll address kind of the strategic bent and then Chris can, And, you know, we have a team dedicated to looking at it. We challenge ourselves.
Generation ability to generate a return. So I don't think that there is much of a change. I'm thinking because there's an initiative to accelerate into.
Operator
Our next question will come from Dominique Ball with Rothschild & Co. Redburn, your line is open.
Thanks, guys. Hey, Taylor, Chris, Tom. Super clear on the guidance. So looking slightly beyond the quarter on the guidance, you know, many investors are trying to understand what integration success what Global Blue looks like from here. It's harder to see, obviously, from the outside. And Global Blue is such a critical part of the equity story of Shift4. So can you tell us a little bit more about internally what it looks like, any key metrics, and when you think you'll start to approach Global Blue retail merchants for that cross-sell opportunity as well? Thank you.
Yeah, thank you for the great question. I'll start by saying it's already happening. So we have live merchants in multiple countries where beta and beta and more to the ambition of having, being live, so to speak. Blue's already in today, but we don't have it.
Yeah, it's great to hear. I just want more, if that's okay. I mean, the future growth of Shift4, as you mentioned, seems very much more international, but a good minority of your existing stock, shall we say, are still in the U.S. and SMBs. A lot of your direct peers in the restaurant space are stepping up when it comes to direct sales force. It seems like you're now, as you mentioned, rebranding Skytab as well. Would you follow your peers in terms of a larger direct sales force also more rely on the more traditional shift forward when it comes to gateway, M&A, driven growth, et cetera. Thank you.
It's a great question. We have been scaling our sales force deliberate and measured. We have –
Operator
The question will come from Dan Perlin with RBC Capital Markets. Your line is open.
Thanks. Good morning, everyone. I wanted to just touch on maybe the backlog for a second. I think you're implying like $32 billion embedded in the guide. That's down a bit from the 35 last quarter. And so the question really is just have we reached a point now where, like, the burn rate is greater than maybe the net news signings? I know last quarter you installed $6 billion and you signed $6 billion. So just trying to kind of work through that framework a little bit.
Yeah, you know, it's still kind of a relatively new disclosure for us as we think about the backlog. And it's a relatively new form of measurement. It shouldn't be that much of a surprise for us like that comments made by Tom. But we did see a little bit of –
Yeah, that totally foots. Kind of staying on that same vein, if you think about the end-to-end volume guide, it's a pretty reasonable ban that you guys put out for 15% to 24%. It sounds like this year it's tilting more towards SMB versus maybe some of the enterprise that we've seen in the past. And so the question is really just how does that impact the visibility that you might have in terms of forecasting that line item, or does that not really matter? Thank you.
Just to clarify that one, Dan, when you say you're referring to the Americas versus the worldwide, when you talk about when you cite those two numbers?
I was really talking about total end-to-end volume, kind of total volume that you guys are kind of calling out, $240 to $260 billion. And then it sounded like, in the way you guys were describing maybe that book of business, as you're thinking about it, It sounds like it's tilting a little more towards SMB this year as opposed to more enterprise maybe in the years past. Is there more visibility that you have or less visibility because it's SMB? And so it's trickier. I guess the point is if you have a large implementation for enterprise clients, usually you have those in queue, you know, exactly the timelines. SMB can be a little more spotty. So I'm just wondering if that increases or makes it harder to forecast that line.
Well, it's always me why we kind of travel around the world because there are nuances to this. In the Americas, our SMB presence and the mix of...
Operator
Thank you. This concludes our Q&A session and also brings us to the end of today's meeting. We appreciate your time and participation. You may now disconnect. Thank you.