Operator
Thank you for standing by. My name is Angela, and I will be your conference operator today. At this time, I would like to welcome everyone to the Heritage Financial 2026 Q1 Earnings Call. I would now like to turn the call over to Mr. Bryan McDonald, President and CEO. You may begin.
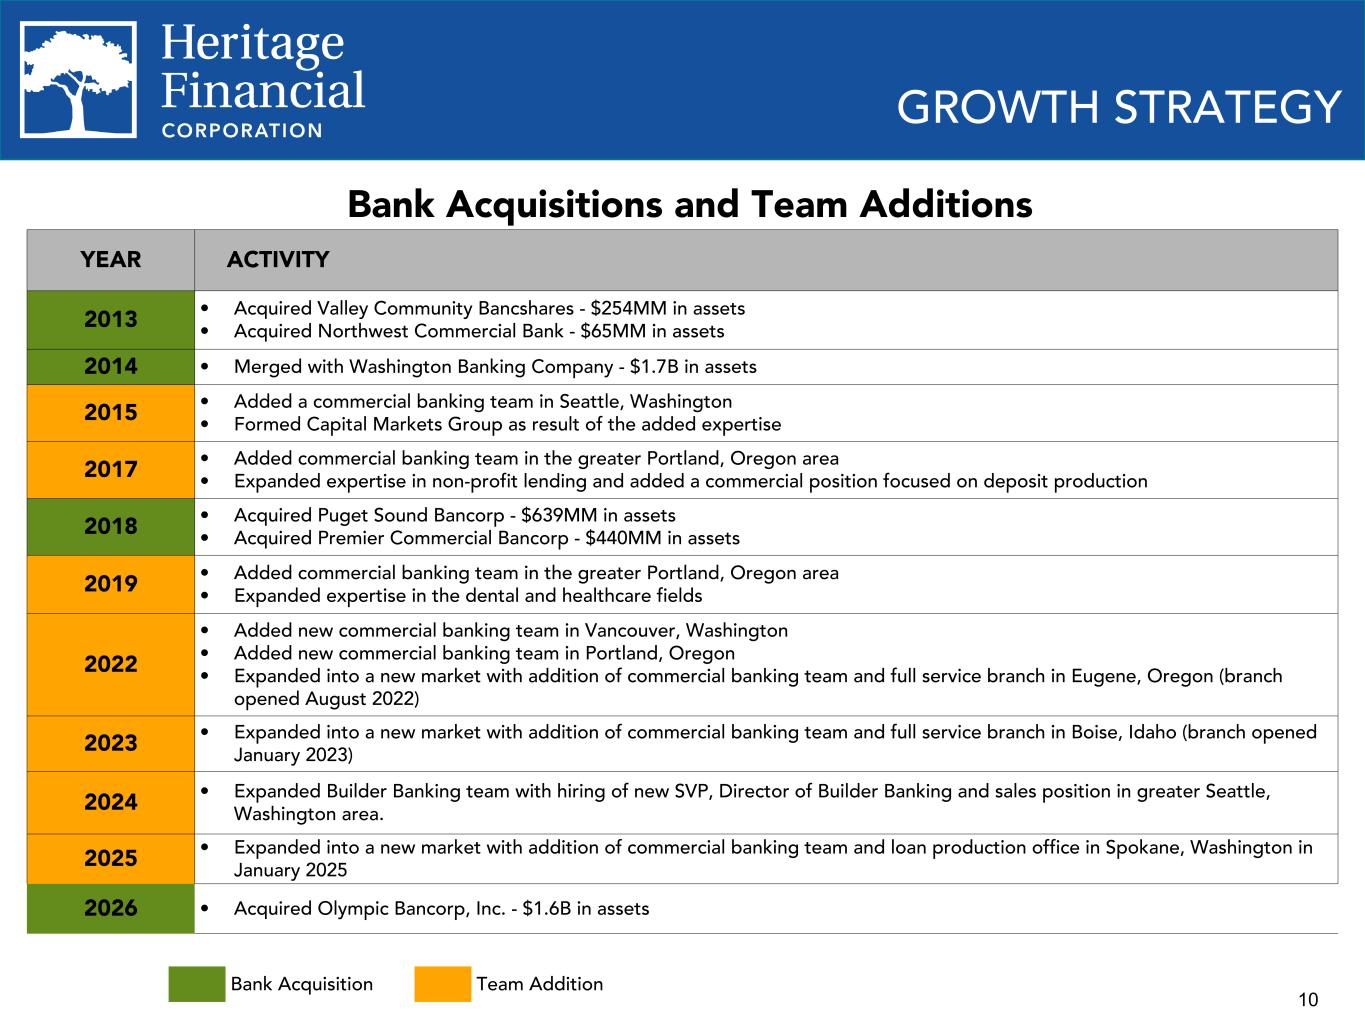
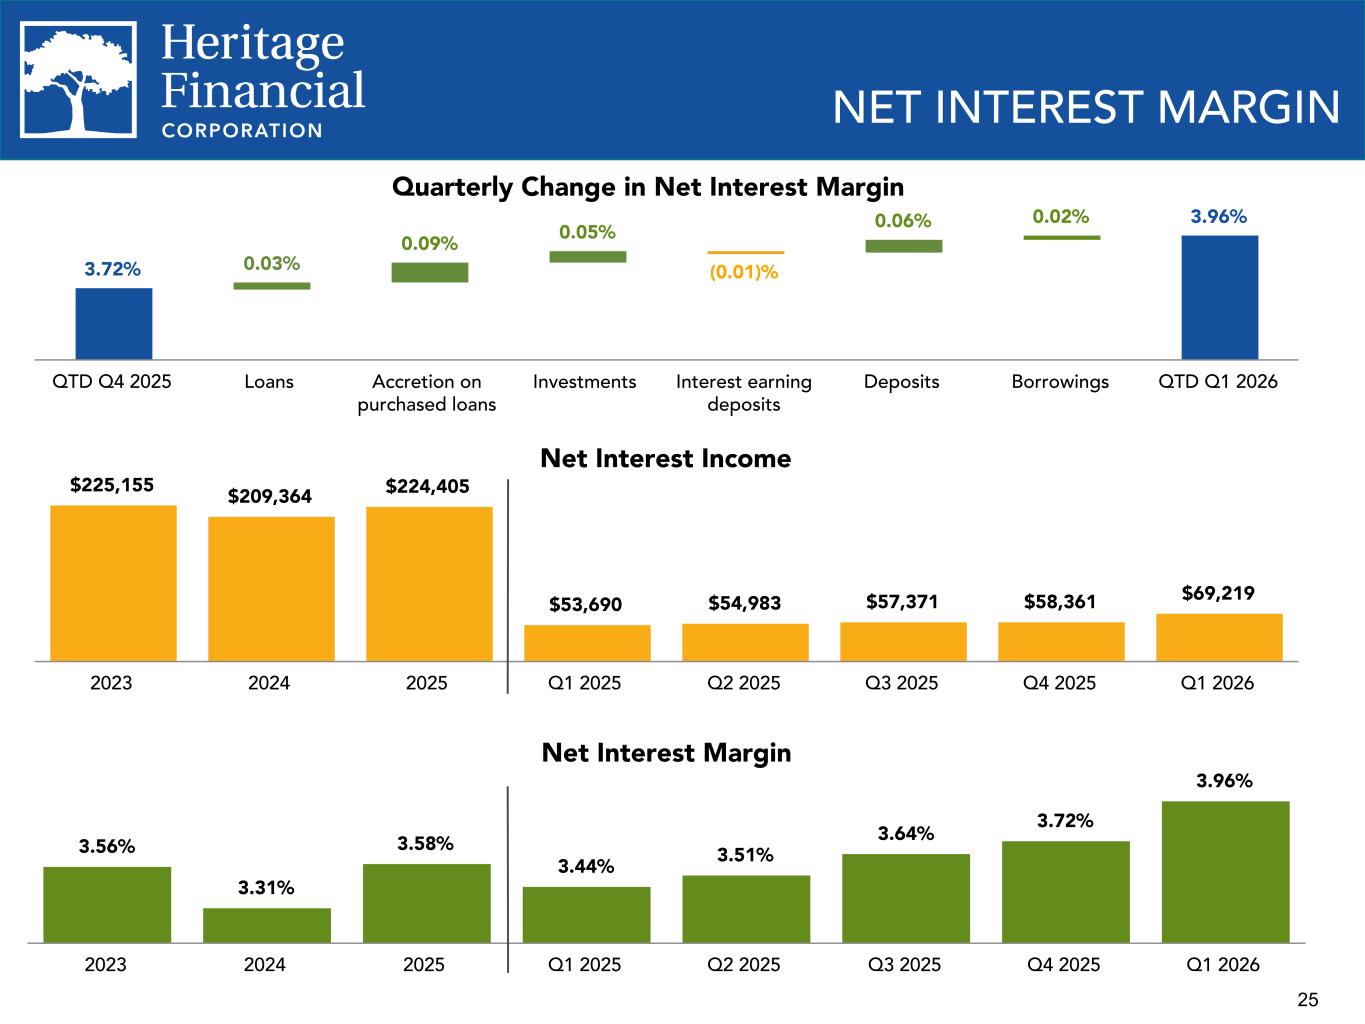
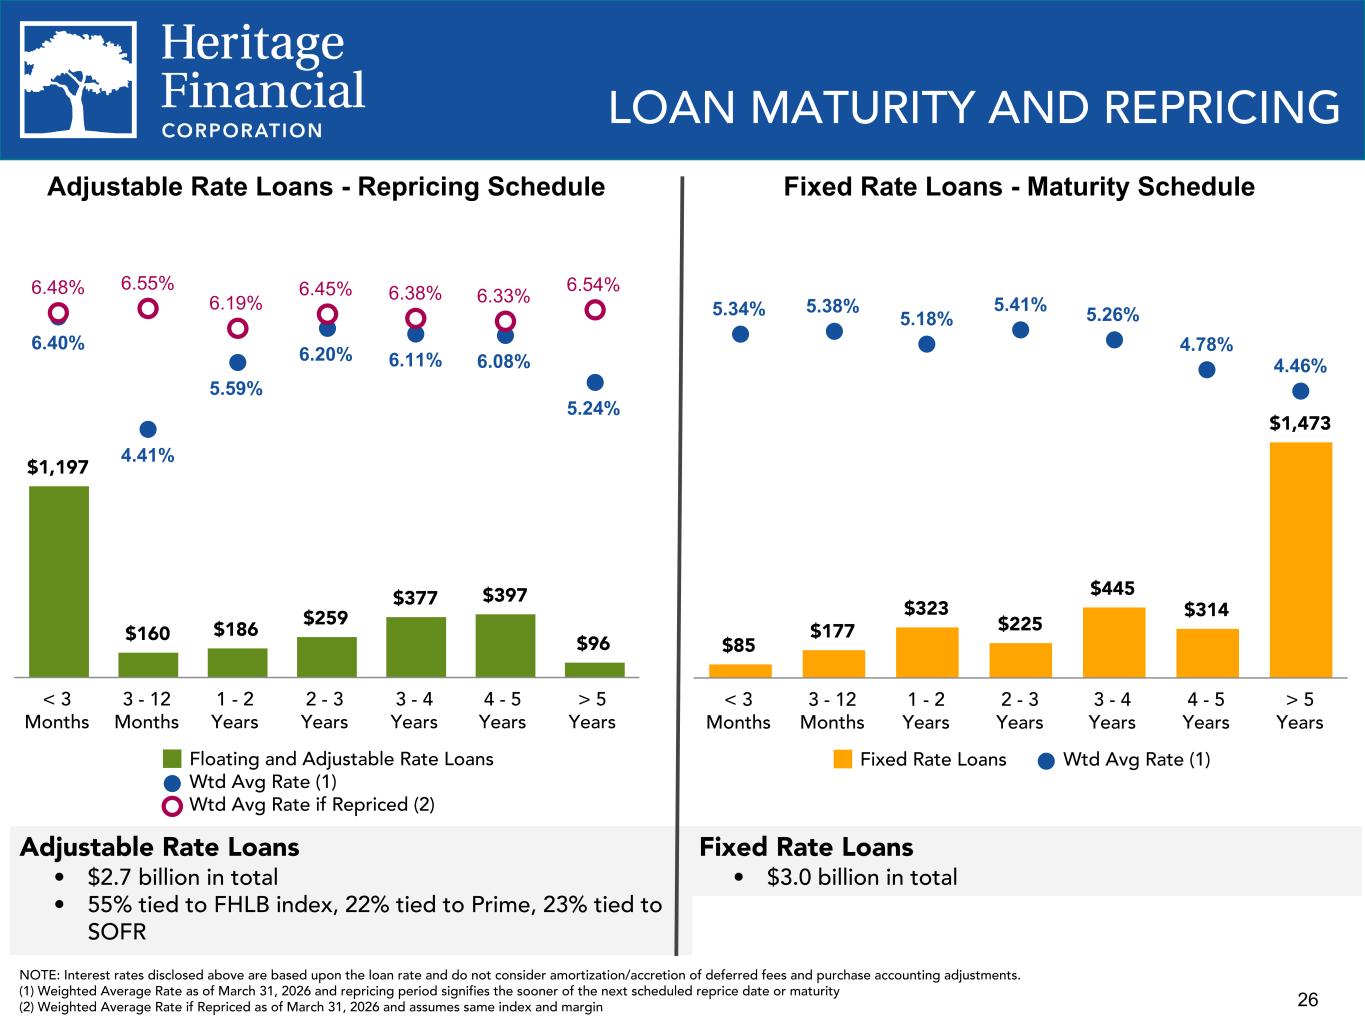
Thank you, Angela. Welcome and good morning to everyone who called in and those who may listen later. This is Bryan McDonald, CEO of Heritage Financial. Attended with me are Don Hinson, Chief Financial Officer; and Tony Chalfant, Chief Credit Officer. Our first quarter earnings release went out this morning premarket, and hopefully, you have had the opportunity to review it prior to the call. In addition to the earnings release, we have also posted an updated first quarter investor presentation on the Investor Relations portion of our corporate website, which includes more detail on our deposits, loan portfolio, liquidity and credit quality. We will reference this presentation during the call. As a reminder, during this call, we may make forward-looking statements, which are subject to economic and other factors. Important factors that could cause our actual results to differ materially from those indicated in the forward-looking statements are disclosed within the earnings release and the investor presentation. We closed the merger with Olympic Bancorp during the first quarter, better positioning our company for growth in the Puget Sound market. I want to highlight a couple of items as we look forward. First, as a reminder, we are converting systems in late September, and we'll be carrying higher expenses until after the conversion. Don Hinson will provide additional color on our estimated expense levels post conversion of units. Second, seeing the expected improvement to our net interest margin resulting from the addition of Olympic's balance sheet and continued asset repricing. We expect the upward trajectory to continue, primarily driven by new loans and repricing within the existing loan portfolio. We will now move to Don, who will take a few minutes to cover our financial results.
Speaker 2
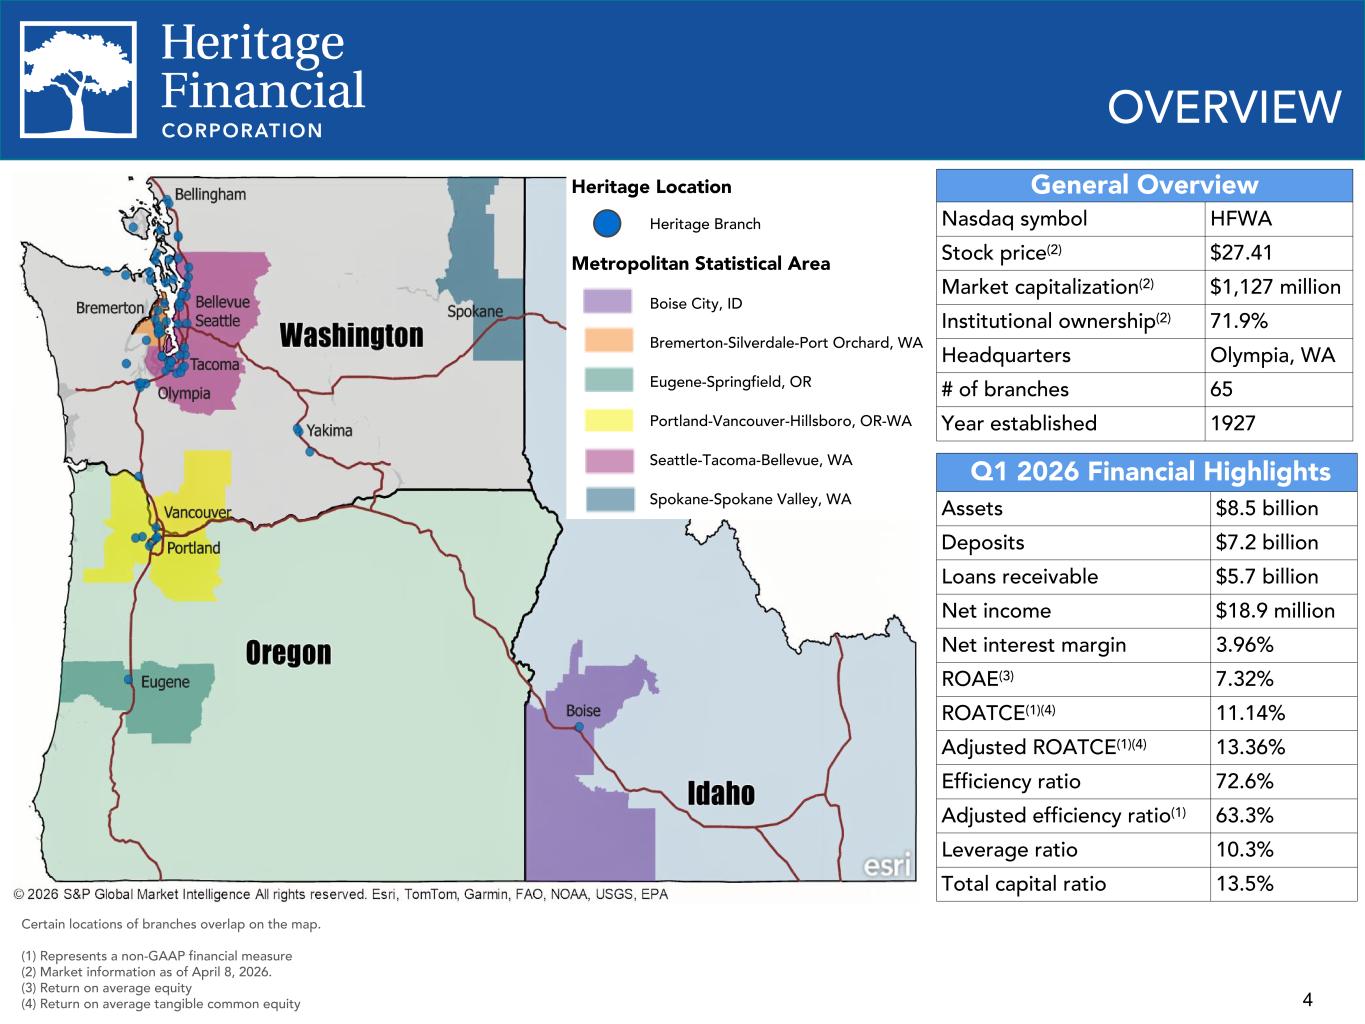
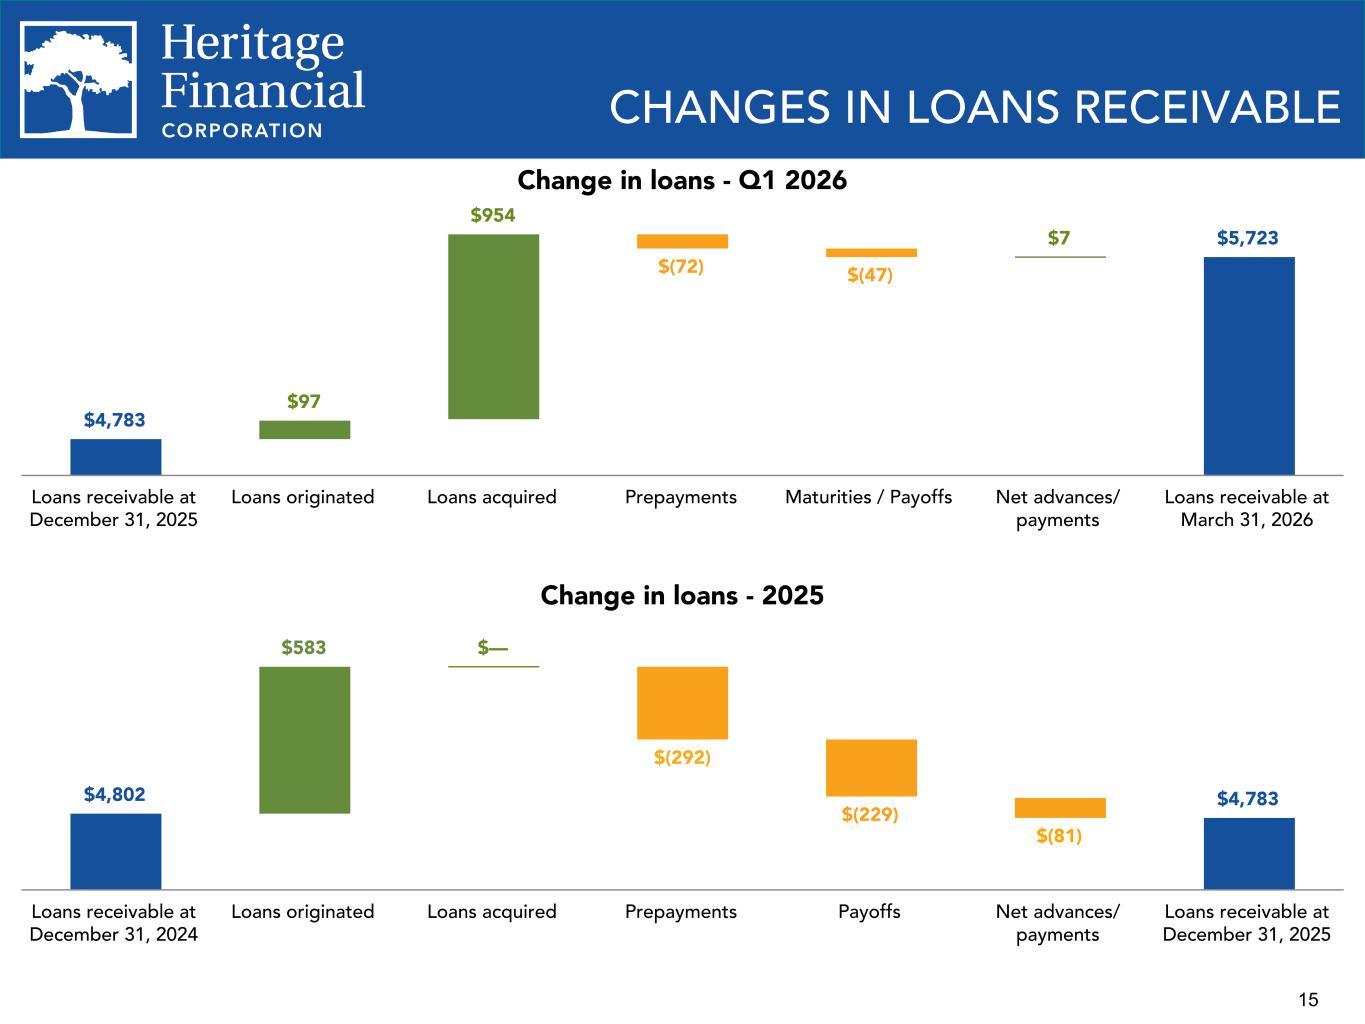
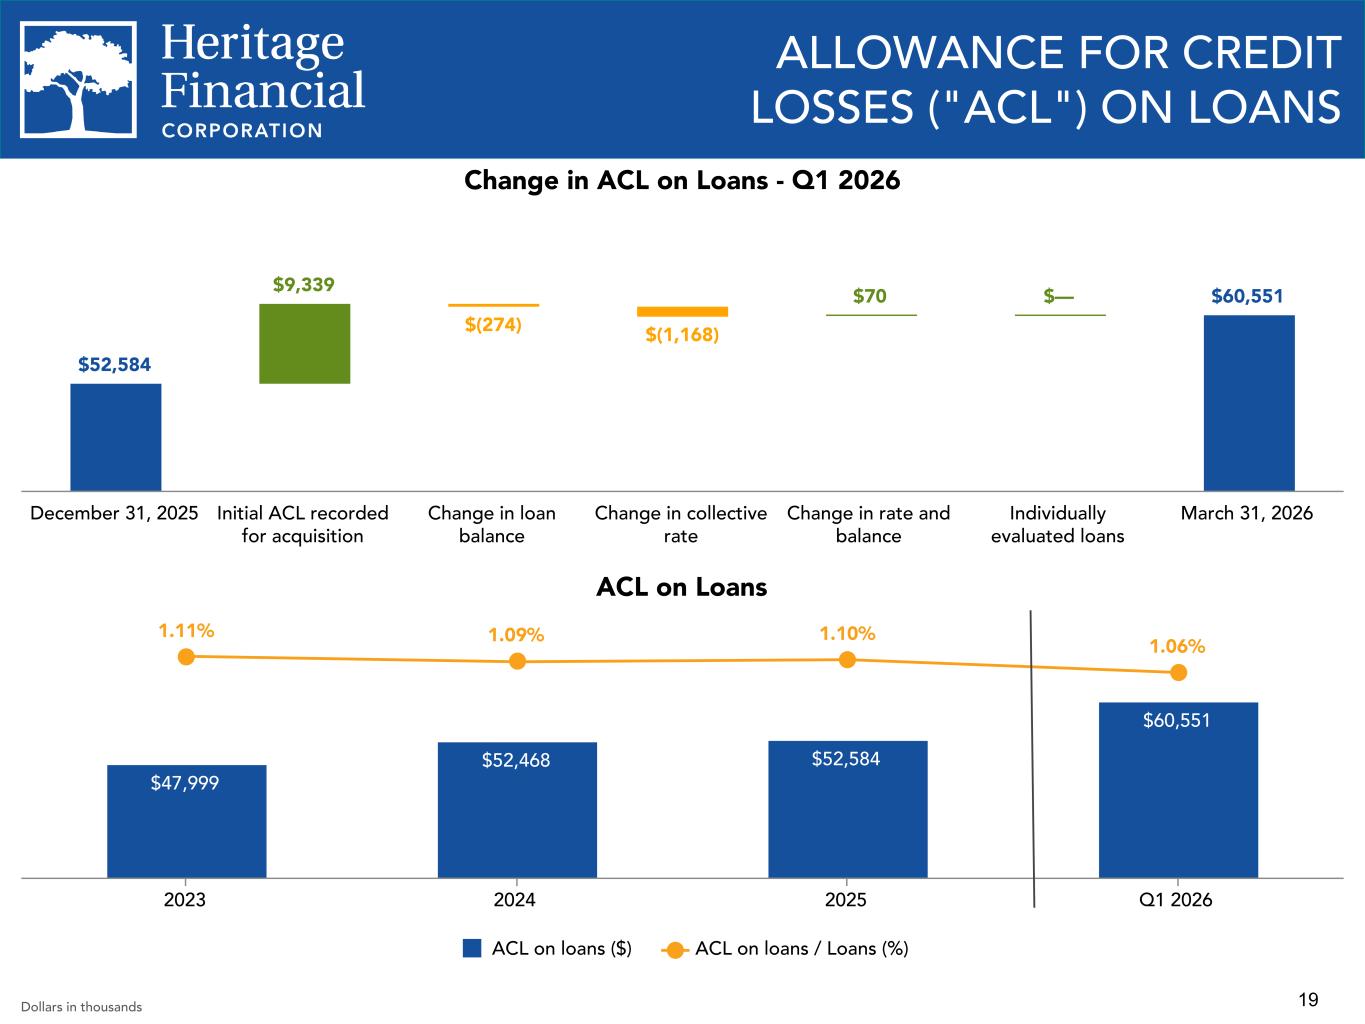
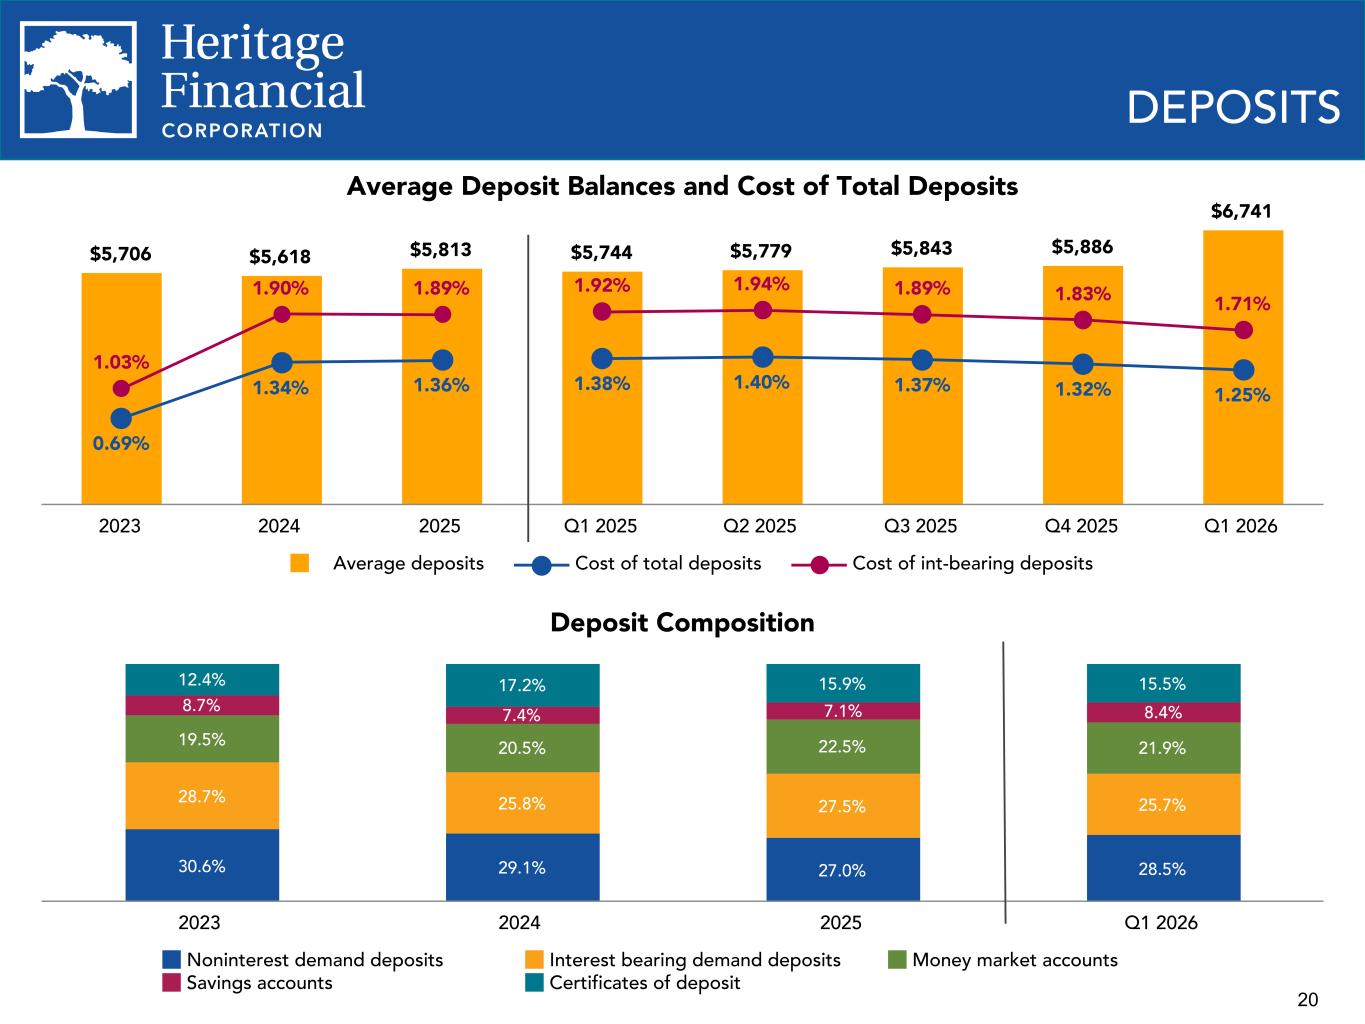
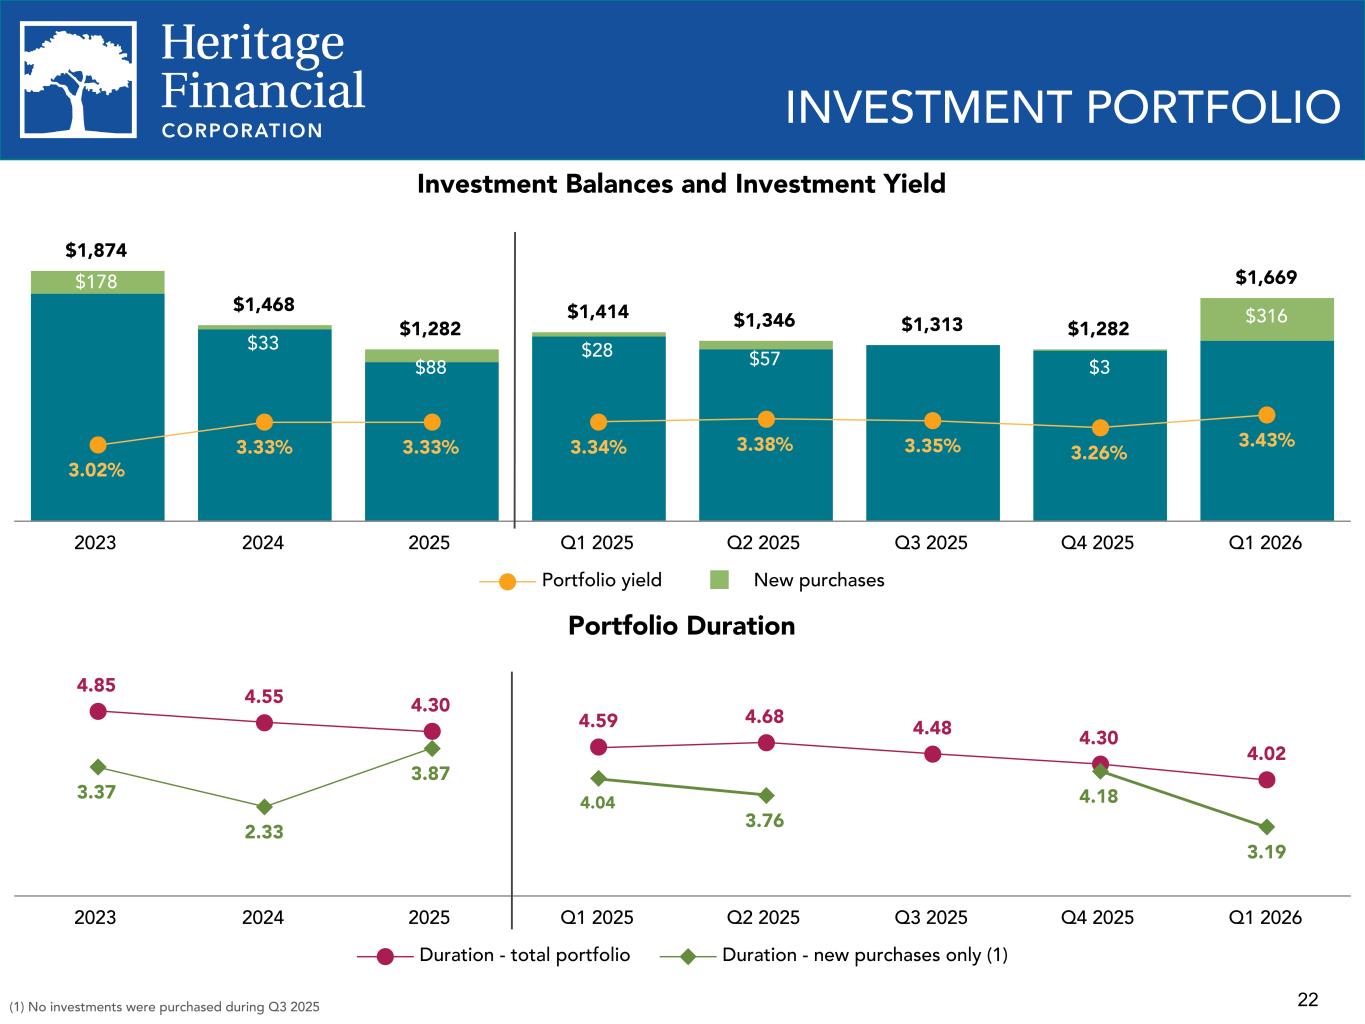
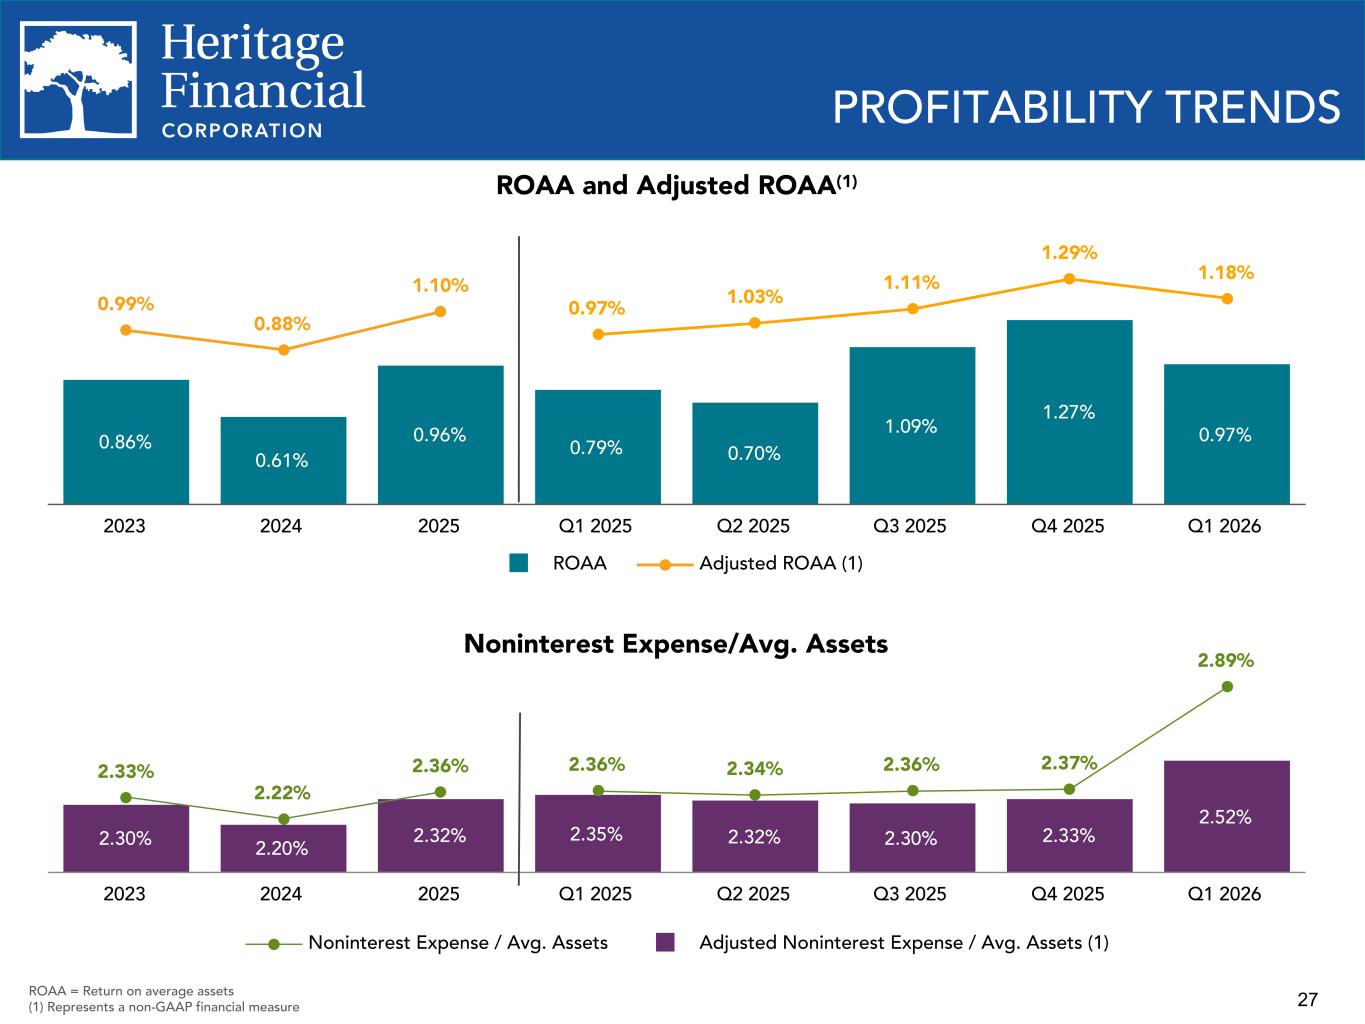
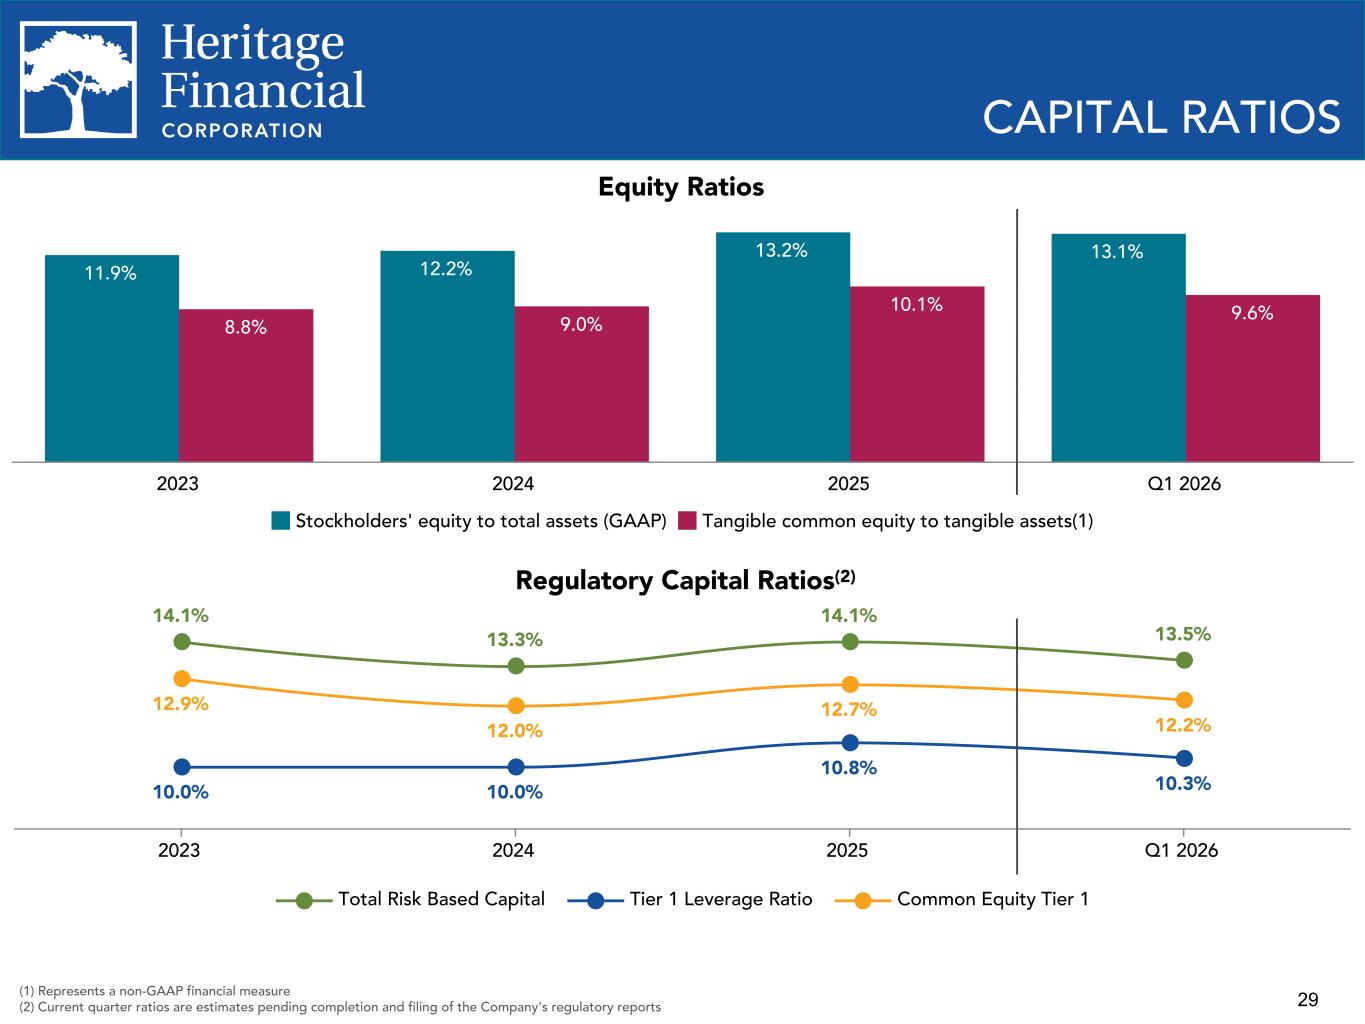
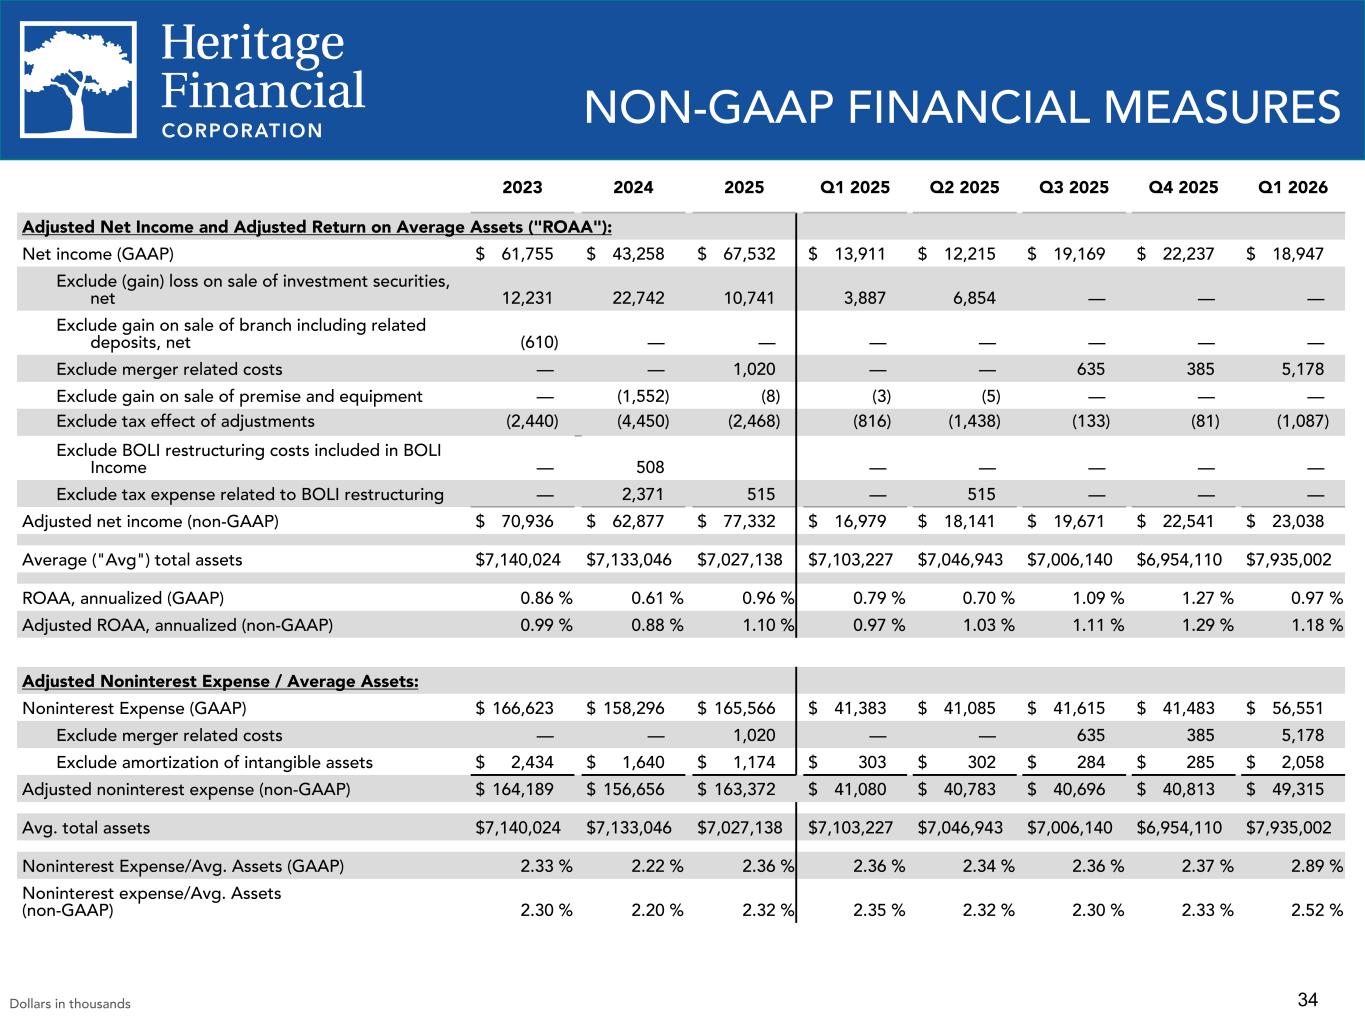
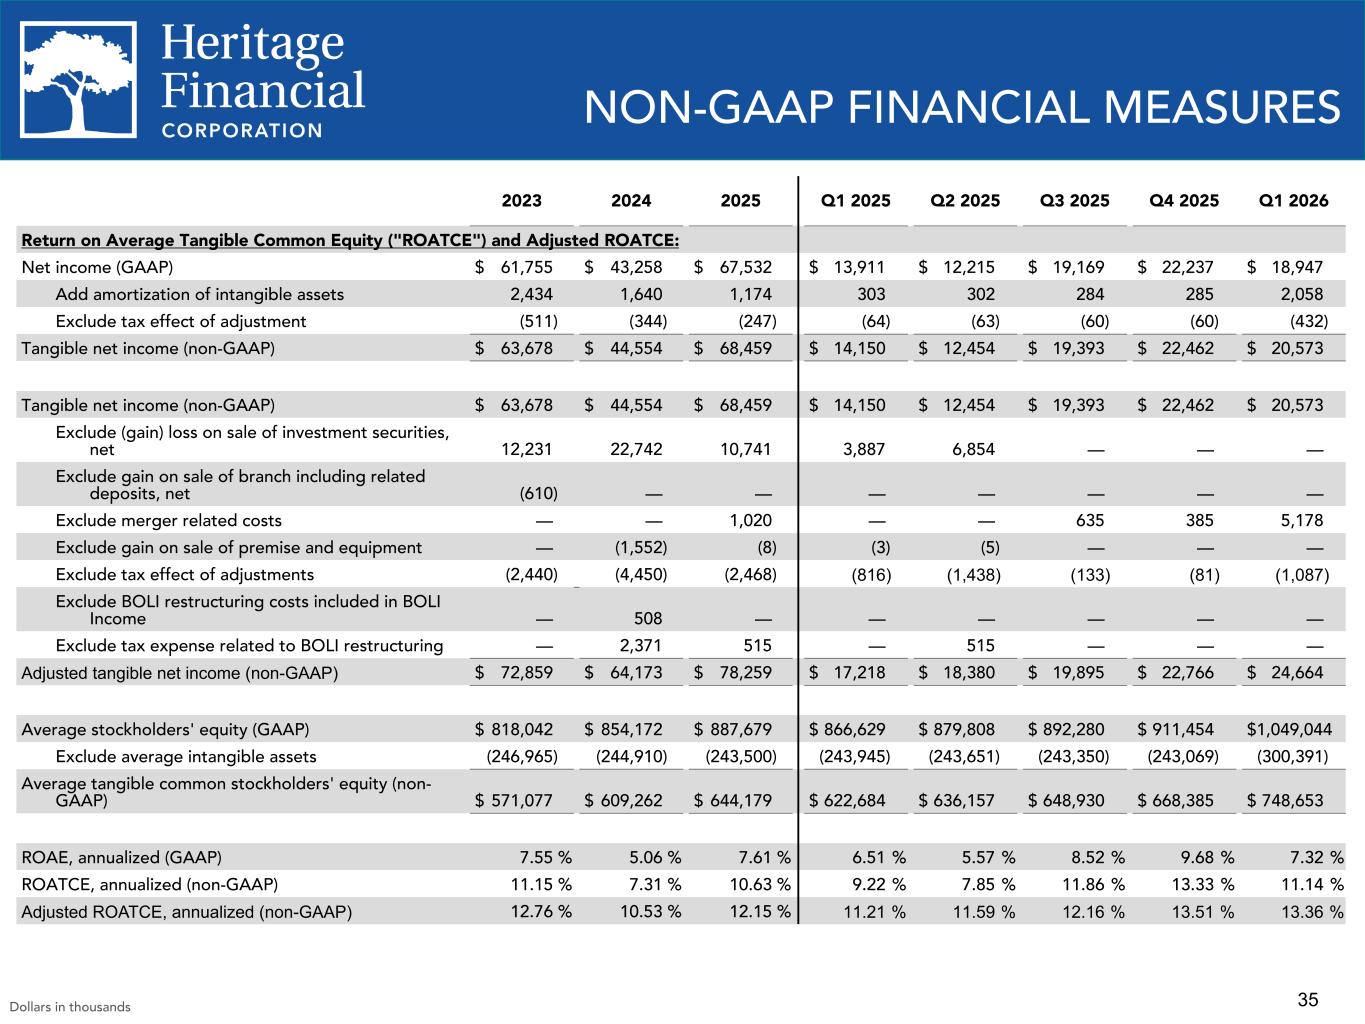
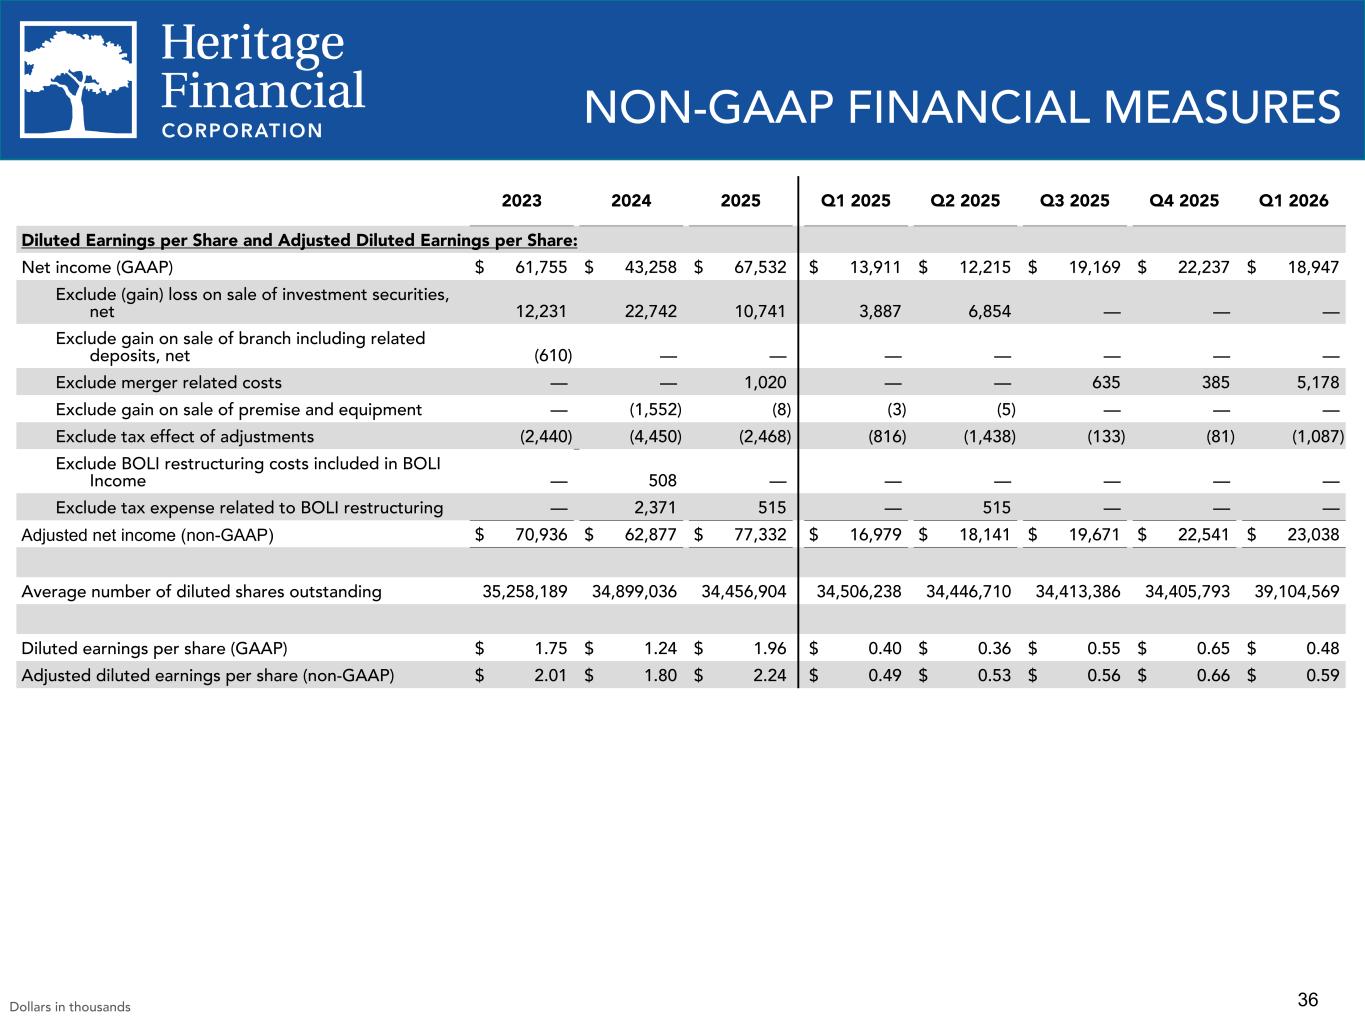
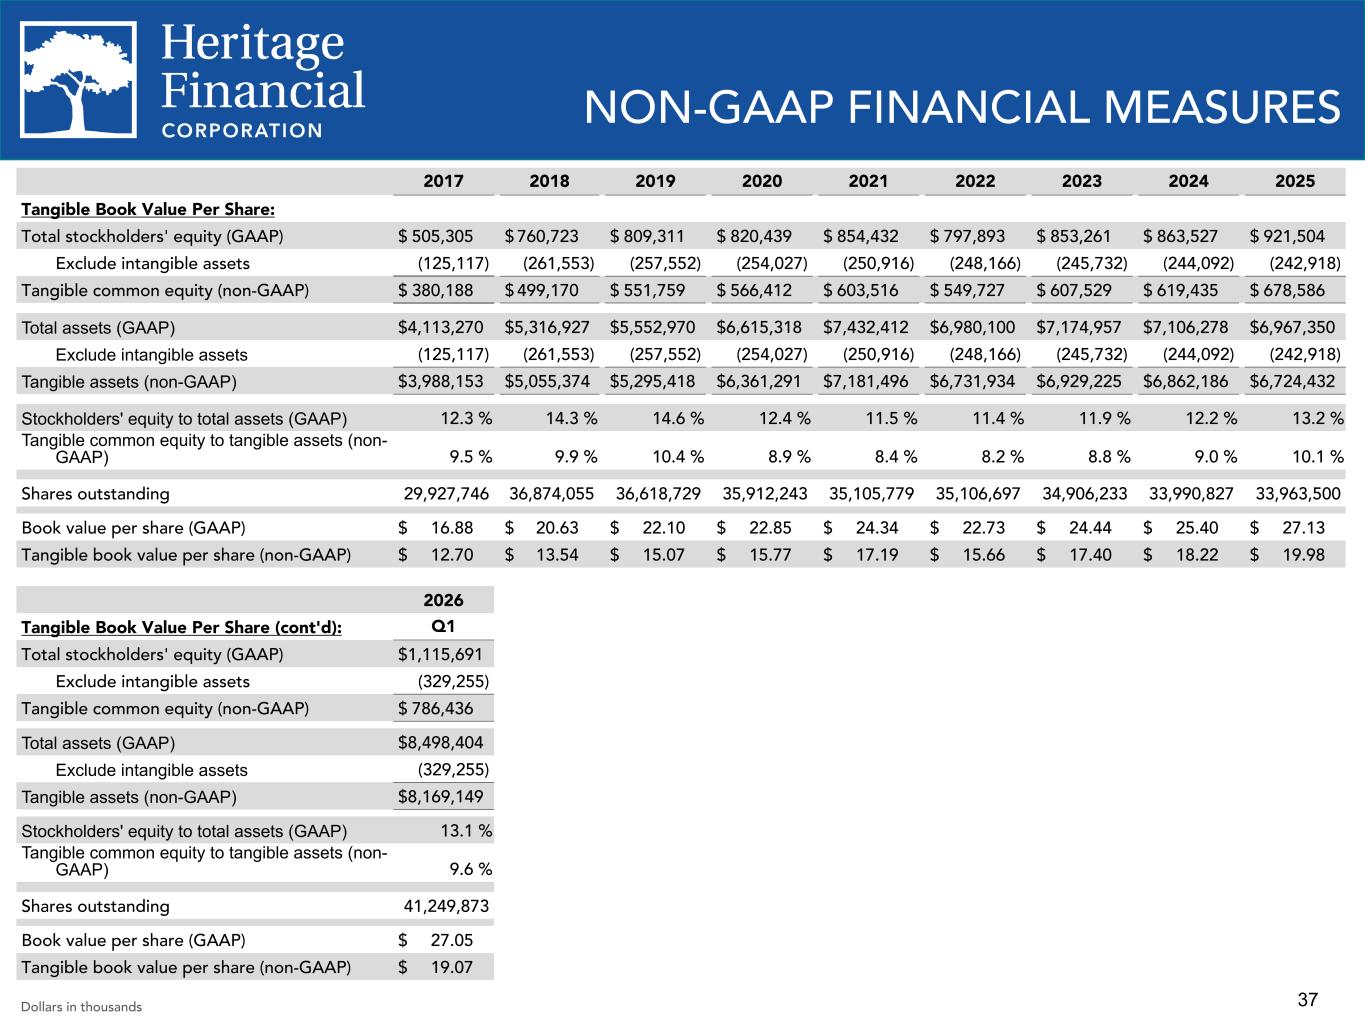
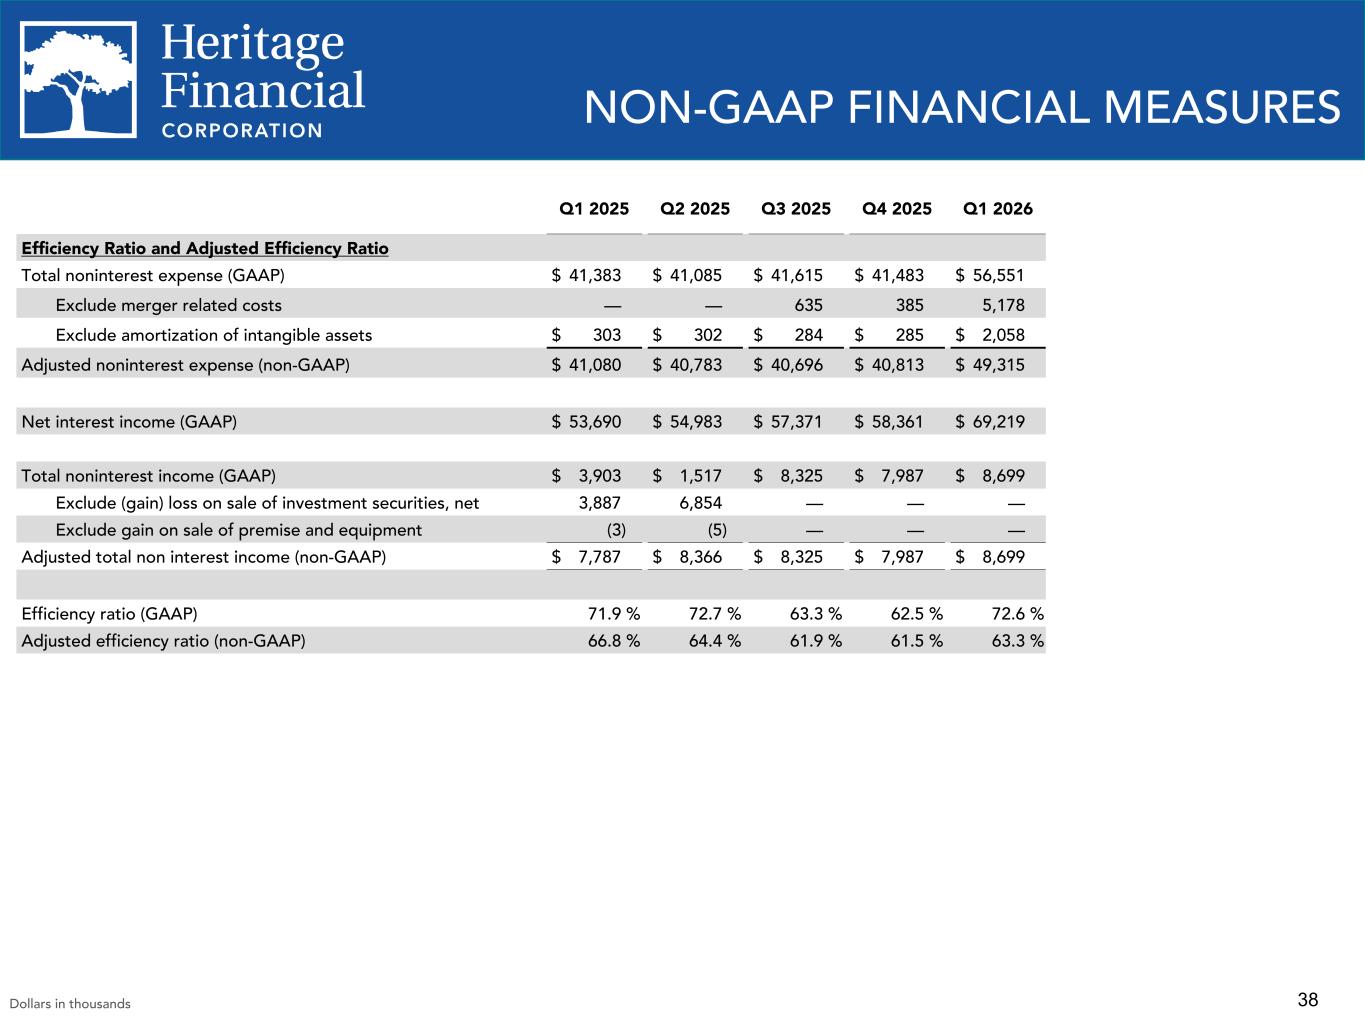
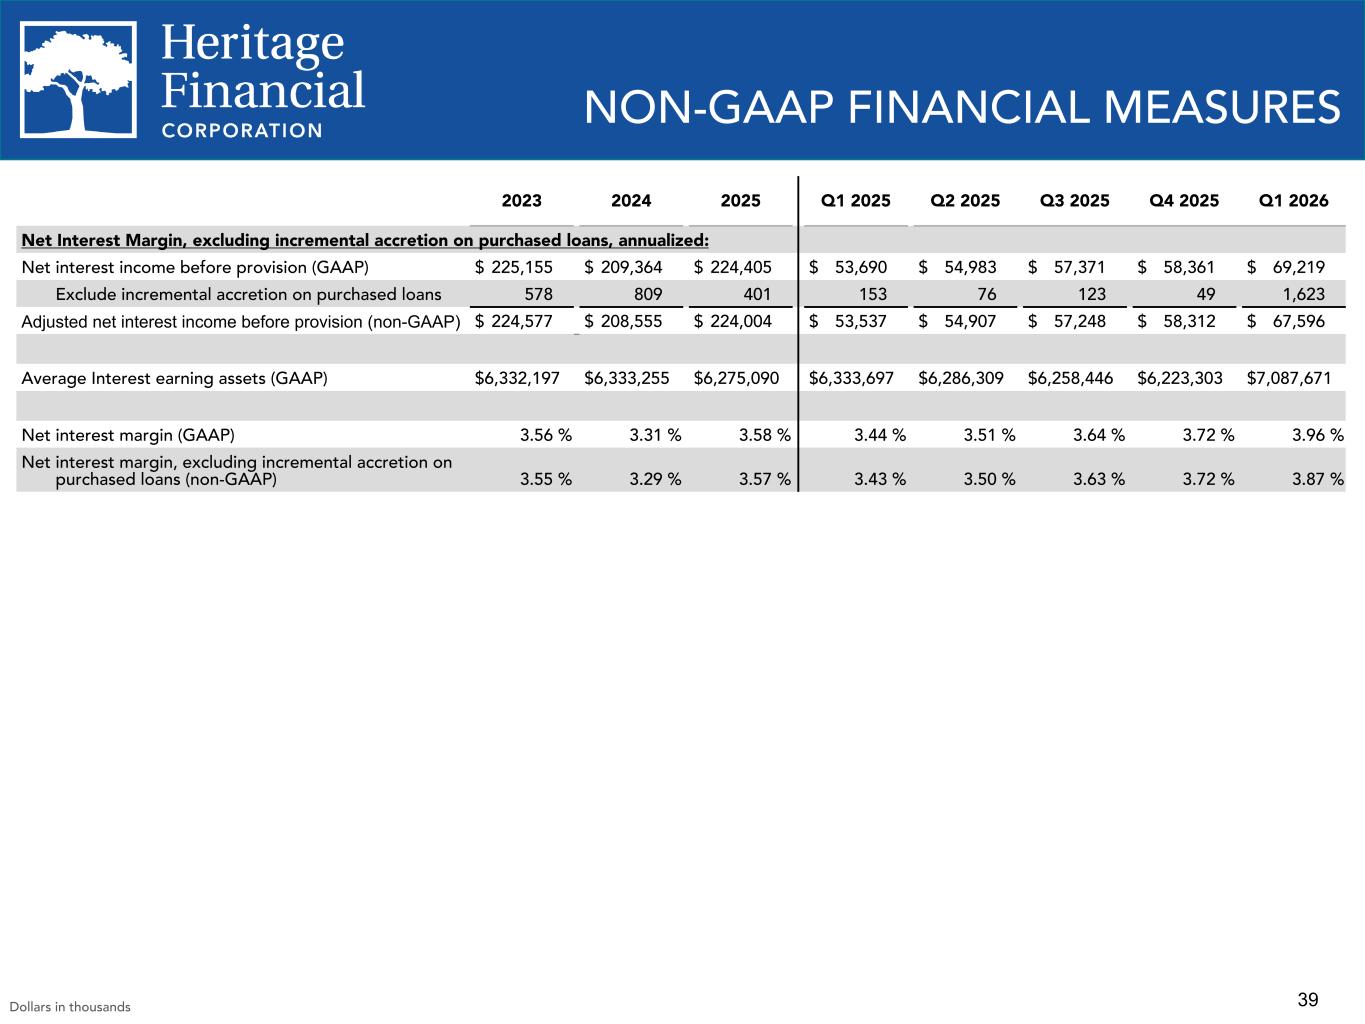
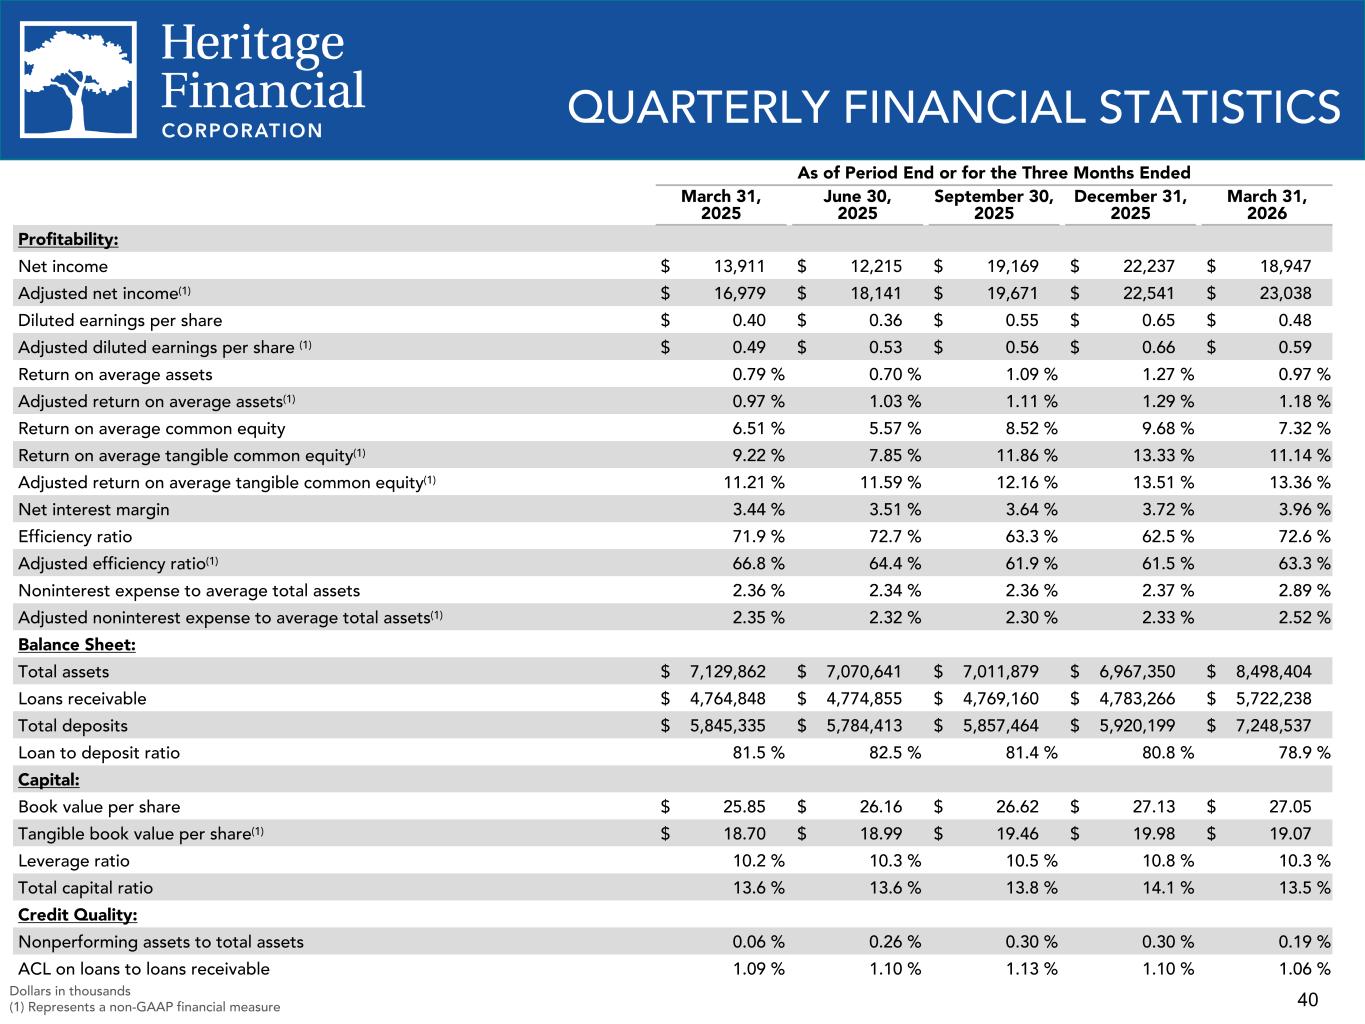
Thank you, Bryan. I'll be reviewing some of the main drivers of our performance for Q1. As I walk through our financial results, unless otherwise noted, all the prior period comparisons will be with the fourth quarter of 2025. I will also be incorporating the impact of the Olympic merger into our results. Starting with the balance sheet. Total loan balances increased $939 million in the first quarter. Loans acquired in Olympic totaled $954 million. Q1 yields on the loan portfolio were 5.73%, which was 19 basis points higher than Q4. The Olympic merger had a significant impact on the yield for the quarter as we brought over their loan portfolio at current market rates. In addition, approximately 6 basis points of the increase was due to the recovery of interest on nonaccrual loans. Bryan McDonald will have an update on loan production rates in a few minutes. Total deposits increased $1.33 billion in Q1. Deposits acquired in the Olympic merger totaled $1.39 billion. The decrease in deposits excluding the acquired deposits was partially due to the maturity of $29 million of brokered CDs that were not renewed. The cost of interest-bearing deposits decreased to 1.71% from 1.83% in the prior quarter. This decrease was due partly to the merger as Olympic had lower cost deposits and partly as a result of the Fed rate cuts in Q4, which resulted in lower deposit rates. Investment balances increased $388 million from the prior quarter, also due to the Olympic merger. Although we have reported that only $312 million was acquired in the merger, a portion of Olympic's investment portfolio as part of our restructuring strategy was sold prior to the merger date and reinvested subsequent to the merger. The yield on the investment portfolio increased 17 basis points due to acquiring the portfolio at current market rates. Moving on to the income statement. Most categories increased from the prior quarter due to the merger. I will cover a few areas of note. In addition to the impact of the earning assets acquired in the merger, net interest income also benefited from an increase in the net interest margin. The net interest margin increased to 3.96% from 3.72% in the prior quarter and from 3.44% in the first quarter of 2025. The increase was due primarily to the previously mentioned increases in yields on the loan and investment portfolios and a decrease in the cost of deposits. The previously mentioned recovery of interest on nonaccrual loans had a 5 basis point impact on the margin for the quarter. We recognized a reversal of provision for credit losses in the amount of $1.03 million in Q1. This reversal was due primarily to adjusting the allowance from 1.10% at the end of 2025 to 1.06% at the end of Q1. This decrease in allowance was due to the acquired Olympic loan portfolio, requiring a lesser allowance based on the specific attributes of that portfolio. In addition, net charge-offs remain at very low levels. Tony will have additional information on credit quality metrics in a few moments. In addition to the scale of a larger organization, the increase in the noninterest expense was also due to merger-related costs of $5.2 million versus $385,000 in the prior quarter and intangible amortization expense of $2.1 million compared to $285,000 in the prior quarter. Due to the fact that the systems conversion for Olympic is scheduled for late Q3 of this year, we expect elevated expense levels until Q4. Based on the current forecast of staffing levels and merger-related costs, including the fact that Q1 only included 2 months of combined operations with Olympic, we are expecting quarterly noninterest expense levels to increase to an average of approximately $64 million to $65 million in Q2 and Q3 before decreasing to a range of $56 million to $57 million in Q4. And finally, moving on to capital. All of our regulatory capital ratios remain comfortably above well-capitalized thresholds, and our TCE ratio was 9.6% at the end of Q1 compared to 10.1% in the prior quarter. The decrease in the TCE ratio was expected due to the impact of the merger. I will now pass the call to Tony, who will have an update on our credit quality.
Speaker 3
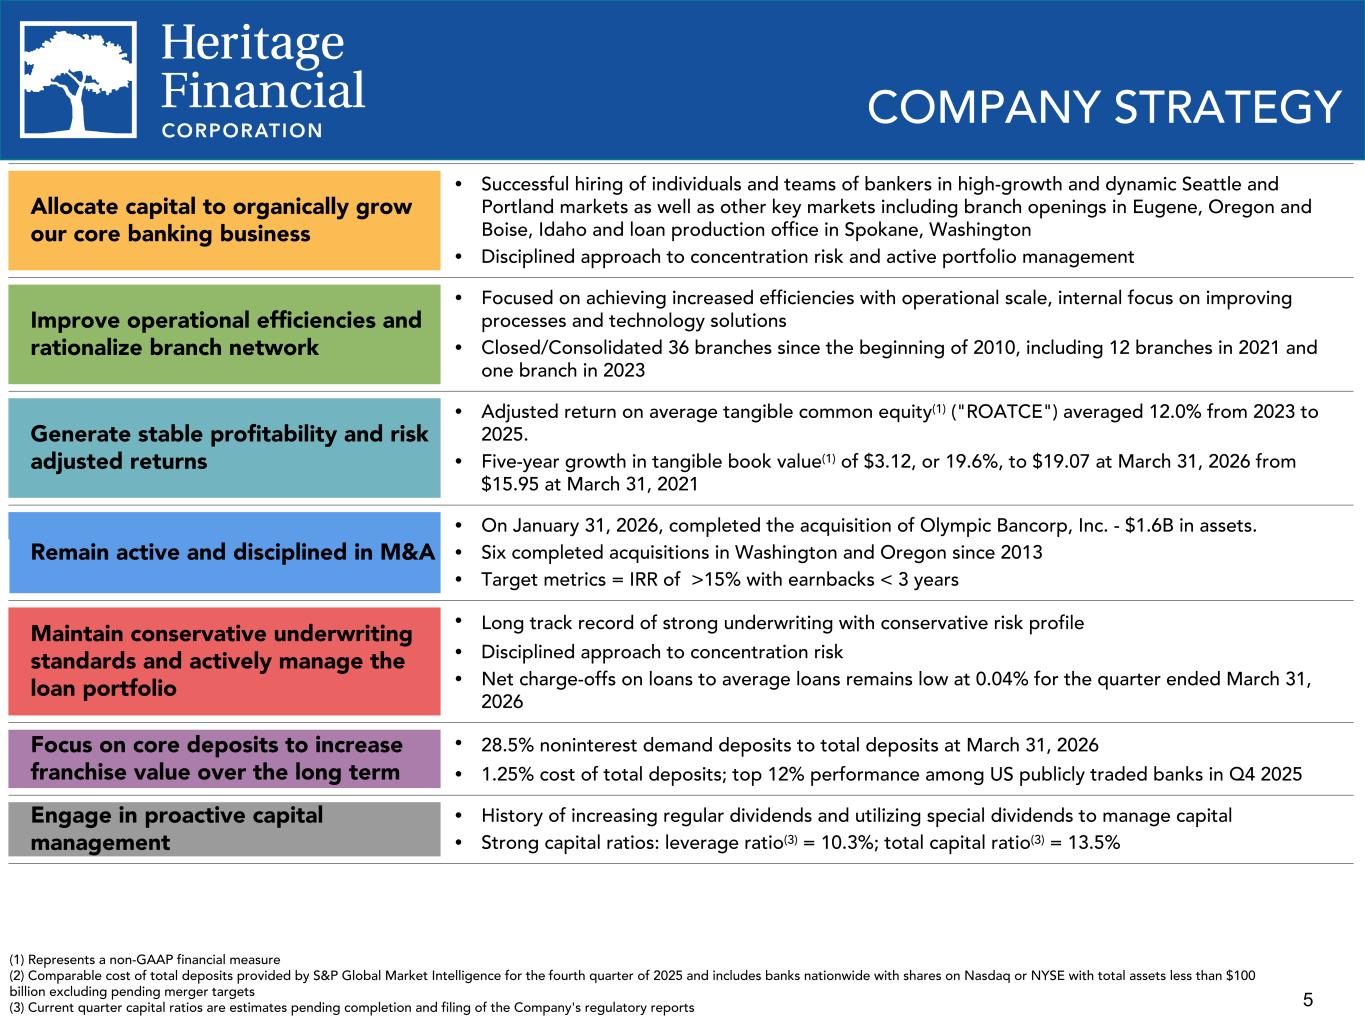
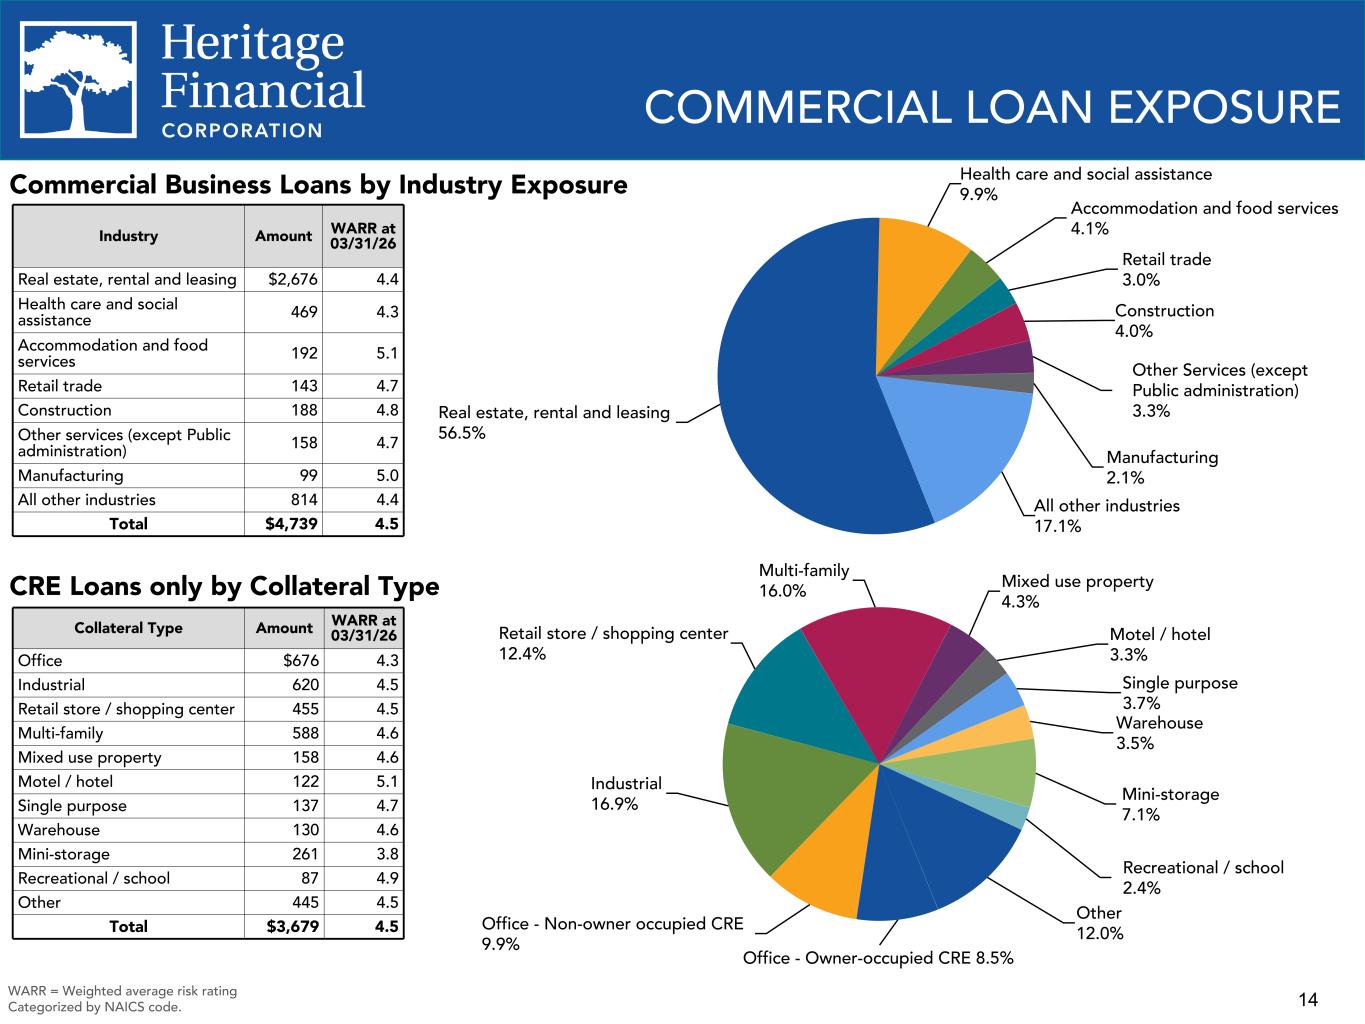
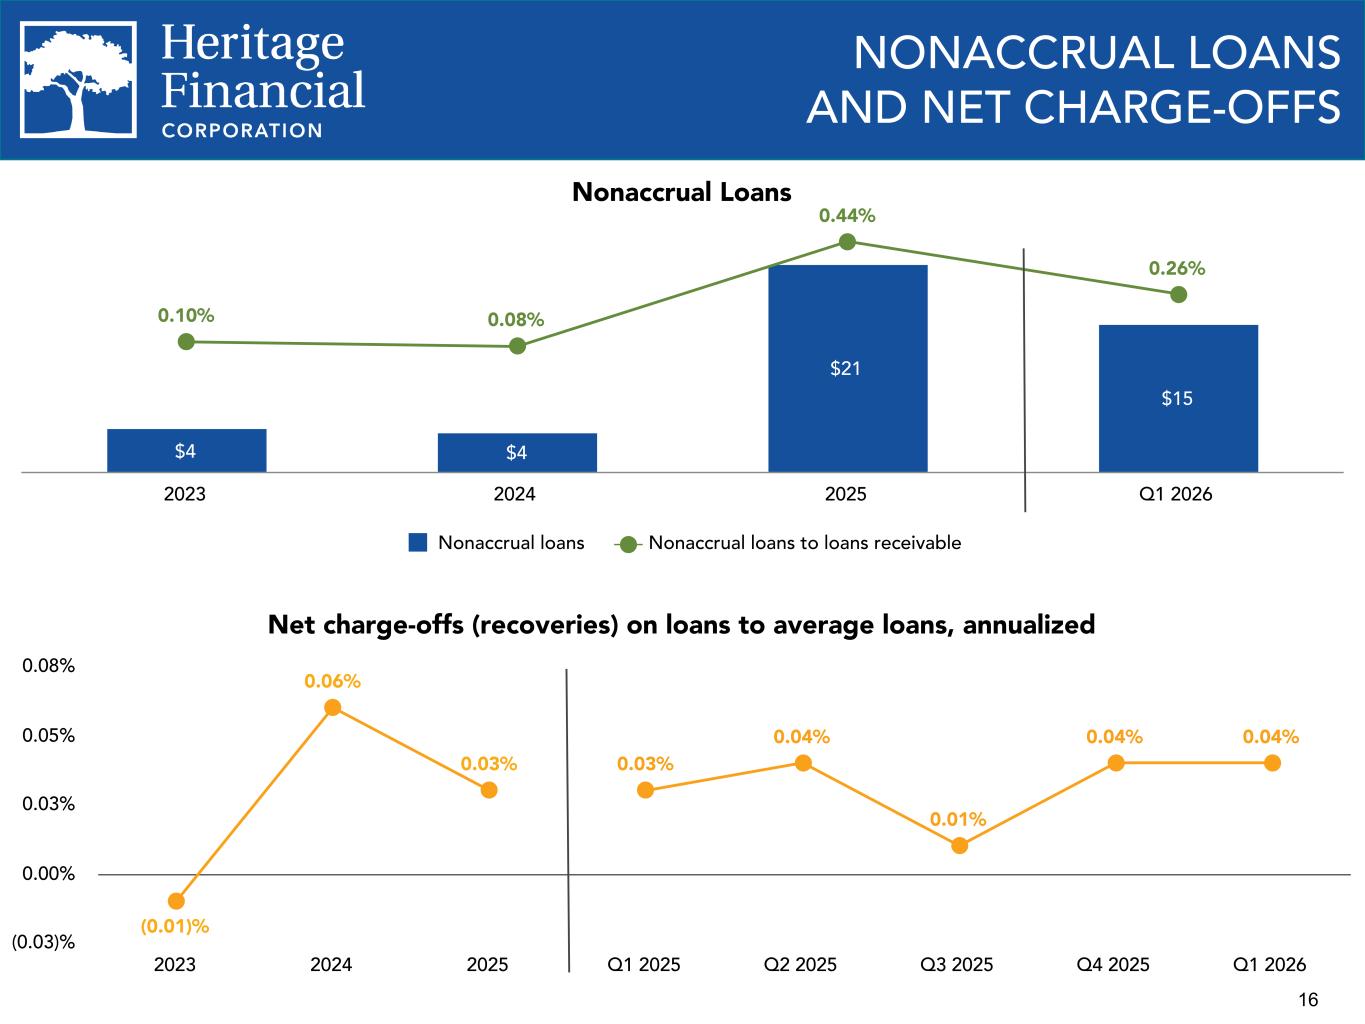
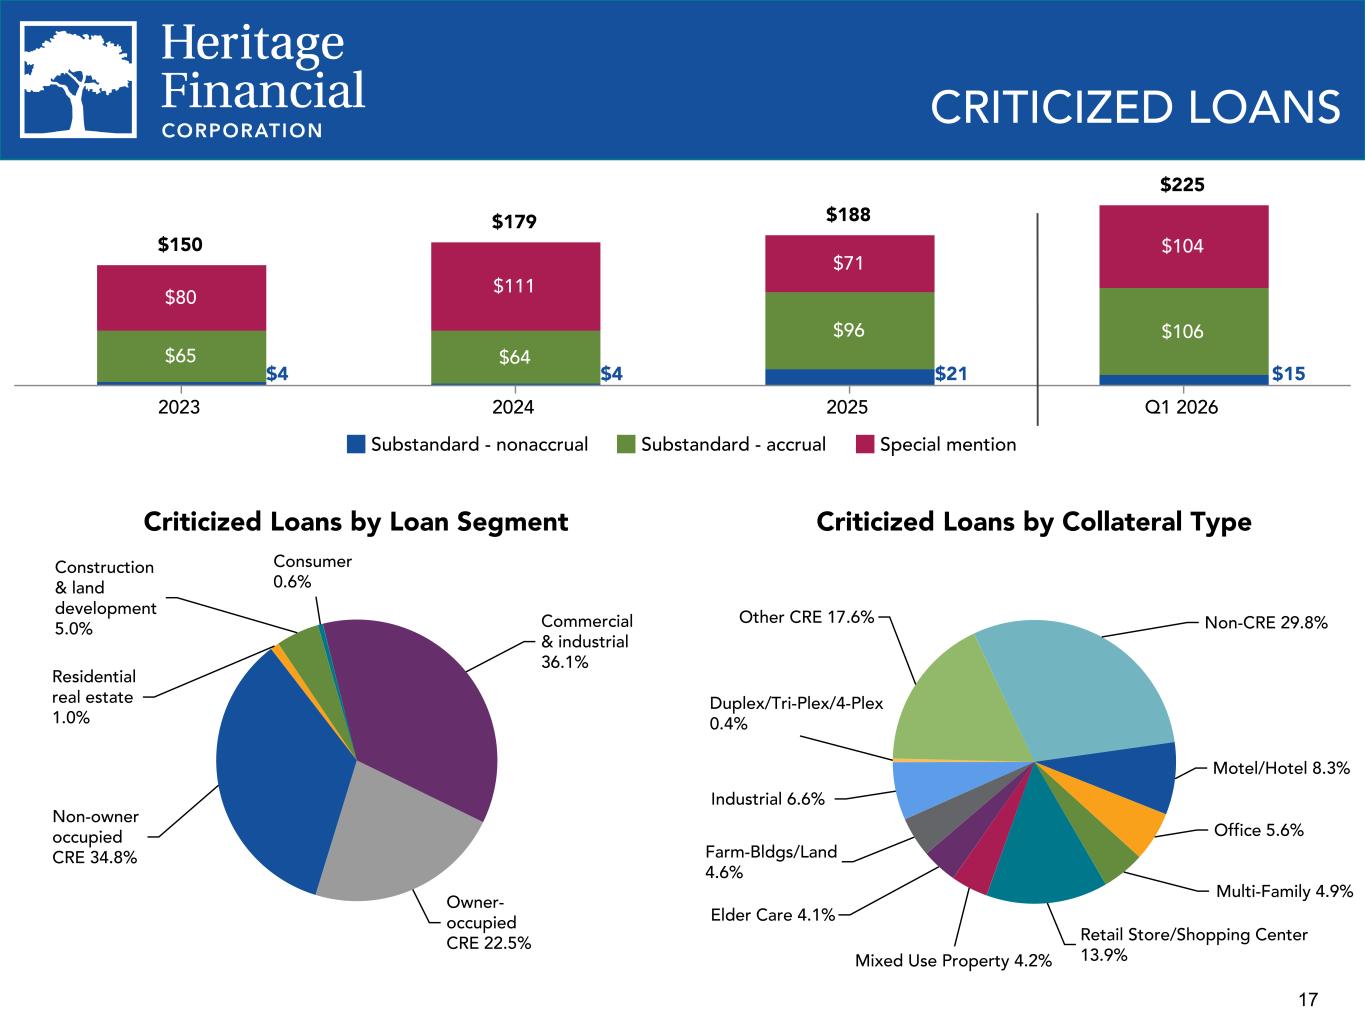
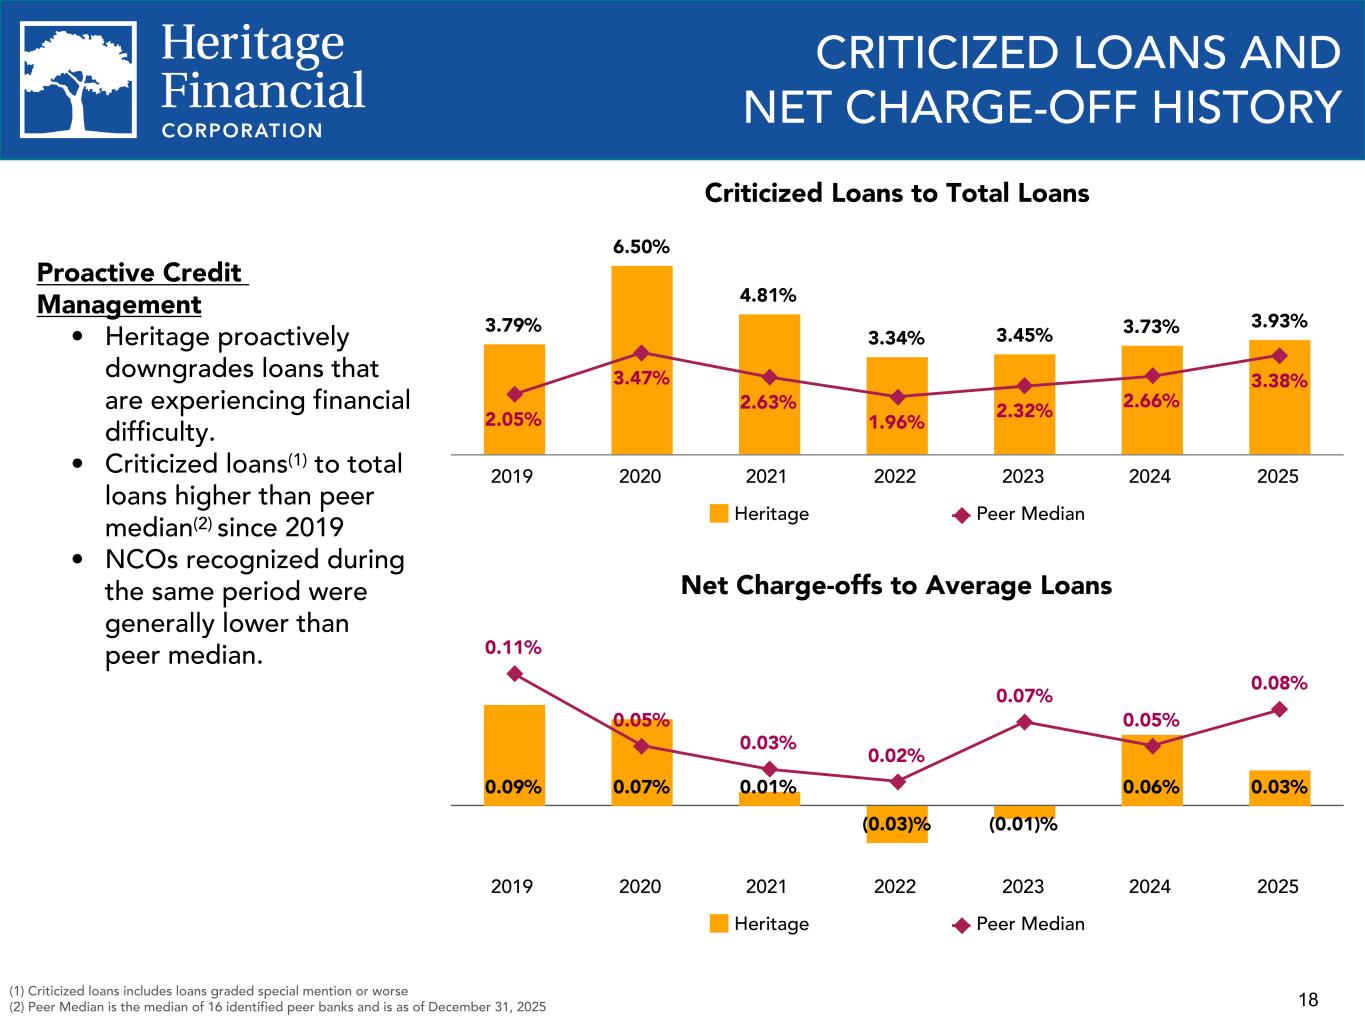
Thank you, Don. I'm pleased to report that credit quality remained strong and stable in the first quarter. With the addition of the Olympic portfolio during the quarter, the high quality of these loans had a positive impact on our credit metrics at quarter end. Nonaccrual loans totaled $15 million at quarter end, declining by $6 million during the quarter. This represents 0.26% of total loans and compares to 0.44% at the end of 2025. Most of the improvement came from the full repayment of a $5.8 million residential construction loan and a $1.5 million multifamily term loan. Partially offsetting the improvement was the movement of a $2.6 million commercial loan to nonaccrual status. Within our nonaccrual loan portfolio, we have just under $4.2 million in government guarantees. Notably, there were no nonaccrual loans in the acquired Olympic portfolio at quarter end. With the decrease in nonaccrual loans, the ratio of nonperforming loans to total loans improved to 0.26% from 0.44% at the end of 2025. During the quarter, we acquired an ORE property through a foreclosure action. This is a single-family residence with a book balance of $755,000. The house will be marketed for sale in the second quarter. This is the first ORE property we've held since 2020. Criticized loans, those rated special mention or worse, moved higher during the quarter by $37 million with $18 million coming from the inclusion of the Olympic portfolio. As a percentage of total loans, criticized loans were stable at 3.9%, the same percentage that we experienced at the end of 2025. When looking at the severe substandard category, we saw an improving trend during the quarter. Substandard loans to total loans dropped to 2.1% at quarter end versus 2.4% at the end of 2025. Most of the improvement was from the repayment of the two nonaccrual loan relationships mentioned previously. It should also be noted that the Olympic portfolio had lower levels of criticized loans relative to their total loans, which had a positive impact on the combined ratios. Page 18 in our investor presentation shows the stability in our criticized loans over the past four years. As of quarter end, our ratio of total nonowner-occupied CRE loans to total loans moved just above the regulatory guidance level to 30.1%. The increase in the ratio was due to the inclusion in the Olympic portfolio and the fair value accounting for the acquisition. While growth in CRE loans was modest during the quarter, the lower combined capital level from the fair value marks resulted in a higher total CRE ratio. The increase was expected from our acquisition model, and we anticipate the ratio will decline to historical levels over time. During the quarter, we experienced total charge-offs of $583,000. Approximately 70% came from our commercial portfolio, with the remainder coming from our consumer loans. The losses were partially offset by $31,000 in recoveries, leading to net charge-offs of $552,000 for the quarter. On an annualized basis, this represents 0.04% of total loans and is consistent with the 0.03% ratio that we achieved for the full year 2025. While we are pleased with the stability in our credit metrics through the first quarter, we are aware of the emerging risks in the economy and the potential impact on our credit quality. We remain consistent in our disciplined approach to credit underwriting and believe this is reflected in the strong credit performance we have maintained over a wide range of business cycles. I'll now turn the call over to Bryan for an update on our production.
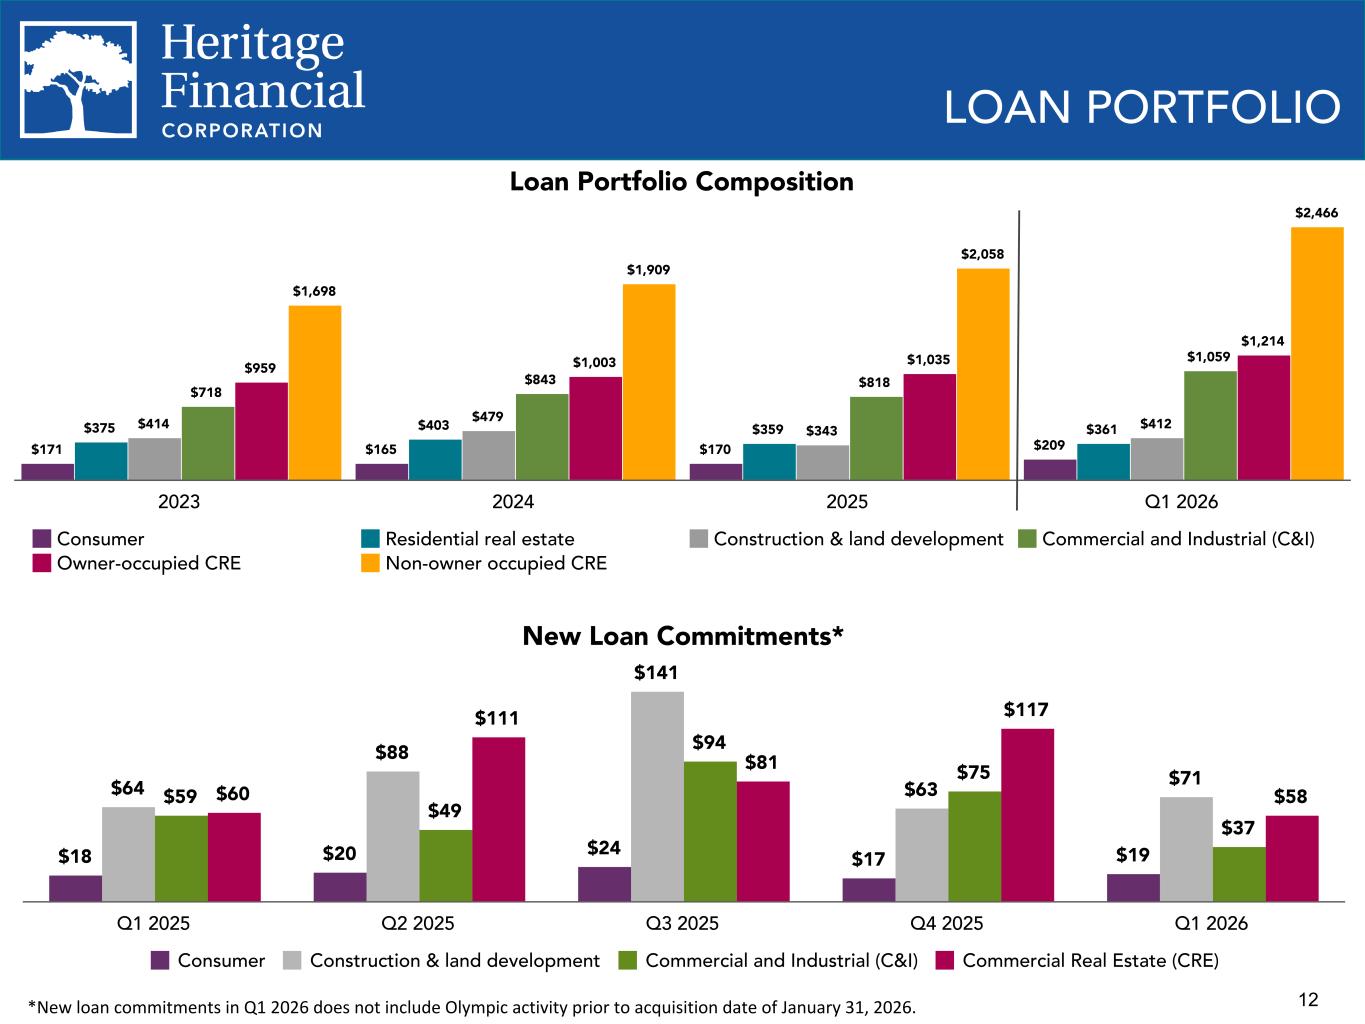
Thanks, Tony. I'm going to provide details on our first quarter production results, starting with our commercial lending group. For the quarter, our commercial team closed $166 million in new loan commitments, down from $254 million last quarter and down slightly from $183 million closed in the first quarter of 2025. Please refer to Page 12 in the investor presentation for additional detail on new originated loans over the past five quarters. The commercial loan pipeline ended the first quarter at $631 million, up from $468 million last quarter and up from $460 million at the end of the first quarter of 2025. Loan balances increased $939 million during the quarter. Majority of this increase was due to the merger, but Heritage loan balances, excluding any impact from Olympic, were up $20 million in the quarter. Based on the current pipeline, we expect an annualized loan growth rate in the mid-single-digit range in the next couple of quarters. Deposits increased just over $1.3 billion due to the merger. Excluding the merger, deposits decreased $61 million, which included a $29 million decline in brokered CDs. The first quarter decline is typical of our deposit seasonality, with declines often occurring in the first quarter and through the end of April due to tax payments. The deposit pipeline ended the quarter at $81 million compared to $108 million in the fourth quarter, and average balances on new deposit accounts opened during the quarter are estimated at $33 million compared with $45 million last quarter. Moving to interest rates. Our average first quarter interest rate for new commercial loans was 6.11%, which is down 45 basis points from the 6.56% average for last quarter. This rate average is based on outstanding balances. Using average commitment balances, the average was 6.41%. In addition, the first quarter rate for all new loans was 6.16%, down 27 basis points from 6.43% last quarter. In closing, as mentioned earlier, we are pleased to have the Olympic merger closed, which strengthens our position in the Puget Sound. And overall, we believe we are well positioned to navigate what is ahead and to take advantage of various opportunities to continue to grow the bank. With that said, Angela, we can now open the line for questions from call attendees.
Operator
Your first question comes from the line of Jeff Rulis with D.A. Davidson.
Speaker 4
I wanted to circle back on the expenses. It seems kind of high. I understand that you've got Olympic for the full quarter, but by chance are you including additional merger costs in that $64 million to $65 million in the next couple of quarters?
Speaker 2
Jeff, yes, that includes the merger-related expenses. If you take out merger costs, we're more in the $57 million to $58 million range for the next two quarters and then dropping to about $55 million by Q4. So I was not putting everything into that $64 million to $65 million number.
Speaker 4
So $55 million post-deal excluding merger costs is the run rate that you're pointing to in Q4?
Speaker 4
Okay. And if you could — Don, you offered some rough detail on where those merger costs were by line item, but do you have a dollar figure just to kind of really carve those out, if possible?
Speaker 2
Do you mean over the remaining three quarters or are you asking about the trailing quarter?
Speaker 4
No, in the trailing quarter, the 1Q — just over $5 million. If you could just point as to where that was mapped by line item?
Speaker 2
Professional services would be a big one on that. And then also compensation because of severance would be some. And then I think we also have some contract items that would show up in data processing. Those are the bigger ones. I don't have it broken out by type for that $5 million.
Speaker 4
Okay. That's helpful. And then on the margin, did you say the interest recovery was 5 or 6 basis points beneficial to the margin?
Speaker 2
To the margin, it was 5 basis points in the quarter related to the interest recovery.
Speaker 4
Okay. And you said 6 on the loan yield and 5 on the margin? I appreciate it. And then do you have the margin average for the quarter?
Speaker 2
Yes. If I take out the interest reversals for March NIM, it was 3.95%. But if we include the interest reversals that happened in March, it was 3.96% for the quarter.
Speaker 4
And the 3.95% will include accretion that's part one and then part two?
Speaker 2
Yes. There's always a chance that you'll get a large payoff that will cause the margin to change, but I don't expect anything unusual compared to what we've been experiencing so far. Of course, we only have two months of experience post-close, but I don't expect March to be unusual relative to going forward.
Speaker 4
And leaning back to the introductory comments about an upward trajectory from here. We will kind of do what we will with accretion, but the core sounds fairly positive. Any sort of further comments on whether you target 4% plus or anything on forward margin expectations with that upward trajectory in mind?
Speaker 2
I think we'll continue to see margin expansion — not going to be significant — but depending on things like how much we can leverage the balance sheet and the loan growth, we'll get a little increase every quarter due to loans repricing. So the adjustable loans and new originations are higher. I expect to reach 4% by the end of the year or before.
Operator
Your next question comes from the line of Jackson Laurent with Stephens.
Speaker 5
This is Jackson on for Andrew Terrell. If I could start on the balance sheet. I appreciate the color on the updated growth trajectory for loans. I was just wondering where you guys are seeing signs of strength in the portfolio? What are you seeing from the Kitsap bankers early on? And maybe a little bit of color on what caused the change in expectations. I think we were talking about upper single digits in January after kind of low single digits in the first quarter?
Sure. Maybe I'll go to Tony first for comments on credit in general, and then I'll pick up on the Kitsap bankers, the loan pipeline and outlook.
Speaker 3
Yes. Jackson, with the merger, the credit cultures were pretty similar. So we haven't really had to make any real changes in our approach with the Kitsap bankers. They look at credit very similarly to how we do. I think there's going to be some opportunities for some of their better borrowers to have some higher borrowing limits, which will probably help extend those relationships a bit more. But generally, we're feeling pretty comfortable on a go-forward basis on a combined basis. Areas of strength really continue to be owner-occupied CRE and we've been continuing to push on the C&I space because it comes with relationships and deposits.
Yes. Really, the primary driver behind the change in loan growth from last year was the larger level of construction loan payoffs that we had in 2025, which we mostly worked through before the end of the year. Those were the larger ones that we had been expecting, and that was related to a bulge in construction loan activity in prior years that then converted to payoffs last year. We did have a few payoffs in the Kitsap portfolio that were not unexpected, but a few larger ones transpired before and after close. The driver behind the go-forward growth rate is really the change in the pipeline. The pipeline had been growing when we did our Q4 call in January, and we've seen it continue to grow. The pipeline is up 35% over where it was at the end of Q4 and up a little more than that compared to Q1 a year ago. We did see some deal closings push from first quarter into the second quarter, so we didn't close quite as many as we anticipated on the Q4 call. But regardless, we're still seeing a good pipeline and absent some change in borrower behavior related to outside factors, we feel good about that pipeline driving mid-single-digit loan growth in the next couple of quarters.
Speaker 5
Got it. That's all super helpful. Maybe switching to deposit costs. We've all heard a lot on competition recently. We personally track CD promotional rates, and it looks like you guys raised your highest rate recently. Given your already low cost of deposits, how are you thinking about deposit repricing going forward? Do you think there's any risk to upward migration in deposit costs throughout this year?
Speaker 2
The competition is out there. We did raise our highest rate on some CDs. For the quarter, cost of interest-bearing deposits was 1.71%; for March, it was 1.68%. I don't expect it to move a whole lot. I think we'll get a little bit of help from some higher CDs rolling down, but there could also be pressure if you're bringing in new customers with full relationships where you might pay higher rates. So I think those factors will largely offset. I expect us to stay right around the 1.68% level for March and hover around 1.70% for the remainder of the year, unless the Fed does something that materially changes the environment.
I would just add, you're right. We are seeing stronger deposit competition for excess dollars going into money market accounts and CDs. We're having good success with our relationship strategy, which is how we're driving deposit growth. We are continuing to compete for those extra funds but still winning good quality operating relationships, and that helps keep the overall mix in alignment with where it's been previously.
Speaker 5
Got it. That's helpful. Lastly, switching to capital. I know your focus is likely still on integration and the conversion in Q3, but could you update thoughts on buybacks and potential future loss trades?
Speaker 2
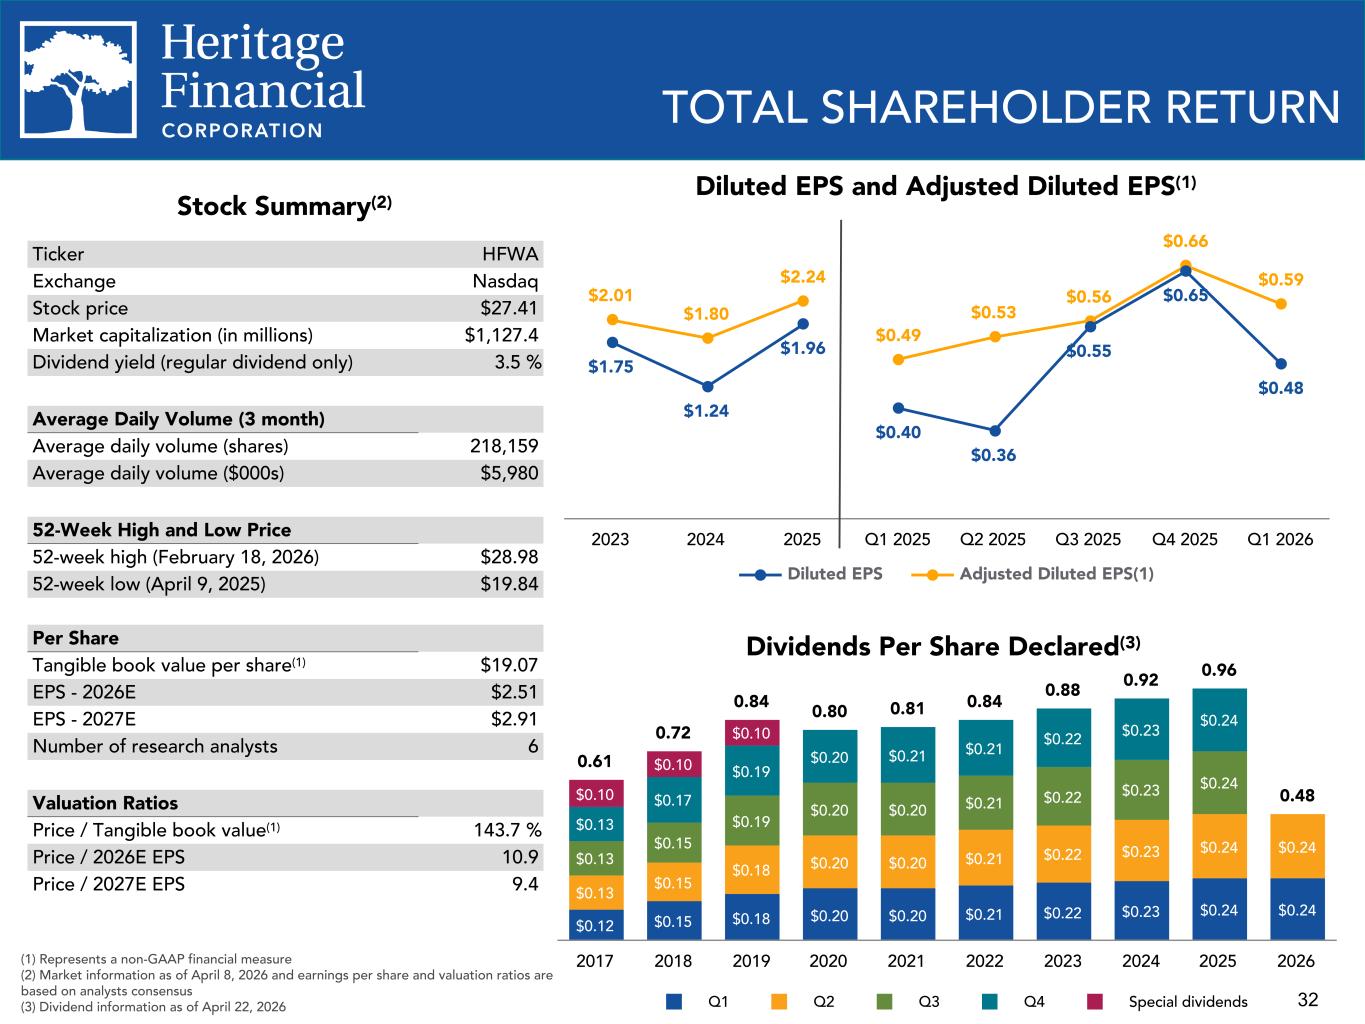
At this point, we don't have plans for loss trades. Things can change, but we'll always be looking to manage capital. I think we're in a pretty good range right now. We may be involved in buybacks to manage capital levels. We still have about 800,000 shares left in our current repurchase plan, and so we may be active this quarter on that.
Operator
Your next question comes from the line of Charlie on for Kelly Motta with KBW.
Speaker 6
With ongoing disruption across Pacific Northwest banks and your employee count jumped with the addition of Kitsap, are you seeing opportunities to recruit any commercial banking teams or individual producers beyond Kitsap? Is there any incremental hiring embedded in the expense run rate for 2026?
We are recruiting. We traditionally add high-quality bankers as they become available across the footprint. We're not seeing a net increase in total banker head count because we continue to have retirements of long-time bankers. We have been adding bankers in several teams, typically one or two per team, but those additions have largely been offset by retirements so far. We continue to talk to candidates and would be open to doing teams if the right opportunities arose, as we have in the past. So far, additions have been spread across various teams.
Speaker 6
And on the acquisition, understanding conversions in Q3, where if anywhere has execution run ahead of or behind schedule? Maybe stepping back, how are customer retention, producer retention, any synergy realizations — how is the integration holding up?
I would say we're right on track. There are many components to the integration plan and we review status weekly. From a customer impact standpoint, there hasn't been any negative customer response to the combination. We'll learn more when we go through the systems conversion, but we've retained all the branch teams and commercial bankers, so customers haven't experienced disruption. Tony mentioned the good fit between credit cultures, so no disruptions there. Overall, integration is going as we had hoped and anticipated.
Operator
Your next question comes from the line of Evan on for David Feaster with Raymond James.
Speaker 7
This is Evan on for David Feaster. On loan growth, the color on the pipeline was helpful. More broadly, how has borrower sentiment been holding up within your markets, especially with some of the macro uncertainty we've been experiencing? And as a follow-up, on payoffs and paydowns — they were a headwind industry-wide. It was good to see those pressures abating this quarter. What do you expect to see on payoffs and paydowns going forward?
We've seen the pipeline build since last summer and we did see some delays in deals closing, which contributed to growth in the pipeline. Some borrowers decide to hold or delay in times of disruption, but we're not seeing that broadly so far. It may be early to tell the final implications for deals falling out of the pipeline, but coming into April we've continued to see strong new deal flow. On payoffs and prepayments, Slide 15 in the deck details last year and Q1 2026. If you look at prepayments and payoffs, last year’s total divided by four gives a quarterly average; we're running a little lower in Q1 than that average, although the combined portfolio is larger with the addition of Kitsap and some of the payoff activity in Q1 included a couple of chunkier deals on the Kitsap side. Overall, payoff activity looks to be lower than what we encountered last year. We'll continue to update quarter-to-quarter to see if there are any chunkier deals in the Kitsap portfolio that will pay off as the year progresses, but currently it looks like prepay and payoff trends will be lower than last year.
Speaker 7
That's really helpful. On credit, trends were good during the quarter — nonaccruals and substandard loans were down and Kitsap appears additive to your credit profile. Are you seeing any specific sectors or business lines showing outsized pressure or that you're watching more closely than others?
Speaker 3
Yes, Evan. Over the last year the nonowner-occupied CRE space has been really strong and a solid part of our portfolio. Where we've seen a bit more pressure is in the C&I portfolio. Year-over-year, we've had a proportionate increase in our special mention and substandard loans within the C&I category. That increase isn't tied to any one specific industry or situation but relates to economic uncertainty: tariff issues, higher labor costs, supply chain issues, and so forth. In those situations, some companies are better positioned with stronger management and balance sheets than others. So we've seen some weakness in that area that we'll be watching closely, but it's hard to pinpoint to one specific industry or issue.
Operator
That concludes our question-and-answer session. I will now turn the conference back over to Mr. Bryan McDonald for closing remarks.
Thank you, Angela. If there are no more questions, then we'll wrap up this quarter's earnings call. We thank you for your time, your support and your interest in our ongoing performance. We look forward to talking with many of you in the coming weeks. Have a good day.
Operator
Ladies and gentlemen, that concludes today's call. Thank you all for joining. You may now disconnect.