Operator
Good day and thank you for standing by. Welcome to the Independent Bank Corporation first quarter 2026 earnings conference call. At this time, all participants are in a listen-only mode. After the speaker's presentation, there will be a question and answer session. To ask a question during this session, you will need to press star 11 on your telephone. You will then hear an automated message advising your hand is raised. To withdraw your question, please press star 11 again. Please be advised that today's conference is being recorded. I would now like to hand the conference over to your speaker today, Brad Kessel, President and CEO. Sir, please go ahead.
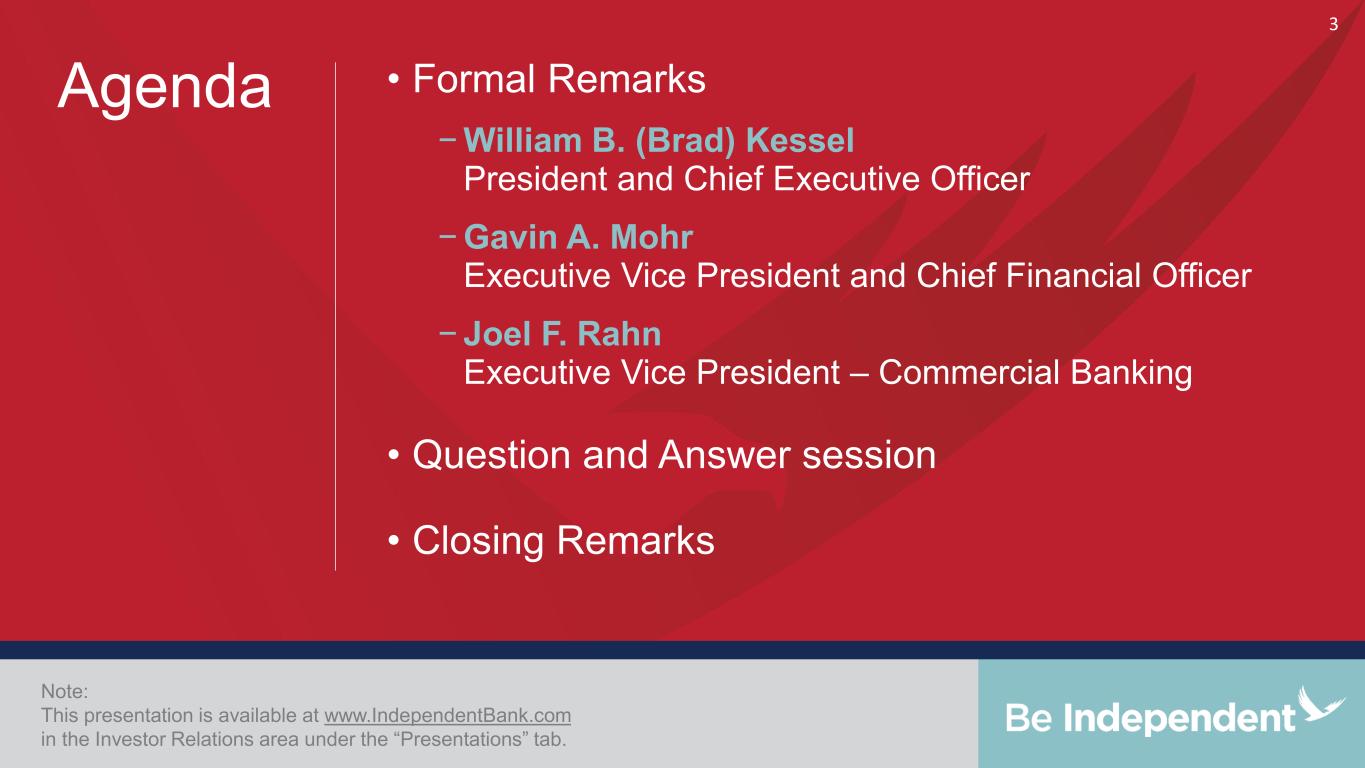
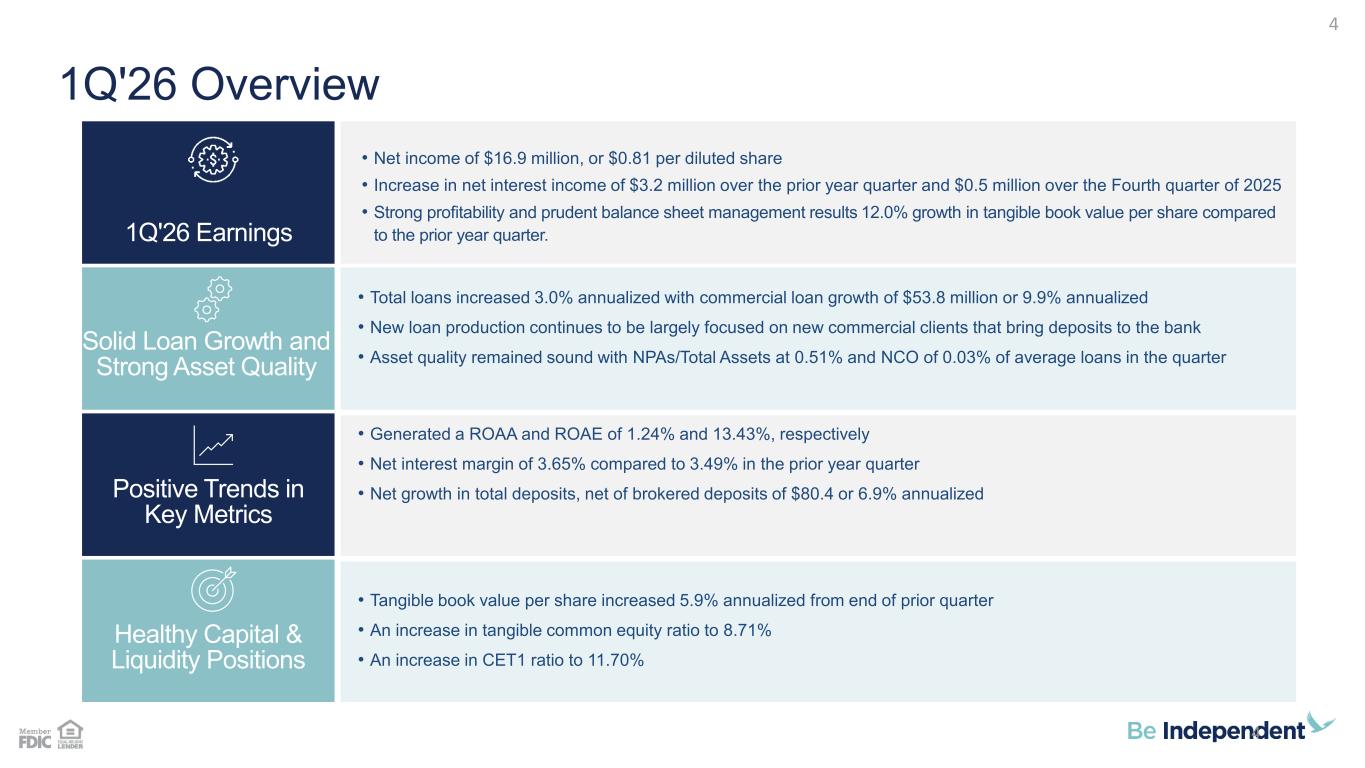
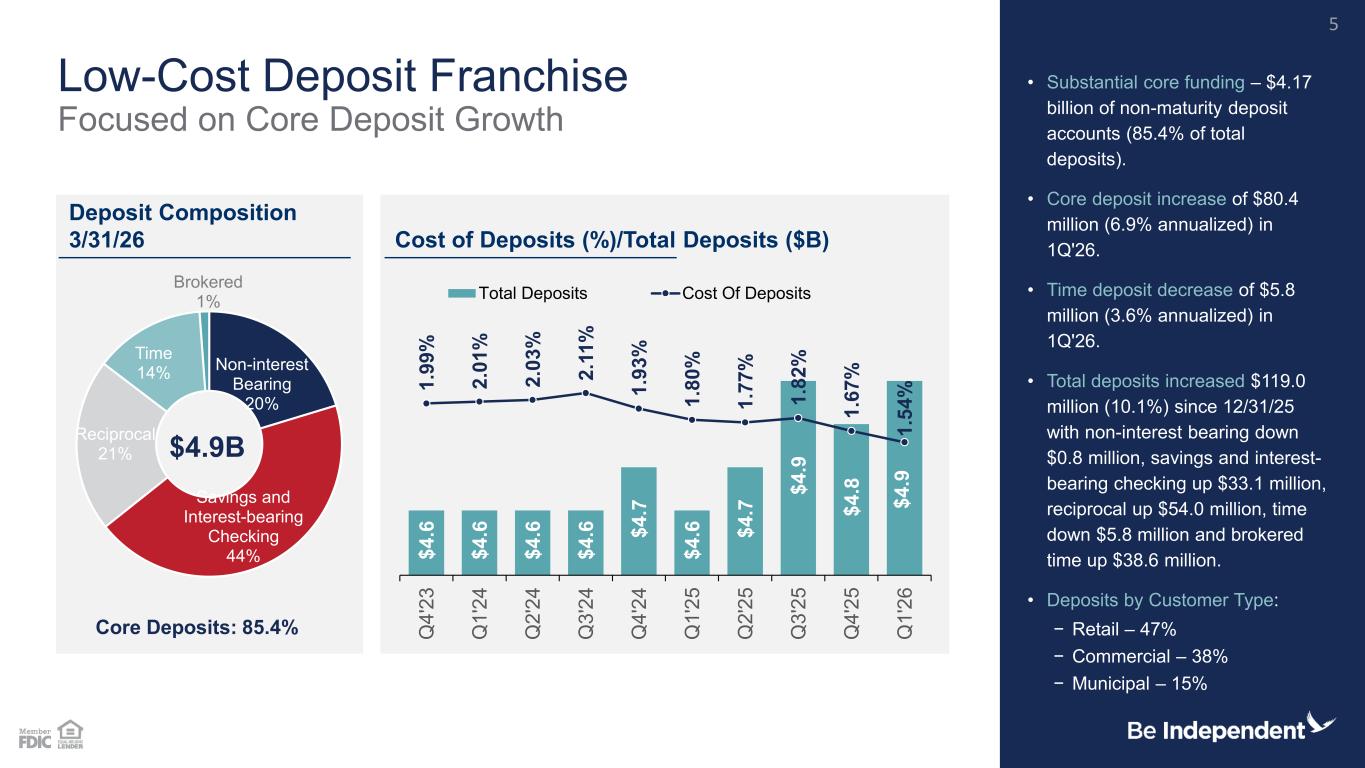
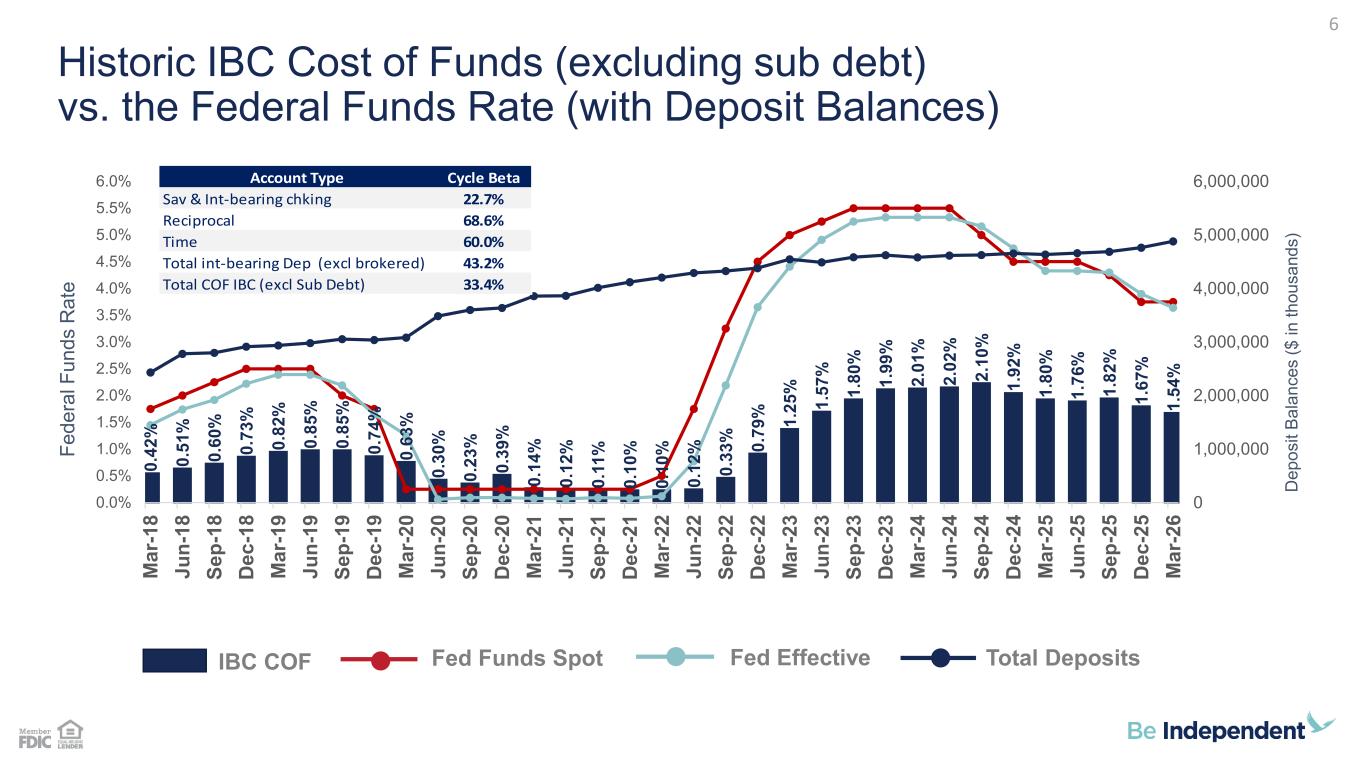
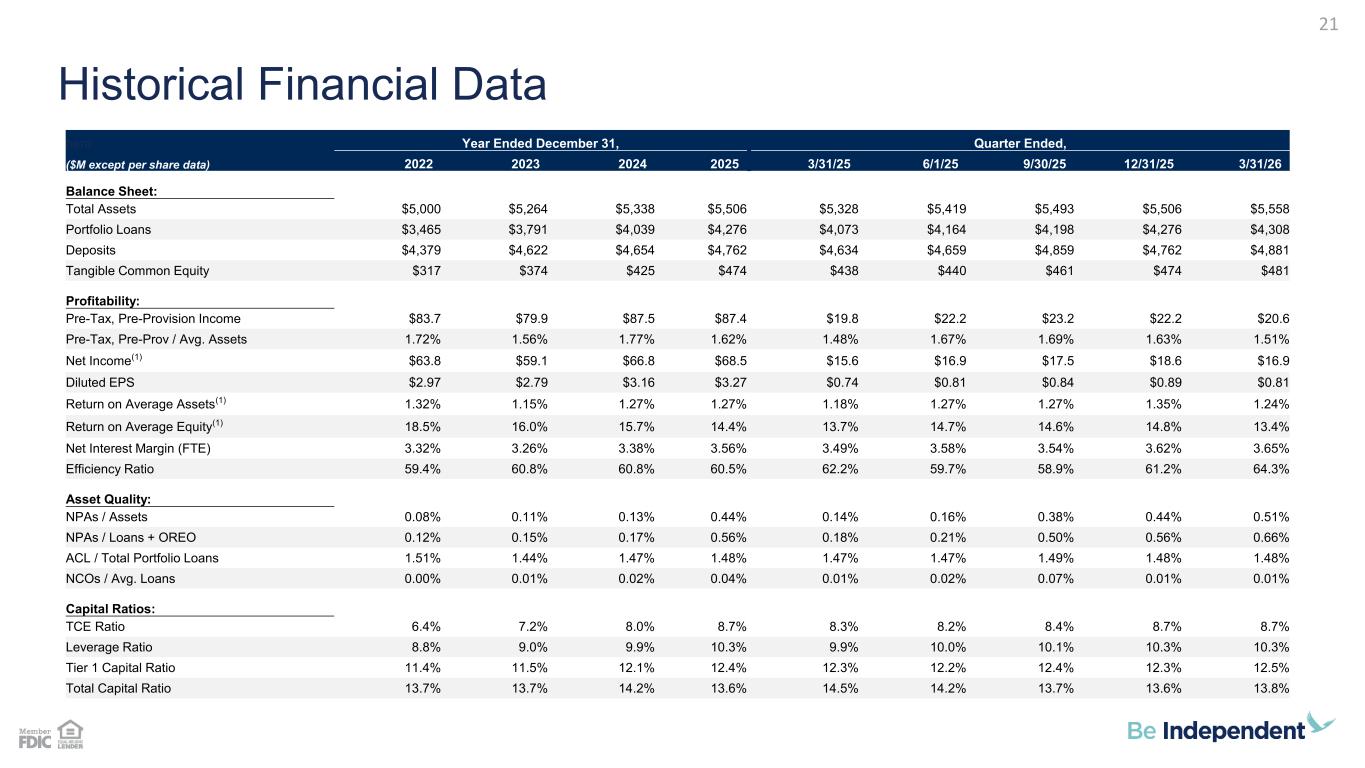
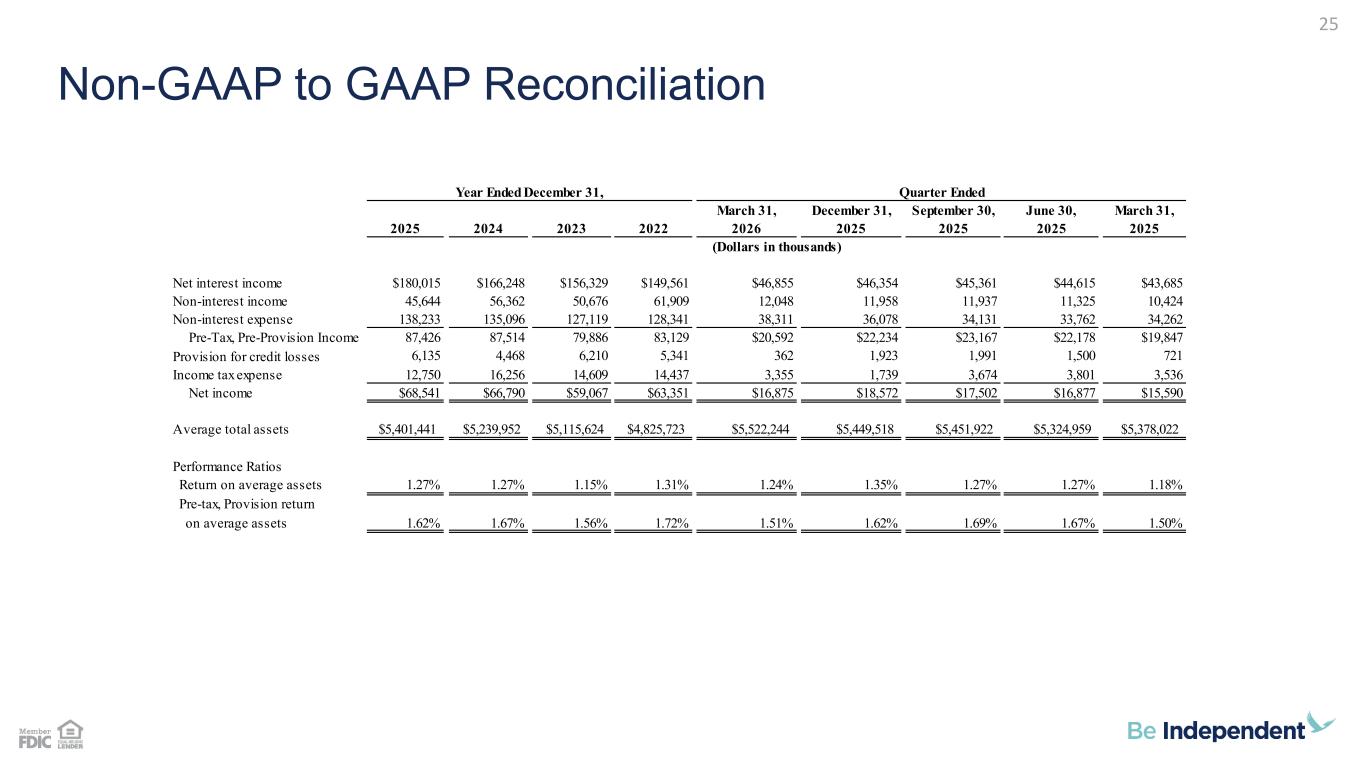
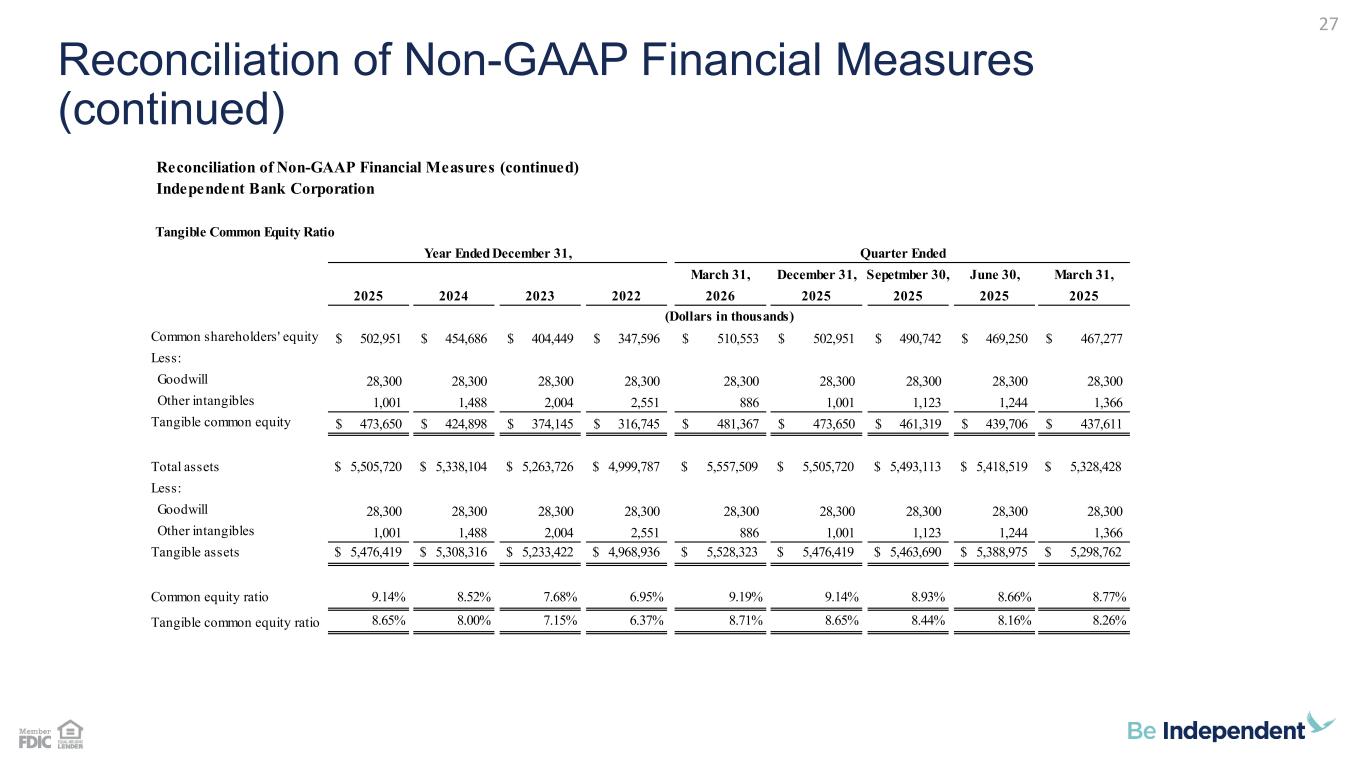
Good morning and welcome to today's call. Thank you for joining us for Independent Bank Corporation's conference call and webcast to discuss the company's results for the first quarter of 2026. I am Brad Kessel, President and Chief Executive Officer, and joining me this morning is Gavin Moore, Executive Vice President and our Chief Financial Officer, as well as Joel Rahn, Executive Vice President and Head of Commercial Banking for Independent. Before we begin today's call, I would like to direct you to important information on page two of our presentation, specifically the cautionary note regarding forward-looking statements. If anyone does not already have a copy of the press release issued by us today, you can access it at our website, independentbank.com. The agenda for today's call will include prepared remarks followed by a question and answer session and then closing remarks. Independent Bank Corporation reported first quarter 2026 net income of $16.9 million or 81 cents per diluted share versus net income of fifteen point six million dollars or seven seventy four cents per diluted share in the prior year period highlights for our first quarter quarter include a net interest margin of three point six five percent which is a three basis point increase from on a linked quarter basis an increase in net interest income of five hundred thousand dollars or one point one percent over the fourth quarter of 2025. An increase in tangible common equity per share of common stock at 33 cents or 5.9% annualized from December 31, 2025. A return on average assets and return on average equity of 1.24% and 13.43% respectively. Net growth in total deposits, less brokered time deposits of $80.4 million or 6.9% annualized from December 31, 2025. Net growth in loans of $31.8 million or 3% annualized from December 31, 2025. An increase in tangible common equity ratio to 8.7 percent and finally the payment of a 28 cent per shared quarterly dividend on our common stock on February 13th of 2026 our first quarter results reflect the strength of our core fundamentals including growth in that interest income expansion in that interest margin continued growth in both loans and core deposits our balance sheet growth remained disciplined with 80.4 million in core deposit growth and just under $32 million in total loan growth, including $53.8 million or 9.9% annualized in commercial loans, reflecting continued execution of our strategic plan. Credit quality remains sound while geopolitical uncertainty has increased. We have not seen a direct impact on our customers yet, and we continue to monitor conditions closely. Profitability remains strong, again, with a return on average assets of 1.24% and return on average equity of 13.43%. We remain encouraged by our momentum and are optimistic about our opportunities and confident in the benefits of our recently announced merger with HCB Financial Corp., which will provide enhanced shareholder value. Moving to page 5 of our presentation, deposits totaled $4.9 billion at March 31, 2026, an increase of $80.4 million from year end. This growth occurred in non-interest-bearing, saving and interest-bearing checking, and reciprocal, offset by a small decline in time deposits. On a linked quarter basis, business deposits increased by $94 million. Retail deposits increased by $28 million. These were offset by a $42 million decrease in municipal deposits, primarily due to seasonality. The deposit basis comprised of 47% retail, 38% commercial, and 15% municipal. On page six, we've included in our presentation a historical view of cost of funds as compared to the Fed fund spot rate and Fed effective rate. For the first quarter, our total cost of funds decreased by 13 basis points to 1.54%. At this time, I'd like to turn the presentation over to Joel Ron to share a few comments on the success we're having in growing our loan portfolios, as well as a brief update on our credit metrics.
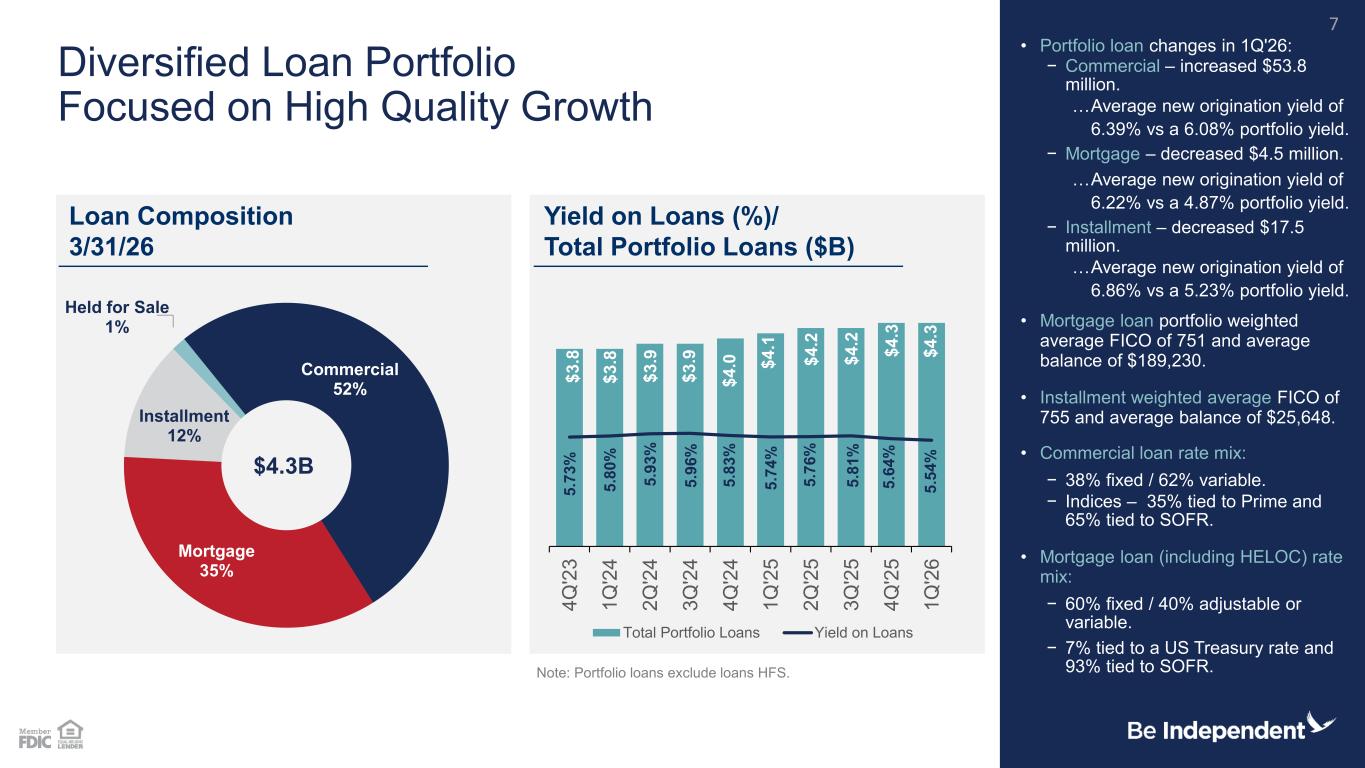
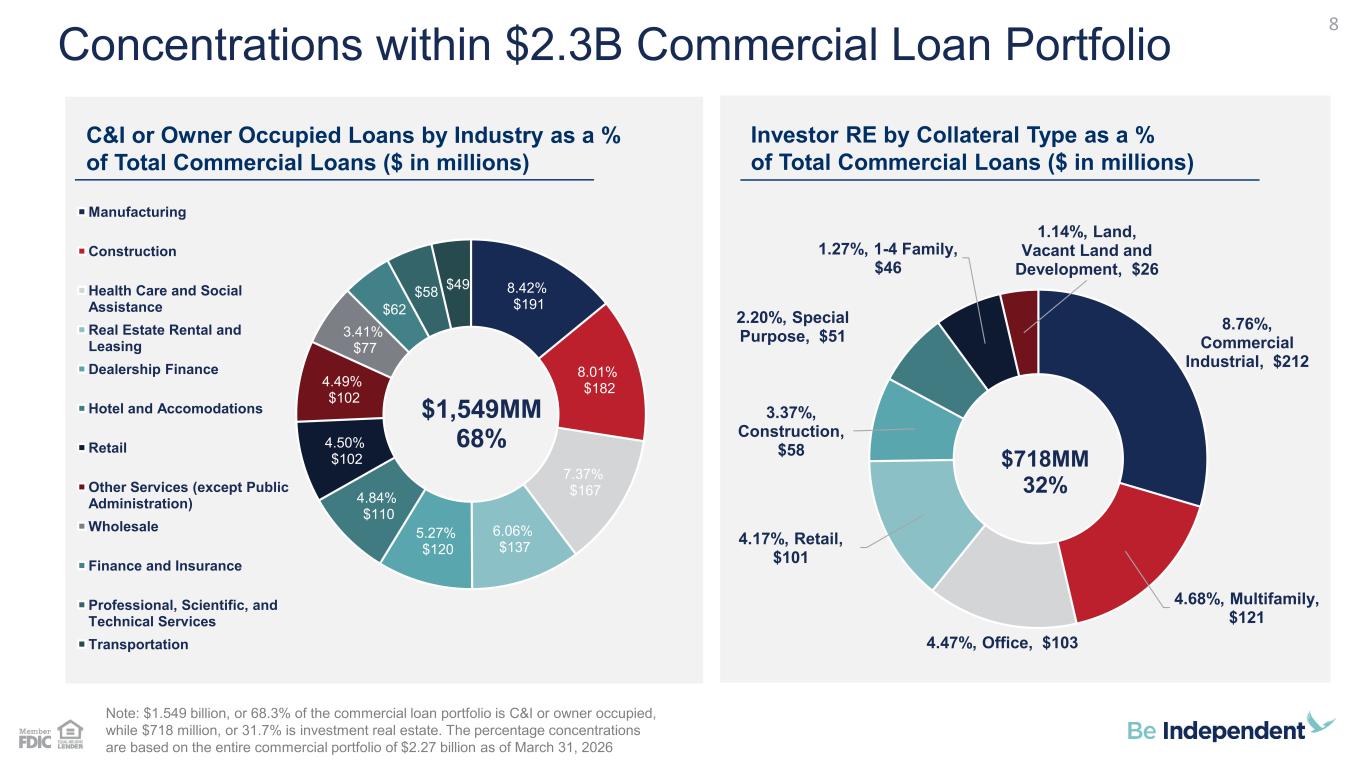
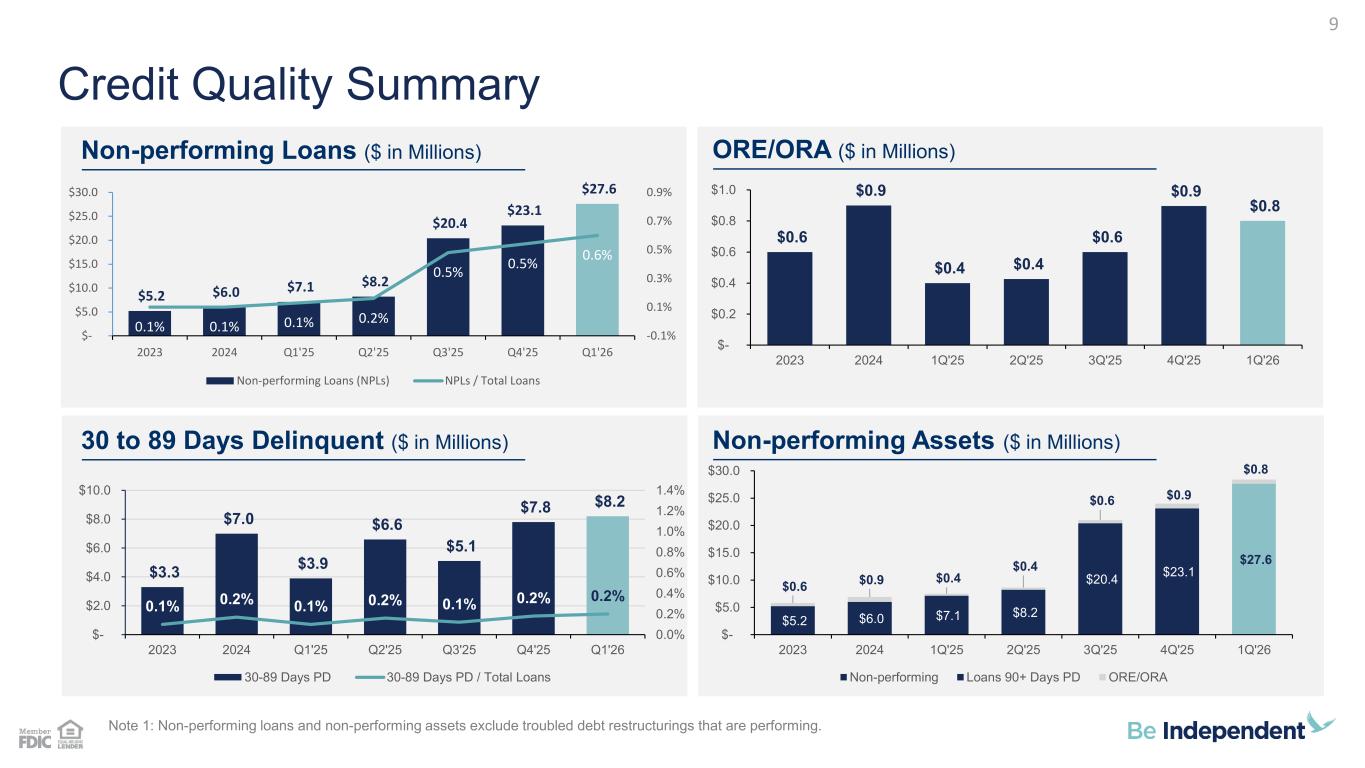
Yeah, well, thank you, Brad, and good morning, everyone. On page seven, we share an update on loan activity for the quarter. We started the year with loan growth of $32 million, or 3% on an annualized basis. Commercial loan generation was solid, with approximately $54 million of quarterly growth, or 9.9% annualized. During the quarter, our residential mortgage and consumer installment loan portfolios declined by $4.5 million and $17.5 million, respectively. Our strategic investment in commercial banking talent continues to supplement our loan growth. During the first quarter, we added two experienced commercial bankers in West Michigan, bringing our total to 50 bankers, comprising eight commercial loan teams across our statewide footprint. Compared to a year ago, we've added a net of five experienced commercial bankers to our team. Looking ahead, based on a strong pipeline, we believe we will continue low double-digit growth of our commercial loan portfolio in 2026. We continue to see market share opportunities from regional banks in both talent and customer acquisition and are seeing steady organic growth from existing customers. Looking at the commercial loan production activity for the quarter, the mix of C&I lending versus investment real estate was 57% and 43% respectively. And for our commercial portfolio, our mix is 68% C&I and 32% investment real estate. Page 8 provides detail on our commercial loan portfolio concentrations. There's not been any significant shift in our portfolio over the past year, with the portfolio remaining very well diversified. Our largest segment of the CNI category is manufacturing at $191 million, or 8.4% of the total portfolio. In the investment real estate segment of the portfolio, the largest concentration is industrial at $212 million, or 8.8%. We outlined key credit quality metrics and trends on page 9. We continue to demonstrate strong credit quality. Total non-performing loans were 27.5 million, or 64 basis points, of total loans at quarter end, up slightly from 54 basis points at 1231. It's worth noting that $20 million of this total is one commercial development exposure that we discussed in previous quarters. We continue to work through the challenges of this particular project and are appropriately reserved for any loss exposure. Past due loans totaled 8.2 million, or 19 basis points, basically unchanged, from 12-31-25. It's worth noting that 4 million of total delinquency was one commercial loan that was in process of renewal and was completed after quarter end. It's not reflected on this slide, but also worth noting that we realized net charge-offs of 266,000, or two basis points of average loans for the quarter. This compares to $68,000 or one basis point in Q1 of 2025. At this time, I'd like to turn the presentation over to Gavin for his comments, including the outlook for the remainder of 2026.
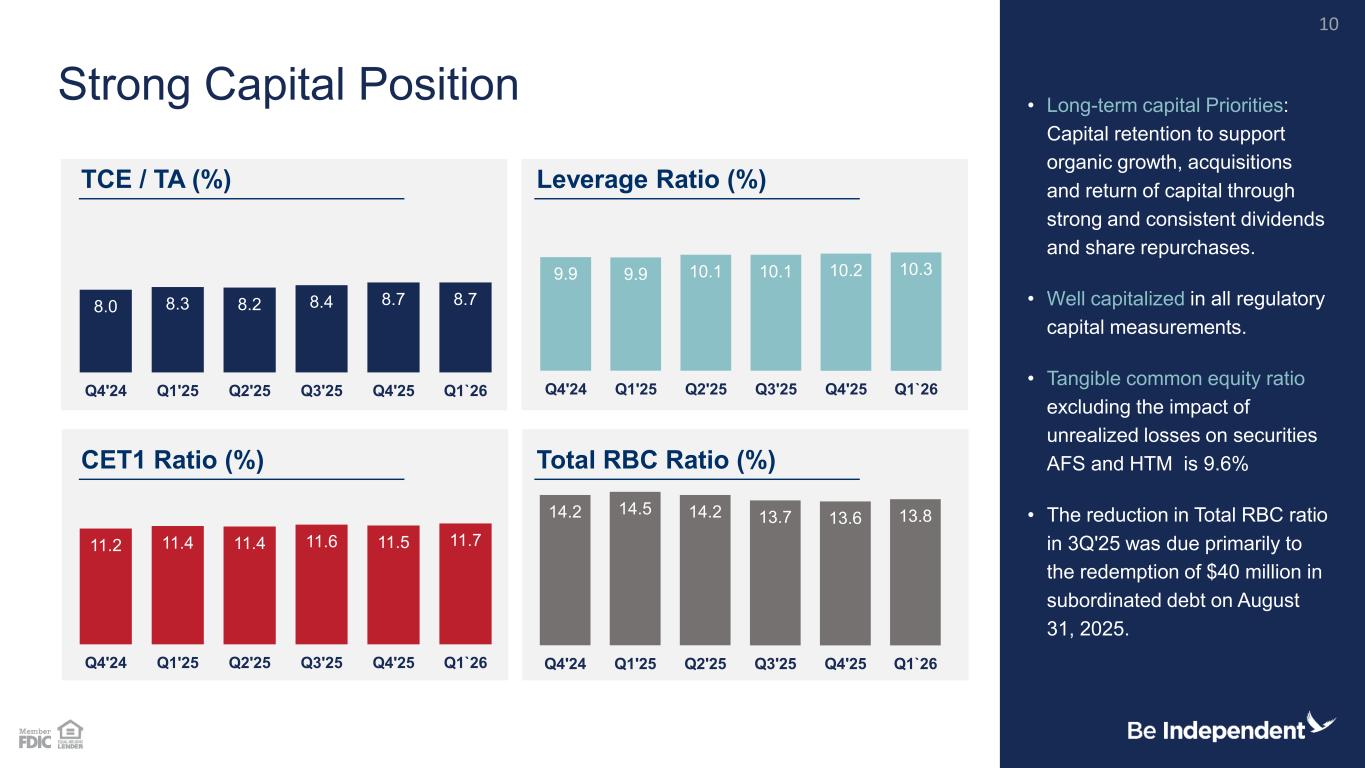
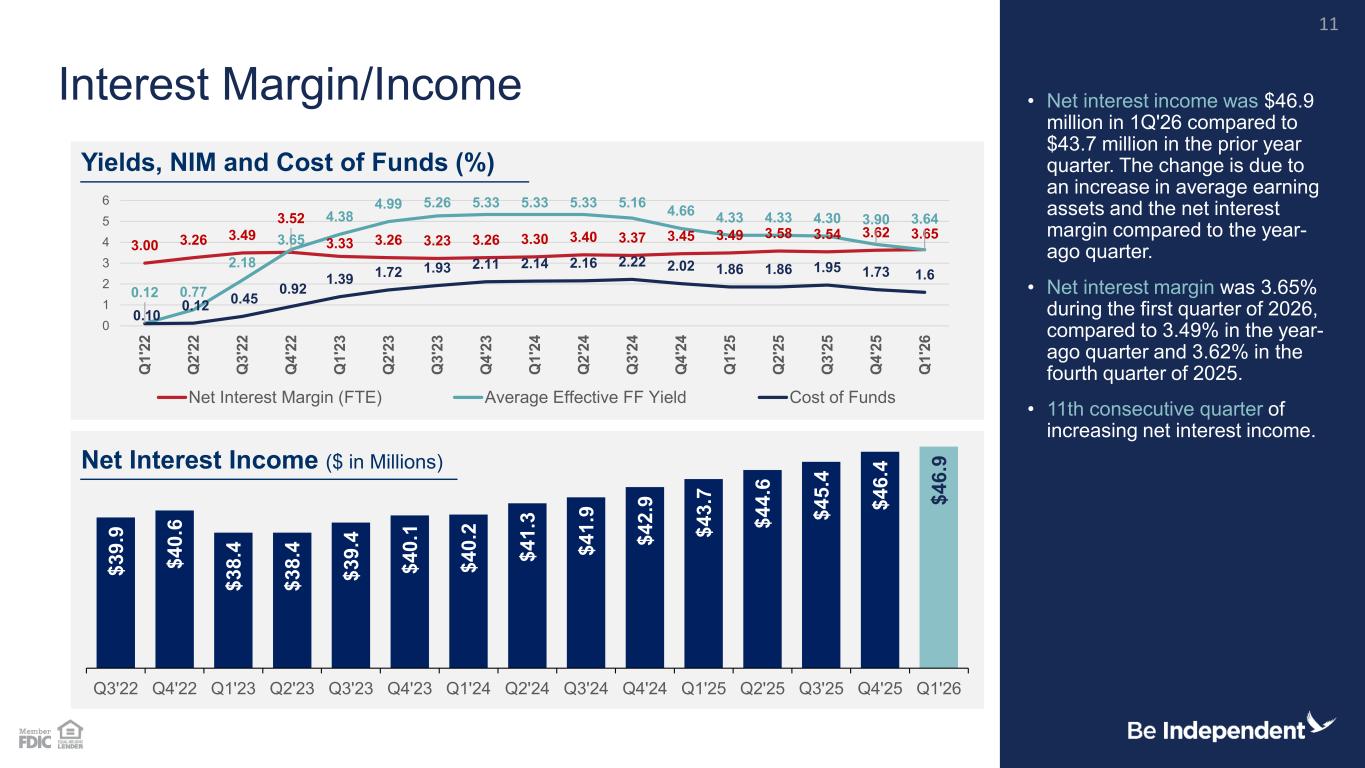
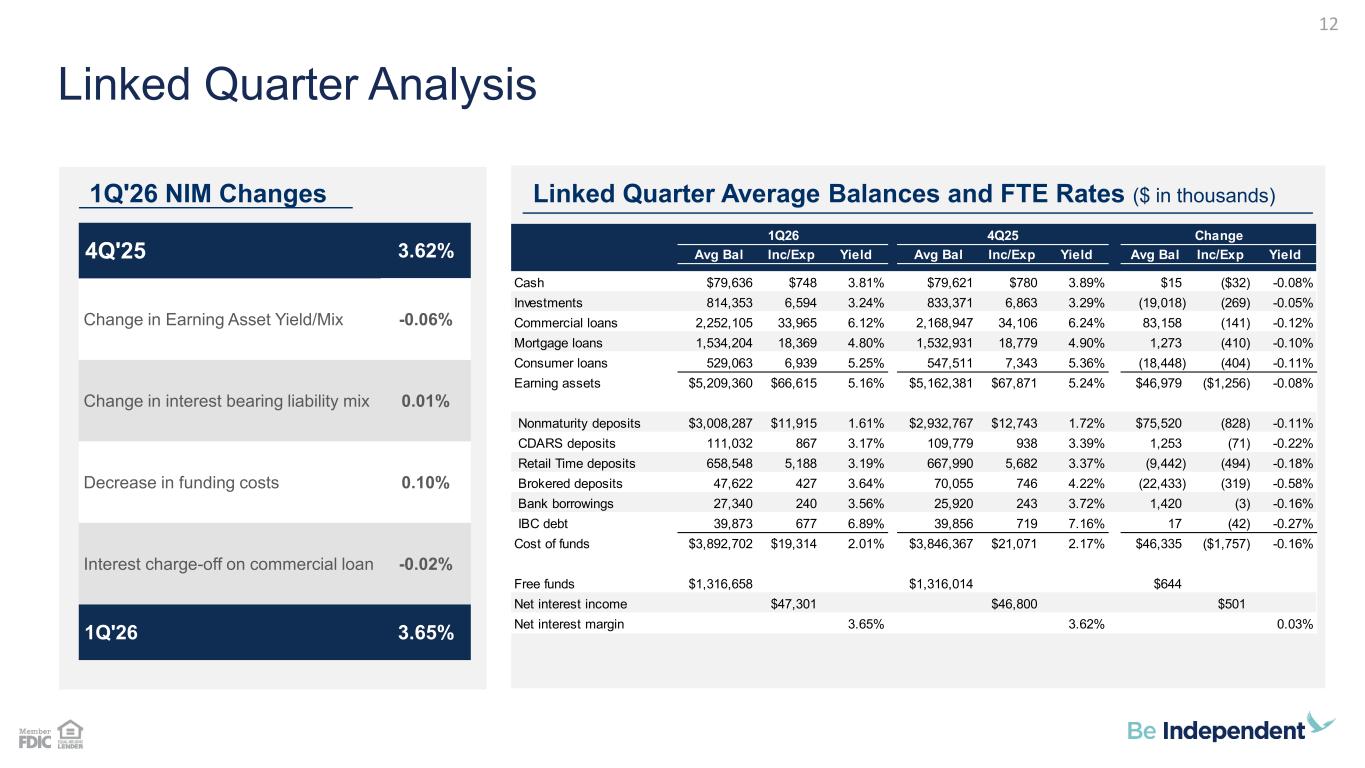
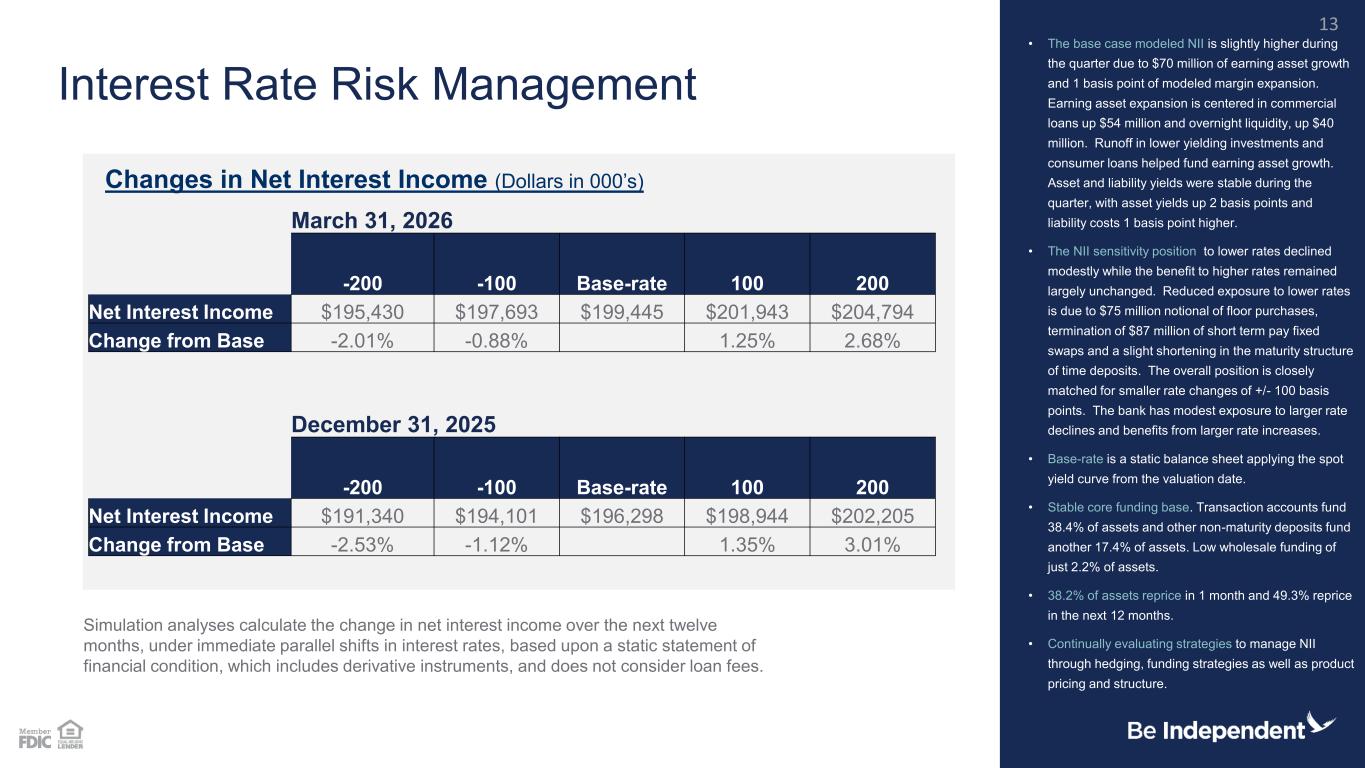
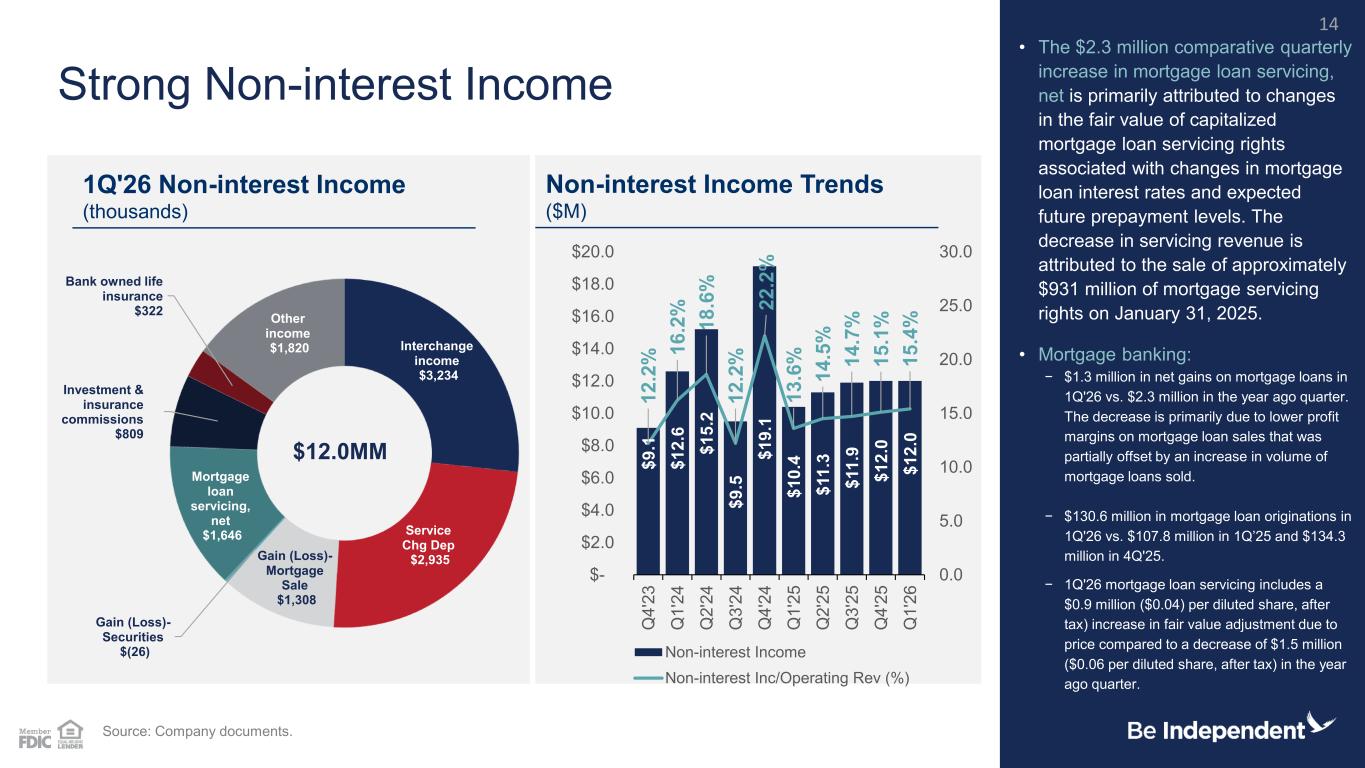
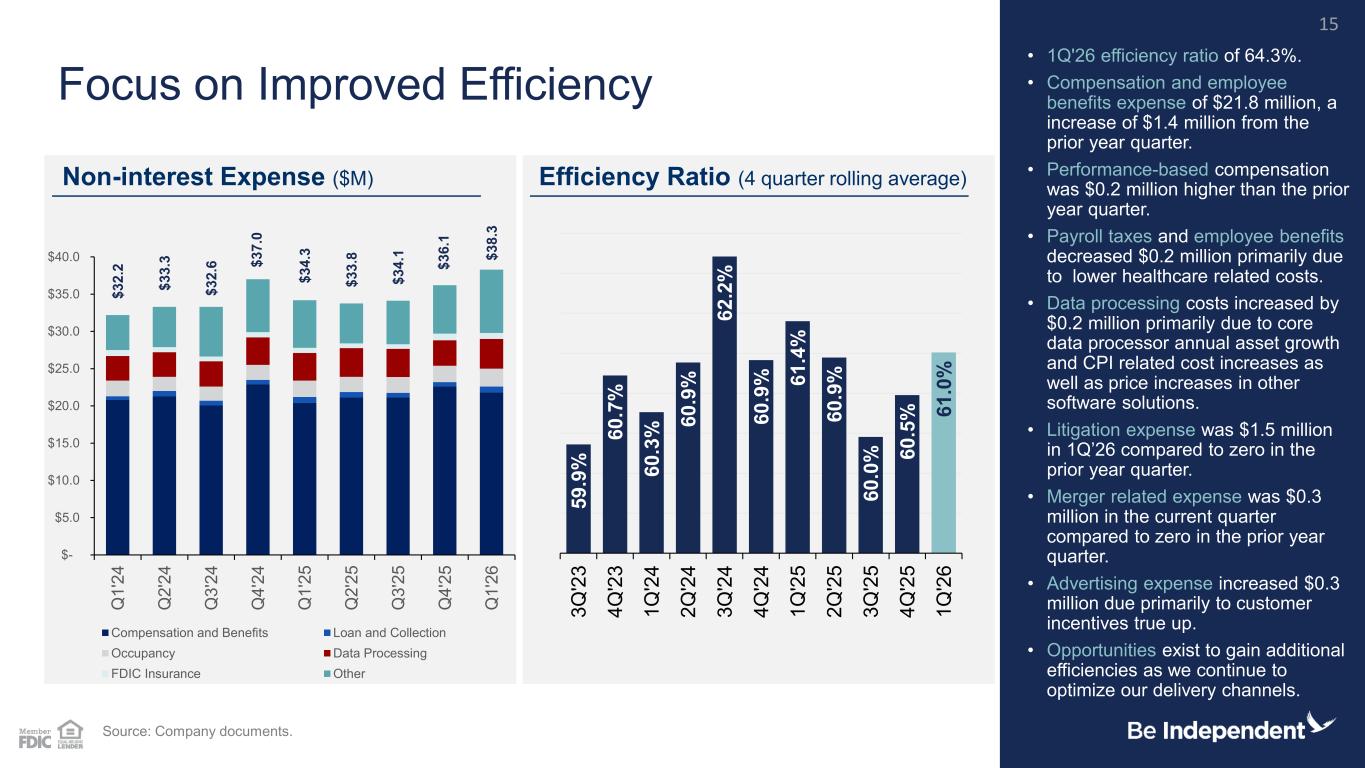
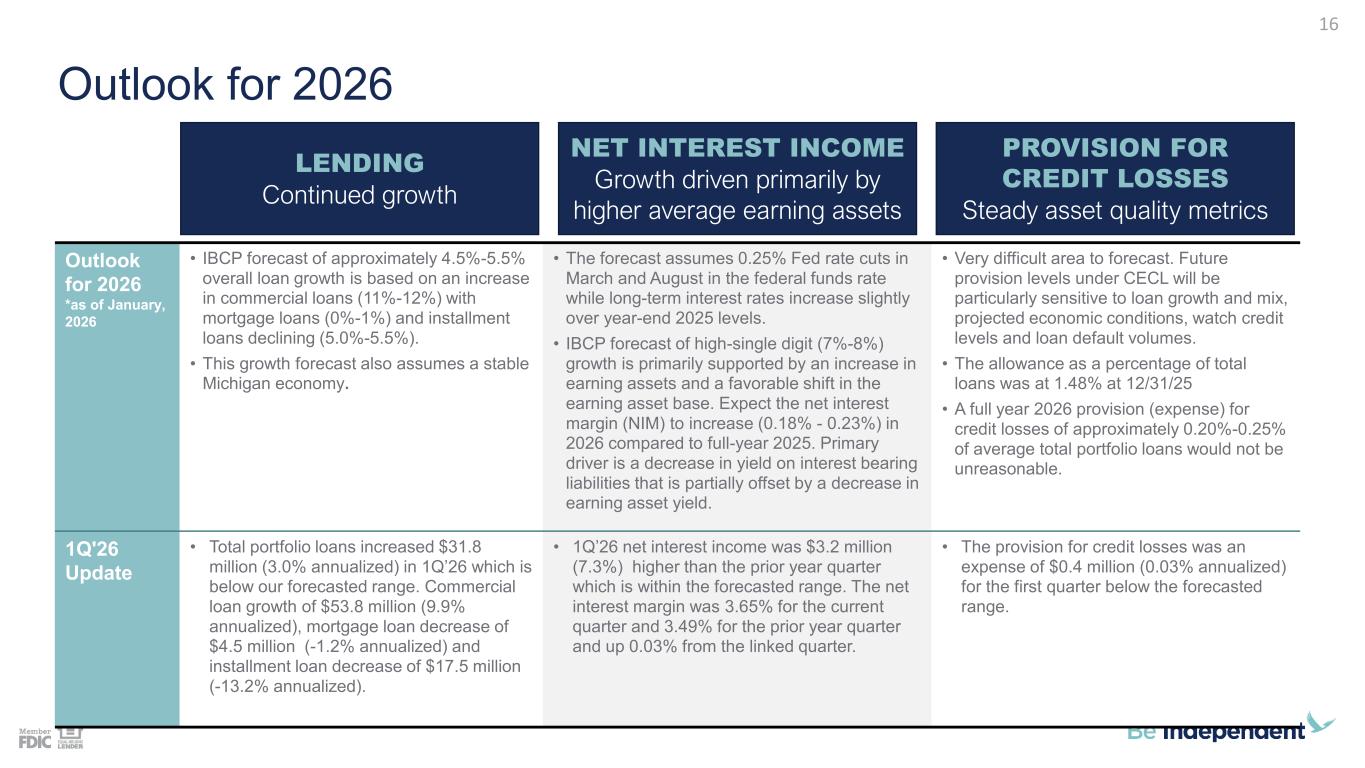
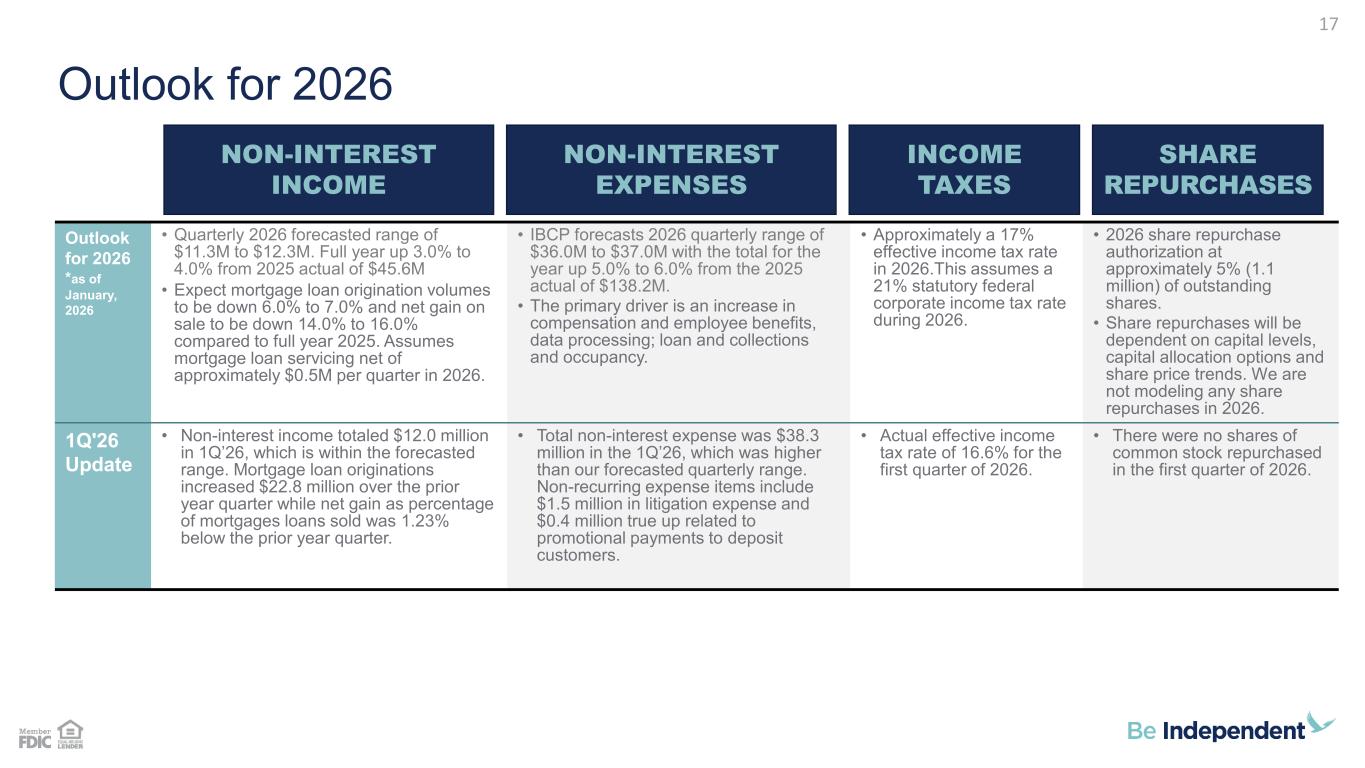
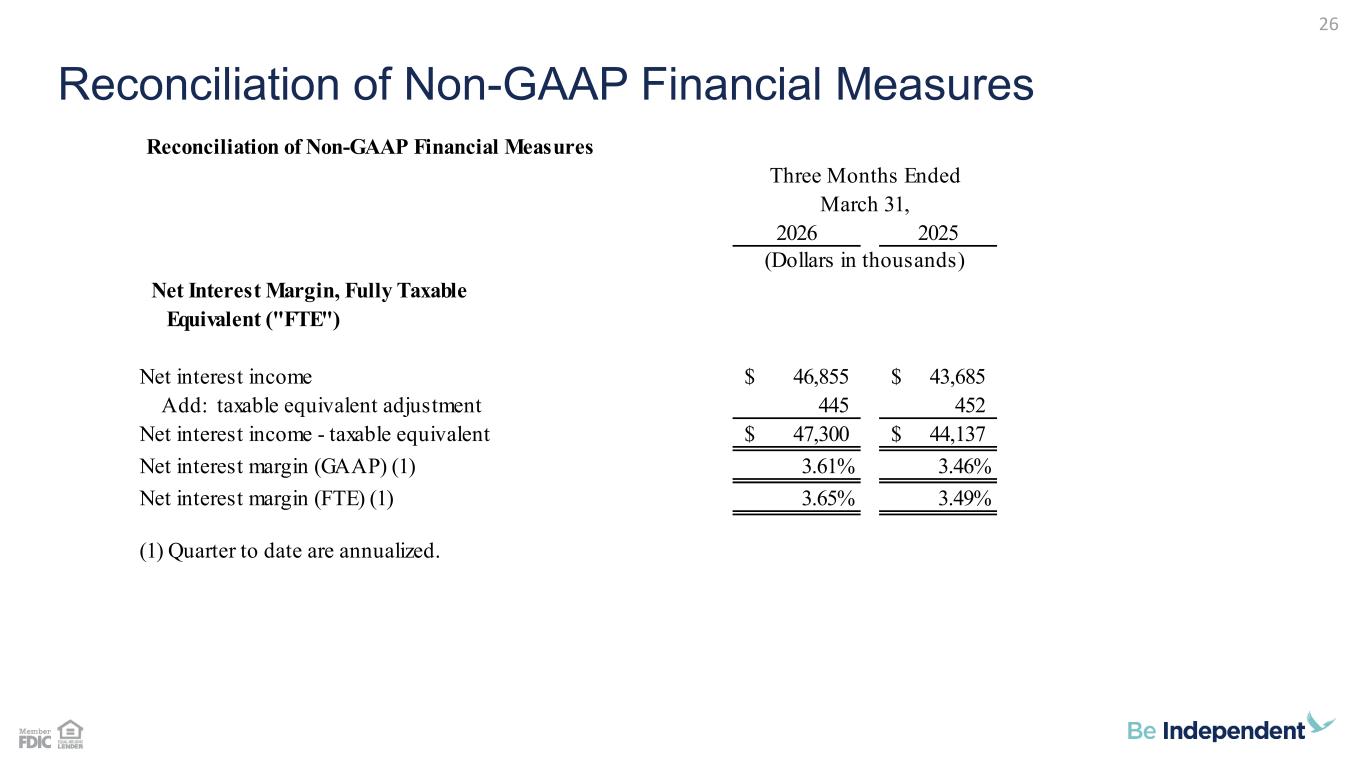
Thanks, Joel, and good morning, everyone. I'm starting at page 10 of our presentation. Page 10 highlights our strong regulatory capital position. Turning to page 11, net interest income increased $3.2 million from the year-ago period. Our tax equivalent net interest margin was 3.65% during the first quarter of 2026, compared to 3.49% in the first quarter of 2025, and up three basis points from the fourth quarter of 2025. Average interest earning assets were $5.21 billion in the first quarter of 2026, compared to $5.09 billion in the year-ago quarter, and $5.16 billion in the fourth quarter of 2025. Page 12 contains a more detailed analysis of the linked quarter increase in net interest income and the net interest margin. On a linked quarter basis, our first quarter 2026 net interest margin was positively impacted by two factors. The change in interest bearing liability mix added one basis point and a decrease in funding cost added 10 basis points. These were offset by a change in earning asset mix and yield of six basis points and interest charged off on a commercial loan of two basis points. On page 13, we provide details on the institution's interest rate risk position. The comparative simulation analysis for first quarter 2026 and fourth quarter 2025 calculates the change in net interest income over the next 12 months under five rate scenarios. All scenarios assume a static balance sheet. The base rate scenario applies the spot yield curve from the valuation date. The shock scenarios consider immediate, permanent, and parallel rate changes. The base case modeled NII is slightly higher during the quarter due to $70 million of earning asset growth and one basis point of modeled margin expansion. Earning asset expansion was centered in commercial loans of $54 million and overnight liquidity of $40 million. Runoff and lower yielding investments in consumer loans helped fund earning asset growth. Asset and liability yields were stable during the quarter, with asset yields up two basis points, and liability costs one basis point higher. The NII sensitivity to lower rates declined modestly, while the benefit to higher rates remained largely unchanged. Reduced exposure to lower rates is due to $75 million of notional floor purchases and the termination of $87 million of short-term pay-fix swaps and a slight shortening in the maturity structure of time deposits. The overall position is closely matched for smaller rate changes of plus or minus 100 basis points. The bank has modest exposure to large rate declines and benefits from larger rate increases. Currently, 38.2% of assets repriced in one month and 49.3% repriced in the next 12 months. Moving on to page 14, non-interest income totaled $12 million in the first quarter of 2026 compared to $10.4 million in the year-ago quarter and $12 million in the fourth quarter of 2025. First quarter of 2026 net gains on mortgage loans sold $1.3 million compared to $2.3 million in the first quarter of 2025. The decrease is due to lower profit margins. It was partially offset by a higher volume of loan sales. Mortgage loan servicing net was a gain of $1.6 million in the first quarter of 2026 compared to a loss of $0.6 million in the prior year quarter. The change due to price was a gain of $0.9 million or $0.04 per diluted share after tax in the first quarter of 2026 compared to a loss of $1.5 million or $0.06 per diluted share after tax in the prior year quarter. The decline in servicing revenue compared to the prior year quarter is attributed to the sale of approximately $930 million of mortgage servicing rights on January 31st, 2025. As detailed on page 15, our non-interest expense totaled $38.3 million in the first quarter of 2026, as compared to $34.3 million in the year-ago quarter and $36.1 million in the fourth quarter of 2025. Compensation expense increased $1.4 million, primarily due to salary increases that were predominantly effective on January 1, 2026. Litigation expense is $1.5 million in the quarter attributed to an accrual established for losses we consider probable as a result of all of our outstanding litigation matters in aggregate. Advertising expense increased $0.3 million in the first quarter of 2026 compared to prior year quarter, primarily due to retroactive new deposit account opening incentives attributed to accounts opened in prior periods. We recorded merger related expenses of $0.3 million in the first quarter of 2026. Non-reoccurring non-interest expense items totaled approximately $1.9 million in the first quarter of 2026. Turning to page 16 is our update for our 2026 outlook to see how our actual performance during the first quarter compared to the original outlook that we provided in January of this year. Our outlook estimated full-year loan growth of 4.5% to 5.5%. Loans increased $31.8 million in the first quarter of 2026, or 3% annualized, which is below our forecasted range. Commercial loans increased $53.8 million in the first quarter, while mortgage and installment loans decreased. First quarter, 2026, net interest income increased 7.3% over 2025, which is within our forecasted range of 7% to 8%. The net interest margin was 3.65% for the quarter and 3.49% for the prior year quarter and up three basis points from our late quarter basis. The first quarter of 2026 provision for credit losses was at an expense of $0.4 million, which was below our forecasted range. Moving on to page 17, non-interest income totaled $12 million in the first quarter of 2026, which was within our forecasted range of $11.3 million to $12.3 million in the first quarter. First quarter 26 mortgage loan origination sales and gains totaled $130.6 million, $84.1 million, and $1.3 million, respectively. Mortgage loan servicing that generated a gain of $1.6 million in the first quarter 26, which is above our forecasted range. Non-interest expense was $38.3 million in the first quarter, above our forecasted range of $36 to $37 million. Non-recurrent expense items included $1.5 million accrual and litigation expense and $0.4 million in retroactive new-to-deposit account opening incentives attributed to accounts open in prior periods. Our effective income tax rate was 16.6% for the first quarter of 2026. Lastly, there were no shares of common stock repurchased in the first quarter of 2026. That concludes my prepared remarks. I would now like to turn the call back over to Brad.
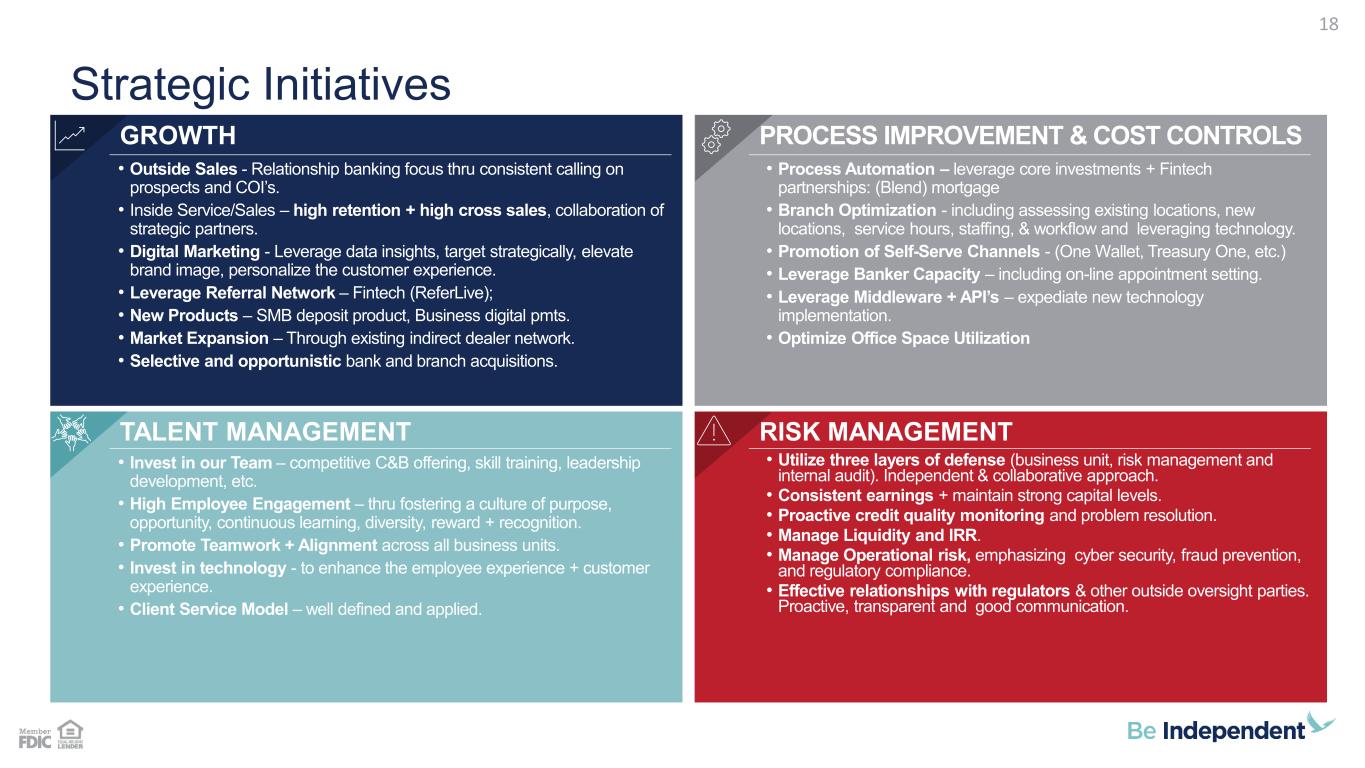
Thanks, Gavin. We've built a strong community bank franchise, which positions us well to effectively manage through a variety of economic environments and continue delivering strong and consistent results for our shareholders. As we move through 2026, our focus will be continuing to invest in our team, investing in and leveraging our technology, while striving to be Michigan's most people-focused bank. At this point, we'd now like to open up the call for questions.
Operator
Thank you. As a reminder, to ask a question, please press star 11 on your telephone and wait for your name to be announced. To withdraw your question, please press star 11 again. one moment while we compile our Q&A roster. Our first question is going to come from the line of Brandon Nozzle with Hovde Group. Your line is open. Please go ahead.
Hey, good morning, everybody. Hope you're doing well.
Maybe just starting off here on the net interest margin, I think when you offered your initial margin outlook for 26 a couple of months back, you embedded two rate cuts in that outlook. Just kind of curious if we don't get any rate cuts over the course of this year. does that change the the margin calculus um versus your initial outlook one way or the other not but not uh measurably brandon that that uh forecast holds okay great um maybe you know digging deeper on the the deposit cost side of things um just kind of curiously what the competitive environment for core funding is like across your markets and and i'm asking because i'm getting very different answers to this question um based on you know market to market across the midwest So I would love to hear what you're seeing across Michigan.
Well, Brendan, I think it continues to be very competitive in the Michigan markets. You know, we've got a heavy field of credit unions, so I think oftentimes they can lead the pack. But I think it oftentimes depends if you look at each competitor and sort of their balance sheet profile, you can sort of see who's maybe fighting a little bit harder with higher pricing than others. You know, our focus continues to be, you know, led by that commercial effort and, you know, our goal is to have the operating accounts for our business clients and then also for our municipal clients. And we continue to hold, retain, but add to that portfolio. And so I'm really pleased with that. But it is competitive, no doubt.
Okay, good. I'm going to try and sneak one more in here. You know, the world has changed geopolitically quite a lot over the past three months, and there could be knock-on impacts to the domestic economy. So I guess, you know, when you look at the outlook you provided for 2026, Are there any areas where you're feeling either better or worse today versus, you know, when we last spoke three months ago?
You know, I think, and I'll let Joel jump in here too, but I think we continue to be very optimistic about how we expect 2026 to unfold. One of the things that we do at Independent is rescore the entire retail portfolio for their credit scores twice a year. And we recently got the results from that rescore. And I continue to be very pleased in seeing, you know, very solid scores for the portfolio. Not a lot of change in the various bands. You know, of course, we land predominantly up in that, you know, 750-plus FICO area, you know, at least north of 700, and those bands continue to be strong. So I'll let Joel maybe comment a little bit on the commercial side.
Yeah, it just so much is dependent on how long the conflict lasts and what it does to prolong high energy prices. And it's probably the same thing I said maybe a quarter ago. It's just, yeah, the duration of this, the high energy prices, could be a drag on the economy, and to state the obvious. And if that happens, you could see loan growth muted, I suppose. But we've not seen that yet. And business owner confidence is still unchanged, relatively high. So we have businesses that are making the decision to expand and construct new facilities, et cetera, despite the news headlines of the day. So only time will tell if that's a smart move on their part or not. But it's just such a fluid environment, Brandon. So we're just watching it carefully, and we'll react accordingly.
Yeah, okay, perfect. Thanks for the thoughtful commentary.
Operator
Thank you, and one moment for our next question. Our next question is going to come from the line of Adam Kroll with Piper Sandler. Your line is open. Please go ahead.
Hi, good morning. I'm on for Mayrace, and thanks for taking my questions. Good morning. yeah so maybe a question on expenses you know i know there were some one-time items that kind of drove them higher in the first quarter but if i strip those out i get to core number around 36.4 million so i guess do you still feel comfortable with the the 36 to 37 million run rate guide excluding the deal or do you expect those to trend higher no no we feel good about that excluding the deal and the non-recurring. Got it. And then, you know, how should we think about the cadence of cost saves associated with the deal?
Yeah, so it was announced 50% phased in in year one and fully phased in in year two.
And just to point out, that's 50% of half a year. got it um and maybe a last one for me is just um gavin was wondering if you could uh provide us with some updated dots on you know how you're thinking about deploying some of the excess liquidity brought over from the hcb deal yeah i'm we're not gonna we're not ready to give direction specifically on that, Adam.
I would say that as we think about how the banks come together, clearly our first choice would be to deploy it through the commercial bank. And then from there, we would just move down asset classes in terms of yield. We're going to have opportunity to address maybe wholesale funding if we don't have a pipeline to absorb it, as well as potential securities purchases. But that's still all very much in the analysis phase.
Got it. Thanks for taking my questions. Thank you.
Operator
Thank you. And as a reminder, if you would like to ask a question, please press star 11 on your telephone. I'm showing no further questions at this time, and I would like to turn the conference back over to Brad Kessel for any further remarks.
In closing, I'd like to thank our board of directors and our senior management for their support and leadership. I also want to thank all of our associates. I continue to be so proud of the job being done by each member of our team. Each team member in his or her own way continues to do their part towards our common goal of guiding customers to be independent. Finally, I'd like to thank each of you for your interest in Independent Bank Corporation and for joining us on today's call. Have a great day.
Operator
This concludes today's conference call. Thank you for participating and you may now just connect. Everyone have a great day.