Operator
Good day, everyone, and welcome to the I3 Verticals First Quarter 2026 Earnings Conference Call. Today's call is being recorded, and a replay will be available starting today through February 13th. The number for the replay is 855-669-9658, and the code is 6769-466. The replay may be accessed for 30 days at the company's website. At this time, for opening remarks, I would like to turn the call over to Clay Whitson, Chief Strategy Officer. Please go ahead, sir.
Good morning, and welcome to the first quarter of 2026 conference call for I-3 Verticals. Joining me on this call are Greg Daly, our Chairman and CEO, Rick Stanford, our President, Jeff Smith, our Chief Financial Officer, and Paul Christians, our Chief Revenue Officer. To the extent any non-GAAP financial measure is discussed in today's call, you will also find a reconciliation to the most directly comparable GAAP financial measure by reviewing yesterday's earnings release. It is a company's intent to provide non-GAAP financial information to enhance understanding of its consolidated GAAP financial information. This non-GAAP financial information should be considered by each individual in addition to, but not instead of, the GAAP financial statements. This conference call may contain forward-looking statements within the meaning of the Private Securities Litigation Reform Act of 1995, including statements, among others, regarding the company's expected financial and operating performance. For this purpose, any statements made during this call that are not statements of historical fact may be deemed to be forward-looking statements. You are hereby cautioned that these forward-looking statements may be affected by the important factors, among others, set forth in the company's earnings release and in reports that are filed or furnished to the SEC. Consequently, actual operations and results may differ materially from those discussed in the forward-looking statements. Finally, the information shared on this call is valid as of today's date, and the company undertakes no obligation to update it, except as may be required by applicable law. I will now turn the call over to the company's Chairman and CEO, Greg Daly.
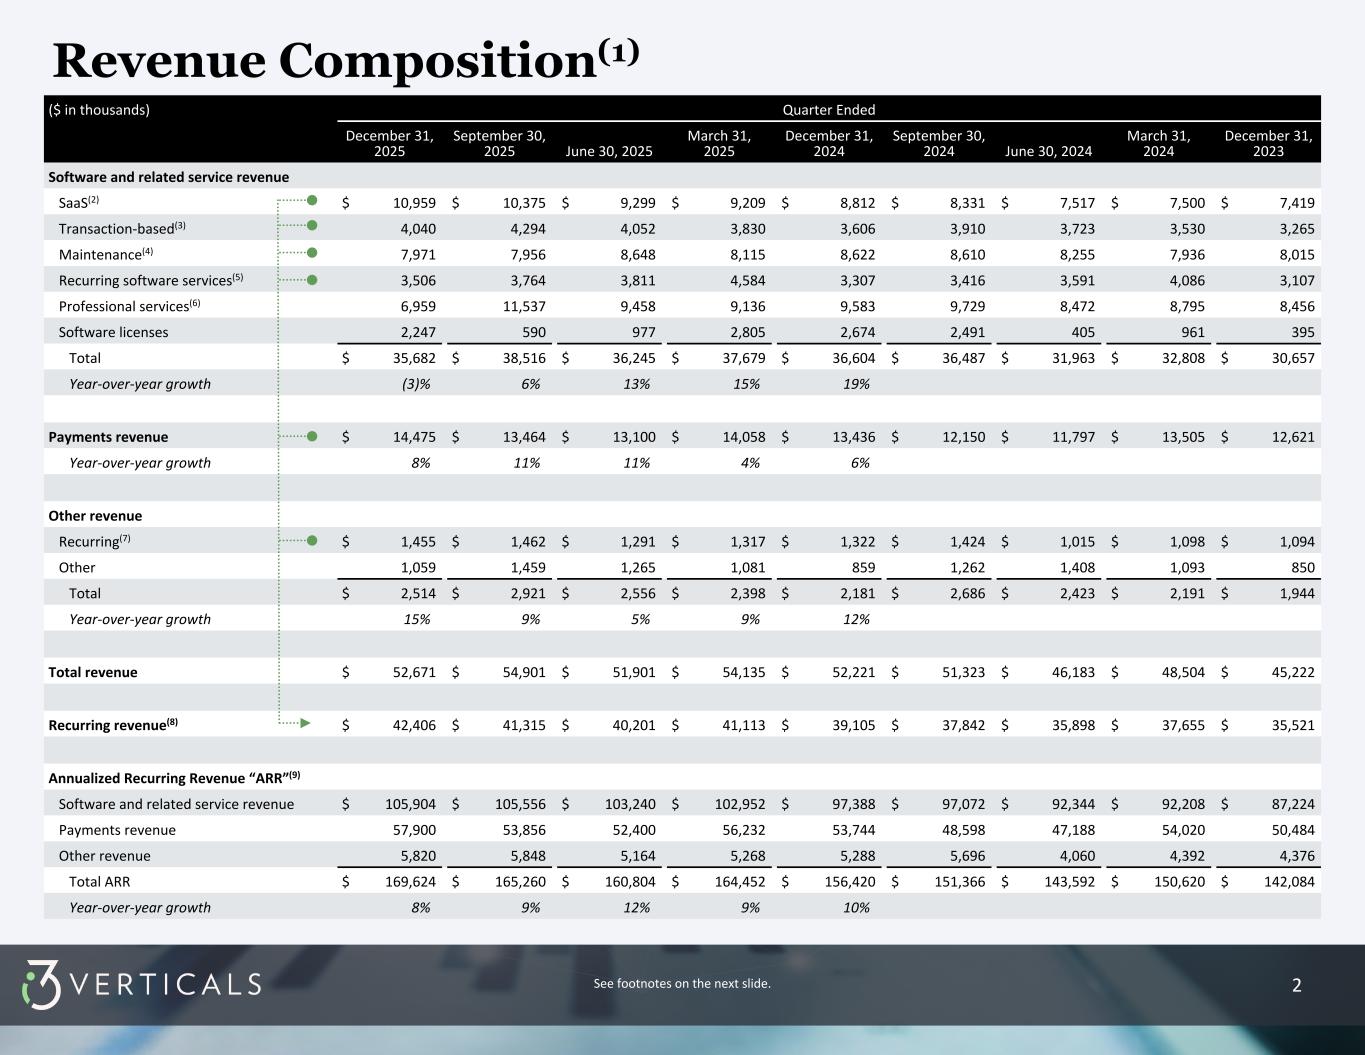
Thanks, Clay, and good morning to all of you on the call. We're excited with the start of 2026. As we anticipated and guided the market, revenue was only up 1% over prior years Q1. The recurring revenue was up over 8%, more closely reflecting our expectation of long-term growth. SAS revenue led with over 24% growth. we're now we've now had four quarters in a row over 20 percent staff growth and we see that number staying north of that level through the year when our recurring revenue sources professional services and license are both down we believe our focus on recurring sources will carry the day we're very excited to announce our latest acquisition Rick will share more, but this is a deal we're very proud of. Our best deals tend to be the ones we source ourselves, and this is the latest example. It is a perfect fit within our transportation market. You will always be surprised at the durable, sticky, niche software solutions you will find in the public sector. Well, here's another one. Helping states early detect uninsured motorists is only possible because of thoughtful, well-executed software business solutions like this. Because they already have integrations with the insurance carriers, they have an incredible defensive market positioning, and their growth is compelling. The team that built this business is staying on, and we couldn't be more excited about what we can accomplish together. We remain exceptionally well-capitalized and thoughtful about how to deploy our capital and expect to have great opportunities in 2026. As always, the focus is discipline. I will now turn the call over to Jeff, and he will provide more details on financial performance. When he's finished, Rick will address our latest deal in more detail, and finally, Paul will discuss revenue. And then we'll open up the call for questions.
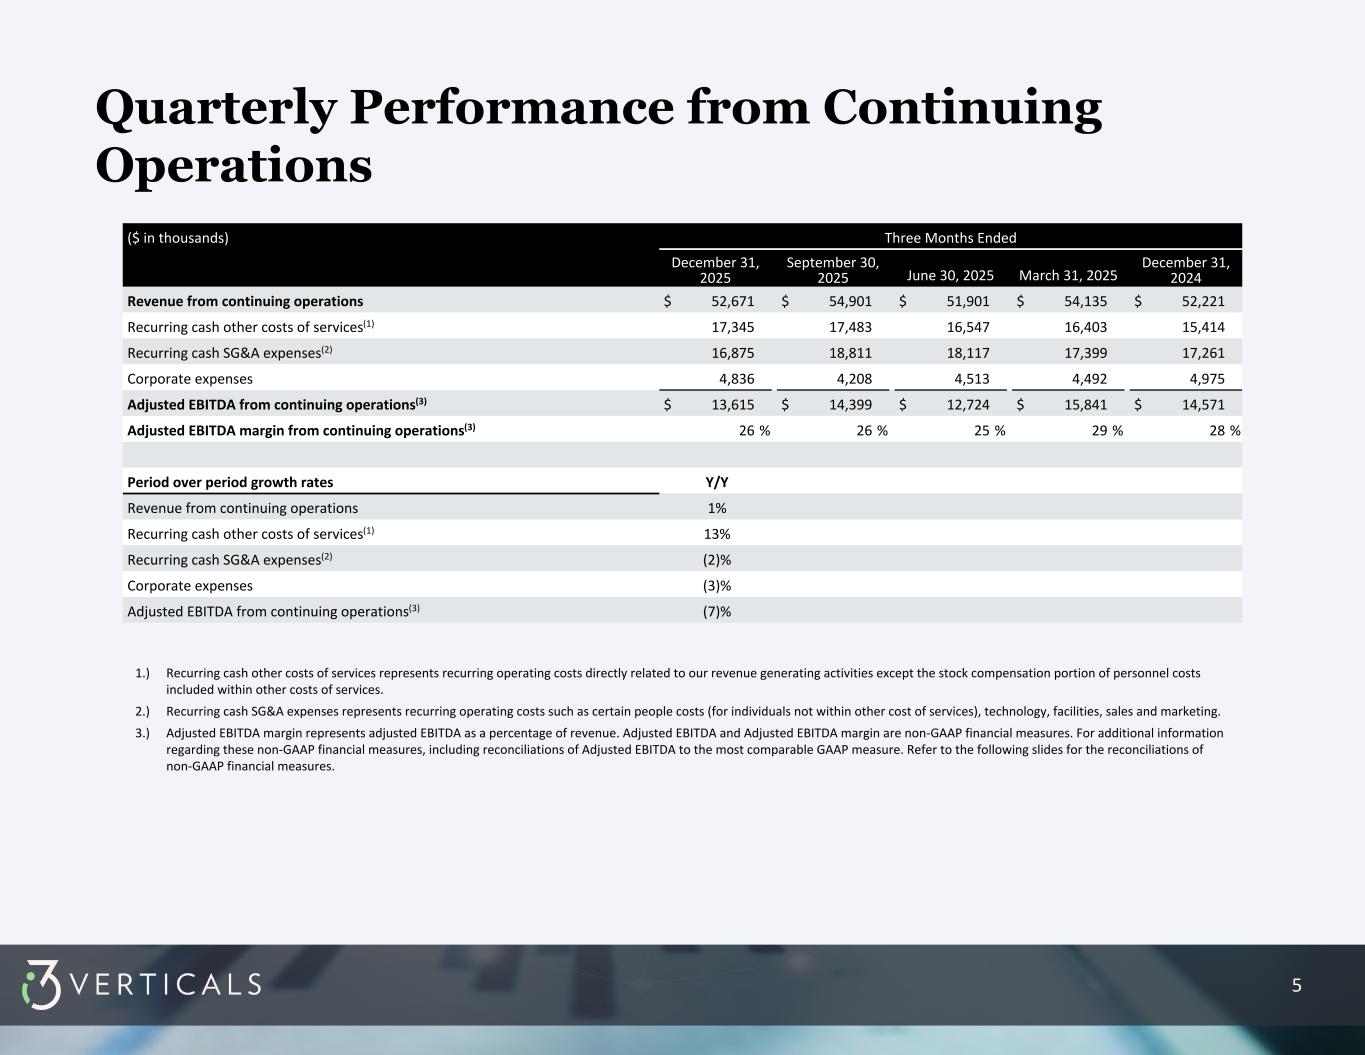
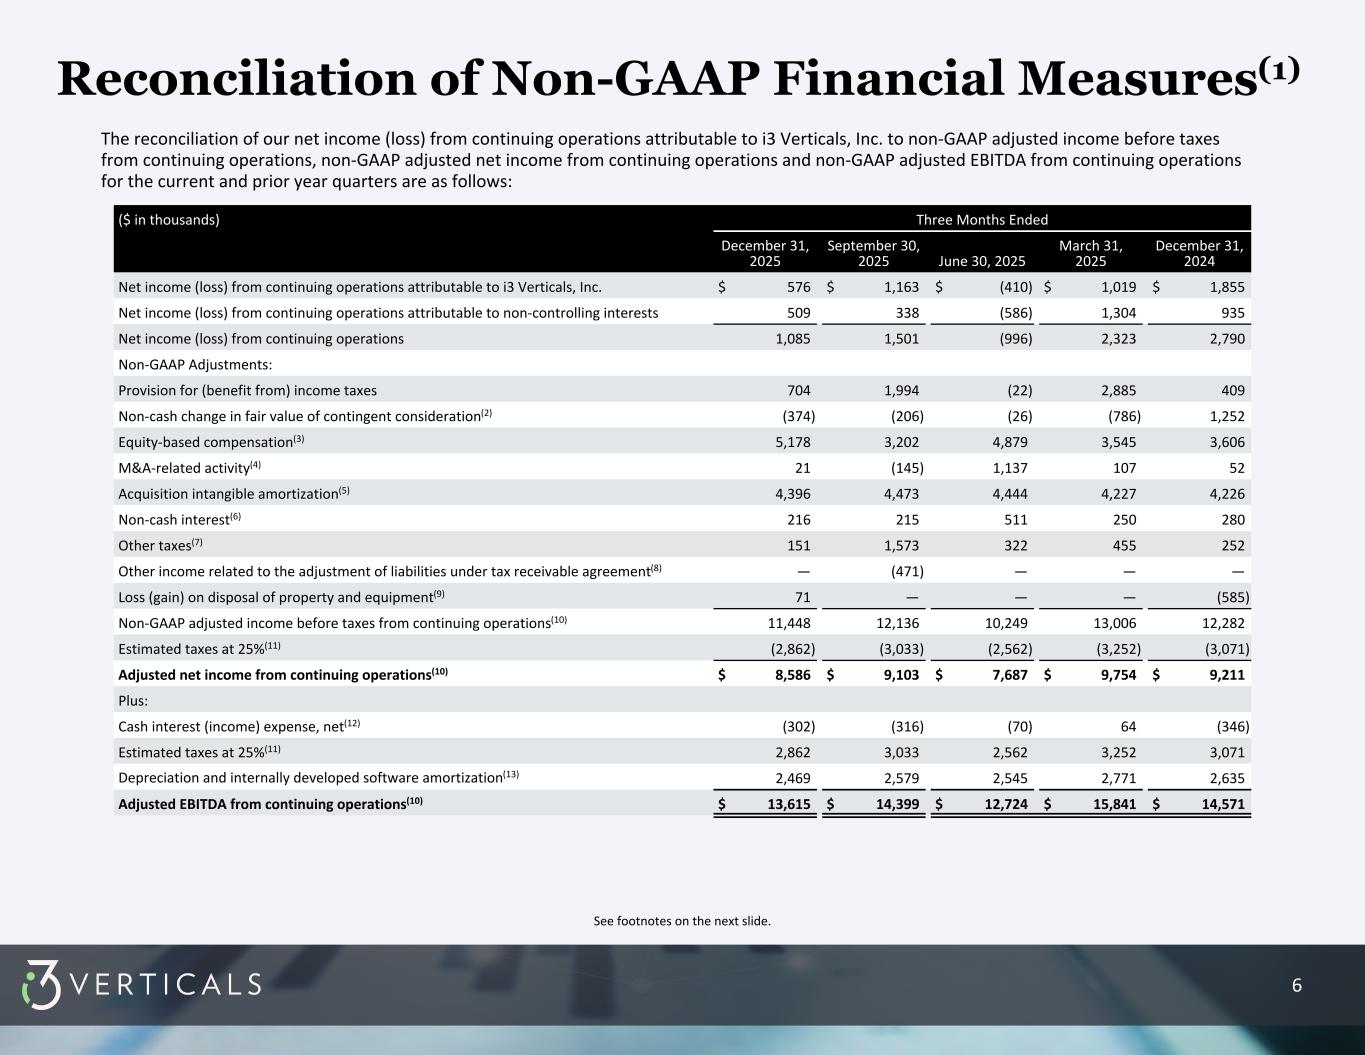
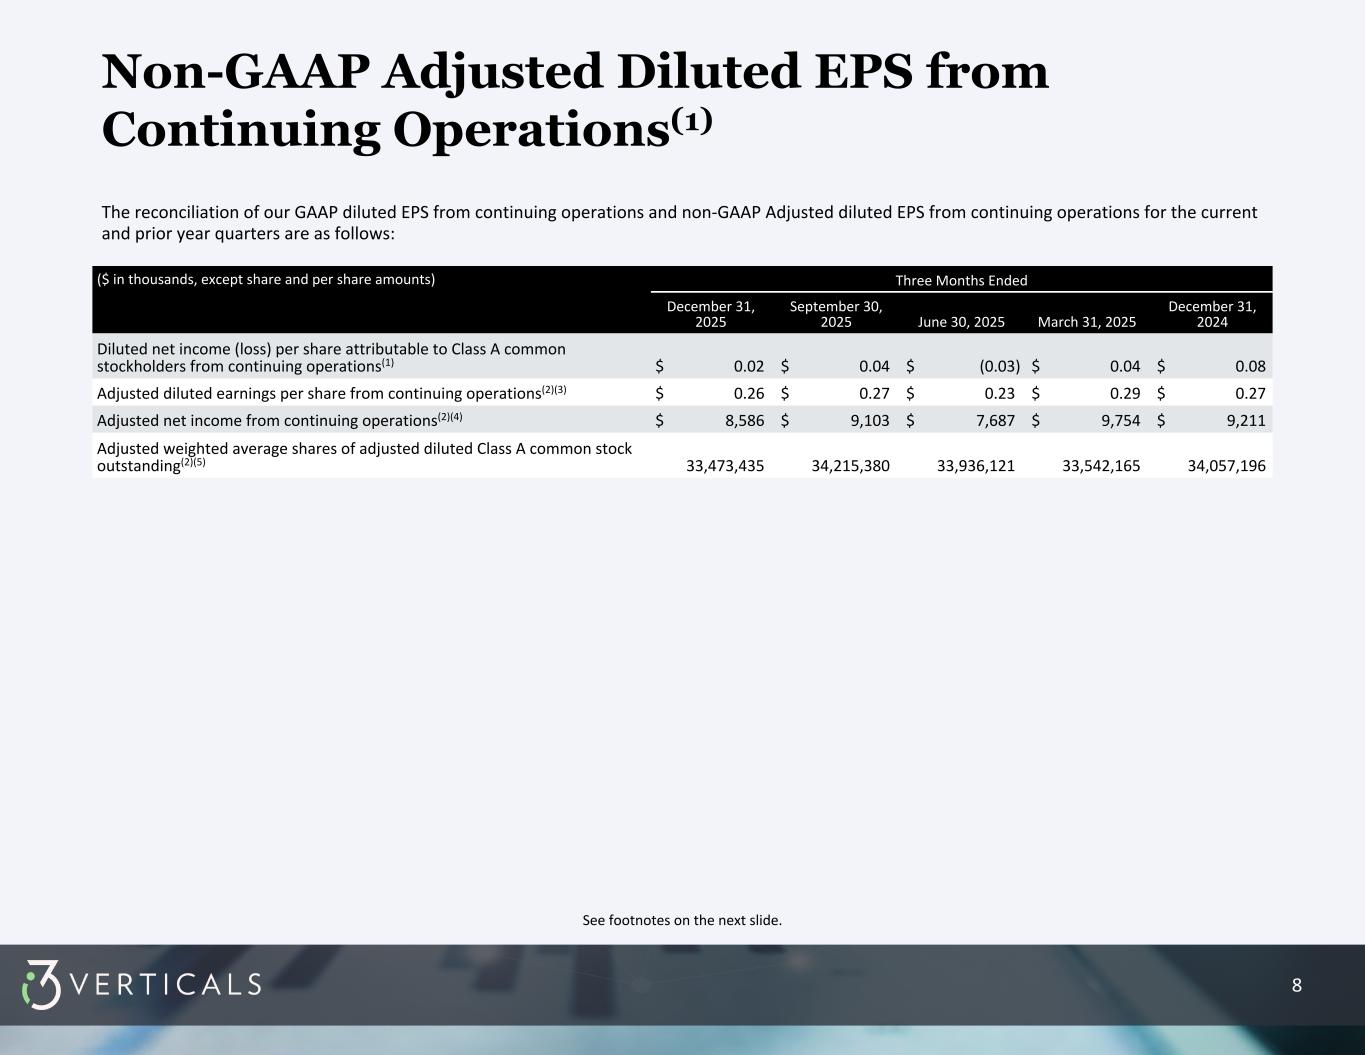
Thanks, Greg. The following pertains to the first quarter of fiscal year 2026, which is the quarter ended December 31, 2025. Please refer to the slide presentation titled Supplemental Information on our website for reference with this discussion. Revenues for the first quarter of fiscal 2026 increased 1%, to $52.7 million, or $52.2 million for Q1 2025. in line with expectations. The growth reflected 8% growth in recurring revenues partially offset by a $3 million decline in non-recurring professional services and software license revenues. Annual recurring revenues increased 8% to $169.6 million for Q1-2026 compared to $156.4 million for Q1 2025. 80% of our revenues for the quarter came from recurring sources driven by SaaS revenue growth of 24%, transaction-based revenue growth of 12%, and payments revenue growth of 8%. Maintenance revenues declined 8%, reflecting the emphasis on SaaS and new sales. Adjusted EBITDA declined $1 million to $13.6 million for Q1-2026 and $14.6 million for Q1-2025, in line with expectations. Adjusted EBITDA as a percentage of revenues was $25.8 for Q1-2026 versus $27.9 for Q1-2025. The dollar and percentage declines were driven by previously mentioned investments in our justice and utility markets, higher hosting costs, and $2.6 million lower professional services revenues. While professional services are not high, the associated costs can follow revenue fluctuations with a lag. We expect the adjusted EBITDA margin to improve for the remainder of the year, and our long-term expectation remains 50 to 100 basis points per year. adjusted diluted earnings per share from continuing operations was 26 cents for q1 2026 again please refer to the press release for a full description and reconciliation our balance sheet is strong and well positioned for the future as of december 31st we had 37 million in cash and no debt as greg mentioned effective january 1st we purchased a provider of software for driver and motor vehicle insurance verification for $60 million in cash. Here's some color to help you incorporate this acquisition into your models. We paid approximately 15 times EBITDA. The company is durably growing at a rate above 20% and has an EBITDA margin of 50%. We still have a $400 million revolving credit facility with a 5x leverage constraint. We intend to use any borrowings for acquisitions and opportunistic stock repurchases. The following sets forth guidance for continuing operations for FY2026. The outlook does not include acquisitions that have not yet closed or transaction-related costs. Revenues, $22.3 to $223 million to $234 million. Adjusted EBITDA, $61 to $66.5 million. Adjusted Duluth's earnings per share, $1.08 to $1.16. We expect recurring revenues to grow at double-digit rate for FY2026, including the acquisition. However, we expect a decline in non-recurring professional service revenue driven by the cadence of revenue recognition on certain projects in our utilities and transportation markets. Despite the lower outlook in those markets for fiscal 2026 and are well-positioned to rebound in fiscal 2027 and beyond. Our long-term expectation for organic revenue growth remains high single-digit. From a seasonality standpoint, software license sales and professional services represent the most variable line items to forecast and can distort seasonality in any given quarter. We currently expect our revenue distribution for FY2026 to approximate the following, Q1 23%, Q2 25%, Q3 25%, Q4 27%. I'll now turn the call over to Rick for comments on M&A.
Thank you, Jeff. Good morning, everyone. As mentioned in last night's earning release, on January 1st, we closed our latest acquisition. This business operates in the transportation market and does business at the state level. The company's insurance verification product is feature-rich, including real-time verification, continuous insurance lapse updates, direct connection with insurance companies, and seamless integration with state motor vehicle systems. The product can accommodate integration with every possible motor vehicle system in use by the states today, including I3s. This transaction will significantly expand our geographic reach in the transportation market, better positioning I3 to be the vendor of choice in ongoing modernization initiatives. Currently, we have the adjacent market for motor carrier software solutions, such as IRP and IFTA tax software and truck riding software. I3 is a major player in the motor carrier and motor vehicle software market, with a combined 30 states and four Canadian provinces. We are thrilled to welcome this talented team to I3 and look forward to their many successes in the future. Relative to our acquisition pipeline, itself is continually filled with some promising opportunities similar to this deal. Again, we remain diligent with regard to the value and strategic impact of potential acquisitions to our growth prospects. I'll now turn the call over to Paul for final comments.
It seems as if Paul's having technical difficulties.
Operator
It seems like Paul's line has dropped here. Okay, that's fine.
I'll take it from here. Thank you. Our focus on refining market offerings, especially in justice tech and transportation markets, is proving to be timely and effective as we continue to see an increased demand for technology that enable decision-making. This shift towards market-based solutions is evident through expanded solution scope within RFPs, increased emphasis on unified data structures to support analytics, and growing expectations for continuous innovation and system evolution. In Justice Tech, we have seen an uptick in opportunities at both the state and local levels as we rolled out our new Court One offering, especially around case management systems and the Court One Jury Solution. These offerings are aligning well with current market demand, allowing us to engage meaningfully in opportunities as agencies modernize their systems. We are excited that the market leader of electronic insurance verification recently joined the I3 family. Their solutions augment the strength of our transportation market offering. Now some portion of the I3 verticals transportation platform is live in 30 states and four Canadian provinces. Our partnership with West Virginia continues to be strong. We are in the process of fulfilling the recently won contract that the West Virginia Supreme Court of Appeals with I3 Court 1. Additionally, the Arizona Department of Real Estate selected I3 to provide licensing and regulatory software across the state. We are seeing particularly strong activity across justice tech, transportation, and regulatory and licensing markets. In addition, I3 Education is realizing the investment in I3 Marketplace. I3 Marketplace is a portal providing unified access, complete with SSO, single sign-on, and MFA multi-factor authentication to all I3 education models. It supports students, parents, and administrators across schools and districts. I3 continues to gain traction with AI-enabled solutions. We also delivered an AI support upgrades to our current Georgia Justice Tech footprint and will continue to push those changes into our other markets across the U.S. throughout 2026. Our focus on leveraging AI along with our deep domain expertise is proving to be positive for both i3 and our customer base. This concludes my comments, Dave. At this time, we'll open the call for Q&A, please.
Operator
We will now begin the question and answer session. To ask a question, you may press star, then one on your touchstone phone. If you are using a speakerphone, please pick up your handset before pressing any keys. If at any time your question has been addressed and you would like to withdraw your question, please press star and then two. Our first question comes from Madison Short with Raymond James. Please go ahead.
Hey, good morning, guys. Thanks for taking the questions. I wanted to start on the FY26 updated outlook and putting together some of the comments on the deal, it does seem like organic growth may have ticked down very modestly, maybe $1 million or $2. So I guess just for starters, is that generally correct? And if so, just any color on what's driving maybe the slightly modest headwinds relative to last quarter?
Good morning, Madison. You are correct. And it comes on the professional services line. And I think we entered the year thinking professional services would go from 40 to 33, 40 and 25 to 33 and 26. Our current view is that it will go to 31 million on professional services.
Okay, got it. And then obviously the recurring side continues to be strong, 8% in the quarter. You guys talked about 8% to 10% for the year last quarter. Apologize if I missed it, but is that still the right way to think about the recurring side for this year?
Yeah, that's correct. With the exception of our acquisition, that'll tick it up. It's mainly recurring revenue. Yeah, 8% to 10% organic.
Okay, awesome. And then if I can sneak one more in just on capital allocation, obviously, you know, you guys did a deal. M&A is a key part of the strategy, a differentiator for you guys. But, you know, just given what we're seeing in the market and the dislocation for your stock in particular, I would love to just hear your thoughts on, you know, buybacks versus M&A here. And it does look like you guys might have bought back some stock in the quarter, just any color on kind of the quarter itself from a buyback perspective as well. Thank you.
There will be more information about that in our 10Q that comes out here. But to get out in front of that, yeah, we did buy back a significant number of shares this last quarter. The outlook and approach has always been for us to be opportunistic with buybacks. We're in a really good place on our balance sheet. We think that our stock is inexpensive and a great investment for the current shareholders of the business at the levels we've been at. So that will continue to be the approach go forward. But you'll see a little bit reporting about that in terms of quantity in the 10Q.
Okay. Awesome. I appreciate it, guys.
Operator
And the next question comes from Peter Heckman with DA Davidson. Please go ahead.
Good morning, everybody. Thanks for taking the questions. Congratulations on the new acquisition. Just a few additional details in terms of how you think about the opportunity there. I guess how do you think about this company's market share? either. And then next, like, is the revenue stream transaction-based?
So we, thanks, Pete, for the question. We're very excited about the deal. We think the growth prospects going forward are going to be staggering, to say the least. They're very good with their customers. They have their very first customer. They never lost one. We like their presence in the market. They're well-known. It's not transactional today. We think that we can take this product into our motor carrier to some degree, and we know that current customers, a handful, have been asking for, let's say, one neck to choke with payments and software, so we think we can get some payments play in there too, but that's to be seen, but we're very excited about the deal.
Okay. So this is a follow-up. Sounds like there's significant opportunity.
Operator
And the next question comes from Charles Madden with Stevens. Please go ahead.
Hi. Good morning, and thank you for taking my question. Good to see another quarter of strong SaaS revenue growth. I was wondering if you could expand on some of the drivers of that 20% plus growth as well as speak to the sustainability of that pace.
First off, the acquisition will add a whole new layer of SaaS growth, so we'll be well north of that number, you know, north of 30% from the rest of the fiscal year on that. But the organic SaaS growth should stay in that general vicinity north of 20% as well. Drivers are – it's the fruits of the emphasis that we put on SaaS in all our markets. It's coming from a lot of different markets, utilities, the public administration market, especially our board and licensing software, the justice market. All the different markets contribute kind of in their own way there. So, again, the rest of the year, expect Organic to be north of 20. The new acquisition, which is currently monetized primarily off SaaS, and as Rick said, there will be opportunities to add other kind of streams for that will be a great thing. but we'll be in a great spot on SaaS growth for a while.
As my follow-up, I wanted to get your thoughts on AI. Approaching it from a couple different angles, I'd love to hear how you're thinking about it in your internal processes as well as how you think about it from the disruption potential within GovTech from AI, whether it's fact or fiction and just generally how you're thinking about it given some of the recent stock movements.
Yeah, so Charles, this is Rick. I'll take a stab at this and I'll let Greg and Clay chime in after. Look, we have pockets where adoption is very high within our customer base with extraction and redaction in CAMA, the CAMA world. We have others where it's the adoption is not so great. We're continuing to push it both on the customer side and on the development side internally. That's the first thing we think about in our engineering group is how do we use AI to develop new features to our products. But at the end of the day, state, local, and municipal agencies will need to create frameworks of processes, functions, structures, laws before creating engineering and security protocols. Initially, policies are going to be rigorous and hyper-controlled for the fear of AI itself. So that will be a headwind to us near term, providing minimally viable products and services for constituent use. Without an overall agreed-upon plan in GOVTAC or guidance at the state or federal level, there's going to be inter-jurisdictional inconsistencies that will cause confusion amongst state constituents. And that's something that's going to kind of put a clog in the engine. In short, we believe that it's going to be a good bit of time away from this concept of proliferation of AI within GovTech being a real working asset because of the headwinds I mentioned. Companies like i3 can accelerate the AI process, but the customer at the end of the day is going to drive adoption at a slower pace than we can move forward. So would you add anything to that?
I think that's right. We're excited about AI. It enables us to deliver better products more quickly to our customers. We have deep domain expertise, and we are the enterprise platform in most cases or the system of record for our customers, so we're deeply embedded in their everyday workflows.
Just the relationship that we have. go ahead I'm sorry no no I was just going to thank you for your thoughts but always interested in hearing more if I cut you off I apologize and the next question comes from Alex McGrath with KeyBank Capital Markets please go ahead thanks everyone just a couple from me maybe first on the transaction I think I heard 15 times just based on some historical comments, I think a bit outside the sweet spot as you all have described it. Obviously, like some compelling financial profile details that you all share. Just curious, you know, if this is a unique transaction for the multiple and maybe how many more of these sort of unique opportunities that might pull you upwards of that sweet spot there are that exist today. Thanks.
Well, from a price standpoint, they, you know, most of the companies we've bought historically have been growing organically in the 10% range. This one's north of 20%, and we see new customers coming on, sustaining that growth. There are some synergies available, and their margins are in the 50% range. So, that's why the higher multiple in the price. What was the second part of your question, Alex?
Just as to whether or not there are more of these types of deals out there in the pipeline that might sort of, you know, pull you up outside of that sweet spot for good reason, but notably We pull you outside of that, you know, upper end that you've historically paid for deals.
Yeah, I'm glad you said for good reason. I mean, we've made it known all along that while our sweet spot is seven to ten times, if we find something that's growing that's a perfect fit with incredible margins like this, you know, it's a possibility. But within our existing pipeline today, we're back in our sweet spot. But this was a unique deal. It's a unicorn. And we feel lucky to have it.
Super helpful. Thank you, guys. And then just on the product investments, I guess, sounds like things are going to plan there, and you're seeing some benefits in the sales pipeline around that. Still, just as you described it last quarter, that sort of acceleration investment for 26, still the right way to think about it. And then just, you know, any changes to how you're thinking about that spend for the rest of the year would be helpful. Thanks.
I mean, it's a continuation of what we introduced in our third quarter for last year, the investment in advance of revenues.
We're glad that we're doing it.
It's a coordinated plan. Really, nothing's changed there.
Thanks, everyone. Appreciate it.
Operator
Thanks, Charles. This concludes our question and answer session. I would like to turn the conference back over to Greg Daly for any closing remarks.
Well, thanks, everybody. for listening and dialing in and showing interest. I wanted to kind of give a shout-out to our large utility customer in Seattle. Good luck Sunday.
Operator
The conference has now concluded. Thank you for attending today's presentation. You may now disconnect.