Operator
Good day, everyone, and welcome to the I-3 Verticals Second Quarter 2026 Earnings Conference Call. Today's call is being recorded, and a replay will be available starting today through May 14th. The number for the replay is 412-317-0088, or 855-669-9658, and the code is 608-8860. The replay may also be accessed for 30 days at the company's website. At this time for opening remarks, I would like to turn the call over to Clay Woodson, Chief Strategy Officer. Please go ahead, sir.
Good morning, and welcome to the second fiscal quarter 2026 conference call for I-3 Verticals. Joining me on this call are Greg Daly, our Chairman and CEO, Rick Stanford, our president, Jeff Smith, our CFO, and Paul Christians, our chief revenue officer. To the extent any non-GAAP financial measure is discussed in today's call, you will also find a reconciliation to the most directly comparable GAAP financial measure by reviewing yesterday's earnings release. It is the company's intent to provide non-GAAP financial information to enhance understanding of its consolidated GAAP financial information. This non-GAAP financial information should be considered by each individual in addition to, but not instead of, the GAAP financial statements. This conference call may contain forward-looking statements within the meaning of the Private Securities Litigation Reform Act of 1995, including statements, among others, regarding the company's expected financial and operating performance. For this purpose, any statements made during this call that are not statements of historical fact may be deemed to be forward-looking statements. You are hereby cautions that these forward-looking statements may be affected by important factors, among others, set forth in the company's earnings release and in reports that are filed or furnished to the SEC. C. Consequently, actual operations and results may differ materially from those discussed in the forward-looking statements. Finally, the information shared on this call is valid as of today's date, and the company undertakes no obligation to update it, except this may be required under a flippable. I will now turn the call over to the company's Chairman and CEO, Greg Bailey.
Thanks Clay and good morning to everyone on the call. We are pleased with our performance in the second quarter as we continue to execute against our strategy and further improve the quality of our business. Revenue from continuing operations grew at six percent year over year and annualized recurring revenue increased 12 percent which we continue to believe is the best indicator of our long-term growth opportunity. Across each of our public sector markets, we are investing thoughtfully in products and capabilities where we see opportunities. For example, we continue to find compelling opportunities to invest in justice tech market to help courts modernize and capitalize on their own revenue opportunities. However, we are seeing opportunities for cost control and margin expansion amongst many of our highly durable products. Importantly, the process improvements and efficiency initiatives we've been driving through the organization are beginning to show up in our operating model. While we continue to invest for growth, we believe these efforts position us well for margin improvement as we move through the remainder of fiscal year 26. We remain well-positioned from a balance sheet perspective, which gives us the flexibility to pursue all manner of capital allocation opportunities. Overall, we're encouraged by the momentum we're seeing across the business and remain confident in our ability to create long-term value for our shareholders. With that, I'll turn it over to Jeff to walk through the financial results in more detail. Thanks, Greg.
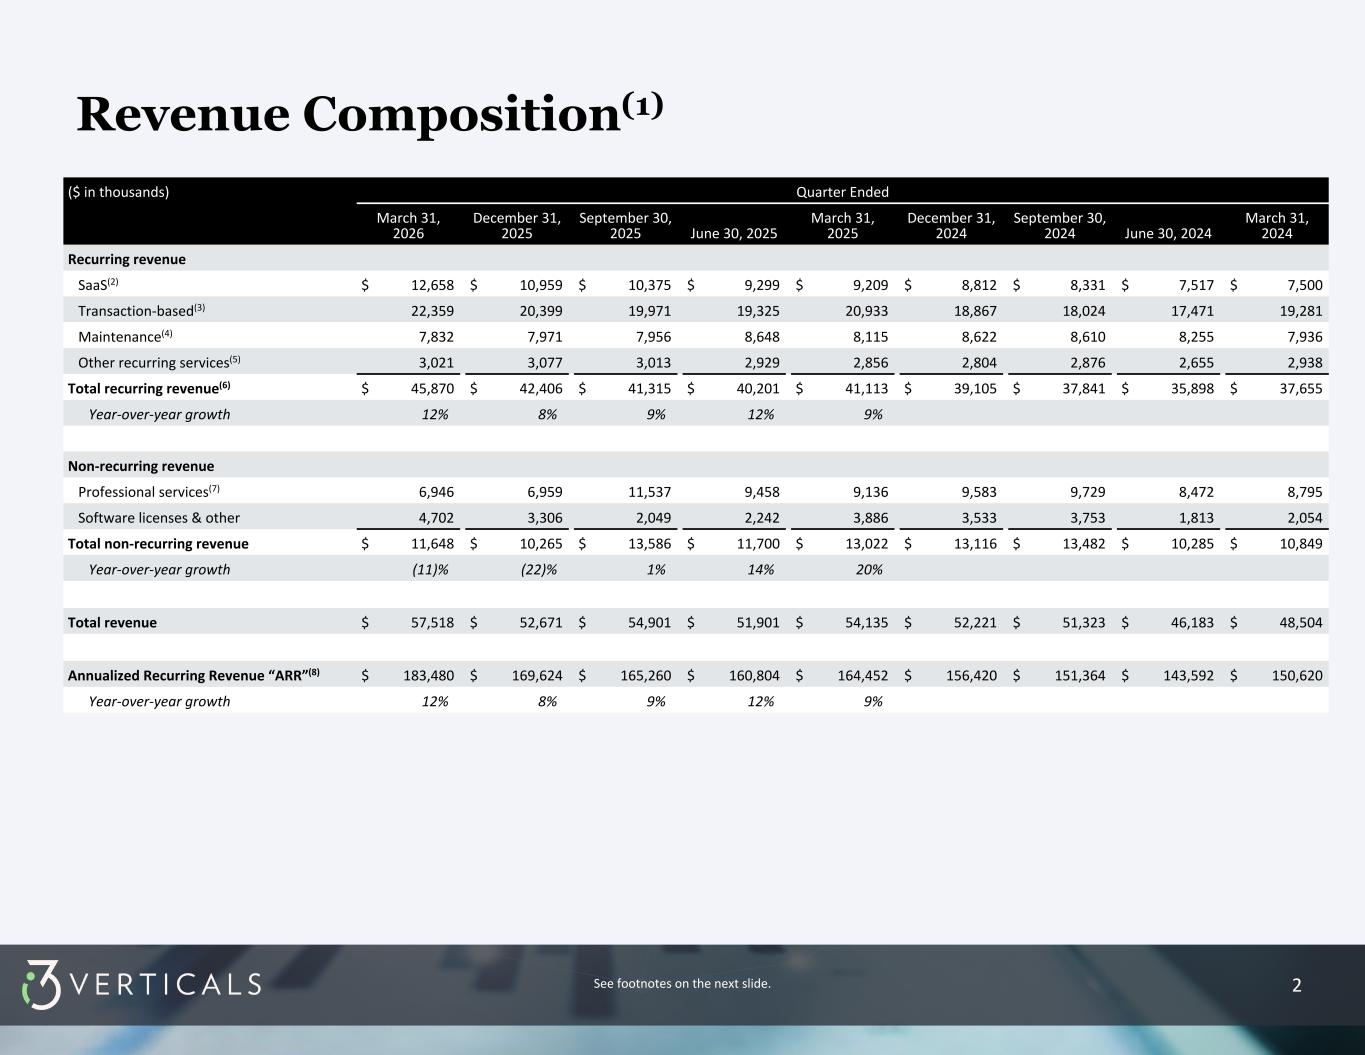
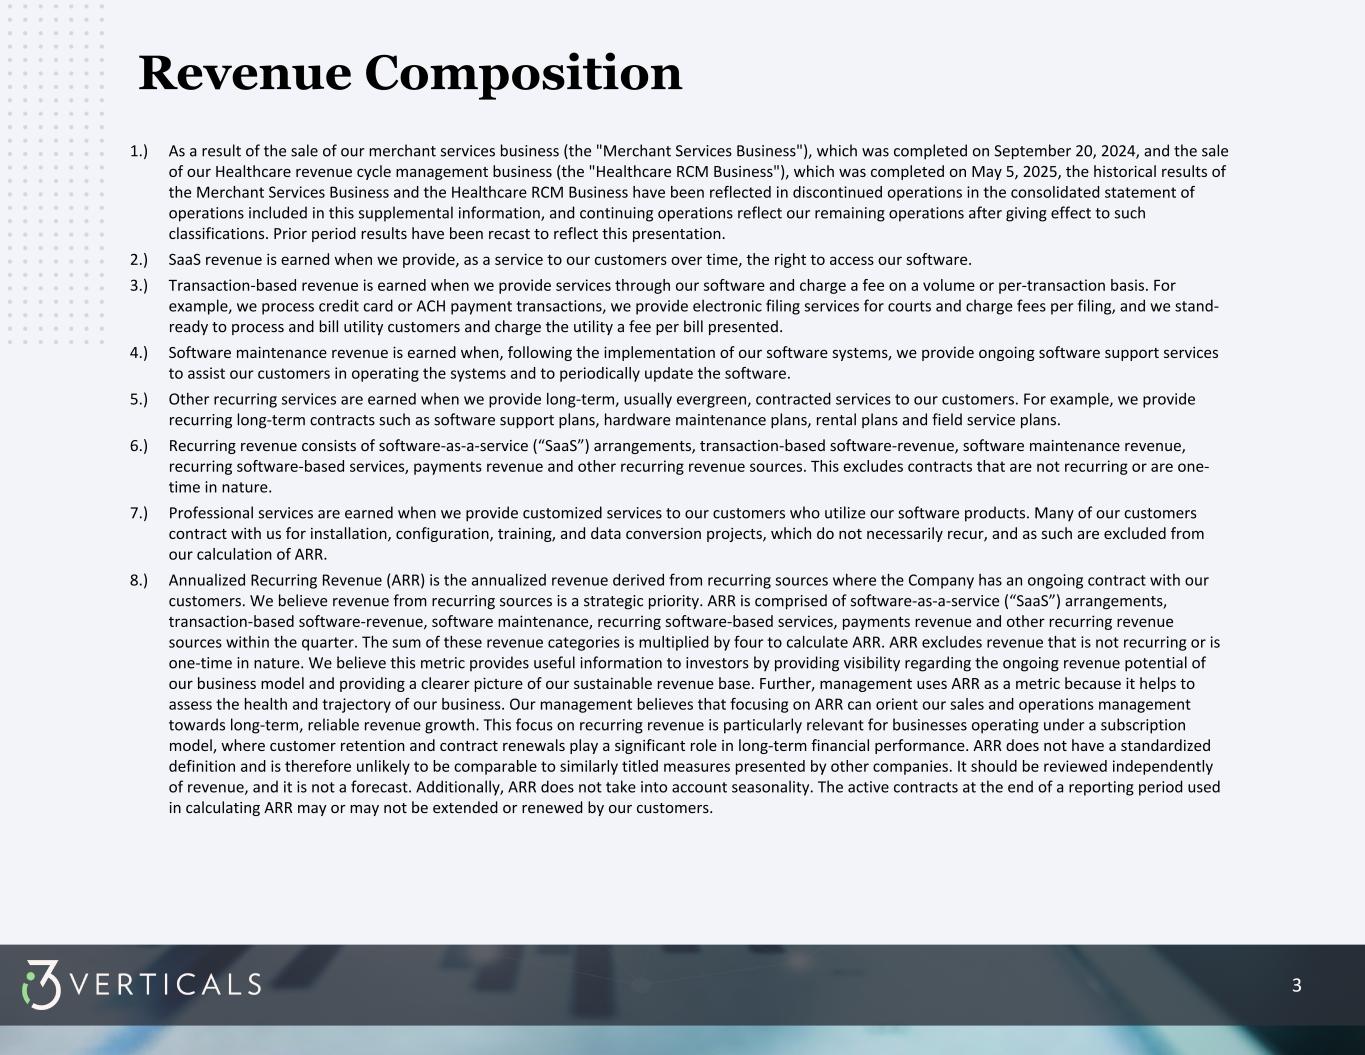
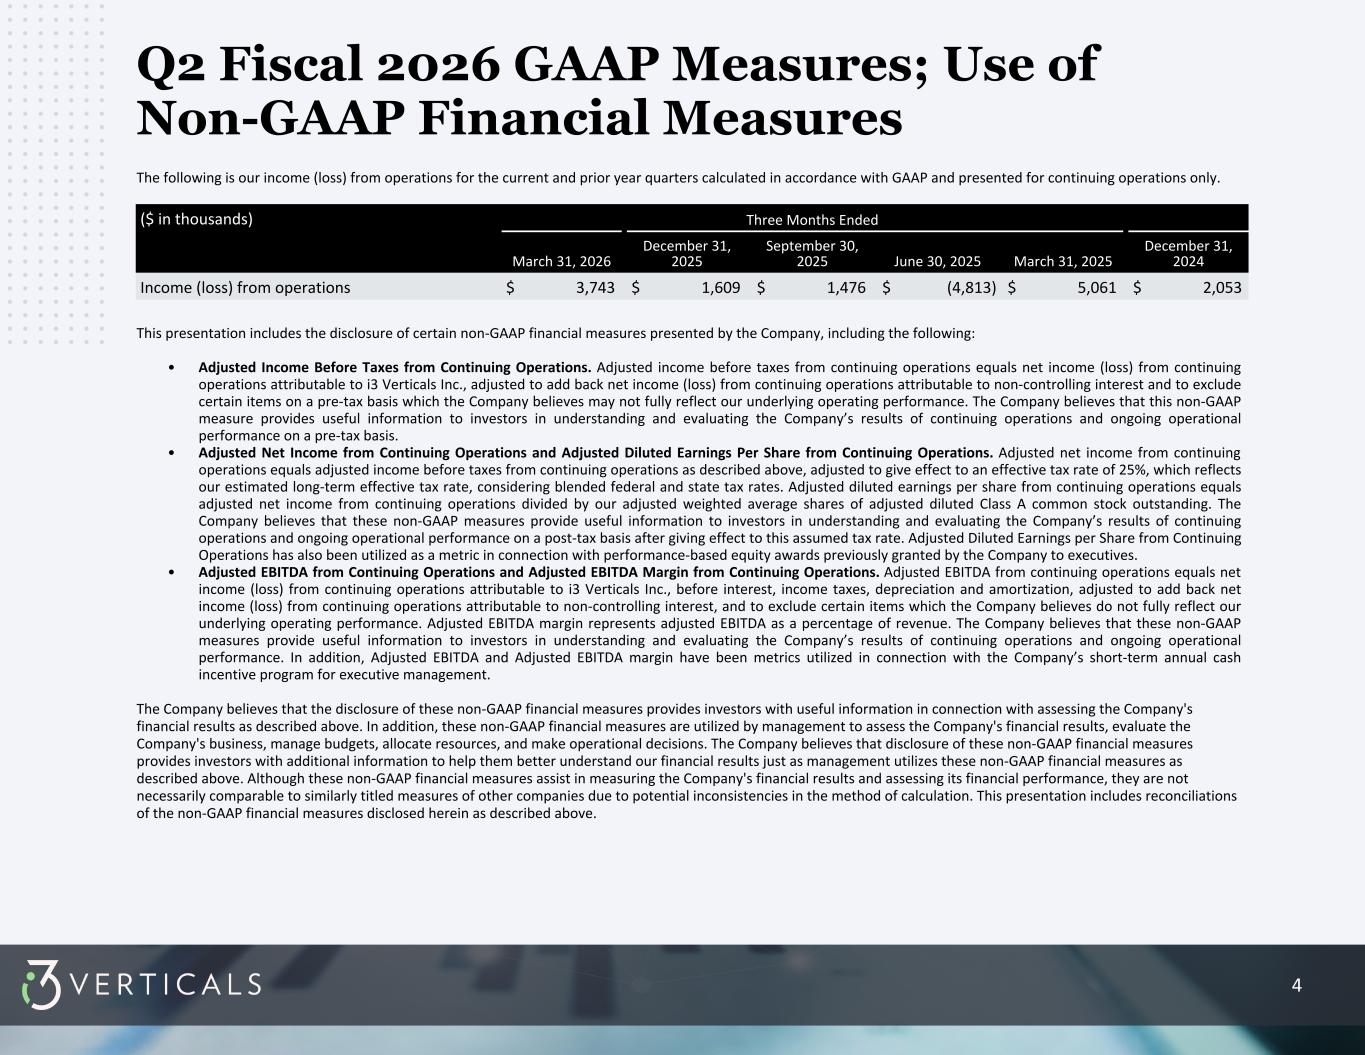
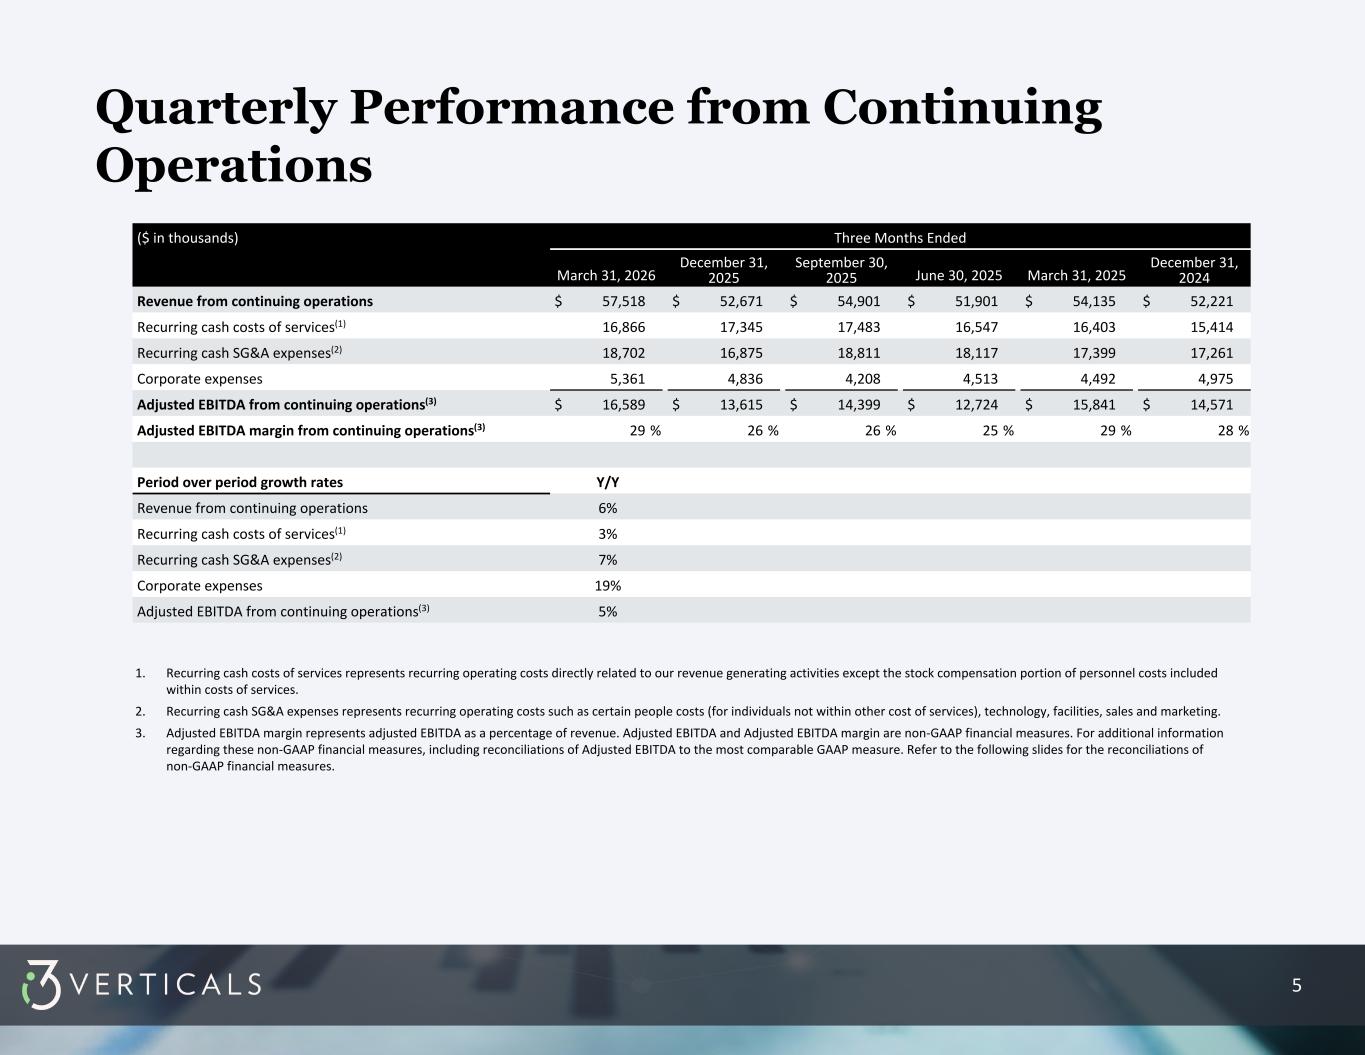
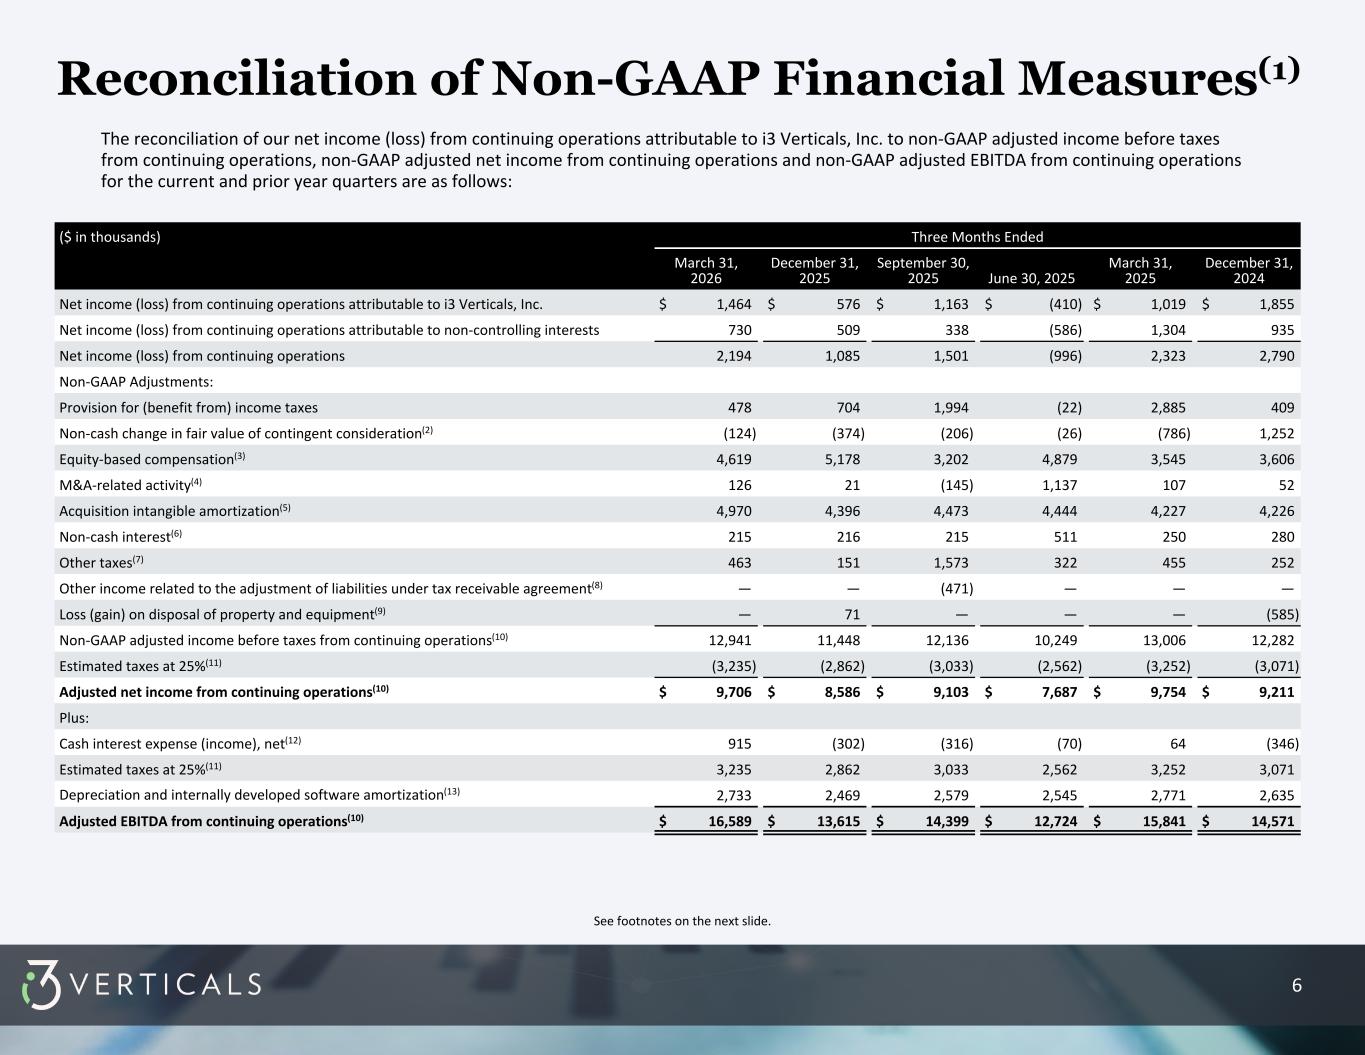
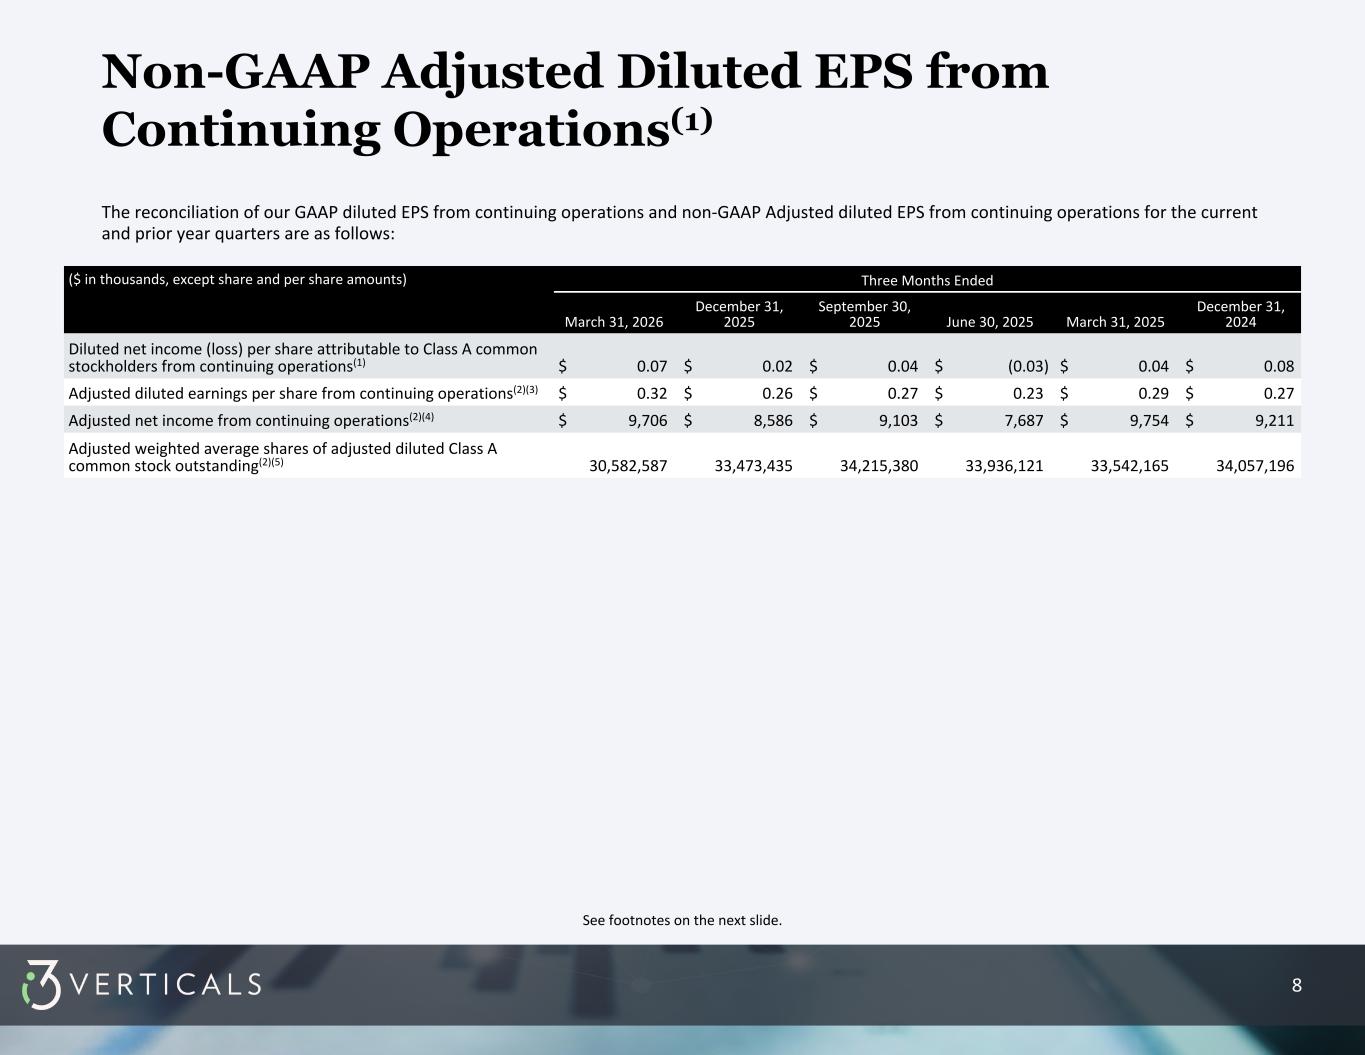
The following pertains to the second quarter of fiscal year 2026, which is the quarter ended March 31, 2026. Please refer to the slide presentation titled Supplemental Information on our website for reference with this discussion. You will see we have retooled our presentation of revenue. We believe this clarifies our recurring revenue and simplifies the categories investors track while maintaining visibility in the important trends in the business. Revenues for the second quarter of fiscal 2026 increased 6% to $57.5 million from $54.1 million for Q2 2025, principally reflecting revenues from two acquisitions, which have not yet annualized. Organic revenue was flat in the quarter, hampered by a $2.2 million decrease in professional services in the quarter. The ongoing weakness in professional services continues to be concentrated in our utilities market, and we expect this to continue through the remainder of the fiscal year. Overall, non-recurring revenue sources decreased 11% compared to the prior year. Annual recurring revenues increased 12% to $183.5 million for Q2-2026, compared to $164.5 million for Q2-2025. SAS revenues grew 37%, and transaction-based revenue grew 7%. We expect elevated levels of SAS growth the remainder of the fiscal year and accelerating transaction-based revenue growth. Overall, 80% of our revenues in the quarter came from recurring sources. Most of our expected software license sales for fiscal 2026 have increased, and we expect lower levels for the remainder of the year. Adjusted EBITDA increased 5% to $16.6 million for Q2 2026, from $15.8 million for Q2 2025. Adjusted EBITDA as a percentage of revenues was 28.8%. a decrease from 29.3%. Similar to last quarter, the percentage decline was driven by the previously mentioned investments in our Justice Tech market, higher hosting costs, and lower professional services revenues. While professional services margins are relatively lower, the associated costs can bind revenue fluctuations. We expect the adjusted EBITDA as a percentage of revenue to improve for the remainder of year, and our long-term expectation remains 50 to 100 basis points improvements per year. Corporate expenses as a percentage of revenues were 9.3% for Q2 2026. Adjusted diluted earnings per share from continuing operations for the second quarter of fiscal 2026 increased 10% to $0.32 from $0.29 for Q2 2025. Again, please refer to the press release for a full description and reconciliation. At quarter end, debt stood at $81 million and our cash balance was $7.1 million. We still have $319 million of borrowing capacity under our revolving credit facility with a 5x leverage constraint. The expectation remains that we will use any borrowings for opportunistic acquisitions and stock repurchases. The following updates are guidance for continuing operations for FY 2026, which was previously set forth in our first quarter fiscal 2026 press release dated February 5th. The outlook does not include acquisitions that have not been announced or transaction-related costs. Revenue, $221 million to $229 million. Adjusted EBITDA, $61 million to $65 million. Adjusted diluted earnings per share, $1.09 to $1.15. We expect recurring revenues to continue to grow at a double-digit rate through the remainder of FY2026. However, our view of non-recurring professional services has deteriorated further, leading us to guiding down the midpoint of our revenue range. Greg and I have alluded to margin strength in the back half of the fiscal year. We can see that in our guide, as we expect to hold closer to our previous guide on EBITDA, despite the lower revenue expectations. Looking past 2026, we expect better growth in 2027 and beyond. To highlight several discrete items that will compound with our normal growth algorithm, ongoing boarding of courts in West Virginia and other states on our CMS platforms and other transaction-based revenues will continue to feed excellent ARR growth in our Justice Tech market. In our transportation market near the end of fiscal 2026, we will turn on two long-delayed transaction-based revenue opportunities, the impact of which will be felt in 2027. In addition, the insurance verification acquisition we made on January 1st continues to accelerate, and we will add multiple new state contracts in this fiscal year and the next. While professional services is not our preferred revenue source, we always pursue ARR when given the chance. We expect a professional services line to be far more stable than it has been in 2026. Our long-term expectation of organic revenue growth remains high single digit. From a seasonality standpoint, we currently expect our revenue distribution for the remaining two quarters to approximate the following. Q3, 48%. Q4, 52%. I will now turn the call over to Rick for additional business-related comments.
Thank you, Jeff. Good morning, everyone. This past quarter, we continued our focus on AI-powered capabilities that create measurable value for our government clients we serve by strengthening the core platforms they rely on every day. Our core platforms serve as systems of record containing critical IP, sensitive data, and are designed with deep domain knowledge and experience. An example of our AI-powered capabilities is our newly released ad hoc query and reporting tool, which allows users to extract meaningful insights from their existing data using natural language without requiring lengthy custom report development or IT involvement. At last month's IUCX conference, which is the leading utility customer experience conference for electric, gas, water, and wastewater utilities, the response to this new set of tools was immediate, with clients requesting access on the spot and citing the ability to compress what had been a multi-day reporting cycle down to minutes. In addition, our AI-assisted document analysis and management platform brings the same philosophy to unstructured content, enabling clients to ingest, separate, extract, redact, and search documents throughout their entire lifecycle, providing our customer workforce with the tools to improve the value of their existing data and documents with an auditable AI-assisted workflow. In both cases, human review remains at the center of the process, ensuring accuracy, traceability, and compliance in the regulated environments our government clients operate in. What makes these capabilities particularly valuable is that they are designed as a platform architecture, not isolated point solutions. That distinction matters in an AI-driven market. Both tools are architected to layer on top of any product within the I3 enterprise, which means the value compounds as adoption grows. For example, a client using our transportation or justice tech solutions today can extend these AI capabilities across their existing workflows without disruption to their data models or existing integrations. This positions I3 to expand the value of existing relationships within our installed base, while simultaneously making our platform more compelling to net new clients who are prioritizing durability, depth, and long-term efficiency in their technology decisions. Beyond our client-facing products, we are seeing meaningful gains in how we build software today versus a year ago. We began with AI assistance across the enterprise, which in layman's terms simply suggests snippets of code to enhance overall code development, debugging, testing, among other uses, and now have moved to AI agent tools that plan, write, test, and modify code with minimal human intervention and have increased our product development capabilities, allowing us to pursue opportunities that would have previously required difficult trade-offs and prioritization, such as new feature development and product releases. Both AI-assisted and AI-agent design tooling is elevating the user experience of existing applications, and automated testing through Playwright is improving our reliability and quality of our releases. Playwright allows us to create a library of automated testing scripts that would run on a cadence of our choosing without human intervention or action. Taken together, these investments are expanding what our teams can accomplish within a given sprint, letting us do more across our product portfolio without compromising on quality or execution discipline. We believe the work we're doing today in AI-powered product development will compound in value over time because it is deeply embedded in mission-critical systems and workflows our clients depend on, strengthening our capabilities and our long-term customer relationships. I'll now hand the call over to Paul for revenue updates.
Thank you, Rick. Demand across our core markets remain healthy in Q2 as government agencies continue to prioritize modernization, improve constituent experience, and platforms that reduce long-term operational complexity. Across procurement and active opportunities, we continue to see three consistent buying patterns. Broader solution scope beyond a single core system, preference for platforms that support integrated analytics, payments, transactional services, and AI platform architecture that layer on top of existing features and benefits, seeking vendors that can scale, and also seeking vendors that can scale from local agencies to statewide deployments. These trends continue to favor I3's market-centric model and our ability to provide integrated platform solutions. From a commercial execution standpoint, we continue to see sustained interest across JusticeTech, transportation, education, and licensing and permitting, increased multi-module evaluations rather than single-solution procurements, all with integrated analytics, payments, transactional services, and AI-enabled workflows. Justice Tech remained one of our most active markets this quarter, supported by continued court modernization demand and strong alignment of our Court One case management system, jury solutions, and transactional services. We saw increased customer engagement, reflecting agency's urgency to reduce workload, modernize workflows, and improve customer outcomes at both the state and local levels, creating increased interest in offerings that include payments, analytics, transactional services, and citizen access. As I3 continues to expand and deploy our case management system footprint, we are seeing growing market awareness of the transactional services embedded in that ecosystem. Historically, case management system deployments served as the primary entry point, with transactional service adoption following as customers became operational and more educated on their value. Over time, this created strong demand, but with long sales and implementation cycles typical of public sector system replacements. We are entering the next phase of this strategy. With the ability to offer transactional services independently of a full case management system deployment, we have introduced another commercial motion that accelerates time-to-revenue recognition. This approach allows agencies to engage with transactional services first, which drives revenue for the agency, generating pull-through demand for broader software adoption. As transactional services adoption grows, it strengthens our customer relationships and enables faster and more natural expansion into additional products and platform capabilities without requiring a full system replacement up front. In transportation, market momentum continues to be supported by AI-enabled verification and enforcement workflows, proven deployments that validate scale and reliability, and cross-sell opportunities, expanding our platform reach. Transportation continues to execute strongly within our platform-first strategy, delivering durable recurring revenue while deepening our role as a long-term modernization partner for motor vehicle, driver services, and motor carrier agencies. We further strengthen strategically important customer relationships by securing multi-year support and maintenance agreements and delivering multiple large renewables with disciplined pricing, reinforcing platform stickiness and long-term pricing durability. Operationally, we remain focused on core platform execution and supporting future modernization efforts. As recent acquisitions have expanded, excuse me, our recent acquisition has expanded our footprint as the market-leading insurance verification provider while enabling tighter integration with payments and shared data services in the broader ICERI platform. Across licensing and permitting in our public administration area, agencies continue to expand platform scope, building on core implementations. Commercial trends include broader adoption of licensing and permitting and compliance modules and an increased focus on citizen engagement and digital services delivery. These dynamics reinforce higher deal values and longer-term customer relationships and introduce AI as an accelerator. In the second quarter, we expanded adoption of AI indexing across new client agencies, demonstrating clear willingness among public sector customers to invest in practical embedded AI that delivers immediate operational value. These wins are also accelerating our broader sales actions, and we are compressing engagement timelines and driving significant pipeline expansion. In utilities, we continue to expand our platform capabilities with our I3 Unified 360 customer information system and our Unified 5.0 portal systems into a platform cloud offering. These capabilities, including real-time analytics, help agencies streamline operations, improve customer experience, and reduce friction across billing, payments, and service interaction. As adoption grows, we are seeing increased opportunities to extend these solutions through embedded payments and data services, reinforcing our platform approach and expanding long-term value within the utility market. Education continues to be a strong perennial performer for I3. This quarter, we opened up another state with the addition of Utah. We are also pleased to report that close to half of our new sales for fiscal 26 so far are net new customers. In addition, we have operationalized AI and development operations and product with near-term plans to augment our customer-facing AI-powered reporting tools. While deal timing remains product-driven, overall bookings activity reflects healthy deal flow across core markets, increased average solution scope for each opportunity, continued customer preference for SaaS delivery models augmented by integrated transactional services, Looking ahead, our commercial priorities remain centered on sustained pipeline and RFP growth with both new-from-new and new-from-existing clients, expanding solution scope within existing accounts, and leveraging platform architecture AI capabilities as part of our sales and service delivery. This concludes my comments. Cindy, at this point, we will open the call for Q&A, please.
Operator
We will now begin the question and answer session. To ask a question, you may press star, then 1 on your telephone keypad. If you are using a speakerphone, please pick up your handset before pressing the keys. If at any time your question has been addressed and you would like to withdraw your question, please press star, then 2. At this time, we will pause momentarily to assemble our roster. Our first question comes from Madison Schur of Raymond James. Go ahead, please.
Hey, good morning, guys. Appreciate you taking the questions here. I wanted to start just on the non-recurring side. I know there's some headwinds this year, but you did call out high single digits is still the right way to think about the business. Just what gives you confidence that that's the right longer-term growth rate? And if you can also maybe just touch on what the key verticals are that you think can drive an acceleration back into that range over the medium term.
Thanks for the question, Madison. So you touched on this a little bit in the script. You think about 2027, we started to kind of like give a little bit of breadcrumbs on that. Specifically, the justice market is going to continue to be a really strong ARR grower through that period. That business, you know, they have the West Virginia win, and really start to keep scaling and has really good prospects as they land and expand those courts. Our Resolve product, which is, you know, we're assisting with revenue generation for these courts, is absolutely kind of the right product for the right time with a very deep pipeline right now and a lot of implementation in front of us. We're really excited about that. Transportation market also has a couple of really solid things going for it. A couple of long-term ARR things that have been years in the works and have been long delayed are finally going live. That'll be nice additive items. And then the most recent acquisition, we touched on this, but just to hit it a little bit more, they currently have five states in implementation and several more that are, you know, kind of near line of sight. Just an incredible market position that they have there is kind of the, you know, with the right to win status, you might say, as these states implement this kind of no-brainer solution to preemptively monitor for insurance on their registered vehicles. They're in a great market position. It's going to be a great growth driver for the company. That's a couple things that layer on top of our already existing growth algorithm. And then, you know, outside of the, you know, net dollar retention growth algorithm, you know, which we expect to kind of remain in that sort of, you know, 103 to 105, hopefully push it a little higher kind of level. We were 104 this last year, not expecting any significant changes there. You know, the story this year and why the growth isn't kind of, you know, still up in that high single digits is the non-recurring stuff. Our professional services specifically has, you know, gone from about $39 million to the current guide expects, you know, somewhere more in the high 20s on an organic basis. We'll have a little bit of inorganic in there. And that's what, you know, has been revised down from the initial guide. This coming year, as you look out to 2027, you don't have to expect that that growth, that that revenue line rebounds back up to $40 million nearly to see us getting back to a much better growth number that's in the high single digits in line with our longer guidance. Even if that kind of maintains at the already kind of depleted level as it's at, you're already kind of there. And we have some things in the hopper that, you know, the give or take on that number is decently wide, as always, because it's non-recurring. But we have some opportunities in front of us that are still really attractive. Utilities, in particular, has been kind of where some of the pain has been felt this particular year. You know, that's a project that's still very much, you know, moving forward. And we still remain very excited about it and convicted about the market opportunity. We've had to be a lot more patient than we would prefer, but that is what it is, and we're, you know, we're still going to get this thing done ultimately.
Okay. No, that's all very helpful, Collor. Appreciate it. And then just to follow up on the 2026 outlook, you did touch on this a little bit as well in your prepared remarks, but you took revenue down by about $3.5 million and EBITDA only down $750K. So call it about a 20% decremental margin. So just as we think about expenses here, to the extent some of these non-recurring headwinds persist, do you feel like you can continue to manage expenses to partially offset a big portion of those headwinds? And do you think some of these efforts you're doing now set you up well to be in that 50 to 100 basis points of normalized margin expansion in FY27, assuming the revenue also is more in the normalized range? Thanks, guys.
Absolutely. On margin specifically, as always, there's a mix of things going on within that, but we've highlighted this on the last couple calls. You know, as our professional services draw us down, you know, those costs lag a little bit on the revenue drawdown, especially in our utilities market. You know, we have a lot of third-party contractors and things like that that, you know, we're engaged in projects that we're able to kind of manage and mitigate. and then you know the same trends that we've been talking about for a little while are still present you know we have been doing less acquisitions and as a result we have been continually tidying up and improving and efficiency and processes all over the business in multiple different pockets we have been benefiting greatly from ai and i think you know there's still more you know room to kind of benefit enhance there and that goes for a lot of different processes and pockets within the company. I mean, obviously, DevOps, but, you know, there's probably not a single person within the business who isn't, you know, benefiting from this stuff in some form or fashion. So, you're able to do more with less, you know, when you have attrition. You're able to consider, do we really need to backfill roll? Things like that. Sumitably, that's all adding up to a pretty attractive margin expansion situation. We expect margins to be stronger the back half of this fiscal year. We still are making sure we invest in opportunities when we see those to run right through them, the justice market being an example of that. So, it's not all kind of, you know, reduction in cost. There are some pockets where we're really accelerating and pouring fuel in the fire. But the net picture is still one of, you know, it's a pretty attractive margin expansion scenario for us.
Okay. Thanks again for taking the questions.
Operator
The next question comes from Peter Heckman of DA Davidson. Go ahead. please.
Hey, good morning, everyone. Thanks for taking the question. As regards to the recent acquisition in auto insurance verification, when you win a state there, do you automatically get 100% share of the state's business, or is that something where it's essentially maybe like a hunting license, or you're one of several suppliers, and so you have to compete for a share?
The short answer is we would get 100% of their insurance verification. There's no scenario that we're aware of, and I think it's extremely unlikely that the state would ever try to bifurcate that. There needs to be kind of a single system of record of these – what it is is basically civil penalties proactively being sent out when there's an uninsured motorist. There needs to be a single system of record for that, and that's our software. there's not really a scenario where you would bifurcate that now that being said this is sold into the department of transportation there's a lot of other software that the department of transportation needs a lot of which we provide so the added footprint we have here on the insurance verification proves our market position to provide other features motor vehicle driver's license some of the fuel tax solutions truck routing all the different things that the department and transportation needs to provide services to its constituents. So, you know, that's where the competitive landscape is.
Got it. And if I remember correctly, that acquisition already had something like 18 to 20 states. So just, I didn't write down whether you said you had three or five in implementation, but can you talk a little bit about, you know, the number of states that that company has live, how many are in implementation? And then does the revenue model, is it geared towards the underlying population of the state?
Just speaking broad numbers, we're in the low 20s at this point. We'll be in the high 20s, I think, when you look back in two years. Revenue model is, like a lot of our software, I'll say flexible. This is generally SaaS. There's some implementation revenues on the front end and then SAS, and that would be sized based off of the size of the state generally. Maybe not quite like, you know, it's, you know, it's probably the type of thing where like a larger state is definitely going to pay more, but a smaller state isn't going to get like proportionally lower cost necessarily. And then we also have the opportunity to do transactional revenue here. This is another classic situation for I3 where this company could monetize payments and wasn't monetizing payments and absolutely will go forward. We've already got two states lined up for that. They have a state that is a very small state that they monetize on a per-transaction basis, and that model's worked out really well for them. That state punches way above its weight relative to population. That model will – that won't be the only state on that model long run. And then we can also, you know, charge for the presentment of these. There's a lot of different others we can pull. We can be flexible and work with the state for what works for them and their budget.
Great, great. So that one looks like it should be – as that falls into the organic calculation, that one also looks like it should be added to organic growth. Yeah, absolutely. Great.
Operator
Again, if you have a question, please press star, then one. Our next question comes from Alec Marcraff of KeyBank Capital Markets. Go ahead, please.
Nice to speak with you this morning. A couple of questions, maybe one for Paul and Jeff, just around some of the AI comments. I'm curious. It sounds like you all are doing quite a bit. We'll just be curious to kind of understand where you expect this to show up most materially in the model in the near to midterm. Thinking about things like growth and existing relationships, new customer relationships, pricing, retention, maybe implementation timelines. Just help us think about how that sort of materializes from a model standpoint based on what you're hearing on the ground.
This is Paul. I'll get started on it. We see it really early in the sales process, and we see the ability because we've got a lot of domain expertise organized by market to really hit the trigger points for where they're – creating issues for our customers. And so it typically will start with a pain point reduction, and that may manifest itself in, you know, increased maintenance fees as we annualize on those conversations. It may manifest itself in specific pricing related to an AI deployment on that. It just depends on the customer and the particular process for how that's working. It also allows us, since the architecture is sitting on top of the AI component and it's architected on top of our existing positions, it also allows us to affect those more quickly than we would if we were just doing that on a pure standalone basis and having to do deep integrations because it's already our stuff and we're enhancing that program. I do think we're in early innings of that conversation. And it does appear to me that as we have customers who look at it and say, hey, we're excited and they want AI exposure, in many cases they don't know what that means or how to go about it. And so we're trying to focus on tangible value add that can improve their operational efficiency or enhance their constituent experience much more naturally, which then tends to open up yet another opportunity and yet another opportunity. So as we run down the road, I think we'll have more opportunities, but it also puts a little bit of pressure on us to continue to evolve in that fashion on a consistent basis, and we're structured to accommodate that. So we're excited about it.
Just to the financial model, Alex, obviously we're experiencing benefits in the margin area already, but also absolutely in revenue. Rick and his script highlighted a couple of discrete items where, you know, you're talking like direct revenue that's a result of functionality that's been added to software that would not have been possible kind of in a pre-AI area. So features and things like that that are directly taking advantage of the capabilities now. And the opportunities there, you know, are very large. I think over the next several years, there's a lot of the pie of what, you know, can be delivered and, you know, the range of things that can be delivered. to our customers, the functionality of the software has just expanded greatly. But then it's, honestly, it touches a lot of other revenue, too, just, you know, when you think about, like, how the software is built now, you know, in terms of, like, what revenue is enabled by AI is going to be in a not-so-far-off future. It's, like, kind of everything.
Got it. Thank you. That's helpful. And then maybe just one follow-up on the sales front. I think I heard 50% or about half of bills this year from new customers. If I heard that correctly, maybe just a reminder as to how that sort of compares to the last couple of years.
That was for education particularly. And it's probably close to two times what their average would have been five years ago.
Operator
Okay, again, if you have a question, please press star, then one. This concludes our question and answer session. I would like to turn the conference back over to Greg Bailey for any closing remarks.
Thank you for your continued interest in the company. Stay tuned. We're excited about our pipeline, our team that we've put together. And thanks again. Call us if you need anything.
Operator
The conference is now concluded. Thank you for attending today's presentation. You may now disconnect.