Operator
Ladies and gentlemen, thank you for standing by. Welcome to KKR's first quarter 2026 earnings conference call. During today's presentation, all parties will be in a listen-only mode. Following management's prepared remarks, the conference will be open for questions. I will now hand the call over to Craig Larson, partner and head of investor relations for KKR. Craig, please go ahead.
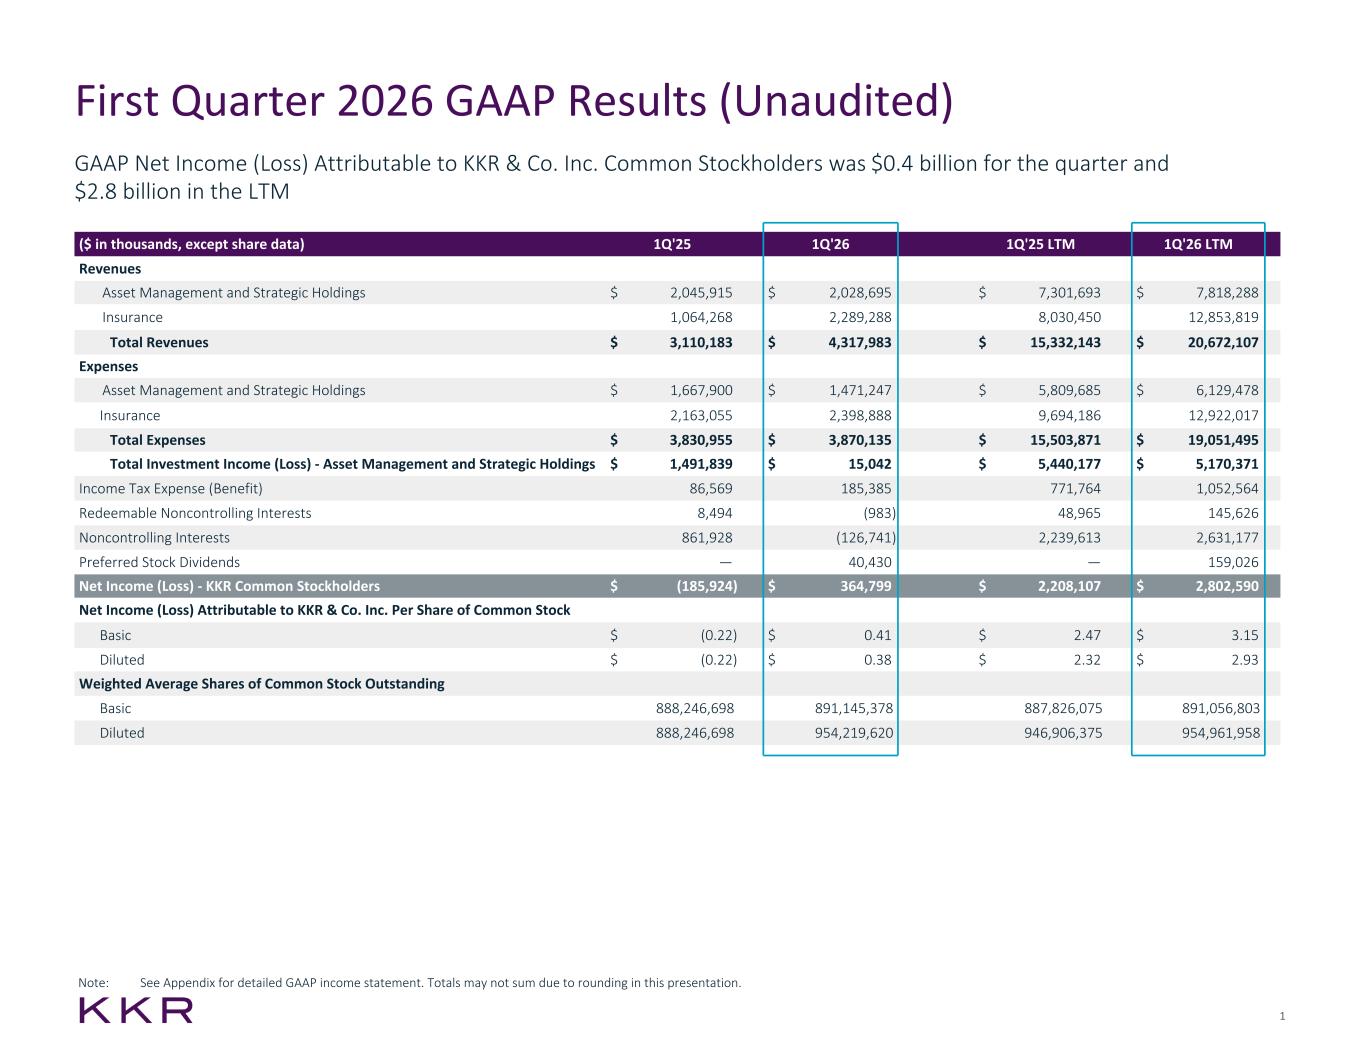
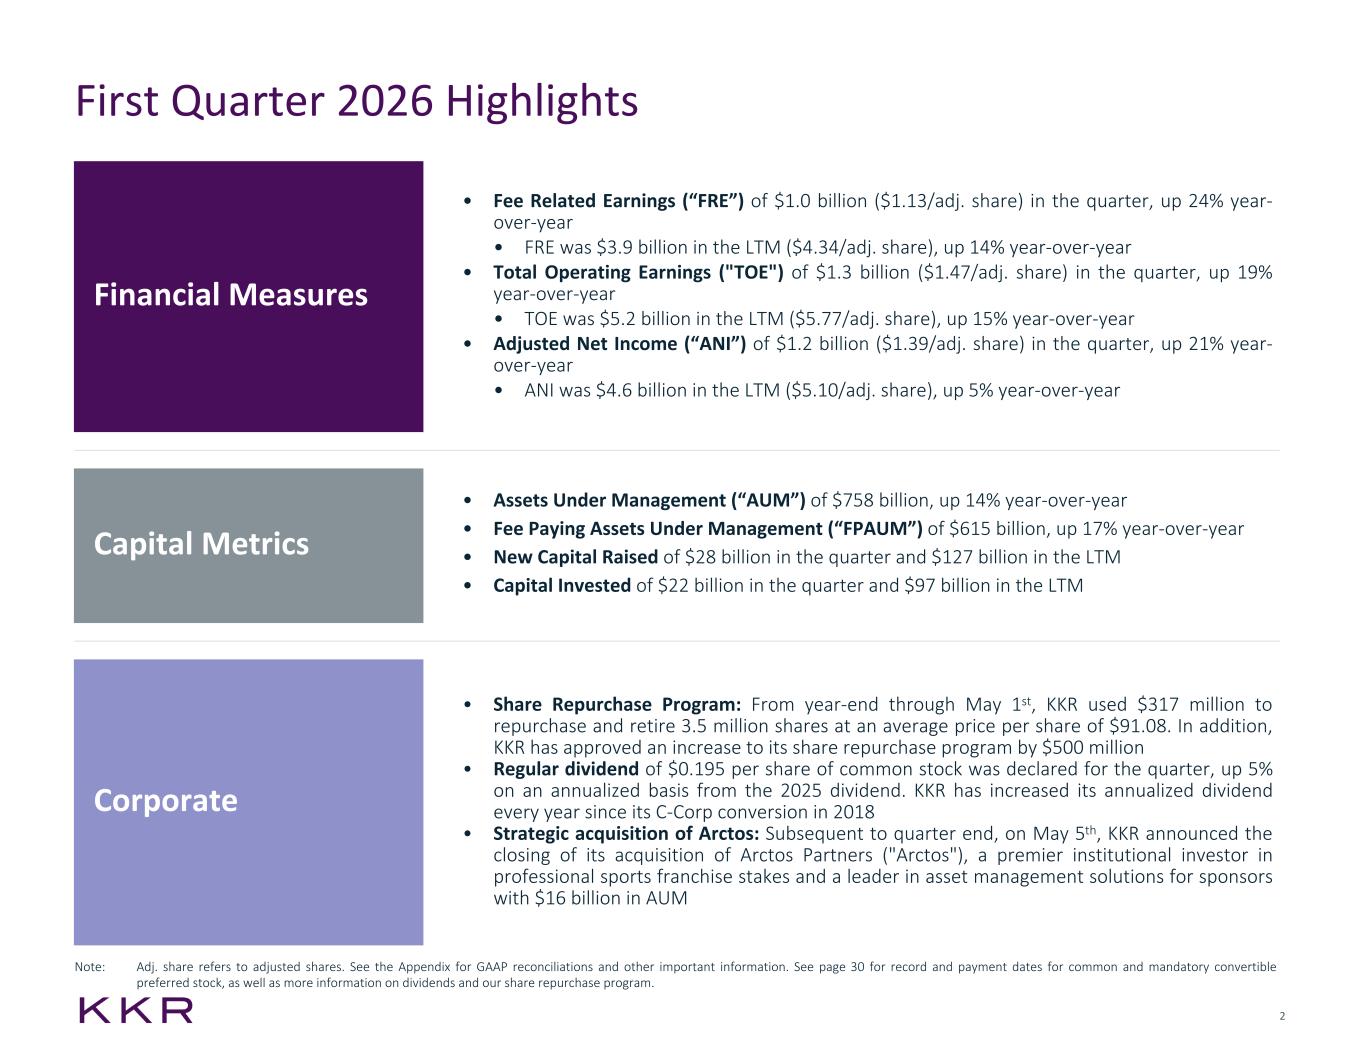
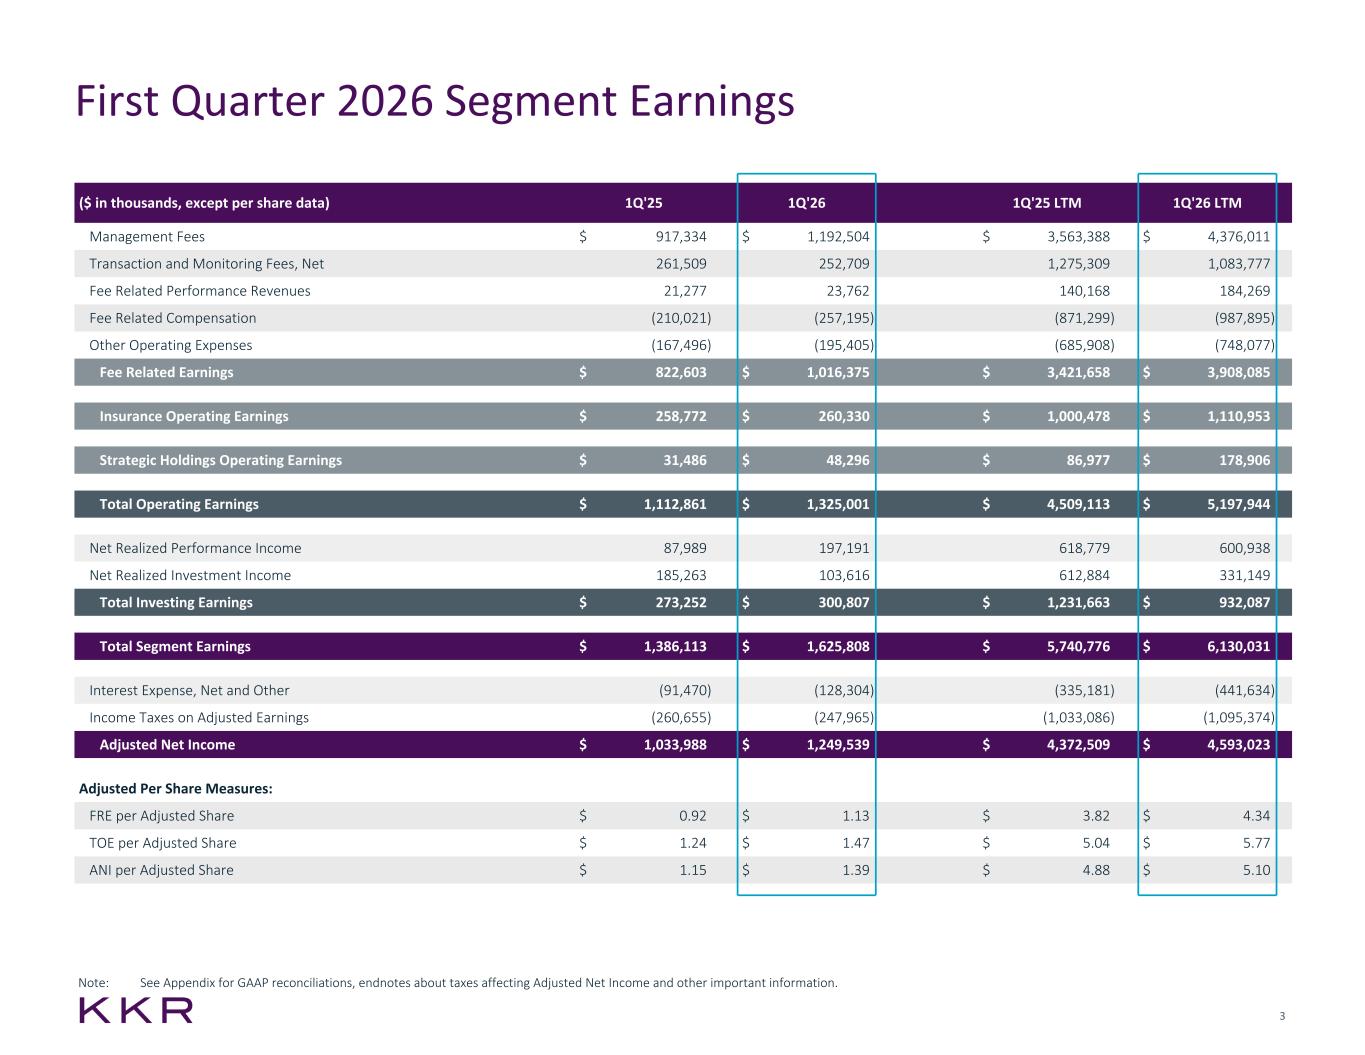
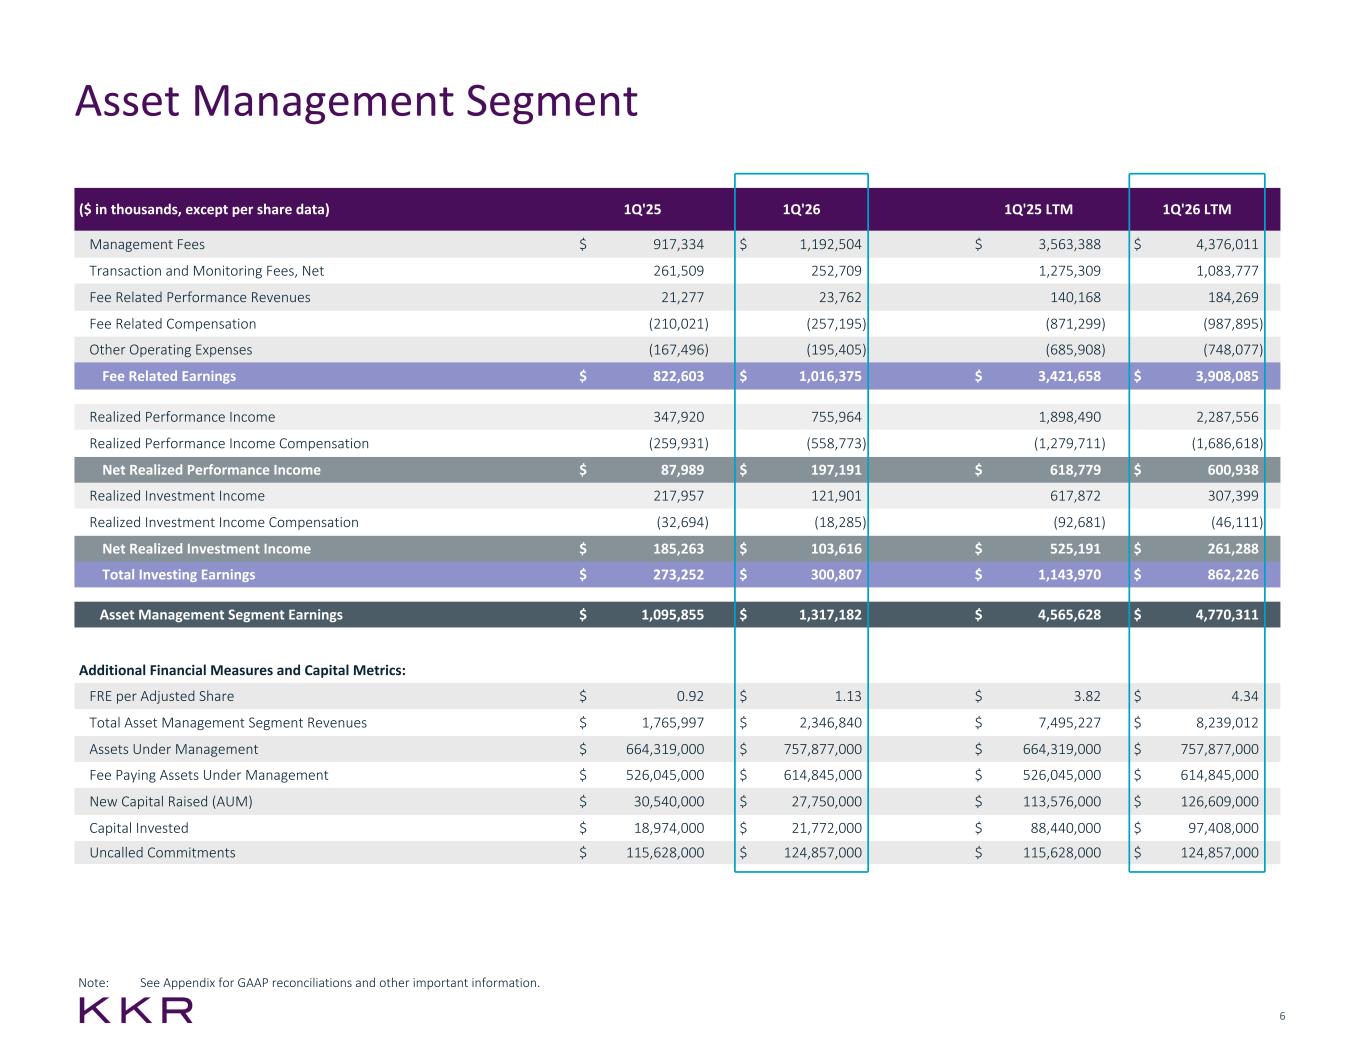
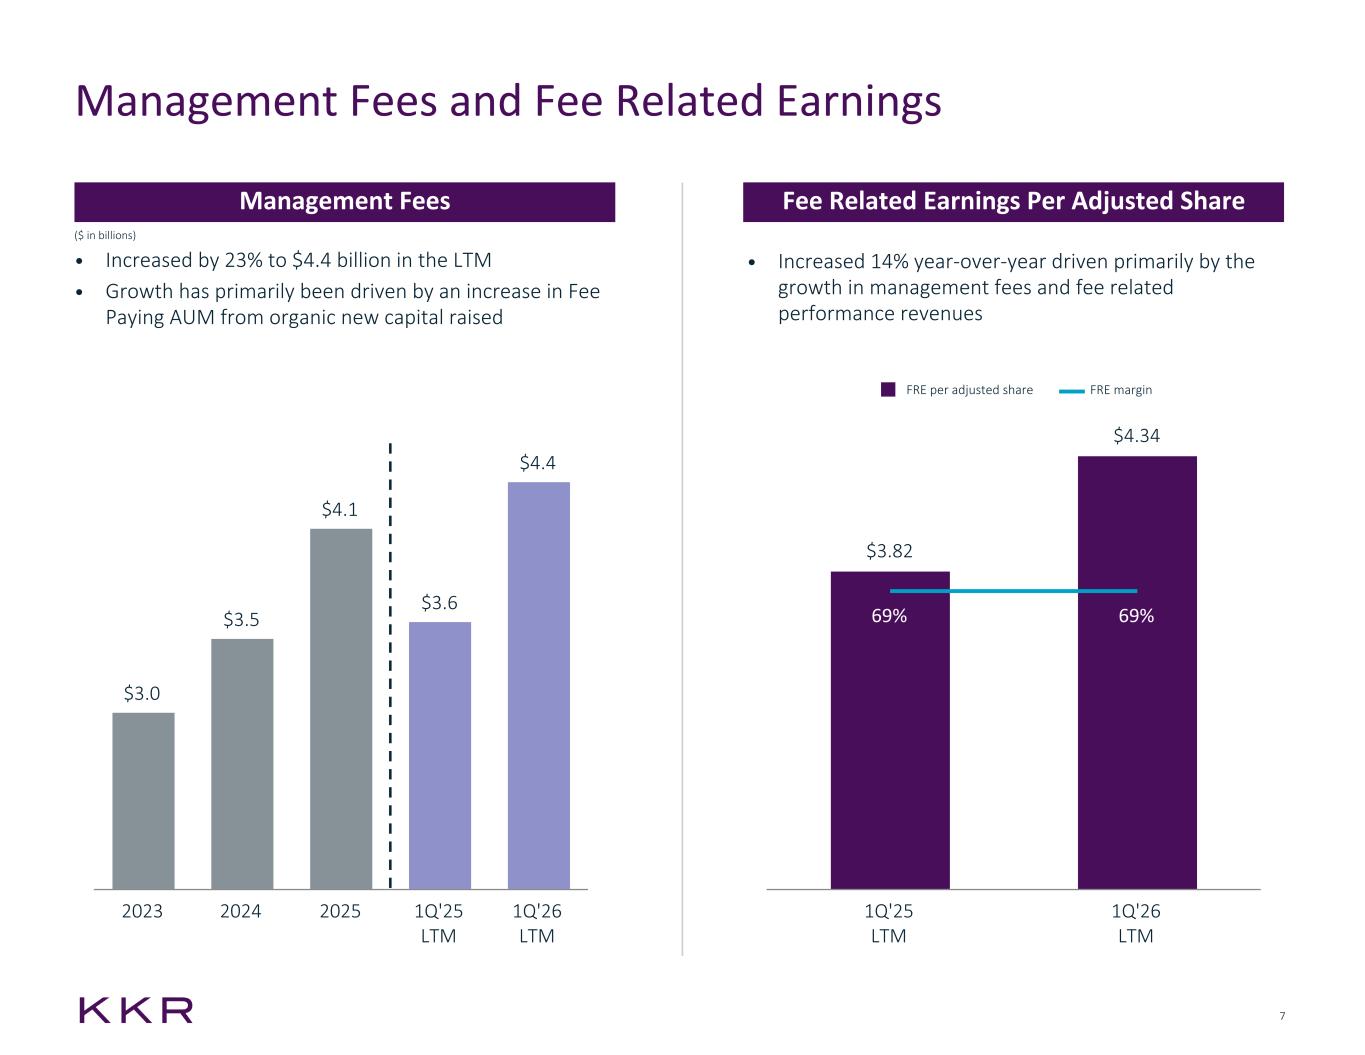
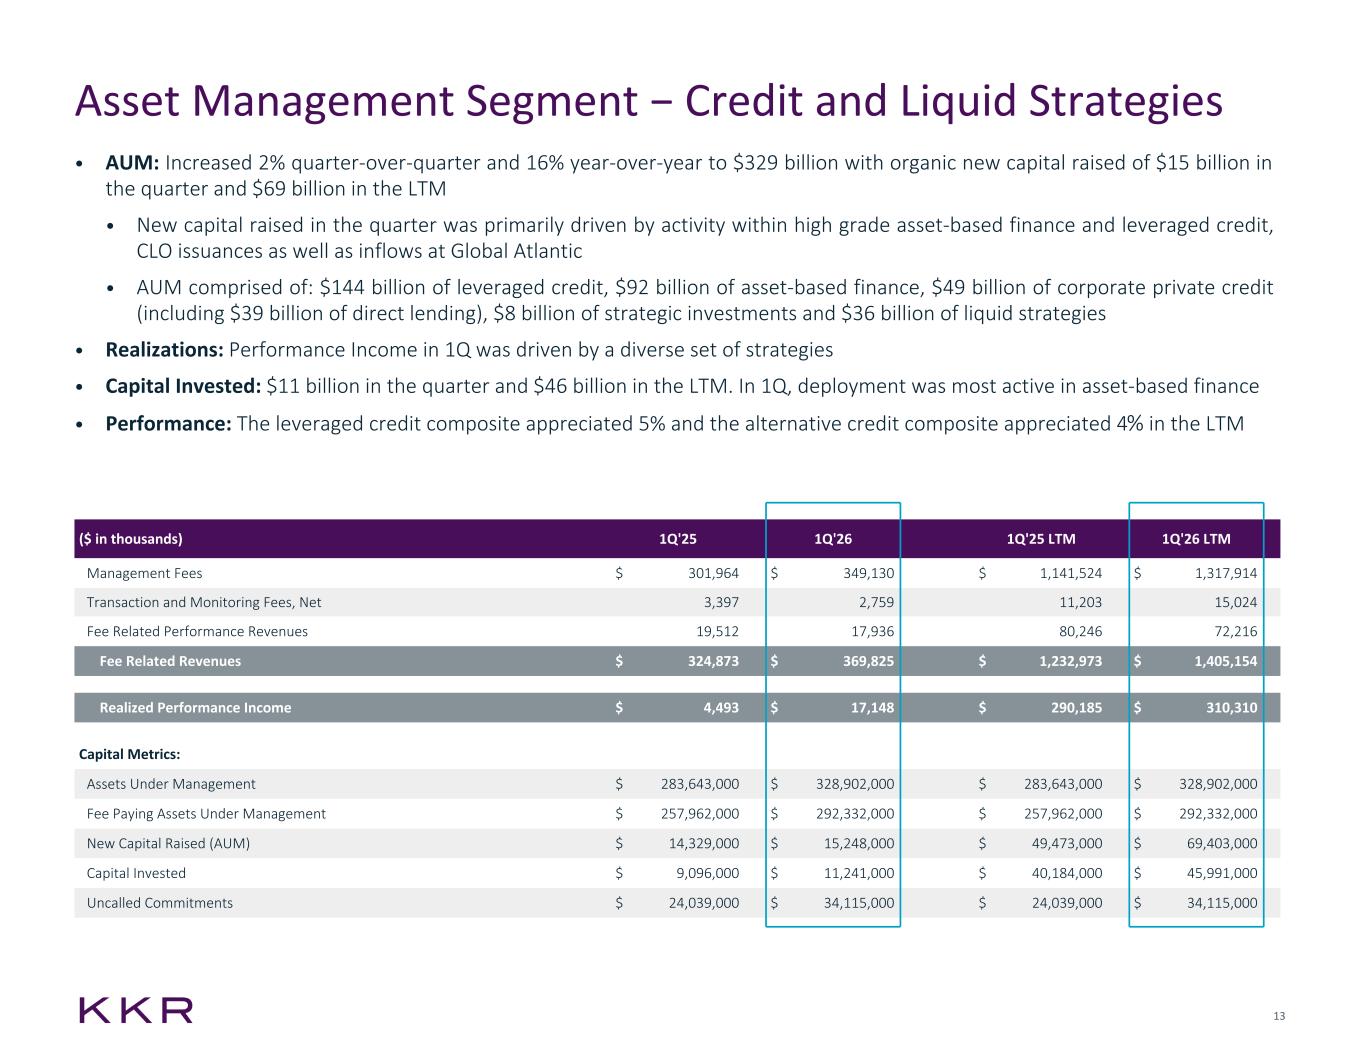
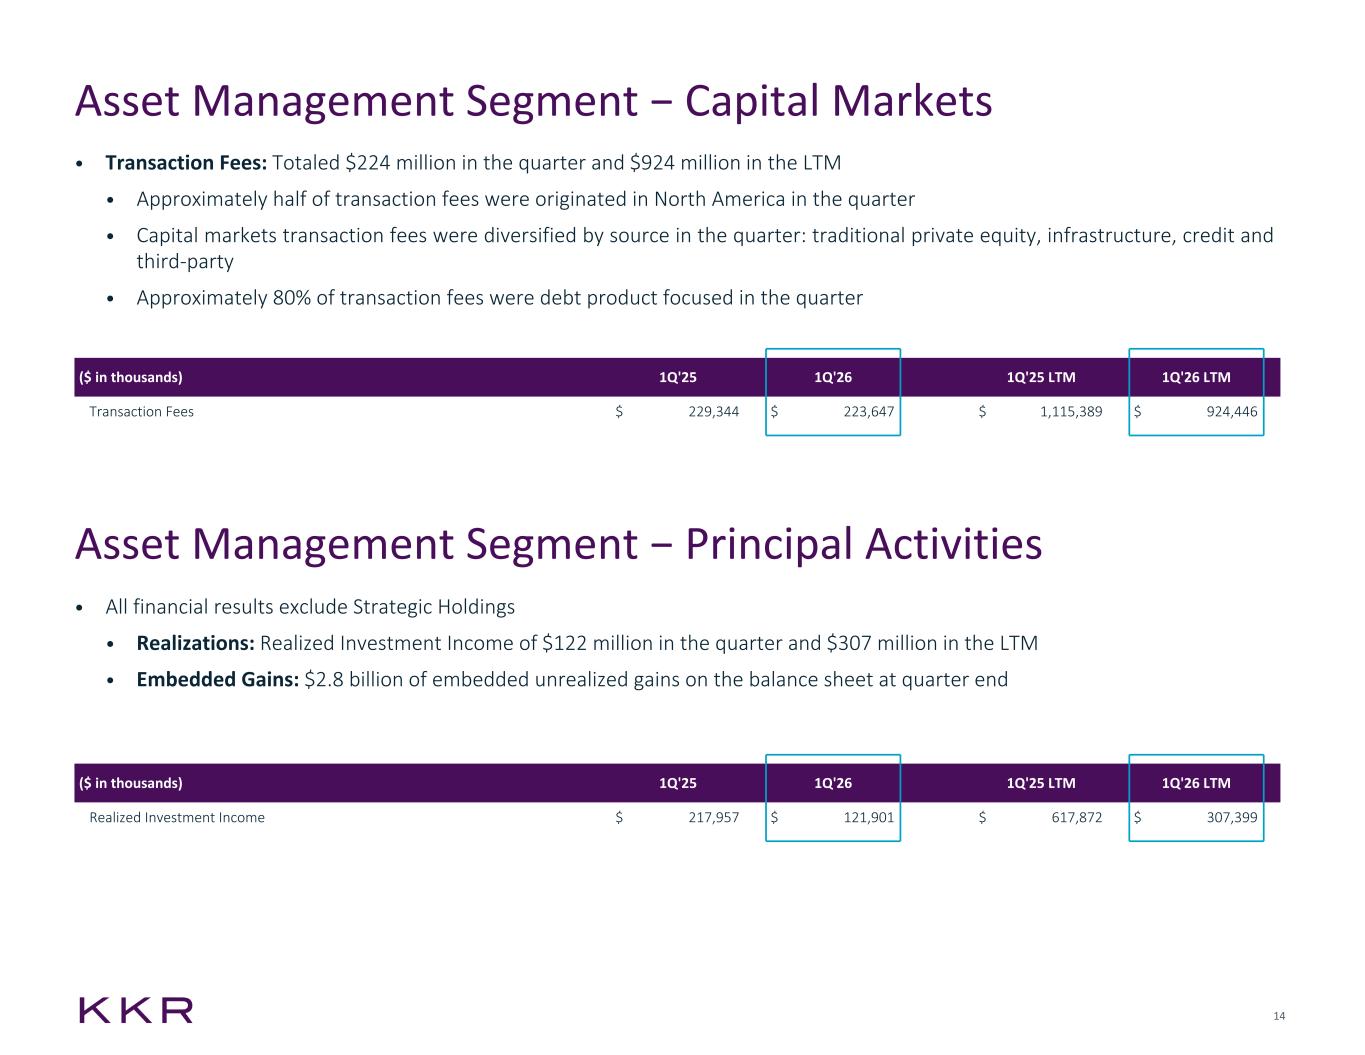
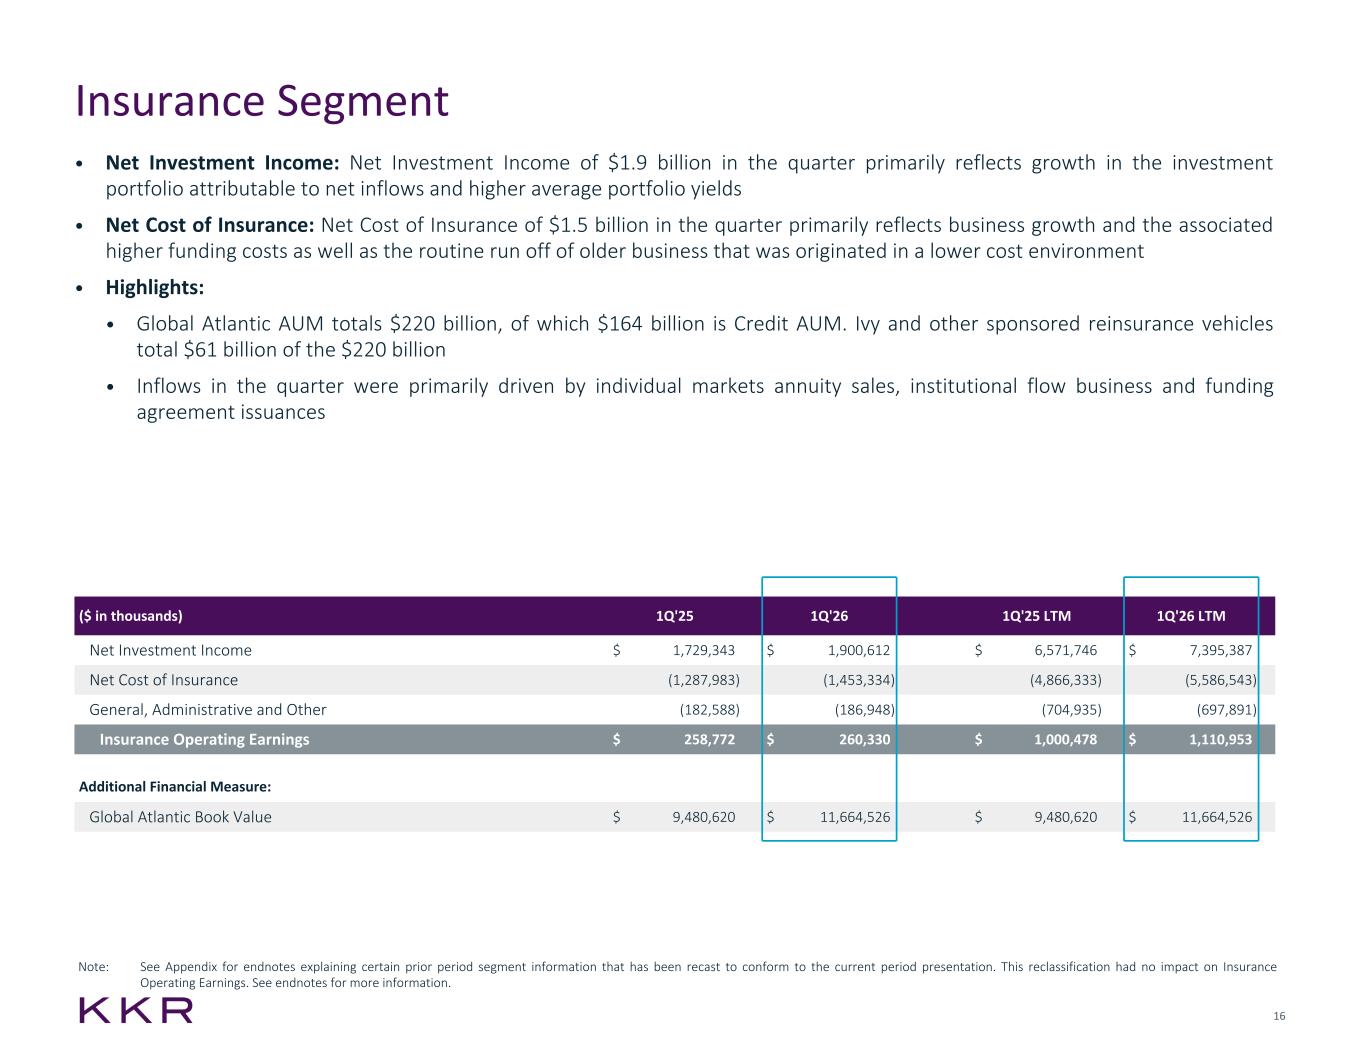
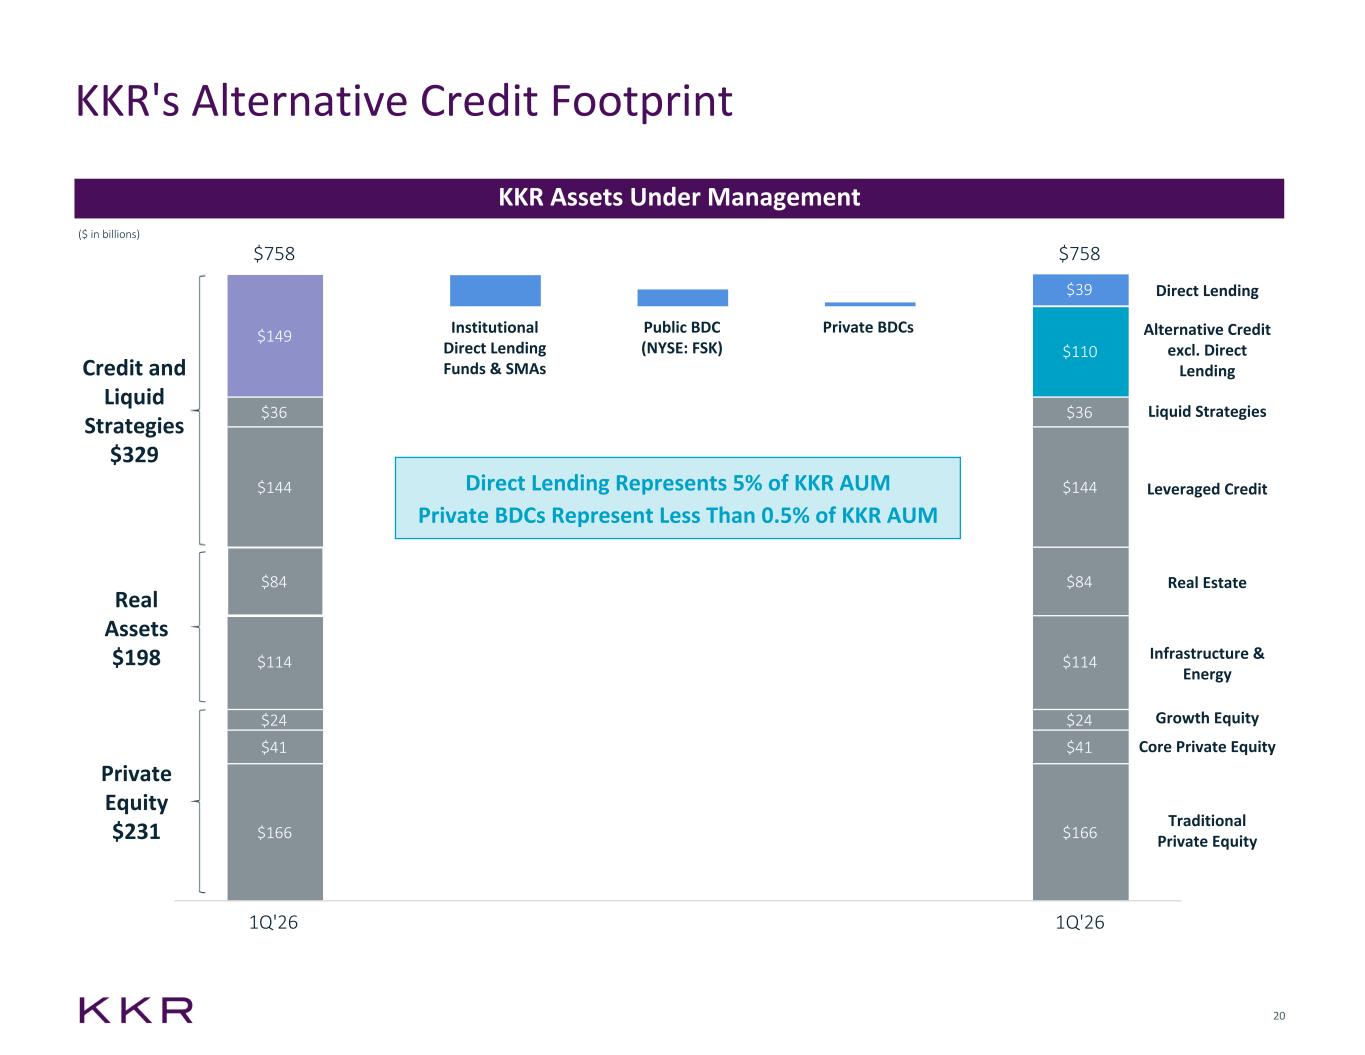
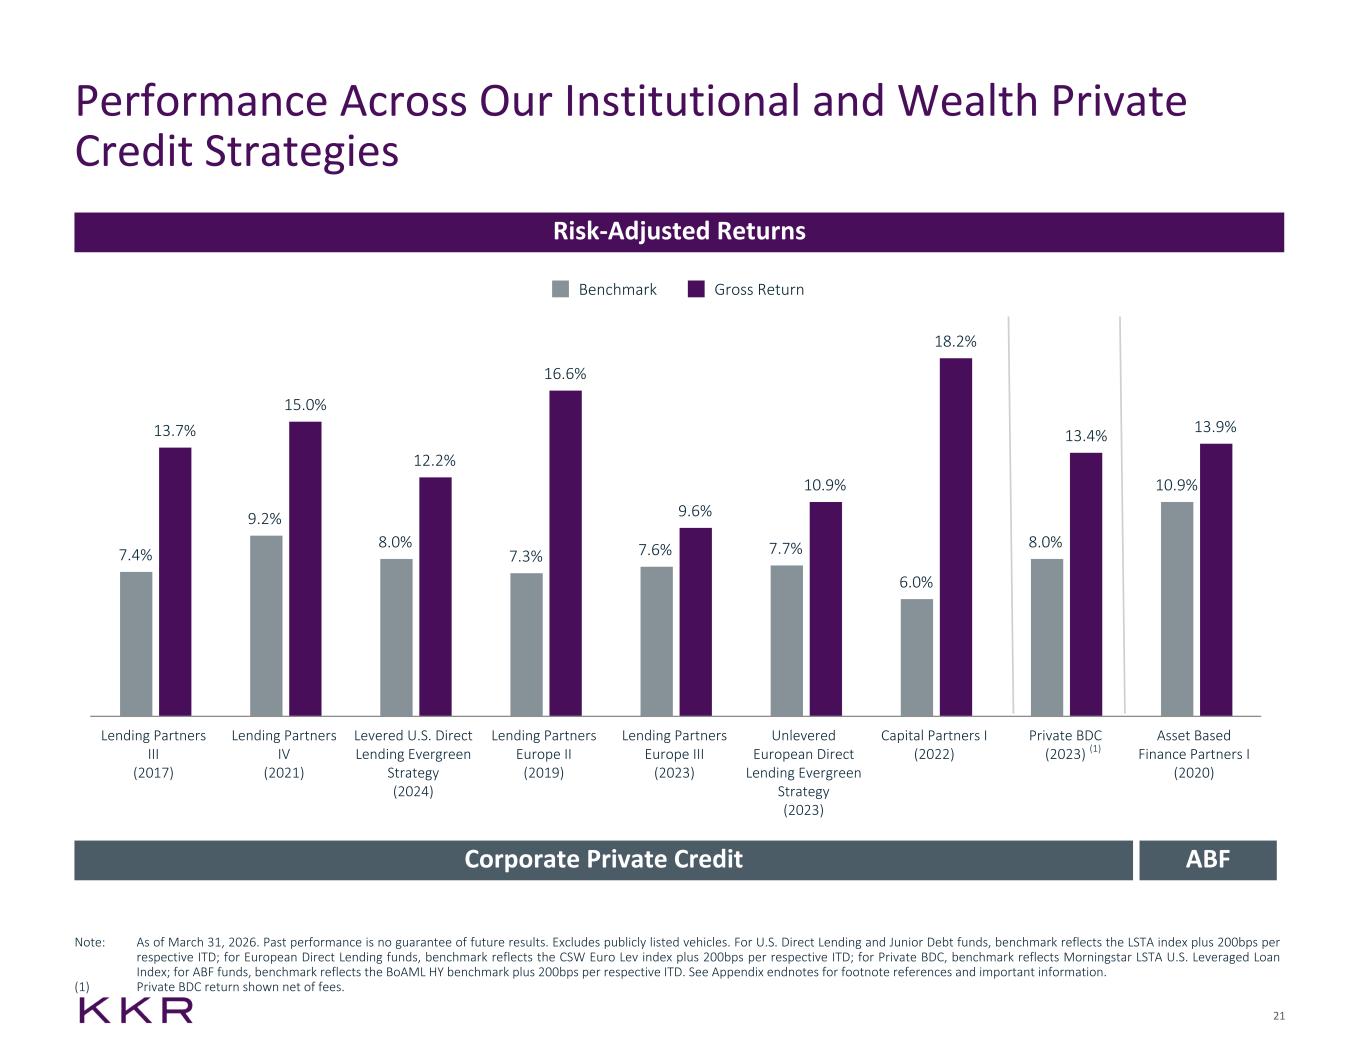
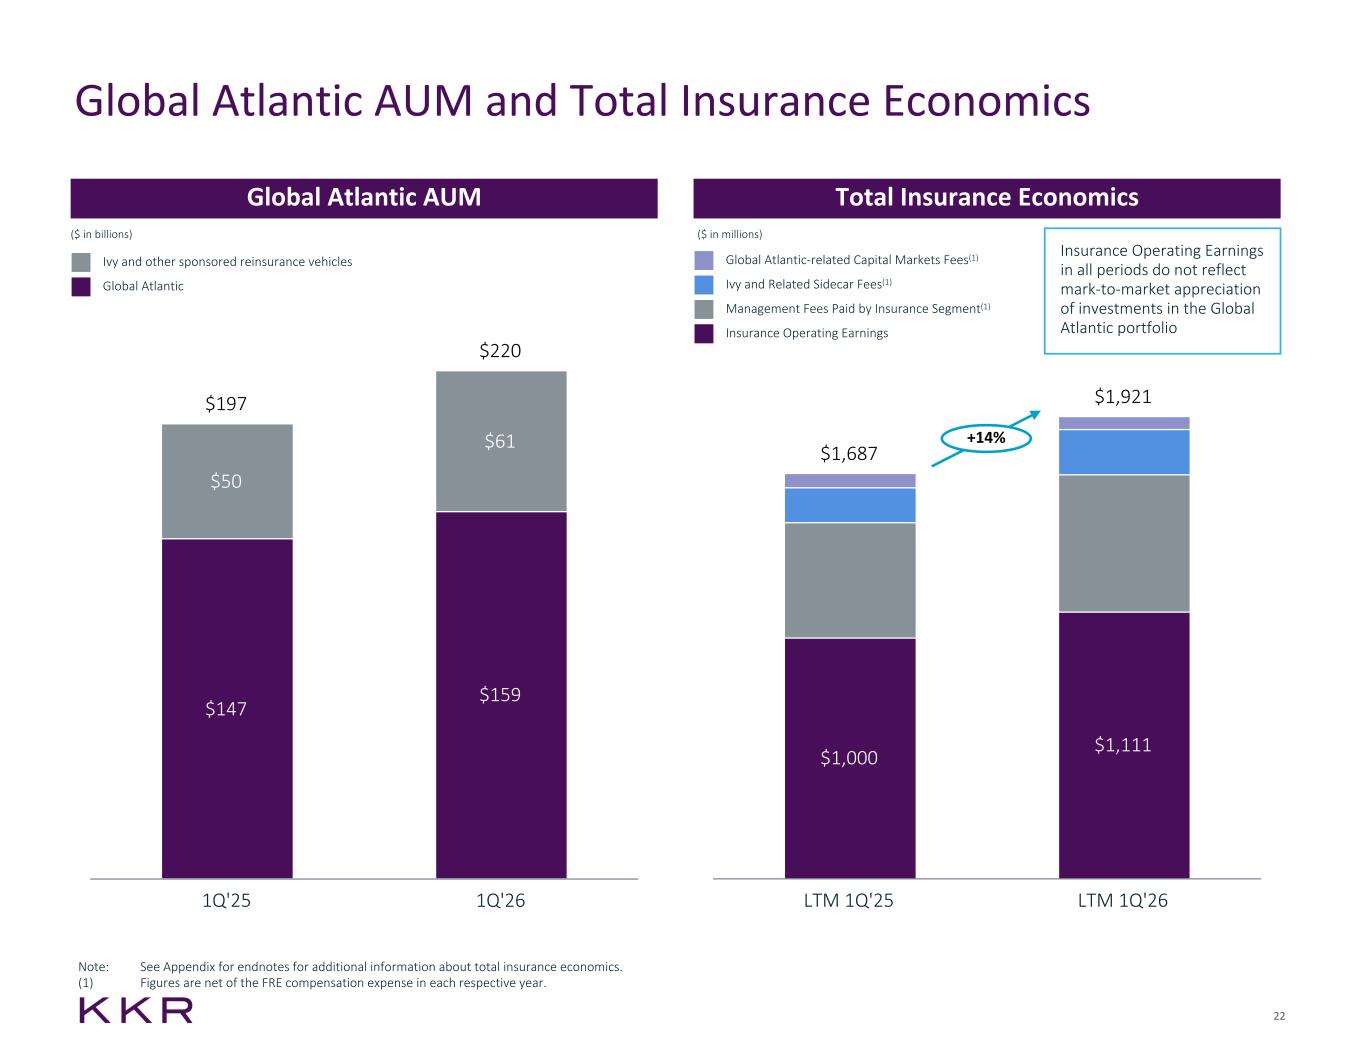
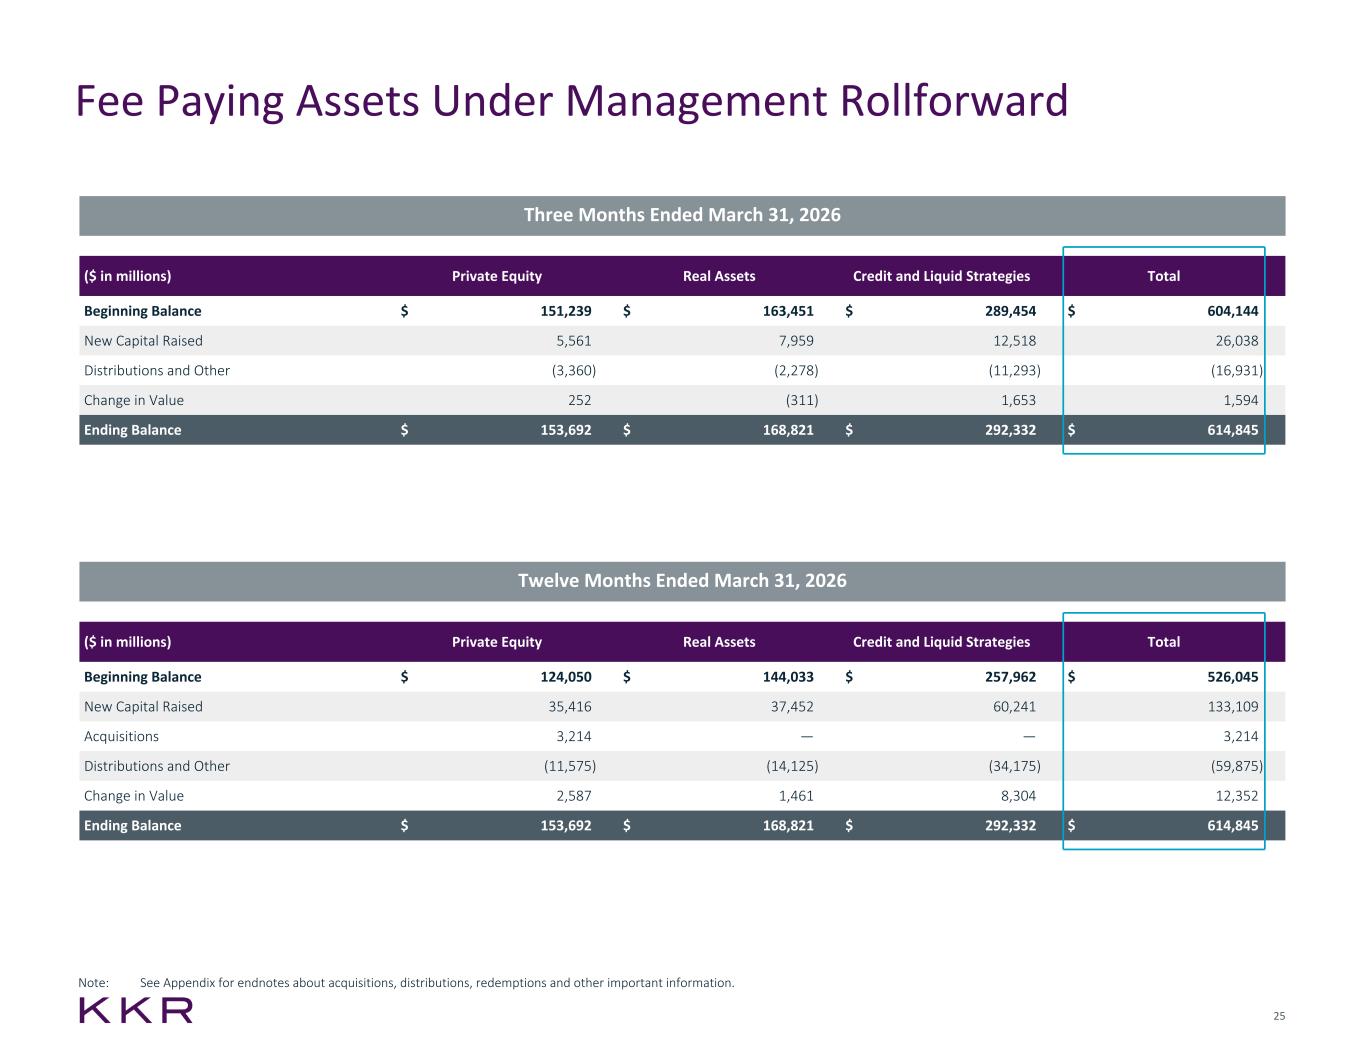
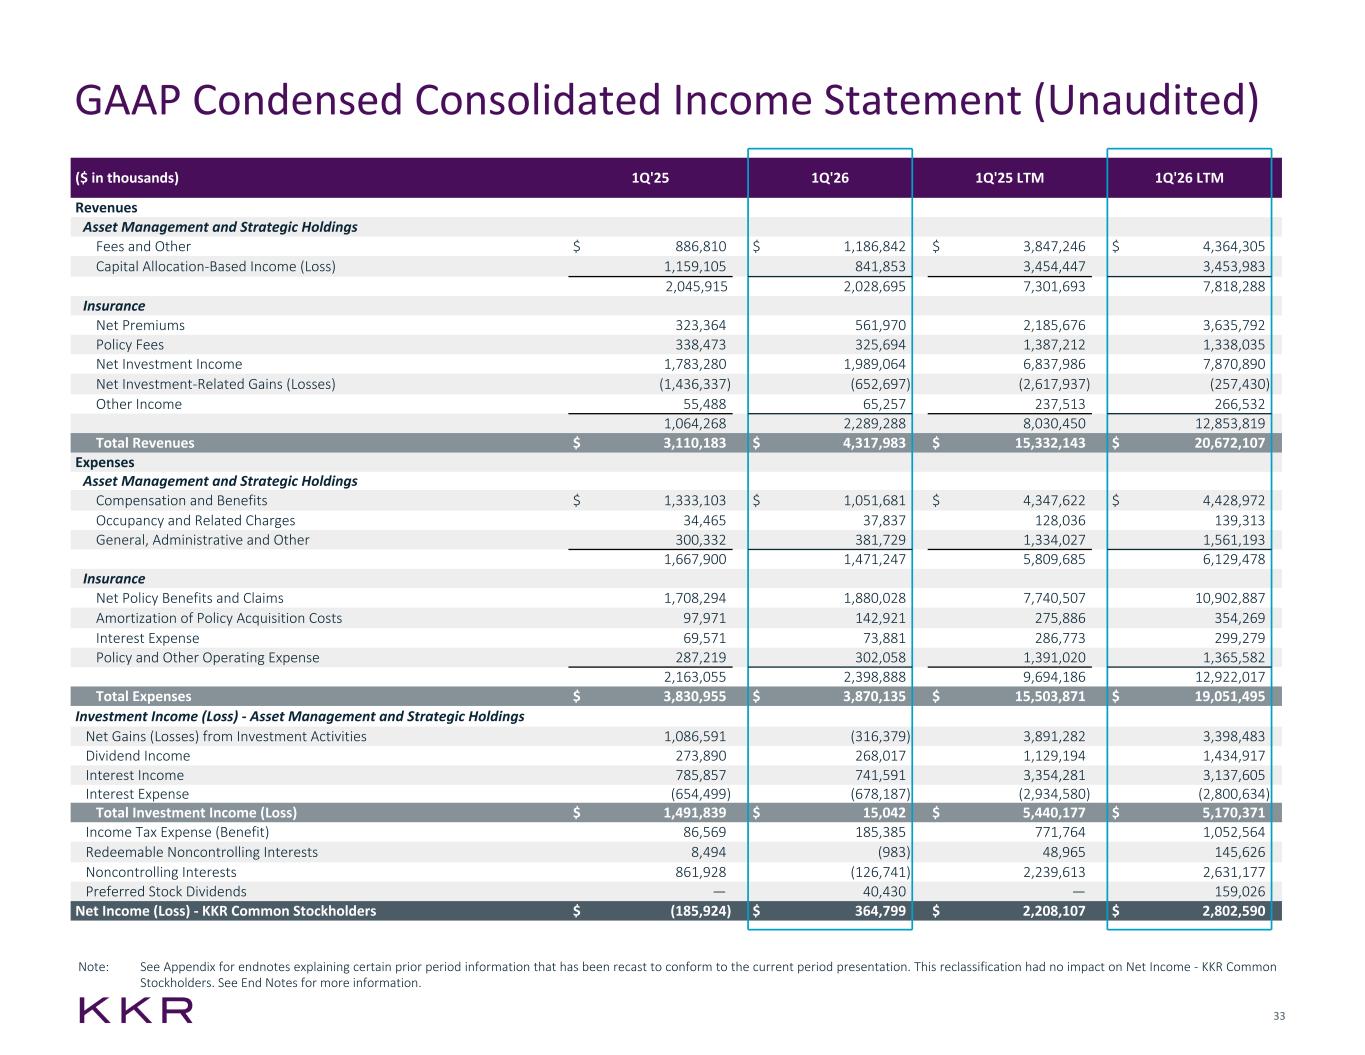
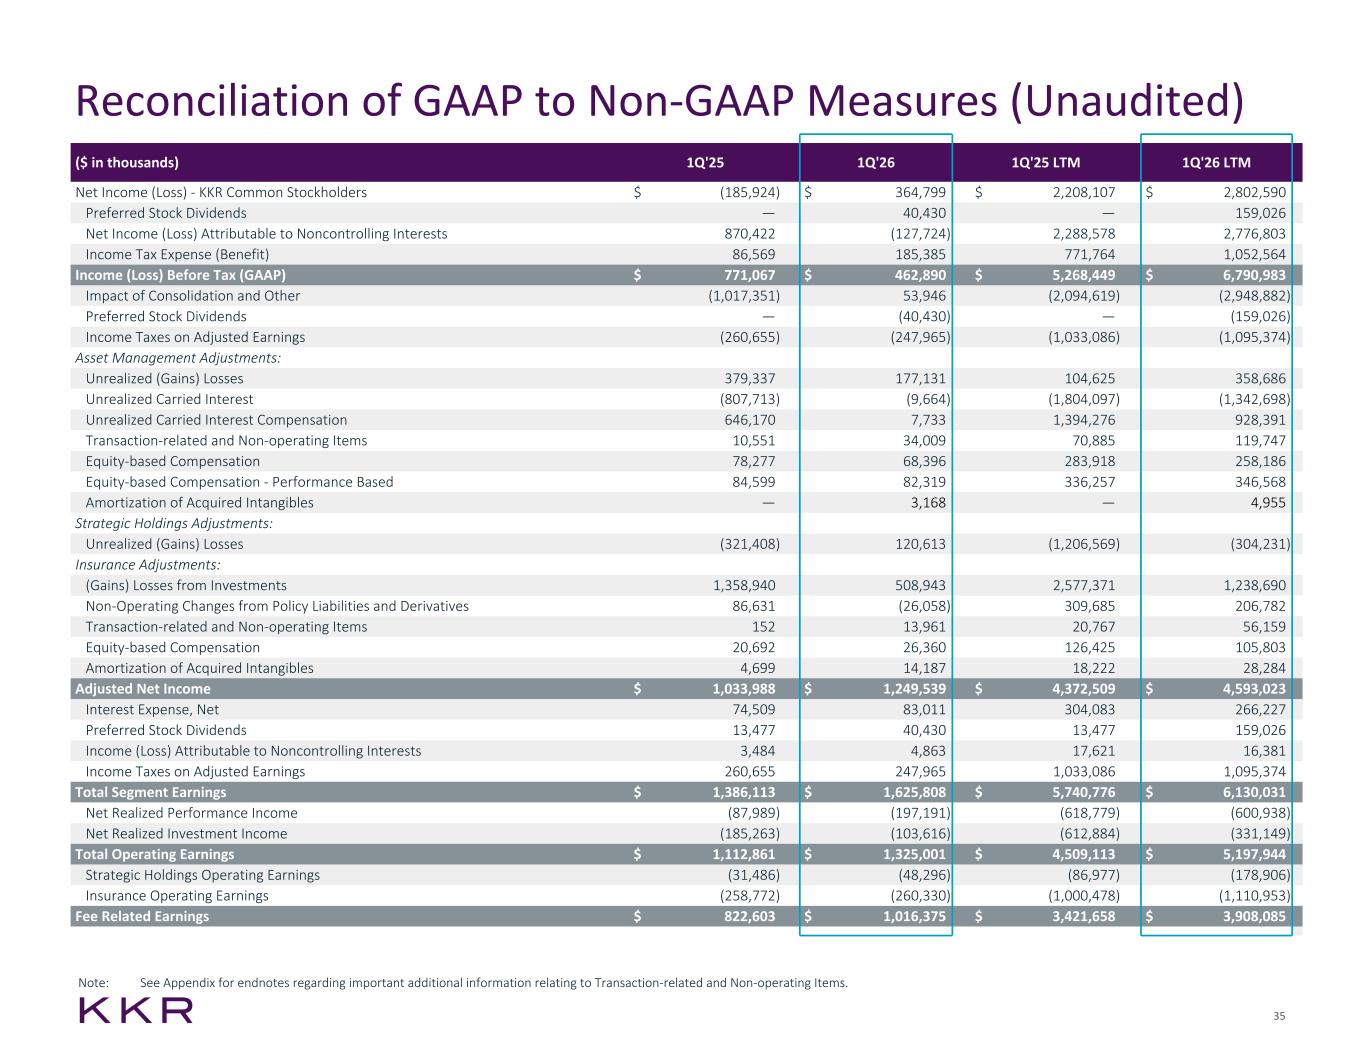
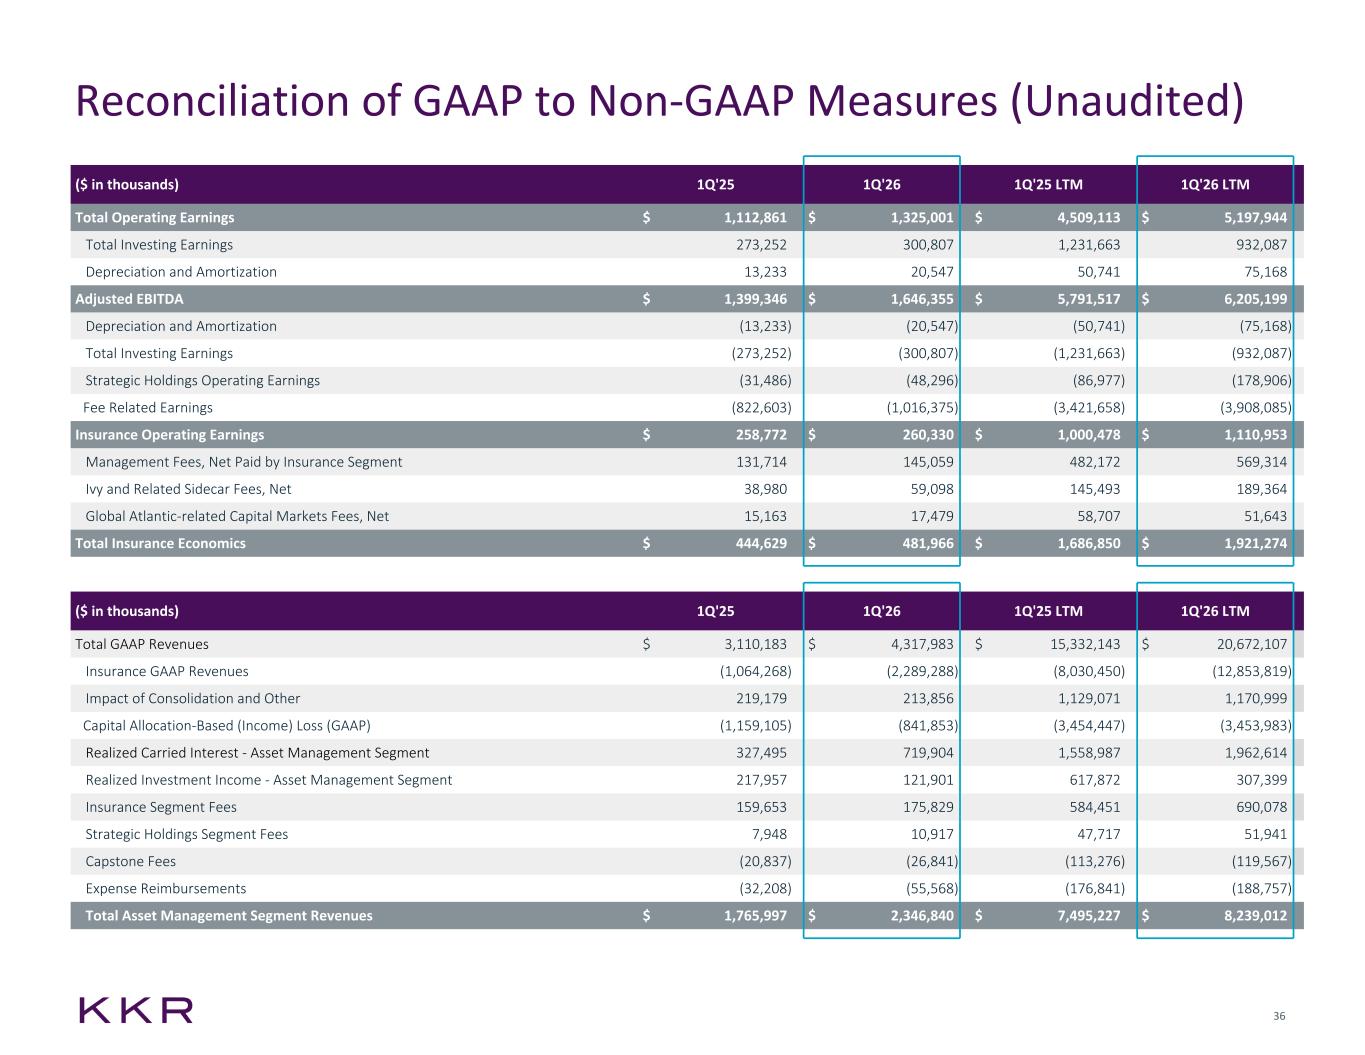
To our first quarter 2026 earnings call. This morning, as usual, I'm joined by Rob Lewin, our Chief Financial Officer, and Scott Nuttall, our Co-Chief Executive Officer. To find everyone that will refer to tap figures in our pressure share basis, this call will contain forward-looking statements which do not guarantee future events or precautionary factors about these statements. Earnings per share came in at $1.23% year-over-year, but 47% are up 18% year-over-year. An adjusted net income of $1.39 per share is up 20% compared to one year ago. All of these figures are among the highest. Going into a little more detail, management fees in the quarter were $1.2 billion, that year-over-year basis, driven both by continued fundraising momentum, alongside deployment activity really across the periods, management fee growth was strong. Previously, our fee base continues to be diversified, with each contributing approximately one-third of were $253 million. Markets fees were in line with last PE. Infrastructure revenues in the quarter were $24 million. Turning to expenses, Q1 fee-related compensation, 17.5%. Expenses were $195 million. So in total, fee-related earnings were over $1 billion. Insurance segment operating earnings were $260 million. Now as a reminder, we report the insurance investment portfolio largely based on cash outcomes. So to give you a sense of the insurance operating earnings would have been a significant portion of earnings alone do not of GA to KKR. Together, total insurance economics over the old holdings continue to track nicely towards our expected 350 plus earnings here expected to be more back-end weighted over $1 and even by these more recurring that you're seeing or $1.39 per share, including through this recent period with the gains that sit on our balance sheet across asset management and strategic $3 billion at third to one year ago, even as we've been generating healthy Now, as you can imagine, we've been filling a couple of pages to our earnings. If you turn to page Thornton Business for us, but in the framework of KKR, it's private BDC footprint, it's even smaller, around $3 billion of AUM. In terms of our public BDC, FSK is a little less than 2% of our HSQ1 earnings next week. We're not going to get ahead of that. It's important, though, not to conflate FSK with private BDC. All vintages since 2010. With historical practice, we increased our dividend to $0.78 per share on an annualized basis beginning with this quarter. In consecutive year, we've increased our dividend since we changed our corporate strategy to $0.50 per share to $0.78. And with that, I'm pleased to turn the call.
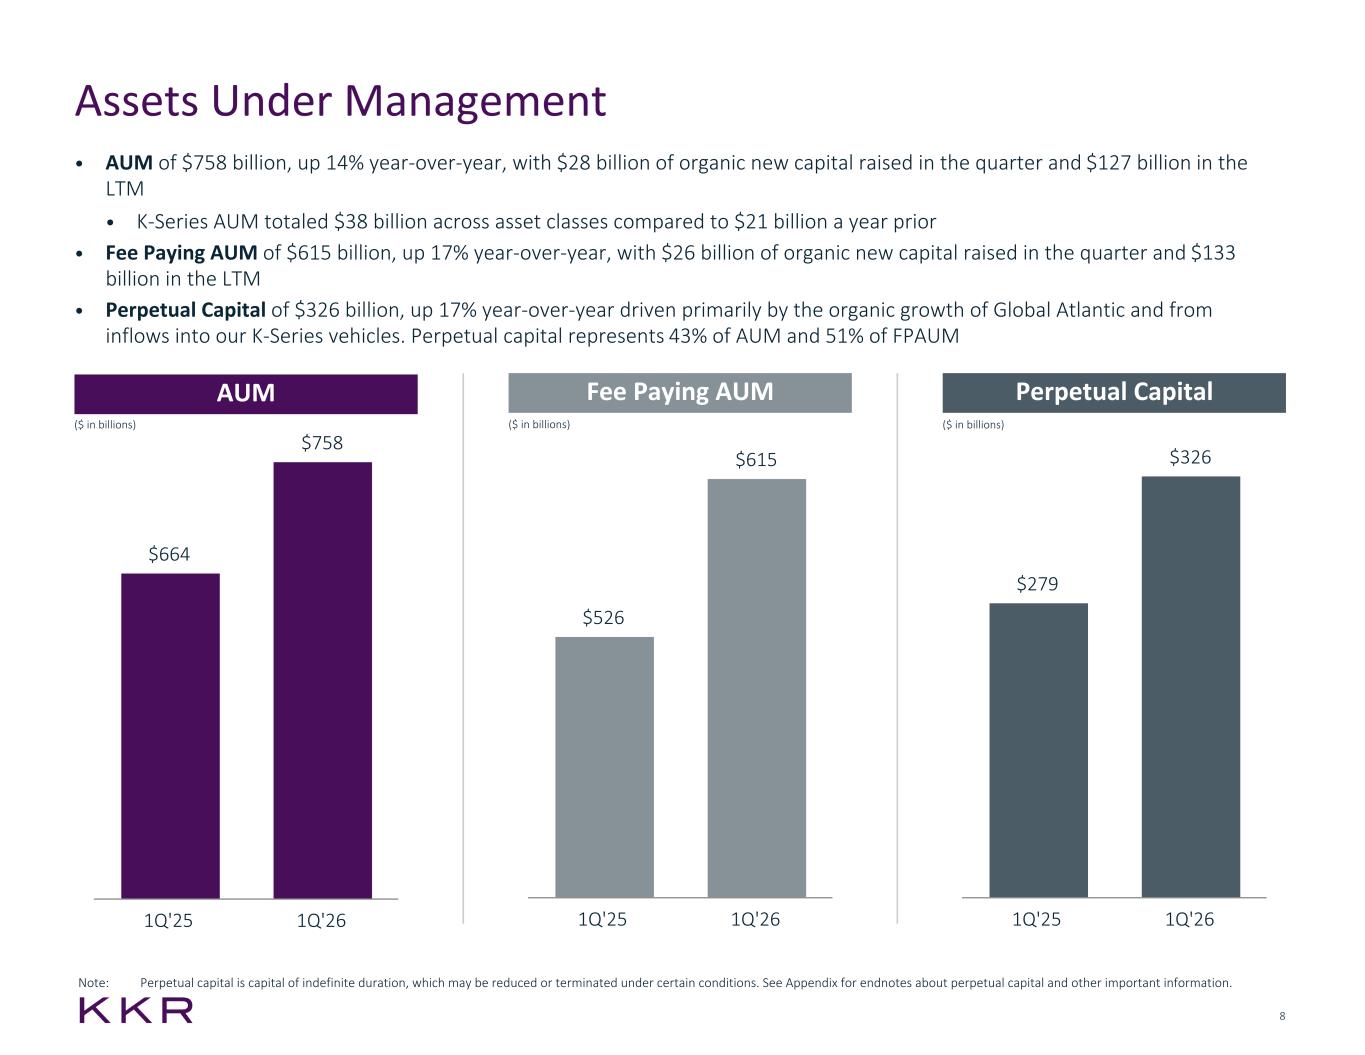
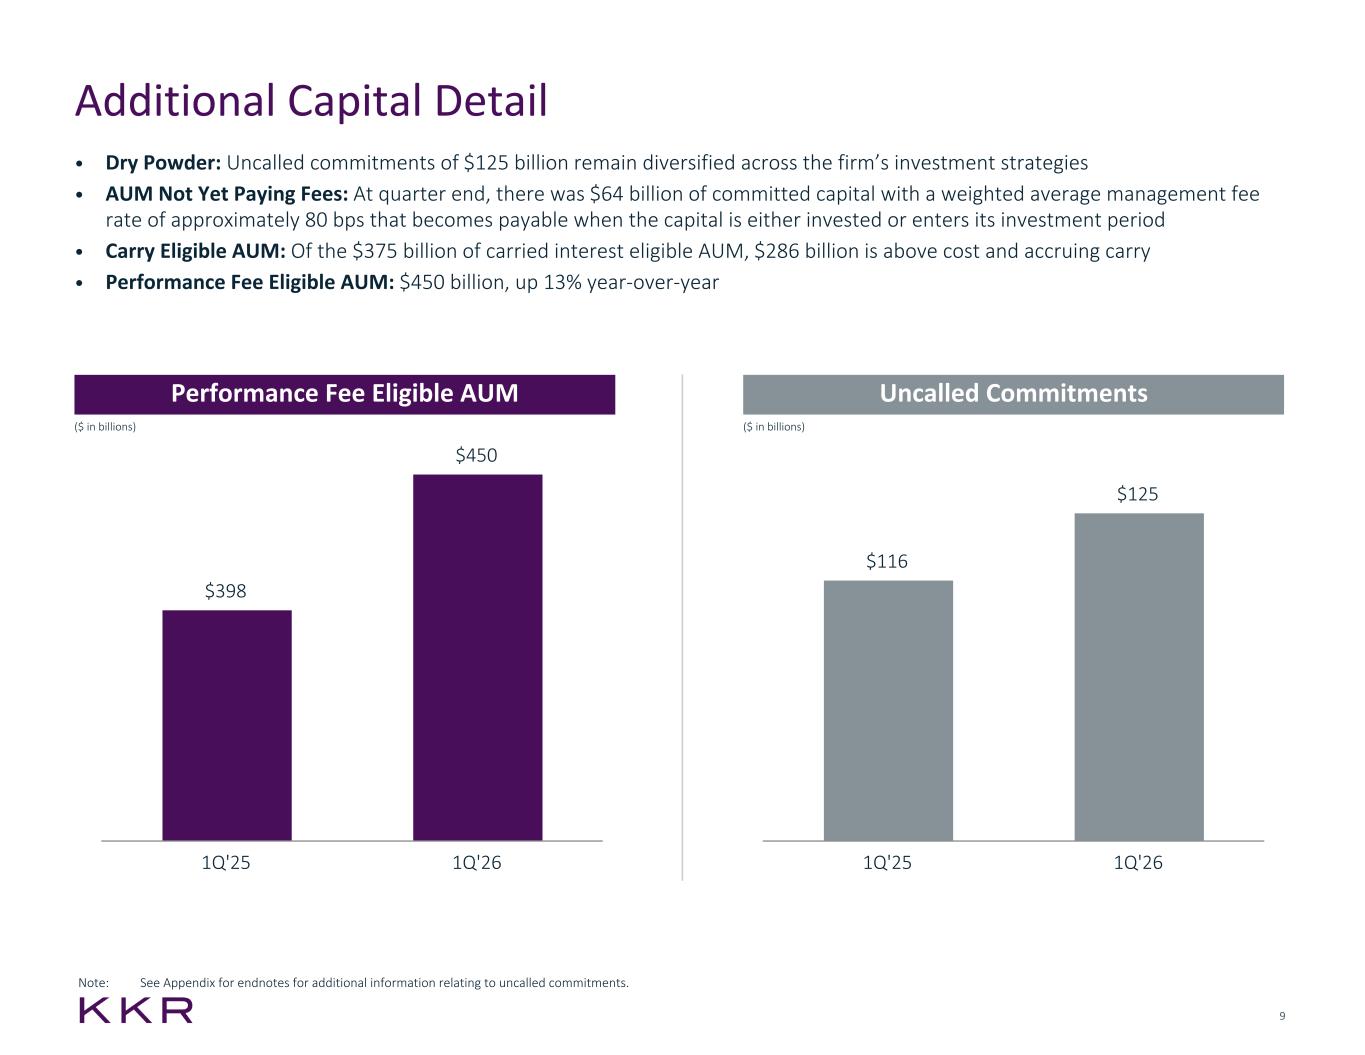
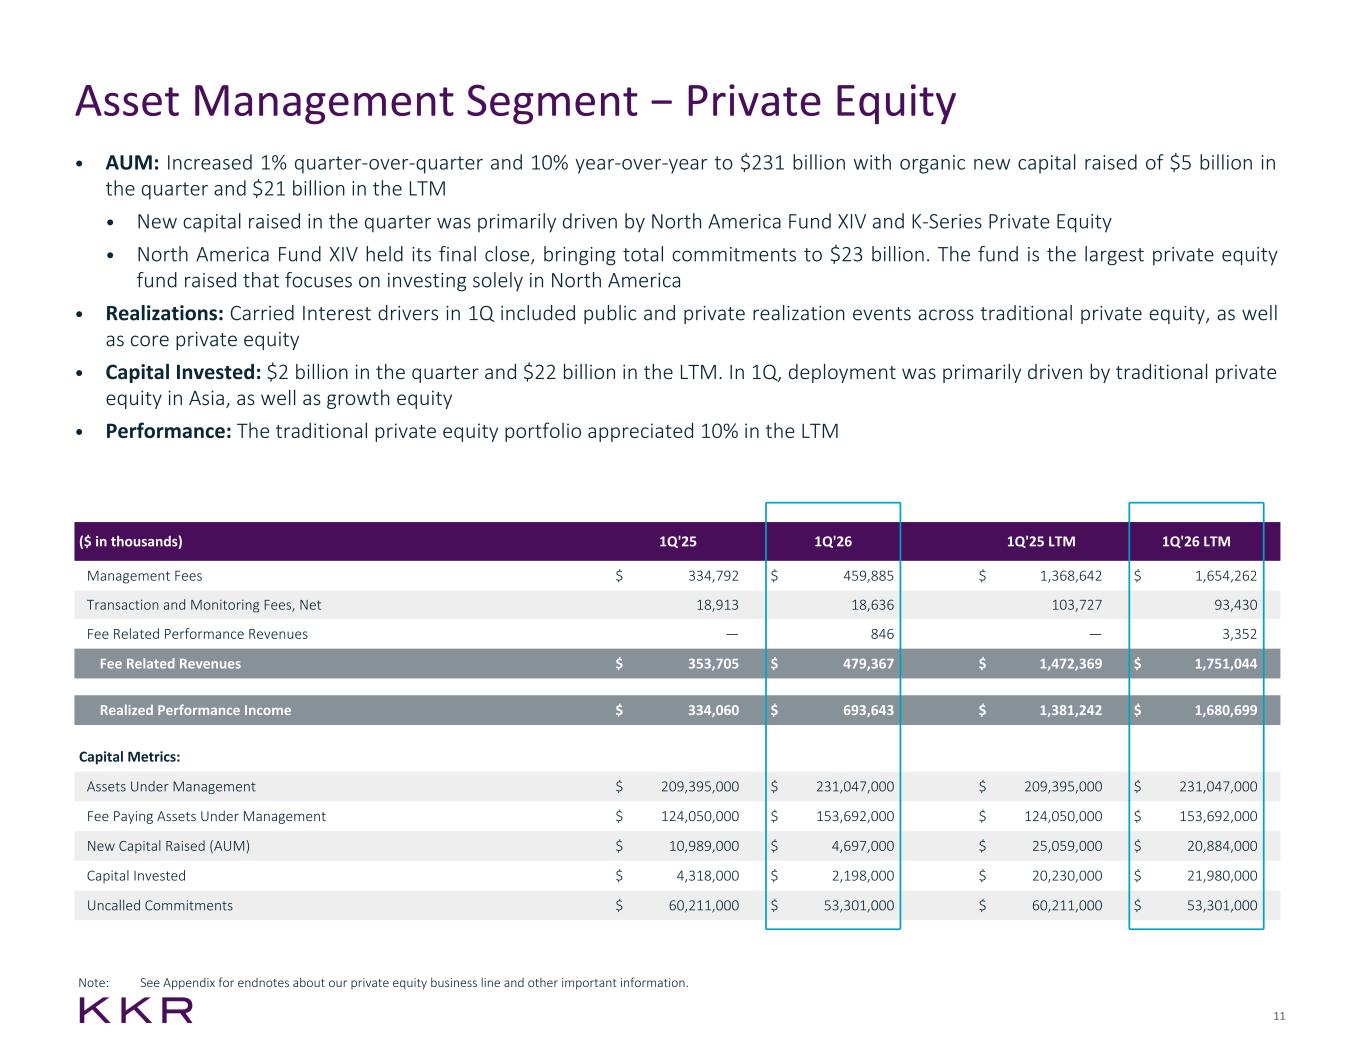
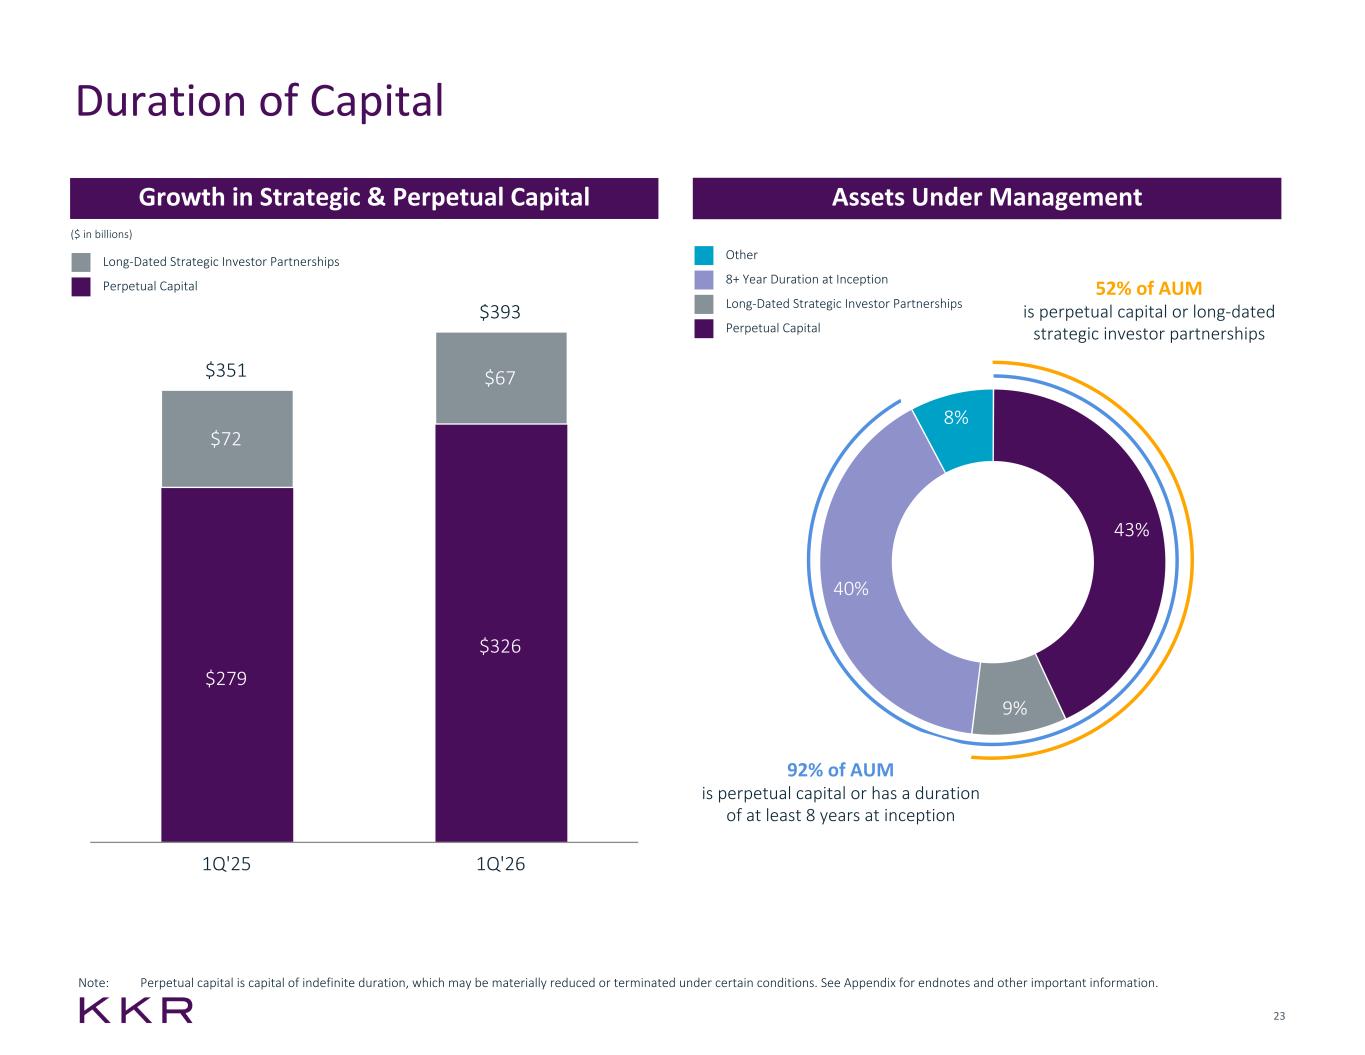
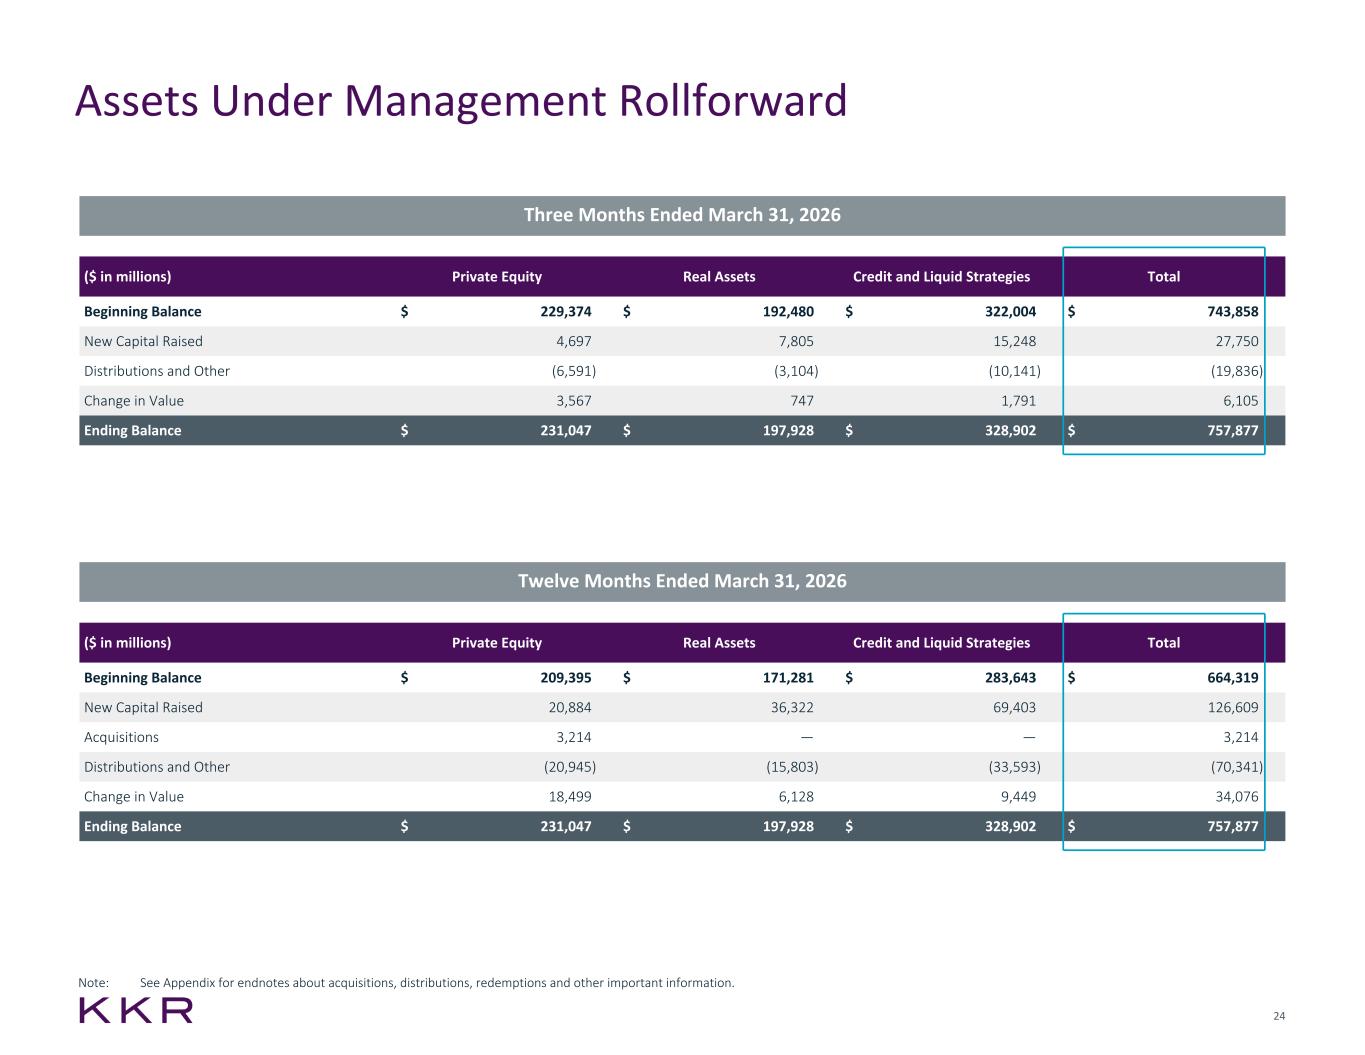
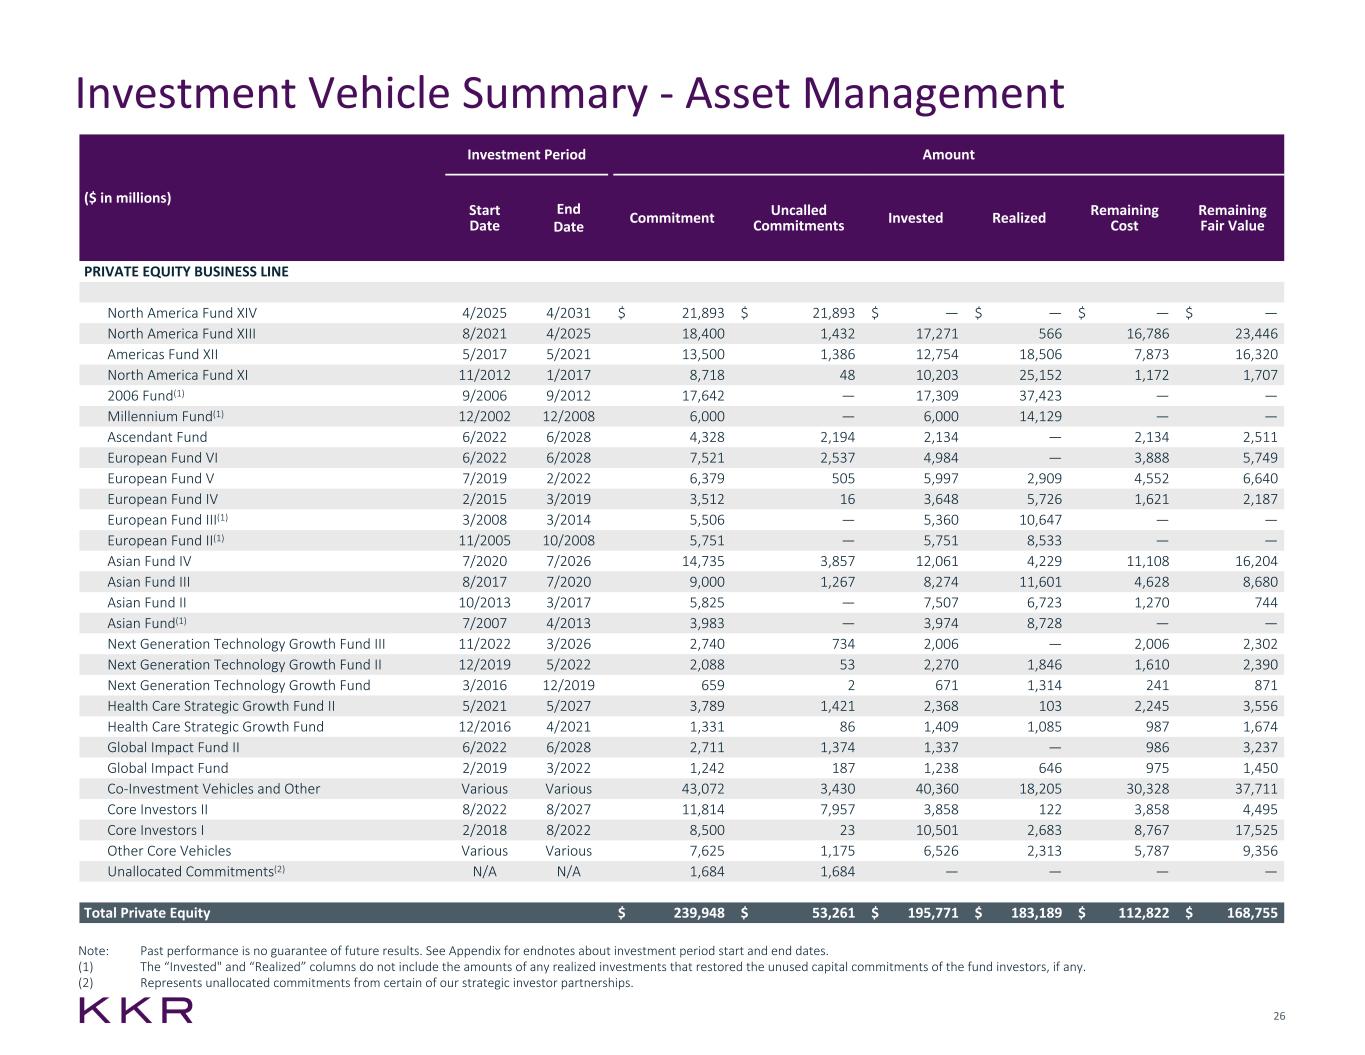
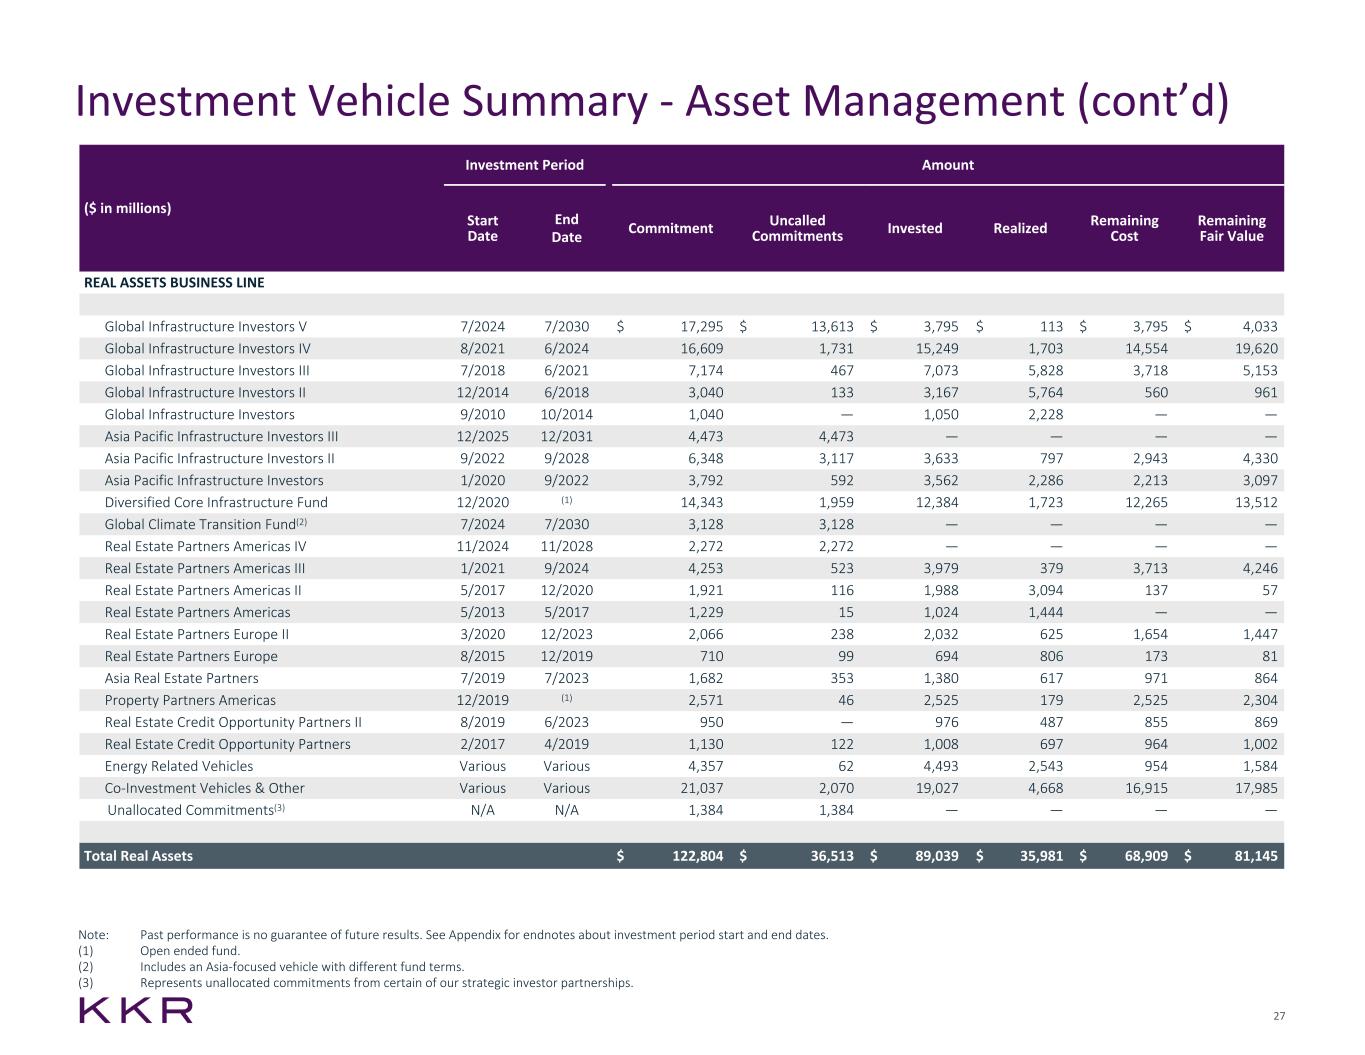
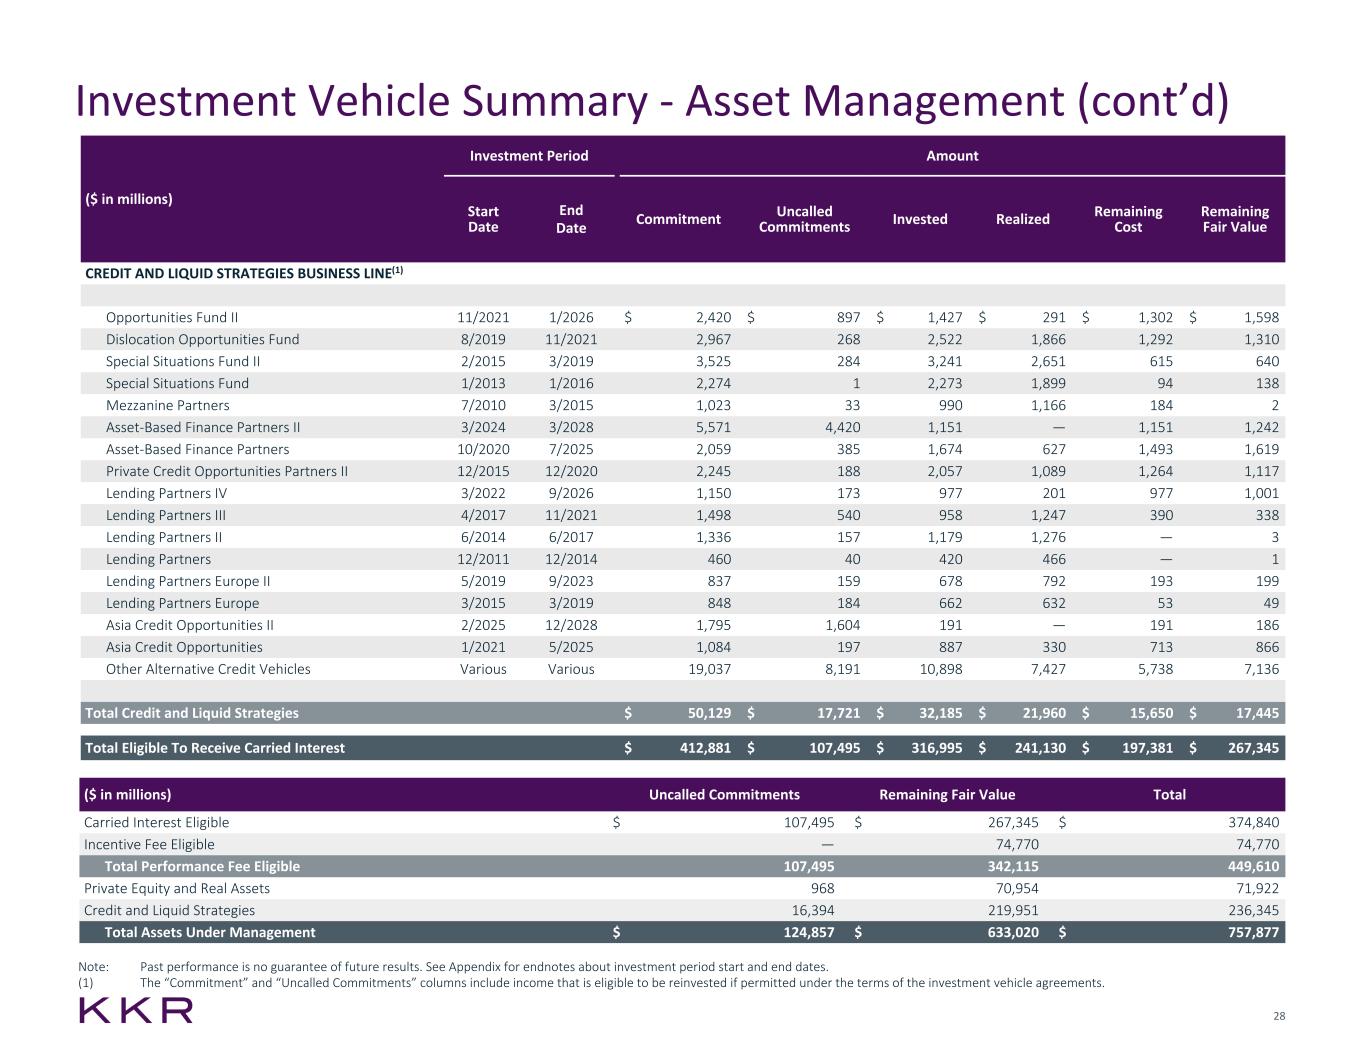
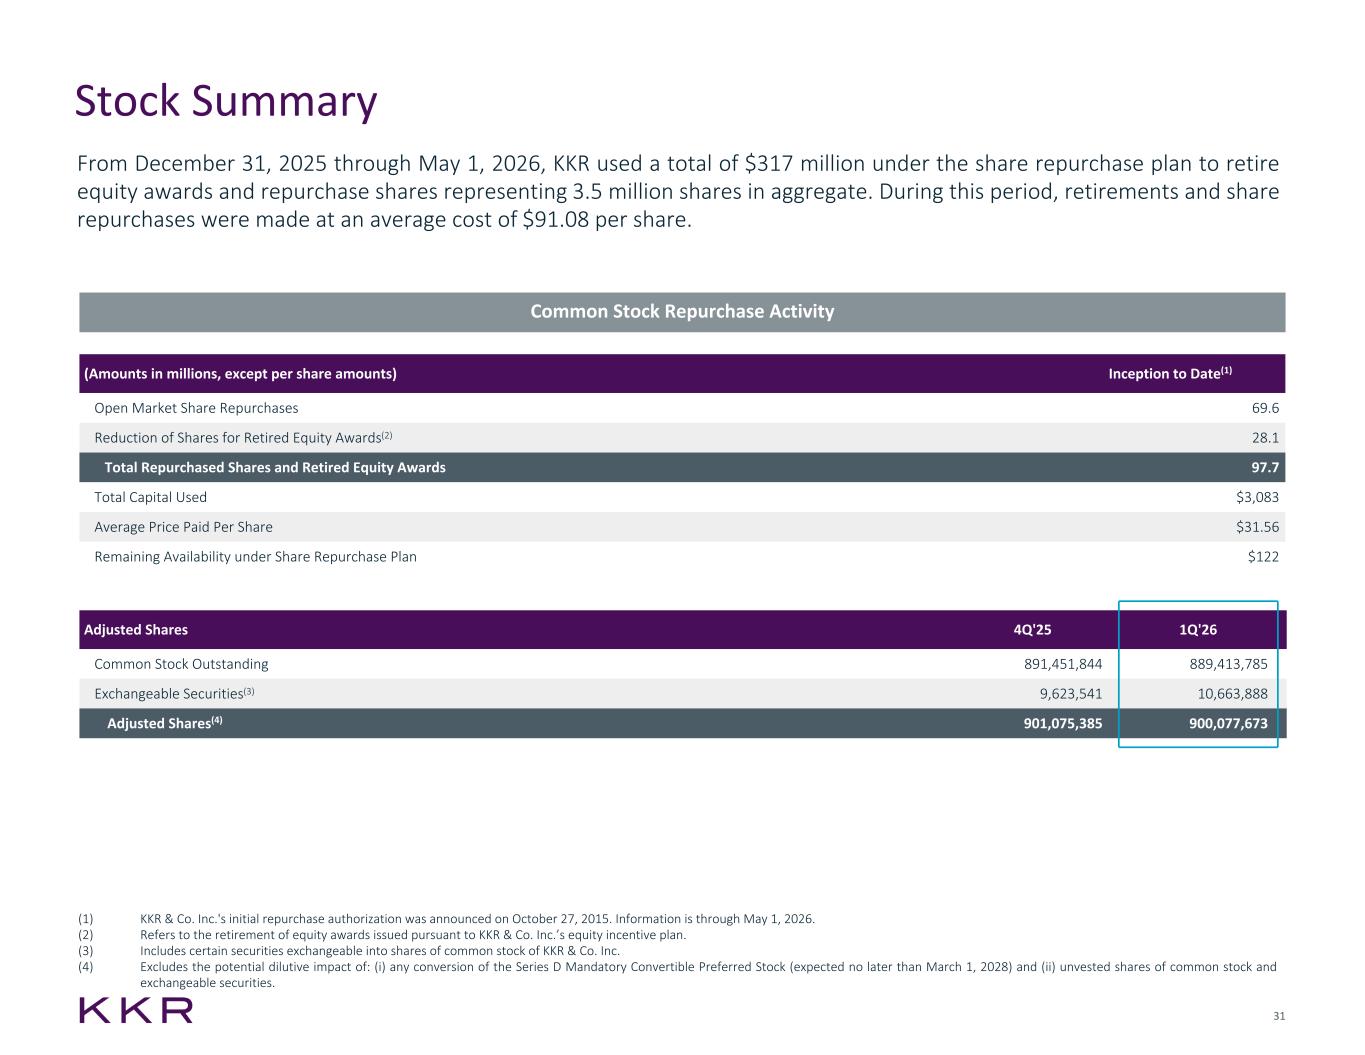
For four topics today, our continued momentum around capilluration activity, how we think about the earnings power of capital in the quarter. That momentum was driven by our asset base over $90 billion of AUM today. Given the current sentiment around private credit, it may be surprising that when you look at new capital rates, fundraising quarters, inflows here more than doubled. Pipelines remain strong. Rebound interest from institutions around our direct lending business, with several viewing the current dislocation as an interesting entry point given the redemption activity that exists today in the private closing of our North America 14 fund at $23 billion, eclipsing the prior $19 billion fund. Across the most recent vintages of KKR's flagship region, Americas plus Europe, we have $46 billion. A series suite brought in $4 billion of capital in Q1, and AUM now stands at over $38 billion. Performance, deployment, and capital raising continue to be in line or ahead of the strength of flows in Q1. Flow down in Q2, consistent with what we saw after the tariff announcements last year. We're still operating off of a relatively low base of AUM, and we continue to believe that this channel will be a long-term source of meaningful growth for our industry, focus on linear deployment and portfolio construction. You can see our continued monetization activity in our financial results. As Craig noted, we generated around $880 million of monetization revenue in the quarter. Realize carried interest was $720 million. That is up 120% year-on-year, and we have a healthy pipeline of realizations across sale of OneStream software for four and a half times our cost, and the sale of CoolIT Systems, a global leader in liquid data center cooling, for almost 15 times our cost. We have also agreed to sell two of our 2021 investments, despite the more challenging vintage year. One in infrastructure, nearly two times multiple of money, and one in traditional private equity at nearly three, just secondary of our remaining shares in Hyundai Marine Solution in Korea, resulting in a seven plus times multiple of capital for the full life of that. I'd like to next shift to capital allocation. We have been making some important four key tools available to us, strategic M&A, insurance, strategic holdings. Each of these tools takes full advantage of the KKR ecosystem of the potential for a high specific amount of capital spend into any one of these areas marginal dollar of cash taken to capital allocation and it is one that is highly aligned with our shareholders continue to do so in the future starting here with strategic M&A this morning we announced the closing of our acquisition of Arctus 16 billion of AUM and 10 billion of fee paying a confident that we will it is hard to find a better allocation of capital continue to see increased levels of competition here particularly in the retail channel alongside tight spreads on the asset side and a lot more selective in that channel a bit more recently we are starting to see a more attractive where we leaned in this quarter returns given the volatility across our we repurchased or retired 317 million of stock this year through may 1 91 dollars by an additional fund our long-term prospects and a and i around 20 year on year we continue to feel great about and the earnings power and visibility into future over 90 of our capital is perpetual or committed for eight years or more today we have a hundred uncalled capital nearly as much as we've had at any point in our history looking at our management fees and fee related earnings over the ltm we've grown at a high-teens CAGR over the last three years. Alongside this growth, the quality of these fees has significantly improved as we've diversified by strategy and geography levels in our history, and they provide a lens into the strength of our portfolio and durability of our earnings that we are seeing across the business. We continue to feel very confident in our ability to fundraising, strategic holdings, operating earnings, and turning to A&I. We entered the year expecting 2026 A&I to reach seven plus dollars per share, assuming a constructive and more normalized monetization year-over-year. But one that we did have line-of-sight to in the environment four months into the year has, of course, been more challenging than what was embedded in our plan. Revenues in Q1 were up more than 50% year-on-year, and when we look at exit, signed transactions expected to close in the coming quarters, that represents over 1.2 billion. Notably, while we continue to generate very strong outcomes visibility today, handicapping our ability to reach $7 per share, we do think it is more likely that we land below that level. That impact 2026 would not be lost, as we would expect them to shift to 2027 and beyond. The portfolio remains in very good shape at record levels. The earnings power of the firm continues to grow at an attractive rate.
Thank you, Rob, and thank you, everybody, for joining our call today. The first thing I want to do is welcome the Arctos team to KKR. Our new partners are highly creative and entrepreneurial and we could not be more excited to work together to build a hundred billion dollar plus AUM business. It had its 50th birthday last Friday. We are very proud of this milestone. As a firm we are not very good at celebrating. We are however good at gratitude. So it was nice to be able to thank all our clients for their partnership and trust, and all our people for their dedication and hard work. I'd like to thank you, our shareholders, for your partnership. Public company for about a third of our 50 years, a period of time that has seen significant evolution and growth in our firm, all of which happened with your support. Thank you for helping us get to where we are. So let's talk about how we see things. We asked our team to pull together some slides recently to help frame the current volatility in our stock relative to our results.
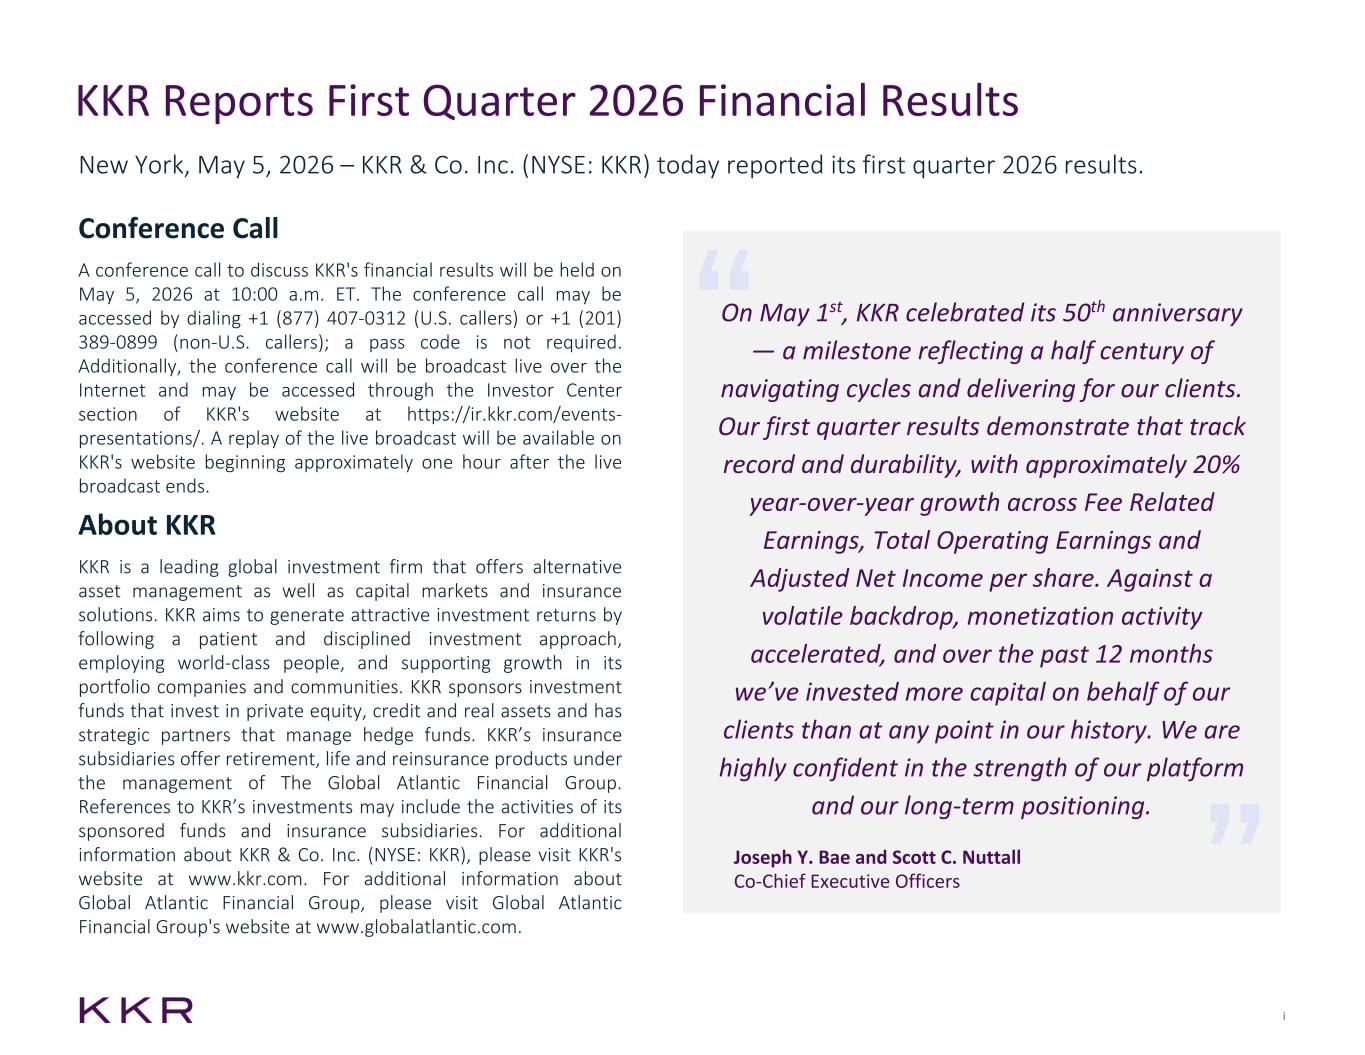
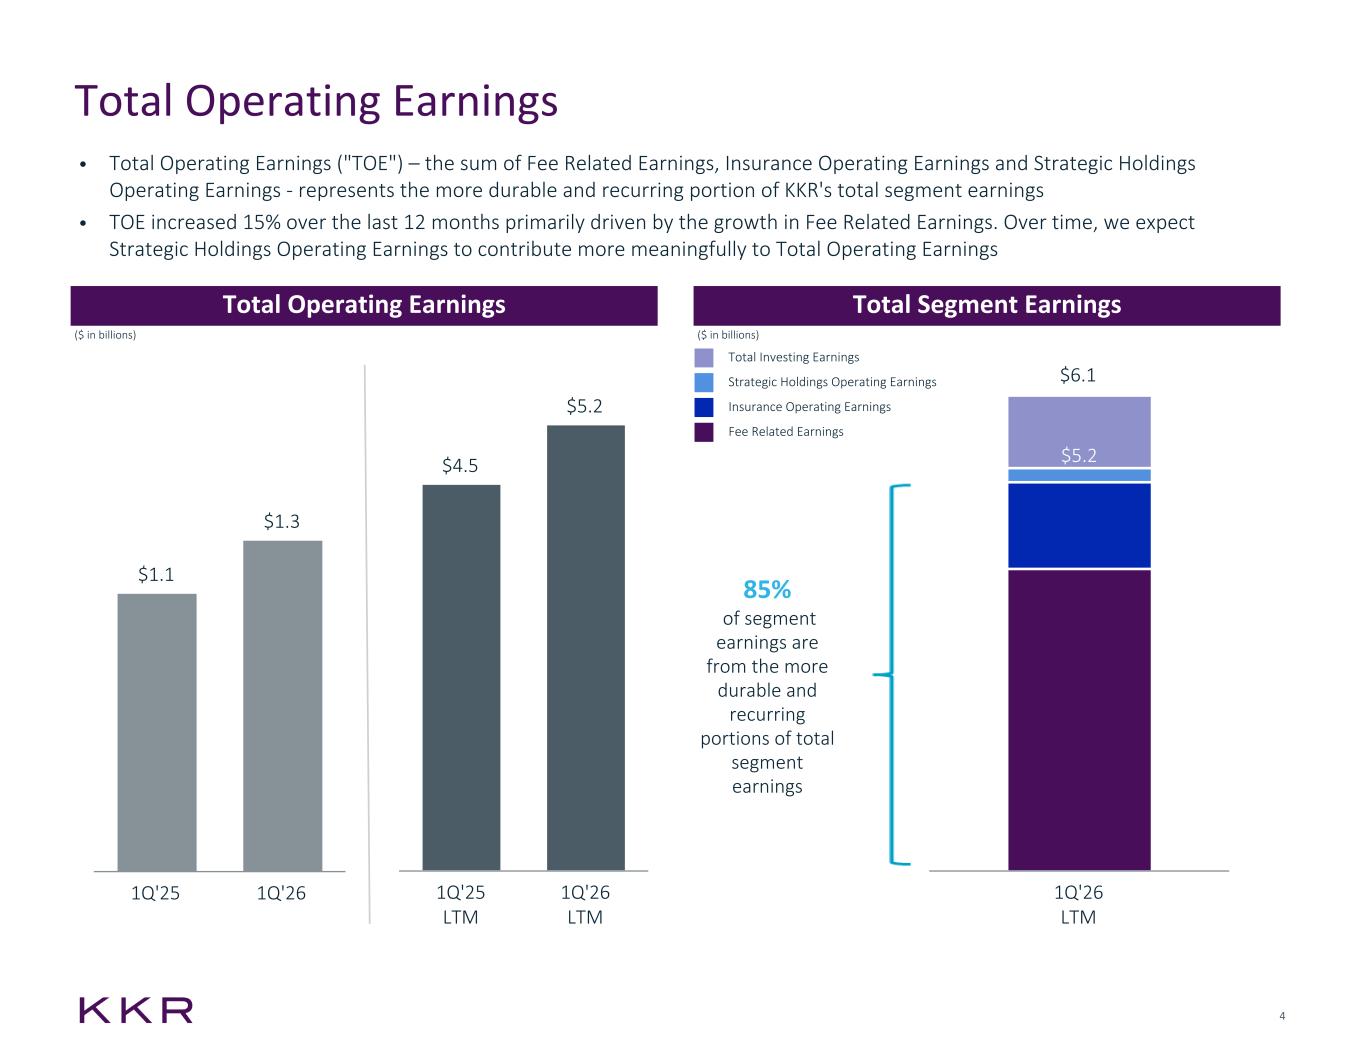
Just multiple years of AUM, fee-paying AUM, FRE, total operating earnings, and ANI on five pages, all of which metrics are steadily up and to the right with growth rates generally between 10% and 25% per year for the last several years. We then overlaid our stock price on those same charts. Picture worth a thousand words approach. What do you see when you do that? Our operating metrics are very steady with consistent growth over a long period of time. The fact is perception of the volatility of our business and industry is disconnected from the lived experience. And that's okay. We are focused on what we can control and executing our plan. And as we do that, we'll continue to prove out the durability of our business model. And we're confident that the volatility in our stock will come down over time. If you step back, the first quarter was no exception to our long-term trend. All of our key metrics grew about 20% in the quarter relative to Q1 last year. We raised a lot of capital, deployed a lot of capital, and monetized multiple investments. And as you heard, the volatility in our stock gave us an opportunity to adjust our capital allocation priorities and buy our shares back at what we believe is a significant discount to intrinsic value, which is why Joe and I have bought more stock, as did multiple members of our board. So our suggestion is don't trust the headlines. Stay focused on the fundamentals and how we are executing, what ultimately matters, and how we are spending our time. This approach has served us well for the last 50 years, and we expect we'll continue to for the next 50. With that, we're happy to take your questions.
Operator
Thank you. We will now be conducting a question and answer session. If you would like to ask a question, please press star 1 on your telephone keypad. A confirmation tone will indicate your line is in the question queue. You may press star 2 to remove yourself from the queue. For participants using speaker equipment, it may be necessary to pick up the handset before pressing the star keys. We ask that you please limit yourself to one question, and if you do have a follow-up, please get back into the queue. Thank you. Our first question today will come from Craig Seginth-Haler with Bank of America.
Good morning, Scott. Rob. Hope everyone's doing well. My question is on General Atlantic. So one of the big public annuity competitors pulled back in that business in 1Q and actually cited increased competition. And we know the alt models, including GA, have gained a lot of share versus the legacy players in the U.S. fixed index and fixed index annuity markets. So I was curious if you could update us on competition underlying our repotential and how we should think about the growth trajectory, especially with the institutional funding market, potentially a little softer in your term.
Yeah, Craig, it's Rob. Thanks a lot for the We are seeing that competition, competition on the liability side, and we know on the asset side, you know, spread, combination of those two things, is it's why you saw us also pull back on the origination front in Q1 as well. Now, with that said, we think it's best to look at insurance businesses, but Global Atlantic and KKR is making sure when there is increased levels of volatility, and by the way, when that happens, two things will happen simultaneously. We believe liabilities will become cheaper. And definitely, initially, you're going to see spreads come out on the asset side. And so the ROE potential is outsized. And so where we're spending our time is how do we make sure we are best platform relative. We can draw down to invest into that dislocation, much like you would in a private equity, we think translates into buying power on the liability side. So a lot of effort here, making sure we're ready to go when that volatility does. But today, we are seeing those increased levels of competition. We also know that that's not going to last forever.
Hey, Craig, it's Scott, if you're well. The only thing I would add, I think that the narrative is exactly right in the U.S., call it retail market, where there has been significant competition. I think the recent move we've seen in spreads and kind of some of the volatility is maybe dissipating some of that a bit. So, you know, opportunities are looking a bit more interesting, as Rob mentioned in the prepared remarks. But two things I'd mention. Remember, our business has good balance to it. We have a retail business and an institutional business. does block, does flow, some PRT, not all of those markets are seeing that same level of competition that we're seeing in the retail side. So it's nice to have that diversification across the platform. And then the other thing we've talked about in prior calls, one thing that makes us a bit different is by virtue of being able to marry our origination franchise on the investment side with the origination franchise and liabilities, we are emphasizing more longer duration liabilities. I think it's harder for other people necessarily to be able to generate the returns we think we can with those longer duration liabilities matched with assets that we can originate. So I wouldn't paint everything with the same brush, but I think your overall comment is well-placed.
Yeah, I'm going to jump in with one last point.
Operator
I'll move to Glenn. Score with Evercore.
Hello there. So I'm curious. You've had better DPI and better monetizations than most. You mentioned the over 18 billion of embedded gains in the markets at all-time highs. So I'm curious on the attribution of what changed and what holds back the timing and the ability to get to the A&I targets now. Is it as simple as there's a war there and it delayed things? I don't know if you can give us any attribution of parts of the portfolio that despite having these huge embedded gains, the market's just not ready to accept.
Yeah, thanks, Glenn. It's Rob. I think it's all a matter of decapping it now. We wanted to share that as well.
Real benefits of our focus on portfolio construction and linear deployment, diversification, all the things we've talked about on this call for the last several years. And that discipline is really coming through in the results. And so the value is there, to your point about the embedded carry and gains. This is really a question of when do you want to monetize it? And so the IPO market feels good. We've got several companies in the pipeline. But obviously an IPO isn't necessarily an exit per se. It can be a partial exit in the beginning of one. But another way that we exit is obviously through strategic sales. And so the one thing to your comment If you've got an asset that you've built value in for five, seven years, and if the backdrop in terms of war, energy prices, et cetera, is a bit uncertain or uncomfortable, I'm not sure you'd want to necessarily sell that wonderful asset into that environment if it's a strategic buyer and give them a little bit more time for the world to right itself. And so that's really what's happening on the margin. You heard from Rob, it didn't really impact anything in the first quarter. this is more of an expectation that if things go on for a longer period of time, there may be some things that we delay the launch of a sales process because we want that clarity in the market for the buyer on the other side. That's all we're talking about. But this is just timing. This isn't magnitude.
Operator
Thank you. Our next question, we'll hear from Alex Blostein with Goldman Sachs.
Hi, good morning, everybody. Thank you for the question. So really nice momentum on fundraising, Obviously, despite what's been a tough backdrop and, you know, management for growth north of 20, normalizing for catch-up fees is all good. As you think on the forward, it might be helpful just to get a mark to market on your expectations for fundraising for the rest of the year, given the bulk of the larger flagships are now in the run rate. Particular, how are you thinking about Asia? I think that one is about to start. But I guess more broadly, your confidence in maintaining this type of fundraising outlook for the rest of the year, which I think is what embedded in your FRE growth assumptions.
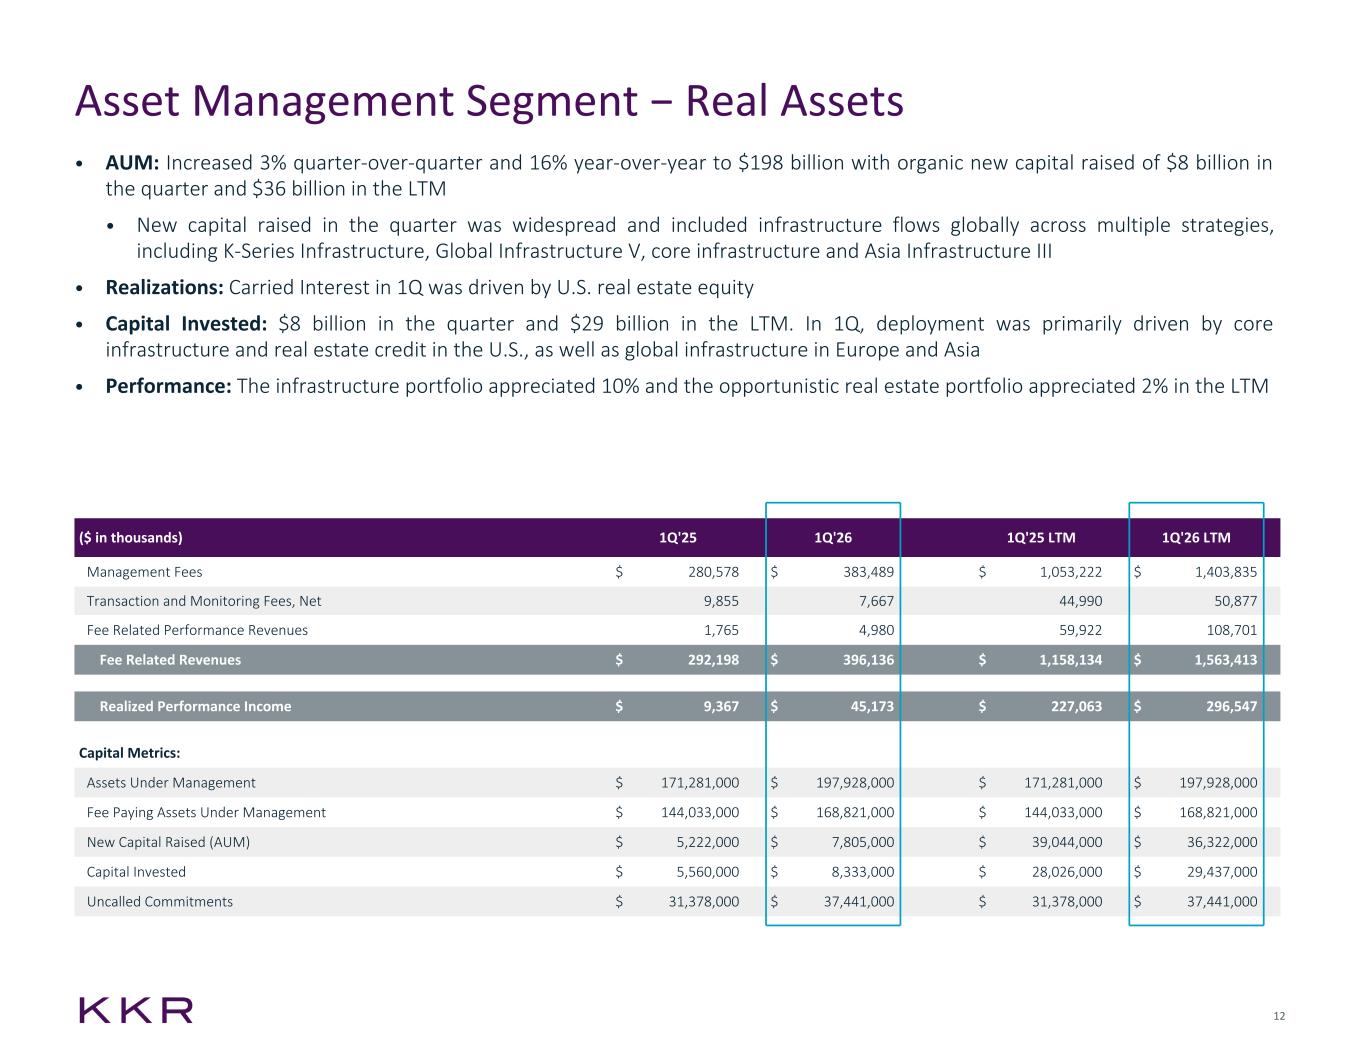
Alex, it's Craig. Why don't I, I think it's probably worth beginning on the breadth and diversification of fundraising. So if you look over the last $12 billion in total, so 35 of that roughly is from GA within our credit platform. Five is the non-GA portion within credit, and the balance is 20, a little over that, in private equity. So you're seeing a very healthy balance and diversified result in terms of our fundraising. Rob talked about that in terms of our management fee growth, where, again, you're seeing real breadth and diversification in management fees as a result of that. And I think the other point that kind of highlights this relates to flagships. So flagships were around 15% of new capital rates in the quarter, 12% over the trailing 12 months. Again, that number was very different at KKR five-plus years ago, as I know you'll remember. And then I think on the go-forward, look, there's lots of opportunities for our fundraising team across strategies, across geographies. I think if we look into strategies where we expect to be active in the next 12 to 18 months, In private equity, that includes Asia private equity, Europe private equity, tech growth, healthcare growth. We've got our K-series, and then we have capital group as well. Within real assets, global infra, core infra, we have a climate strategy, Asia infra, as well as K-series infrastructure, opportunistic real estate, opportunistic real estate credit. Again, just a big, a wide group of opportunities in real assets. credit across direct lending, leverage credit, asset-based finance. Again, you heard Rob note in our prepared remarks some of the momentum that we're feeling and seeing last quarter as it relates to high-grade ABF in particular. Asia private credit, Asia leverage credit, capital solutions, CLOs, K-series as well. And then insurance, again, reinsurance co-investment opportunities. So I think that breadth of opportunity that we have is what you're hearing and the confidence when we talk about the go forward from a fundraising standpoint, what that then can mean in terms of management fee growth, and, again, what ultimately that can mean in terms of effort to grow.
Hey, Alex, it's Scott. I would say, I mean, if you can't tell from Craig's list there, the fundraising feels really good. I'd say we've got a lot of momentum on a number of fronts. It's global, including the Middle East, which I would very much put in the business as usual category, pensions, sovereign wealth funds, insurance companies, high net worth, wealth. so it all feels really strong right now and some of the things we've talked about on prior calls for example this consolidation theme that we've seen more and more clients wanting to do more with fewer partners as they see more dispersion of results we're heading toward more of a k-shaped industry and so we think there's opportunity for us to continue to take share and we think the addition of Arctos to the family only adds to that as another set of asset classes, which are, you know, able to generate differentiated kind of returns. So bigger relationships and partnerships would be another theme I would point to on the back of that consolidation. But hopefully that gives you a bit of color.
Operator
Next, we'll move on to Bart Duzarski with RBC Capital Markets.
Morning, everyone, and thanks for taking my question. Congrats on the cool IT realization, and I noticed you implemented an employee ownership program at Acquisition. So could you maybe speak to how that program contributed to the successful outcome of that deal and then maybe more broadly on KKR's ownership program at the portfolio company level?
Bringing that one up, companies globally. Employees there, approximately 200,000. For sure that it drives better outcomes at our portfolio companies. We see it in the numbers. You've got higher engagement scores. You've got higher retention rates. Working capital efficiency is up. Margins are up. And ultimately, profitability is up. Because of that, they're able to share in those results. So we think it's great. And then maybe finally, while we're on this point, I do think it's worth mentioning that we are also a founding member of Ownership Works. This is a nonprofit that our partner, Pete Stavros, who co-runs our global private equity business, founded a number of years ago. And we now have greater than 100 partners alongside of us in this effort, and that's really what it's all about. We want this to become a movement beyond what we're doing at KKR, of what we're doing across the line, and then one that we're excited with you all in the future.
Thanks for asking about it, Bart.
Operator
So move on to Stephen Tevick with Wolf Research.
Hi, good morning, and thanks for taking my question.
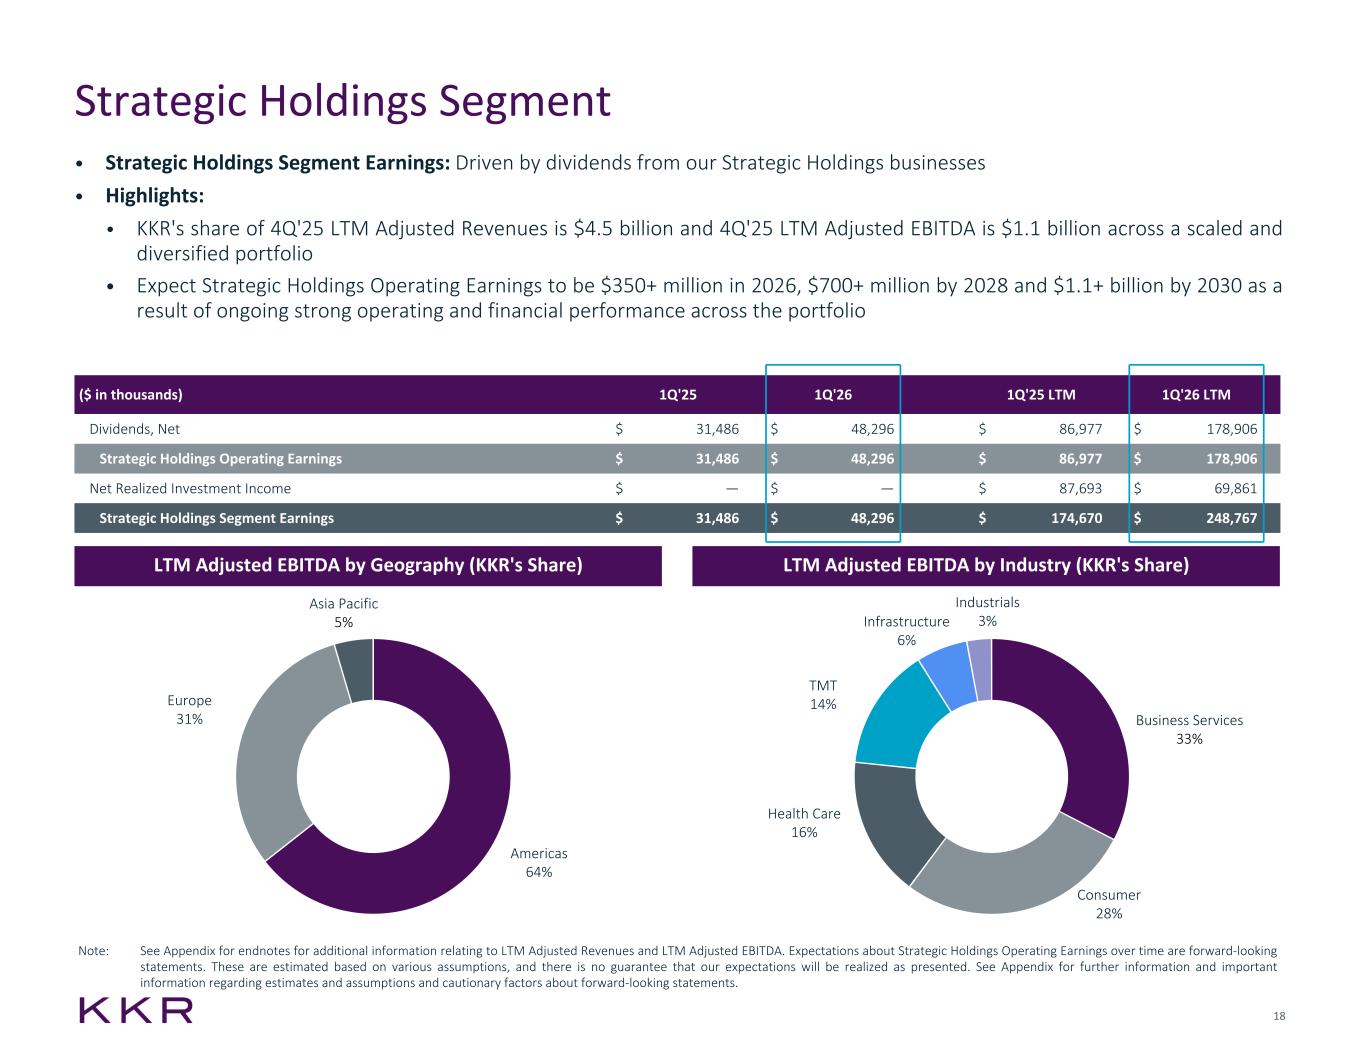
So I wanted to ask on strategic holdings and AI risk more broadly, certainly encouraging to hear the operating earnings target for strategic holdings get reaffirmed. Digging into the sector exposures, about one third of last 12 months EBITDA is concentrated in the business services sector. It's an area that's viewed as being more at risk of AI disintermediation. I was hoping you could speak to just how you've underwritten AI risk in the strategic holdings portfolio and even across the border universe of KPR portfolio companies? And is there any KPIs you can speak to to help folks better handicap that risk?
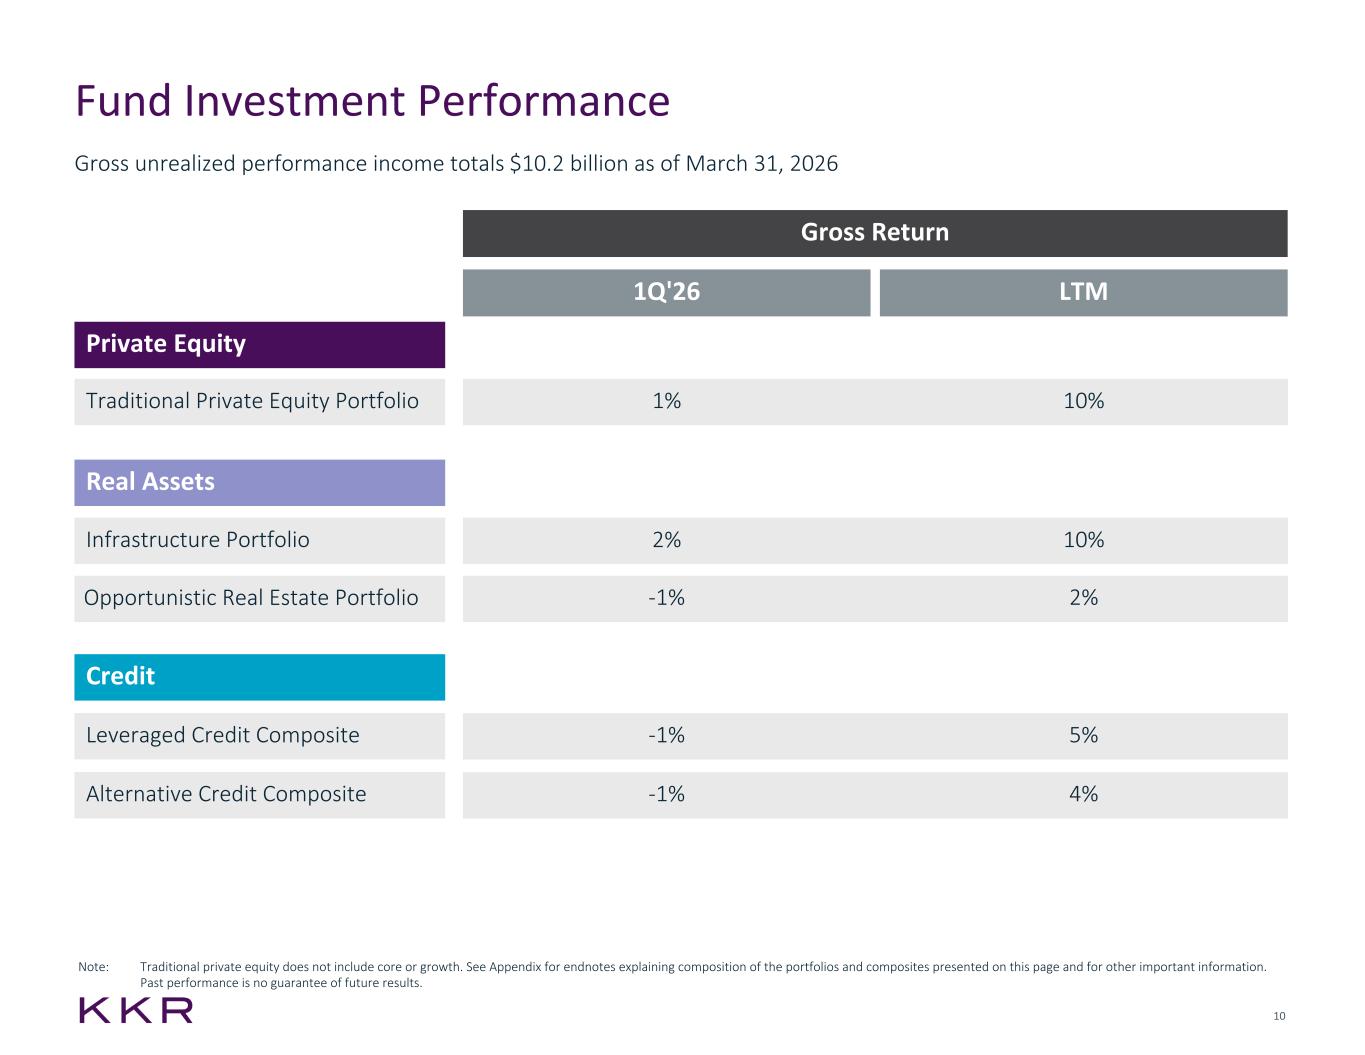
Good evening, Ms. Craig. Why don't I start? So just look to Levelset. Software represents around 7% of our AUM. In private equity, it's a higher percentage. It's around 15. Across our credit platform in total and in Global Atlantic, that number is about 2.5%. Now, I think first, why don't we, oh, and in terms of that percentage of EBITDA in strategic holdings, that percentage is about the same. It's, you're correct. It's a low double-digit percentage of EBITDA in the quarter. And then why don't I first talk about marks, and then from there, why don't we talk about AI and from both an underwriting standpoint and then opportunities for us. Look, I think in terms of the quarter, probably two things to note. first, software companies broadly are performing. So looking at revenue and EBITDA growth, we're still seeing healthy year-over-year revenue EBITDA growth, I think high single digits. But at the same time, obviously, in the quarter, we saw weakness across equity markets in the software space. So given the way that our valuations work, this dynamic from a public market standpoint had a negative impact on the markets, right? So when you put those two pieces together, really, despite the operating and financial performance, marks across the software names largely declined in the quarter. Now, in terms of AI and how we're approaching AI as a firm, I think from a couple of things, one, look, the implications won't be a surprise to anybody on this call from AI are really far-reaching, right? Like, the barriers to adoption are low, gains are real, AI can be very helpful at parts of workflows, and there will be businesses where the fundamental strategic positioning is either materially enhanced or in some cases on the flip side could be replaced. Now, from an investing standpoint, AI, we look at both from a diligence lens as well as from a value creation perspective. So from an underwriting standpoint, kind of the part of the question that you focused on, look, we're focused on AI, how it affects margins, pricing power, workflow relevance, and cash flow resilience. And so the focus is not just, it's really on the durability of unit and business economics, and that's through trailing lines as well as on the go forward. And how does AI impact those dynamics for us? And then I think perhaps even more importantly in terms of value creation, look, we think we're really well positioned. Like AI at this point is deployed across 150 plus companies to automate workflows, enhance products, drive new growth. And I'm sure we have multiple AI initiatives. And so as a firm, how we're focused on this is ensuring that our operational team at Capstone is helping ensure that lessons travel across our teams and our companies. What works, what doesn't work, what's easy, what's hard. And again, as I know you know, we work at a very collaborative firm. So it's very much within the framework of our culture to help each other. I don't think that's necessarily to the same degree because a really siloed firm is not going to benefit in the same way. And then on the flip side of all of this relates to the opportunity. So digital infrastructure remains a massive theme for us. We've deployed over $40 billion of capital, KKR plus our partners, across the variety of digital infrastructure themes, have over a 20% gross IRR return to date in terms of that activity for us. And again, Bart obviously already touched on the cool IT example. Again, an example of an investment that, again, when everything comes together, kind of shows you the art of the possible. So hopefully that's helpful.
Operator
Next we'll hear from Bill Katz with TD Cowan.
Great. Thank you very much for two things, the extra disclosure and finding your own data report earnings. Very helpful, and thank you. Just coming back to insurance for a moment, so doing the back of the envelope math, If I take your slightly north of $300 million, you get just below 11% ROE for the business. If I did the math right, so the business, I think you mentioned spreads widening out a little bit into 2Q. What do you think is the normalized level of ROE and maybe the timeline to get to that?
You know, our run rate was probably...
Operator
To Mike Brown with UBS.
Hi, good morning, Scott, Rob, and Craig. How are you guys? So I wanted to ask on Arcto. So $10 billion a fee paying AUM. Can you just talk about the current fee rate profile there and then any fundraising expectations over the next 12 to 24 months? And then strategically, how do you view the long-term opportunity and the wealth channel with Arctos? Is that something that could kind of feed origination into PayPack? Or over time, do you think you could even have like a dedicated sports fund or a dedicated secondaries product?
Let me start, and I know Craig and Scott, given the size of the Arctos business relative to KTR specific. I think we can tell you that they're done in a pretty lean way on the employee front and with fee terms that generally look like fee terms that you would foreseeable future.
Greg, just on the fundraising piece, first, thanks for asking about Arctos. I'm calling welcoming the Arctos team to the family post-close, obviously. And look, on fundraising, it's a really exciting opportunity for us. And I think our fundraising team, we know, is excited both to support the distribution of existing Arcto strategies, and I think in particular, if you think of the footprint that we have and the boots on the ground that we have on a global basis, we think there's the opportunity for us to be really helpful right out of the gates. And then secondly, to your question on wealth, nothing to announce specifically this morning, but certainly lots of ideas, and we're excited to develop and think through potential new wealth solutions together with the Arctos team. This could include things like an evergreen vehicle that would include sports, as well as some type of secondary slash GP solutions vehicle as well. So, you know, more to come over time, but just a really exciting long-term opportunity for us. We're excited to get after it.
Operator
So we'll move on to Michael Cypress with Morgan Stanley.
Thanks so much for taking the question. Just wanted to ask about AI deployment across portfolio companies. Curious where specifically you're seeing AI-driven revenue uplift versus AI-driven cost savings in the portfolio, and how might you quantify that so far? I'm curious any expectations as you look out from here. And I was also hoping you can elaborate a little bit to your earlier point on what's been easy so far, what's been hard, and any sort of lessons learned from adoption. Thank you.
Mike, as Craig, why don't I start? Look, we're very early in, in, you know, broadly what we think the opportunity set is. I think we're seeing broad adoption of AI, and the next step of that is really understanding the execution and bringing the power of AI to life, both from a revenue standpoint as well as an EBITDA standpoint. I'm sure there'll be points in time or a point in time when it will make sense for us to both talk about specific progress as well as guideposts for us. To be clear, we are seeing an EBITDA uplift broadly across the portfolio, and we think there's a lot more for us to do. It has been interesting to see the evolution of AI to date and how it's almost started in ways that are interesting, like I think on various language applications. It's just interesting to see AI really begin to disrupt that part of the landscape most broadly first. But as we think about things like, you know, broad efficiencies, whether that's Salesforce or operating efficiencies across the platforms and workers, and it's going to be even broad businesses and opportunities and things like robotics, or you think of what AI can do in terms of the healthcare space. There's just really long-term broad opportunities for us across the spectrum of the business, and there'll be more to come from us.
Operator
And we'll move on to our next question from Brian McKenna with Citizens.
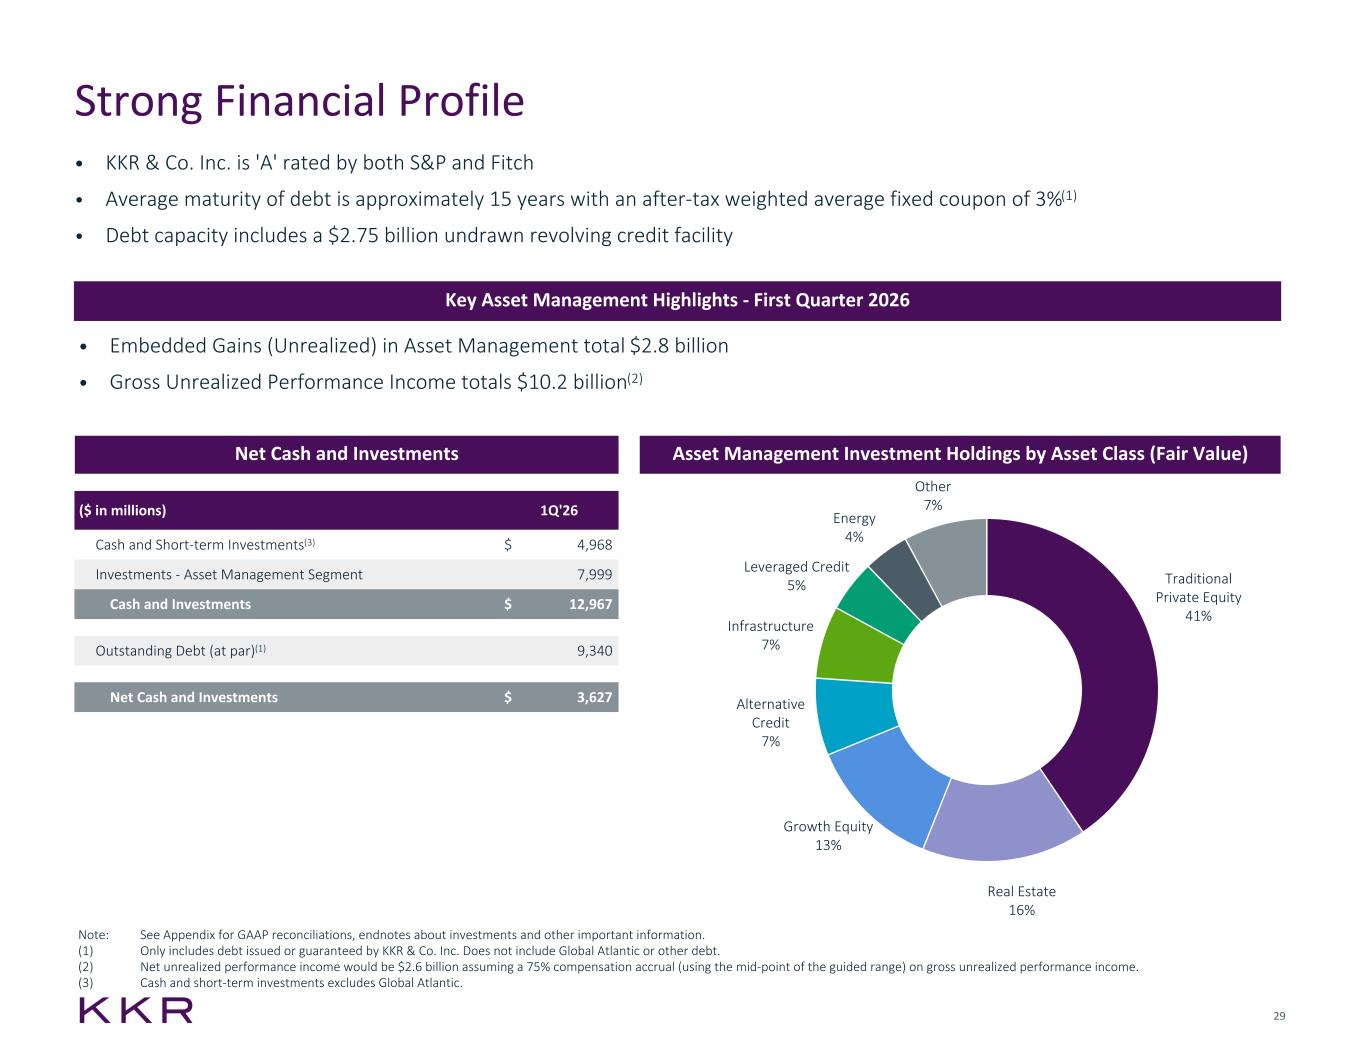
So within your private equity business, what's the typical markup on an investment when it's realized versus the prior unrealized mark? And then is there a way to think about the incremental carry that's created in this markup? And I'm just trying to figure out if the $2.6 billion of net unrealized performance income is understated in any meaningful way.
Hey, Brian, it's Craig. Why don't I start? Look, in our experience, when you look at the final mark of those private equity investments that we monetize, you see a healthy markup relative to the prior quarter. And, you know, that's been ours over time. I think it does speak to the rigor of the valuation process. Again, this is an exercise that has been very similar for us for well over a decade at this point in time. We work with third-party firms as part of all of this exercise. And so I think it speaks to the rigor and, if anything, mild conservatism that we have as it relates to Mark's as we go through this process.
Yeah, I think that covers me.
Operator
Next question, we'll hear from Brennan Hocken with BMO Capital Market.
Good morning. How are you doing, Scott and Rob? I wanted to follow up on Glenn Scholar's question. So, couldn't resist Glenn, sorry. So, you know, the struggle with the seven boxes, I think, you know, probably not that surprising like the environment, given where it is, you can look at consensus and saw that basically it was anticipated. But the one part that I'm sort of curious about is on the realizations and the timing. I know you guys have been a lot stronger on DPI, but, you know, how is the potential for further delays in monetizations and realizations going across with the LP community? You know, this has been an ongoing delay across the industry. And so is that leading to some frustrations and how are you managing that? Thanks.
Yeah, sure, Brendan. I mean, there's obviously a lot of Cal users we enter months into the year. I think it's fair to say that some things have potential to convey fracking at this point of the year. That said, I think it's also important to really understand that our DPIs remain, we think, industry-leading. Anything that's accelerating, look at our realized carry in Q1. It was up 120%. I think most importantly is our forward monetization guide of $1.2 billion plus. Things feel really good on that side of the ledger, the extent of the environment, what that can mean, as Scott noted in processes, what that could mean maybe as it relates to employment and pushing back some processes that could happen and the impact across our platform. And we're trying to give you a mark-to-market balanced view on where we are.
Hey, Brandon and Scott, just to add a couple of things. Thanks for the question. I wouldn't confuse the message around we may delay some strategic exits with kind of what we're hearing from the LPs. We have, I think, in a deck, the IR deck on the website, a slide somewhere that talks about how we've given cash back from our private equity fund in the U.S. So that business, you know, we've given more back than we've called nine out of the last 10 years. So what we're hearing from the LPs is we're like best in class in terms of DPI and cash back, and they know that there's more coming. So, you know, the LPs are happy with us. That's why you see a record fundraise in private equity, the $23 billion that Rob mentioned, which is just the U.S. component of our private equity business. But overall, fundraising is up, and we're finding investors want to do even more with us. And I mentioned this dispersion we're seeing across our sector. There is extreme bifurcation, and we're getting a lot of very positive feedback on how we're performing and sending so much cash back relative to others. So I wouldn't confuse the two topics.
This is helping us grow the firm faster by virtue of their performance.
Operator
And next we'll hear from Dan Fannin with Jeffries.
Thanks. Good morning. I was hoping you could discuss the broader kind of private wealth backdrop given the challenges in certain private credit vehicles. How do you see that impacting the lineup for the rest of your retail or private wealth products or even the roadmap with your partnership with Capital Group going forward?
Hey, Dennis, Craig, why don't I start? We thought we'd get a question on this topic. We think it's important just to begin to level set, and I touched on this earlier, but really the size and breadth of fundraising, right? So over the trailing 12 months, we've raised $127 billion. And K-Series was 12% of that, certainly, but we benefit from all the strategies and geographies where we're raising capital. We're wonderfully, we think it's important to take a step back and think about K-Series and the growth in that platform. 331 was 38 billion. A year ago, that was 21. So think of all the volatility that we've all experienced over the last 12 months. Liberation Day, all that's unfolded with Iran. And K-Series AUM is up 80% year over year. I think as we look about the backdrop and what that means for us, No change in our view that we see, and just feel, A, very excited about how we're positioned against this opportunity, and again, recognizing that this is just one of the pieces of the puzzle that we have, given the breadth and the diversification we have across the firm.
Yeah, the only thing I'd add, Dan, is this is a multi-decade build for us, and this is all about performance. If we can generate performance and keep earning the trust of the advisors and the clients, we think this can be a meaningful part of the firm. And as you know, it's early. These wealth products are relatively early in the development, and I think people are learning as we go here. But in terms of your question on the impact on other things we're doing, I think Rob mentioned it. We were surprised by how strong and resilient flows were in the first quarter. If history is any guide, you know, all of the media attention will likely slow things down for a bit. I don't know what a bit is yet because it's so early, but to Craig's point, this is a relatively small percentage of how we're accessing capital today, and we're working hard to earn the right for it to be a larger and more meaningful part of the firm. In terms of your question about Capital Group, also even earlier there, with respect to our partnership, which has developed extraordinarily well, and overall is in terms of kind of how we think about it ahead of our expectations, but we're still very much in the product development mode and just starting to deploy different products across credit and private equity as we've discussed.
Operator
A question we'll hear from Amal Gibla with BNP.
Yes. Good morning. I've got a question on data centers. You mentioned earlier that you're investing actively there. I was just wondering if you could flesh out a bit more. In particular, I think you've signed a 50 billion JV with Energy Capital Partners. So how far down the pipeline of investments are you? How fast are projects coming on board? I understand there's quite a bit of capital in this space. So I'm just wondering what the prospective returns are shaping up to look like in this space.
Sure. Why don't I begin? Look, it remains a massive one. There remains a lot of interest and focus on data centers, no question. And, look, this focus is for good reason. Like the CapEx we're seeing out of the hyperscalers continues to be massive. If anything, it feels like it continues to accelerate. And all of that builds on what's already given tailwinds in cloud. So the digital lymph opportunity is massive, but it's more than just data centers, as I mentioned, because, again, you're going to need massive investment alongside of data centers and alongside of all of this aspect from a data standpoint in terms of fixed-line opportunities, mobile infrastructure at the same time, again, to support the growth in data in all the consumption. And I think when we look at our firm and how we're positioned for the past 15-plus years, we've been incredibly active. So we've invested over $40 billion across the digital infrastructure space broadly on data centers. specifically. We've got six global data center platforms. In terms of your question on frothiness, look, we're going to be thoughtful in how we invest. And I think you've seen lots of capital put against this opportunity to continue to see us be very disciplined as we look at opportunities. We're going to care about who our counterparties are. We're going to care about location. We're going to look to continue to be thoughtful around terms. And then I think finally, part of this also gets back to one of the reasons we think we're well positioned gets back to connectivity and culture. Because we do invest across these themes, across a number of pools, across KKR, depending on geography and risk return. Global infrastructure, Asia infrastructure, our diversified core infrastructure strategy, real estate, core private equity, wealth, as well as within global Atlantic. So we've got a number of different pools, different risk return across geographies. So lots of progress and exciting for us more to come.
Operator
We'll hear from Kristen Love with Piper Sandler.
Thank you, Ikimora. I appreciate you taking the question. The elevated redemptions wealth have been highly publicized, but I'm curious if you can detail further what you're seeing from institutions given the noise in wealth. Rob, your comments seem positive there. So I'm curious if you can dig into that a little bit deeper. How aggressively are institutions leaning into direct lending today in other areas like ABF? And then how has that evolved in recent months, just given the sentiment shifts? Was there a pause and then started to dip in further? Just curious on that trajectory and thought process from the institutions.
Thanks for the question, Crispin. Very different dialogue with institutions. If anything, I would say 12, 24 months ago, as it pertains to direct lending, institutions were, frankly, spending less time. A little bit of a question of, you know, the retail flows a bit ahead of deal flow. You know, our spread's compressing in terms of a bit less attractive. And a number of them, I think, pivoted a bit to asset-based finance as another component of private credit. and as you heard from Craig and Rob, that part of our private credit business is more than two times the size of our direct lending effort. And so we definitely saw that movement. The shift we're seeing in the last several weeks has been the institutions kind of coming back to direct lending a bit and saying, okay, I see all these headlines about wealth. That should mean that risk-reward is getting better on new deals, And therefore, I'm going to take a fresh look at it again. So we continue to have all the ABF dialogues we've been having, and the pipeline is really robust there. But the shift has been the institutions actually coming back a bit to direct lending and thinking about, well, spreads are up, fees are up, terms are better, and leverage is down. And that's what we've seen in terms of our pipeline the last several weeks. And so on the back of that, they're more intrigued. So very, very different dialogue relative to all these headlines that you're reading about on the wealth space, which are very small dollars in the grand scheme of things.
Operator
Next we'll hear from Patrick DeVitt with Autonomous Research.
Hey, good morning, everyone. Follow up to Stephen's question, been a lot of focus on software, actually. But we are starting to get more incoming around the potential for AI to be a problem for Indian positions in both private equity and real assets. I think India has been a big part of your Asian investment strategy. So could you update us on the exposure there? And more specifically, have you done a scrub to identify how exposed those positions are to potential AI disintermediation of things like India outsourcing?
Yes, Craig, I'll start. Look, I think when we go through the exercise, again, that's obviously done on a global basis. That's both with a focus on whether that's revenue and EBITDA growth, whether that's the investment teams and the approach to AI from a defensive and an offensive standpoint. So I don't think of that differently, you know, based on geography. We haven't disclosed any, you know, specific portions of India. We would note that I think as we think about Asia and our footprint broadly, it is, I think we think of Asia split broadly between the developed part and then the growing part. So India is certainly an important part of our franchises as we think about our positioning going forward.
Yeah, I think, Patrick and Scott, the answer to your question is yes, we have scrubbed our India portfolio. No, don't have any elevated level of concern there. You're right. One thing you watch is what does this mean for employment in India, given the amount of that economy that historically has been driven by what's happened with outsourcing to that part of the world. And we have seen hiring across that part of the Indian business sector come down meaningfully, dramatically. We're not exposed to that. If anything, I think right now as we sit here today, given our focus on infrastructure, electricity grids and otherwise in India, We've been getting ready for what we see as AI deployment and the opportunity set across digitalization in that market, where, as you know, we have a lot of history and expertise.
Operator
There are no further questions at this time.
Operator
I would like to turn the floor back to Craig Larson for closing remarks.
Rochelle, just thank you for your help this morning, and thank you, everybody, for your interest in KKR. We look forward to following him up in 90 days or in the interim if you have any questions directly to the IR team.
Operator
Thank you. This does conclude today's teleconference. we thank you for your participation. You may disconnect your lines at this time.