Operator
Good afternoon, and welcome to Loan Depot's second quarter, 2026 earnings call. After today's prepared remarks, we will host a question and answer session. If you would like to ask a question, please press star one to raise your hand. To withdraw your question, press star one again. I would now like to turn the call over to Gerhard Erdely, Senior Vice President, Investor Relations. Please go ahead.
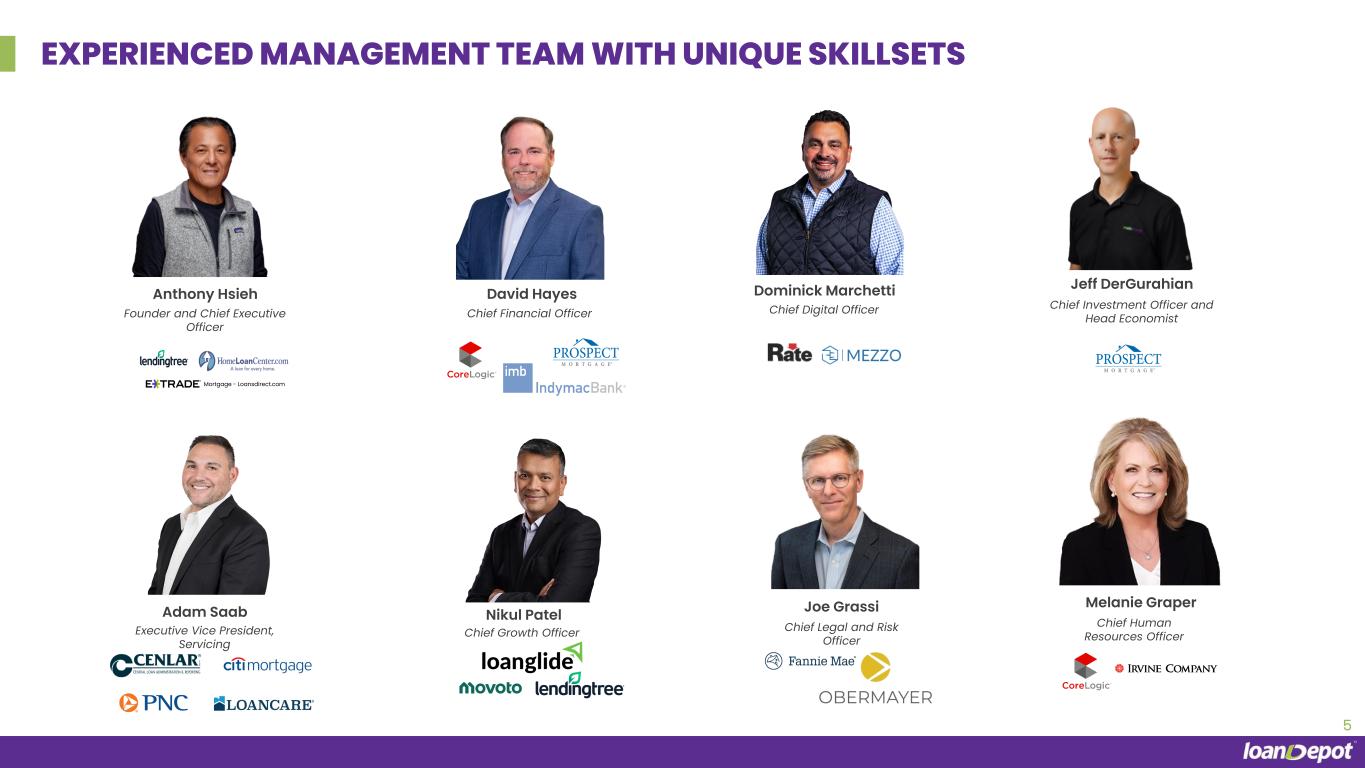
Thank you. Good afternoon, everyone, and thank you for joining our second quarter 2026 earnings call. Before we begin, I would like to remind everyone that this conference call may include forward-looking statements regarding the company's operating and financial performance in future periods. For more information about factors that may cause actual results to differ materially from forward-looking statements, please refer to the earnings release that we issued earlier today, which is available on our website at investors.loandepot.com. Our presentation today contains certain non-GAAP financial measures that we believe provide additional insight into analyzing and benchmarking the performance and value of our business and facilitating company-to-company operating performance comparisons. For more details on these non-GAAP financial measures, including reconciliation to the most directly comparable GAAP measures please refer to today's earnings release. A webcast and a transcript of this call will be posted on our website after the conclusion of this call. On today's call, we have Loan Depot's Founder and Chief Executive Officer, Anthony Shea, and Chief Financial Officer, David Hayes. They will provide an overview of our quarter, a review of our operating results, and our outlook. We are also joined by Chief Investment Officer Jeff DeGurion and Chief Digital Officer Dominic Marchetti to help answer your questions after our prepared remarks. With that, I'll turn things over to Anthony to get us started.
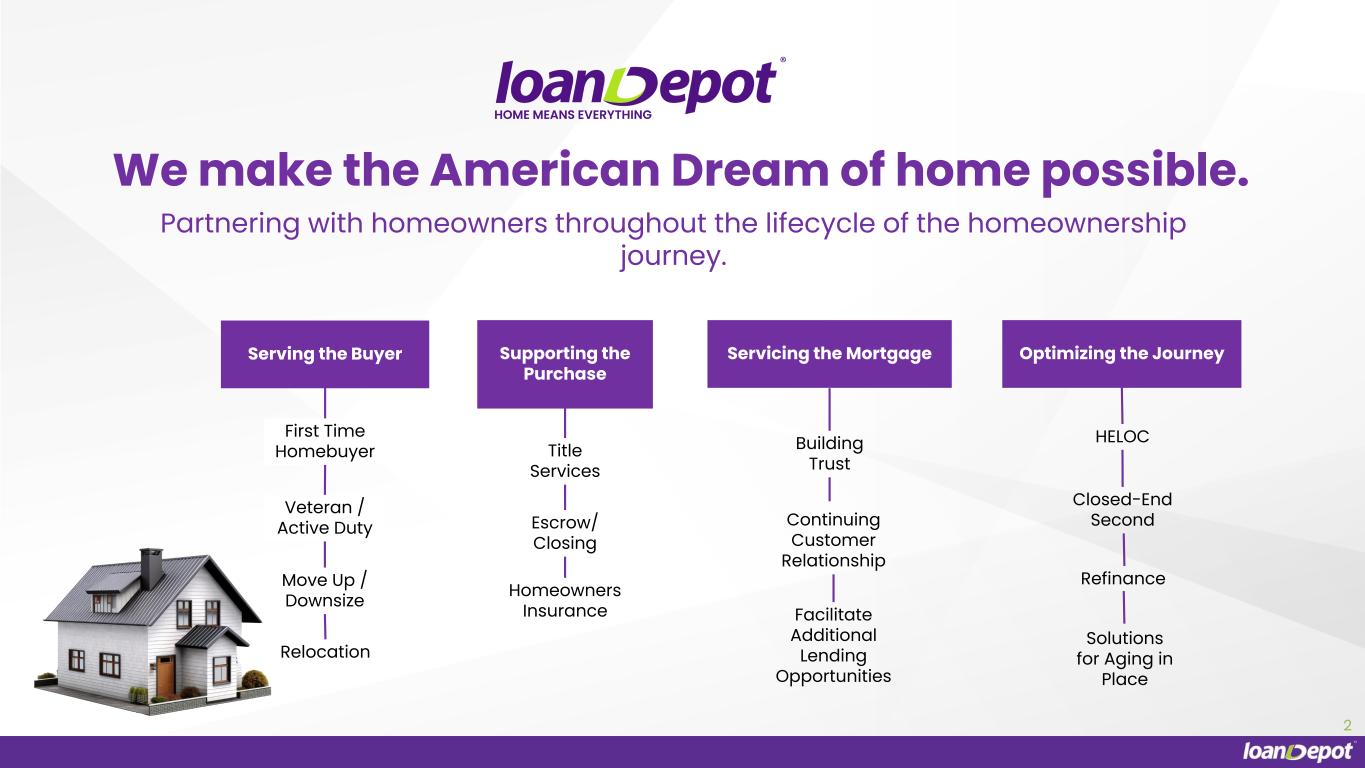
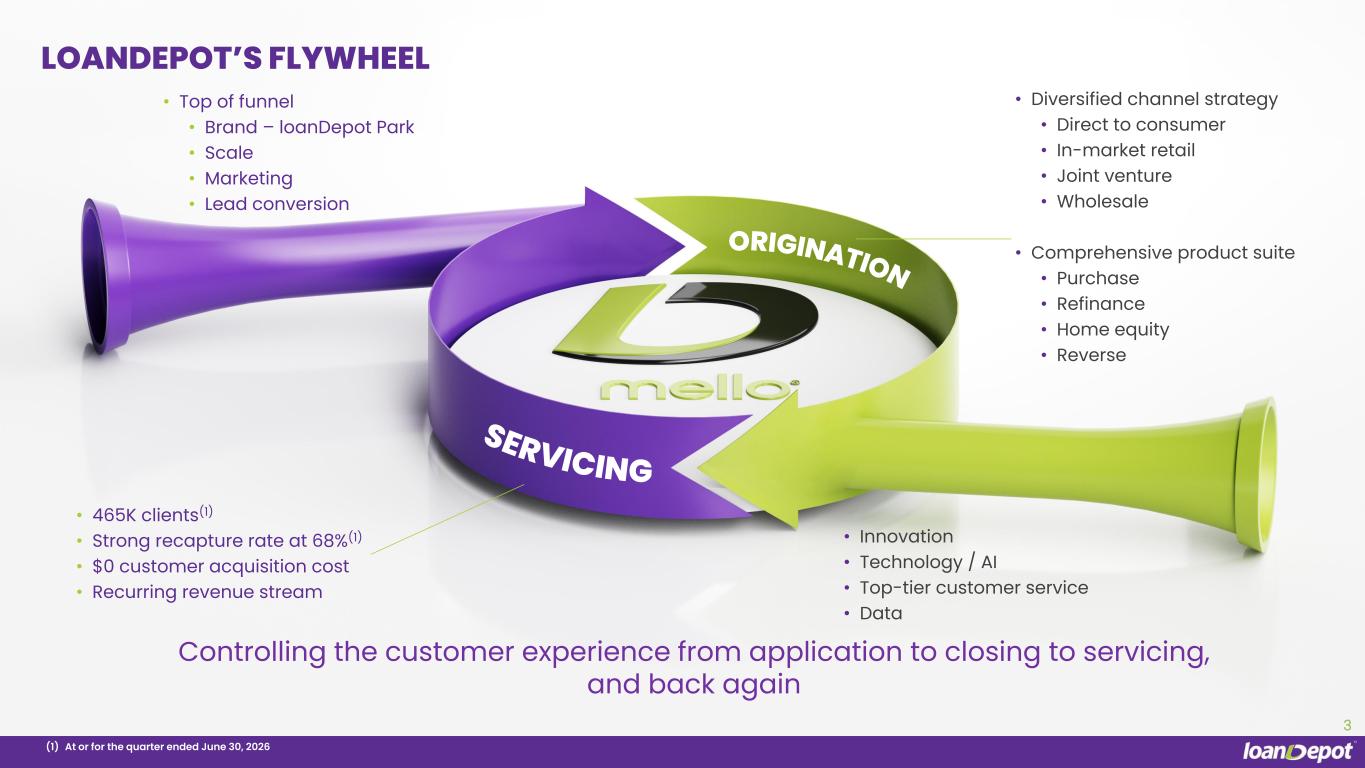
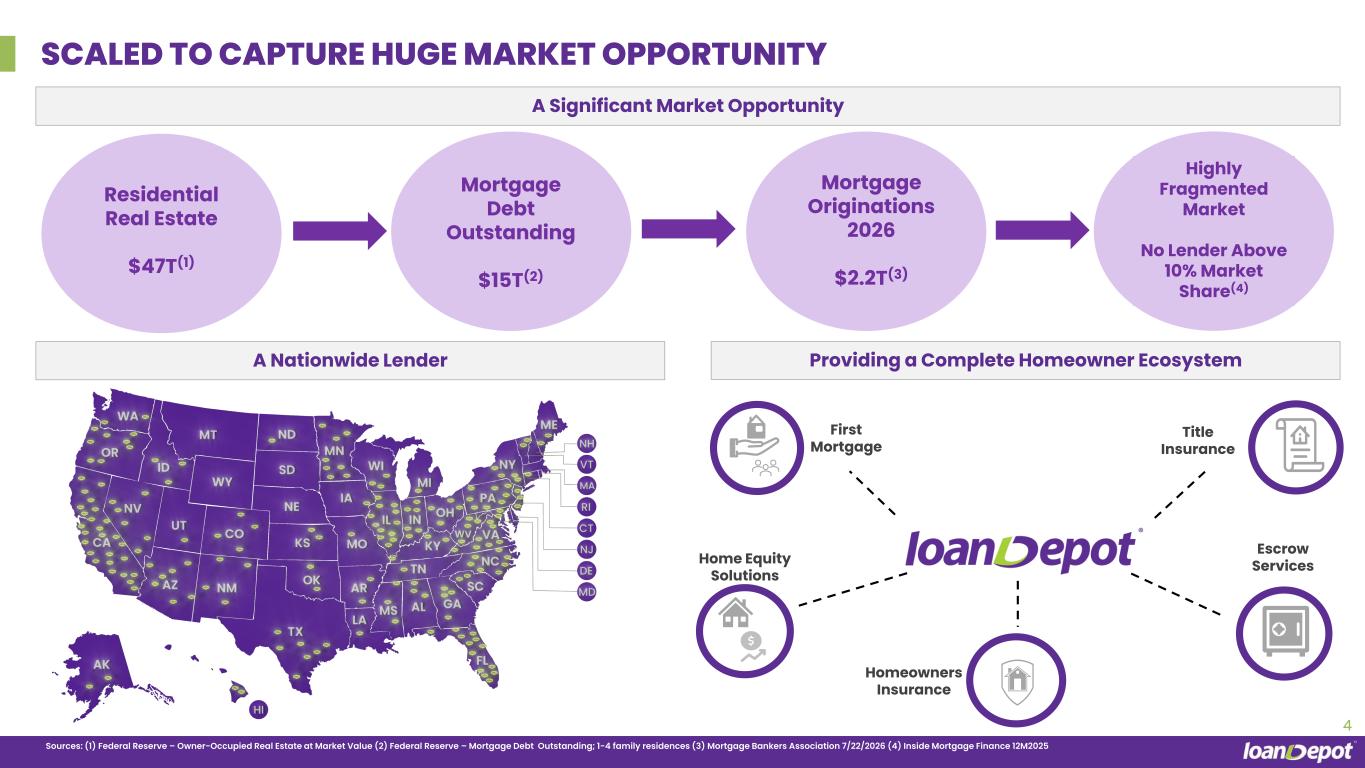
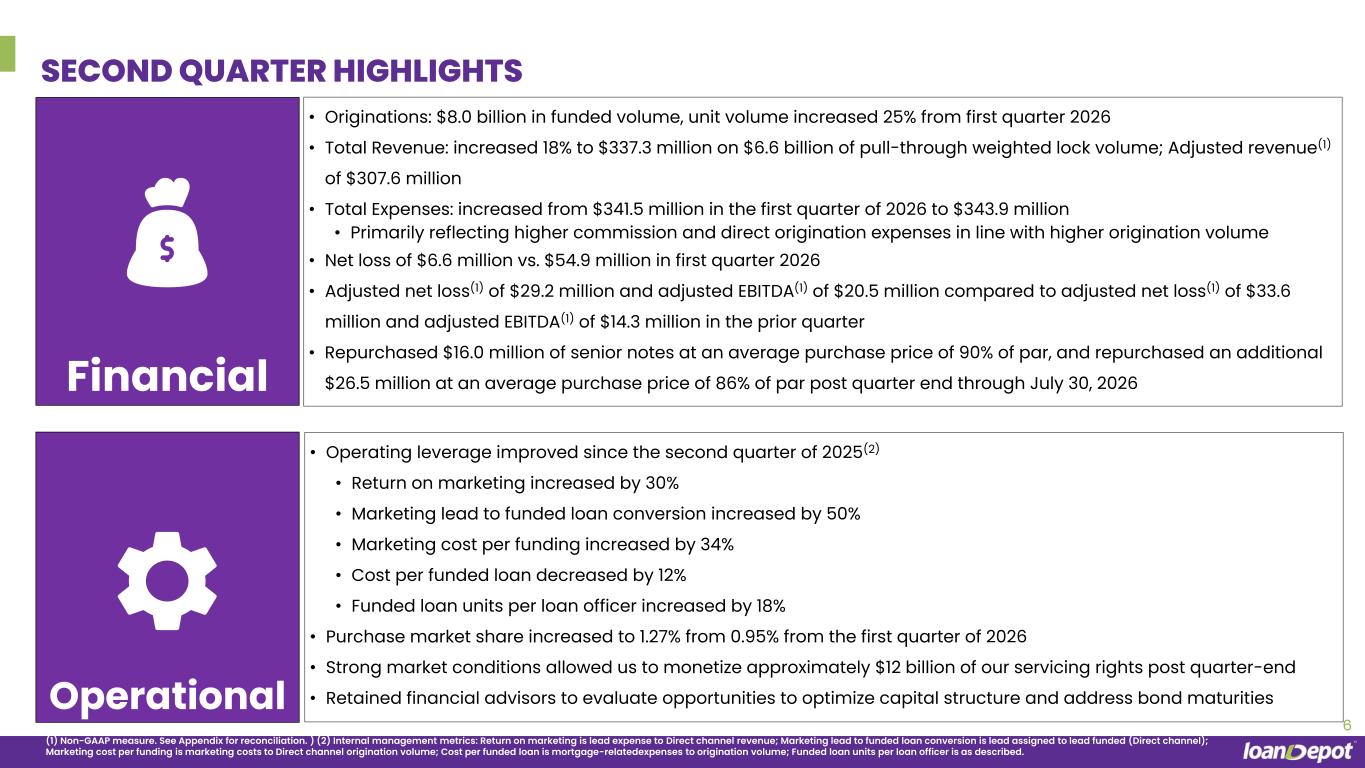
Anthony? Thank you, Gerhard. I appreciate everyone joining us on the call today. When I returned as full-time CEO one year ago, I set a clear transformation agenda to position Loan Depot for profitable market share growth in any macro environment. We have moved decisively to reshape the business and are starting to see signs of our progress. We are making more loans faster and at a lower cost. In the second quarter, revenue increased, operating leverage improved, and our net loss narrowed substantially even as interest rates rose meaningfully beginning in March. While we are in the early innings of our transformation, the pace of improvement accelerated as the quarter progressed, with June demonstrating the strongest results so far this year. A central driver of this momentum is the progress we made during the second quarter in executing our strategic expansion into home equity lending. This represents a significant expansion opportunity within a market supported by approximately $35 trillion of U.S. homeowner equity, which represents a potential market size more than double total mortgage debt outstanding. Importantly, these are the same homeowners we have long served through traditional refinance products. In a higher rate environment, however, home equity products can allow qualified borrowers to access liquidity while preserving an attractive first mortgage rate and may offer a more compelling value proposition than higher cost alternatives such as unsecured personal loans, credit cards, and certain small business financing products. Home equity lending is more stable, less rate-sensitive, and less seasonal than refinance and purchase mortgage lending. It is also stickier in that it meets an ongoing customer need. Loan balances are smaller, but gain on sale and revenue are both typically higher. And our cost to produce is significantly lower. We are now seeing the result of this pivot. During the quarter, we increased unit volume by 25% from the first quarter, reflecting the success of our launch into this product segment. We believe that when rates fall and traditional refinance activity returns, home equity will remain an attractive product for a large segment of the market, particularly those customers with ultra-low pandemic-era interest rates that are unlikely to be in the money for traditional refinance. Home equity lending broadens our addressable market and complements our traditional purchase and refinance business. It addresses our customers' liquidity needs and benefits from attractive unit economics. The second quarter results demonstrate that this strategic shift is beginning to translate into measurable growth, stronger margins, and improved operating leverage. During the year, we continued to expand our core mortgage franchise by adding builder partners in our joint venture channel and branch locations in our retail channel. That growth drove a 33% increase in purchase market share in the second quarter and reinforces the durability of our diversified origination platform. It's important to understand that we believe that we are the number one independent mortgage company financing new home construction for builders. This is a critical competitive advantage. Our ability to pivot towards home equity while continuing to grow purchase market share reflects the agility of our team and the adaptability of Loan Depot's origination model. Few originators have the multi-channel distribution. customer relationship, or operating expertise, to make that transition at scale. We believe we are uniquely positioned with our nationally recognized brand, valuable servicing portfolio, diversified channels, including our growing wholesale channel, proven ability to develop loan officers organically, industry-leading recapture capabilities, and technology-enabled customer acquisition platform, allowing us to redirect capacity towards a product that offers the greatest customer and shareholder value in a given rate environment. Together, these assets help generate customer leads at the top of the funnel and support a broad distribution network that includes retail and partner channels, as well as what we believe to be one of only two scaled direct lending platforms. Our ability to efficiently convert marketing investments at the top of the funnel into customer leads and new customer acquisitions is an important market differentiator. The market is extremely fragmented, giving us a huge opportunity to apply our differentiated assets to profitably grow market share. Producing, managing, and directing leads to our loan officers has been a core competency since founding the company. With new technology powering lead conversion, we expect to create more customers while also driving down marketing costs. Powering our growth is our ability to organically develop loan officers. Over the past year, we increased our net loan officer count by 18 percent. This growth is broad-based and consists of newly trained loan officers graduating from our proprietary ACES program in our direct channel and experienced loan officers with established relationships in our retail channel. This quarter's results are evidence of the progress we have made over the past year as we strengthened our platform, rebuilt our management team with leaders that have deep expertise across mortgage, technology, and marketing. Expanded our loan officer base, improved marketing performance, and invest in technology and AI enabled capabilities designed to enhance productivity and the customer experience. To punctuate this progress over the past year, we have increased return on marketing by 70%. We increased market and lead to funded loan conversion by 50%. We reduced marketing costs per funding by 34%. Reduced total costs per funded loan by 12%. And increased funded loan units per loan officer by 18%. As we continue to scale the platform, we believe there are opportunities to realize additional operating leverage across our business in a range of market environments. Our technology-enabled, multi-channel platform creates a unique opportunity to partner with additional financial service providers that can benefit from our scale, distribution, and sales culture. Few originators have the resources or expertise to make this transition at scale. When refinance and purchase opportunities return, we will be ready to move just as quickly to capture them. this is what it means to be built to compete across market cycles while important work remains we believe we have the discipline and focus to increase operating leverage and cost containment necessary to continue progressing towards sustainable profitability over time with that I will now turn the call over to Dave who will take us through our financial results in more with detail. David?
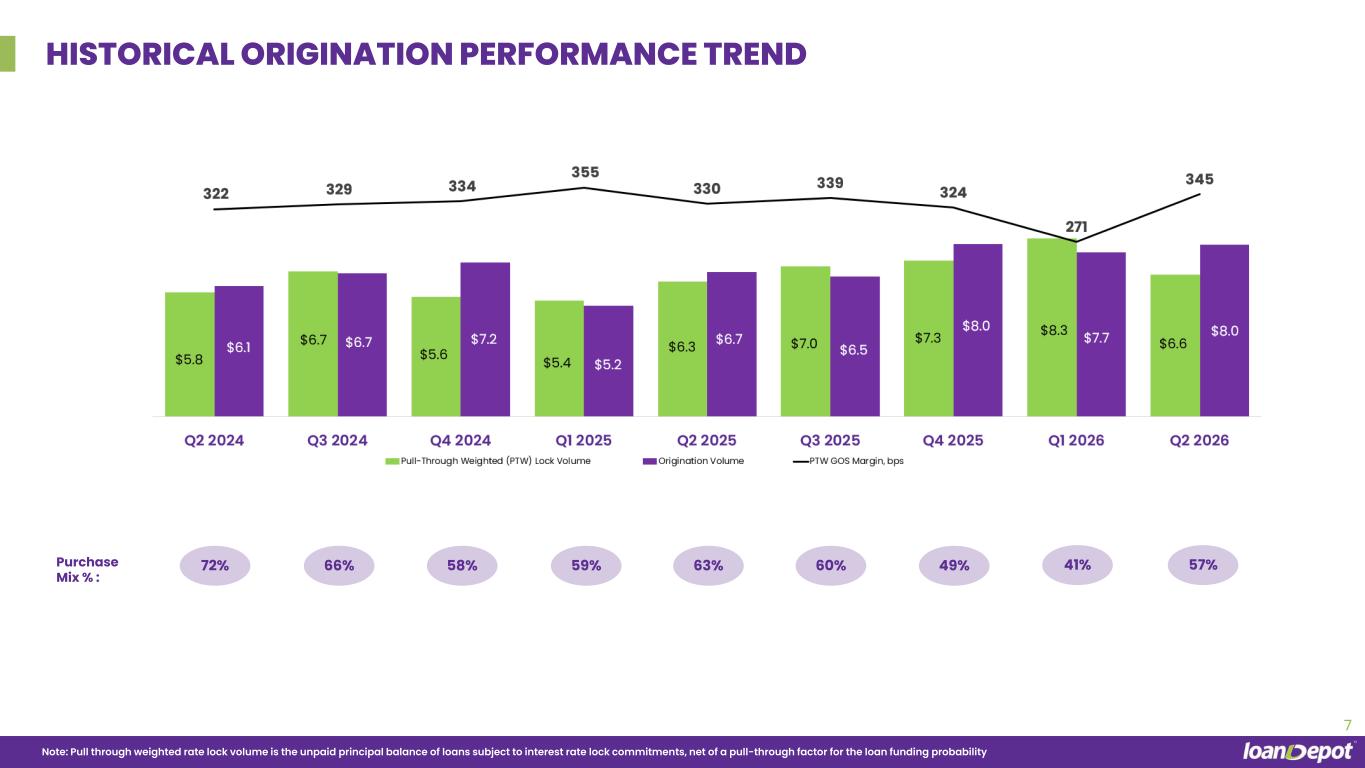
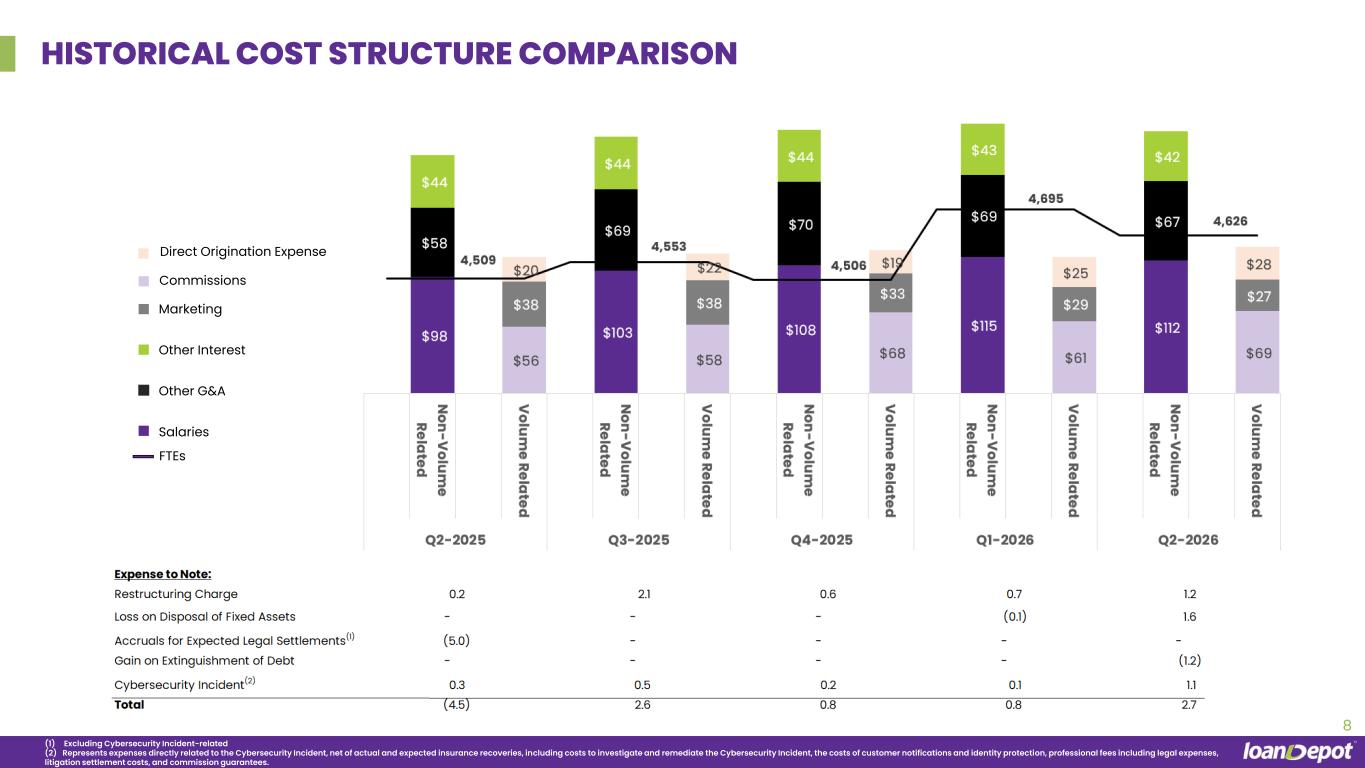
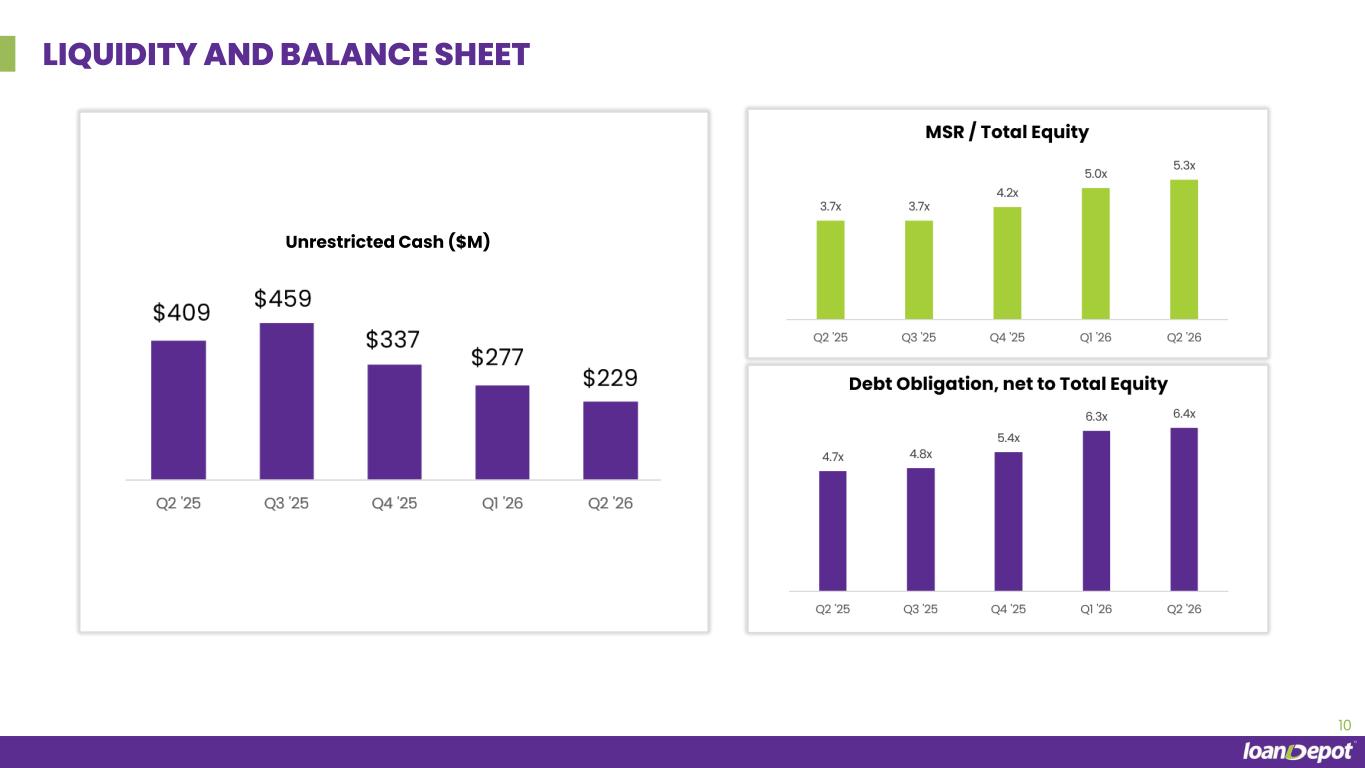
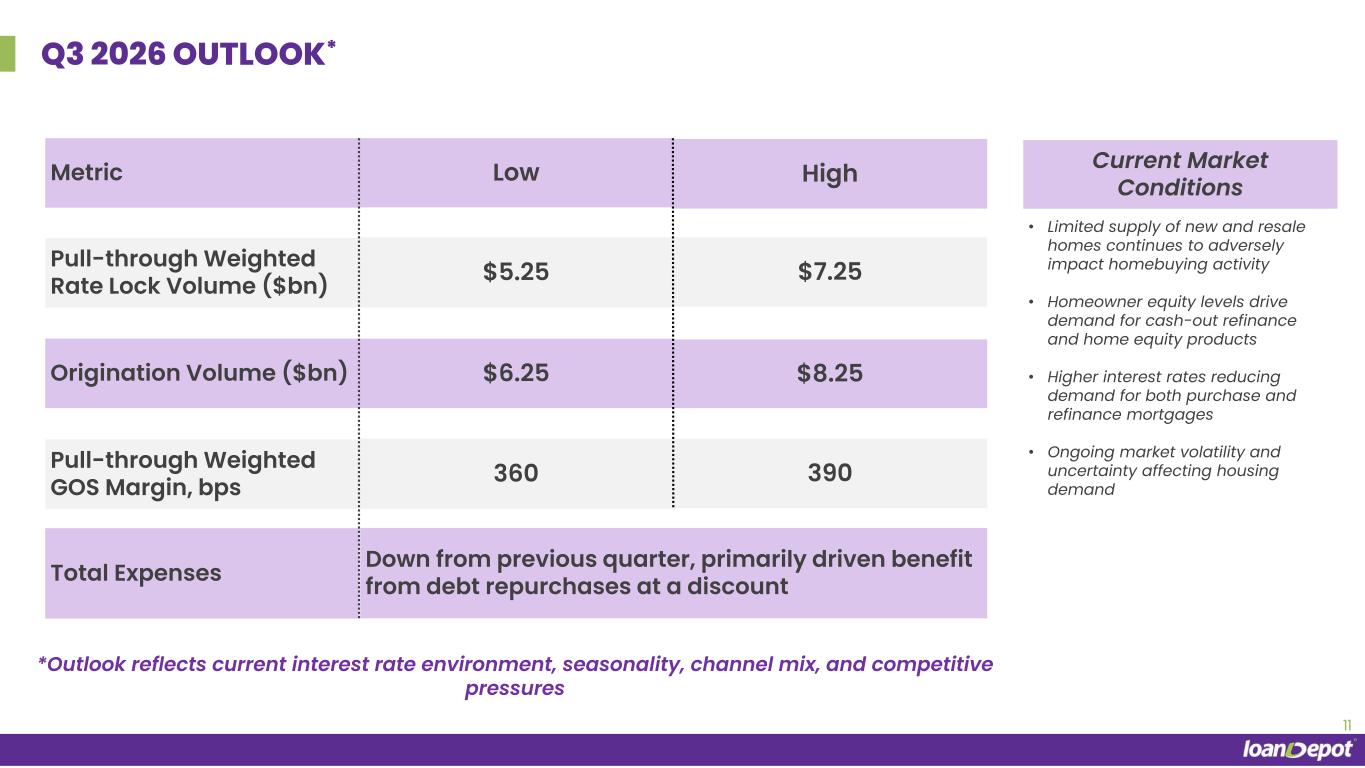
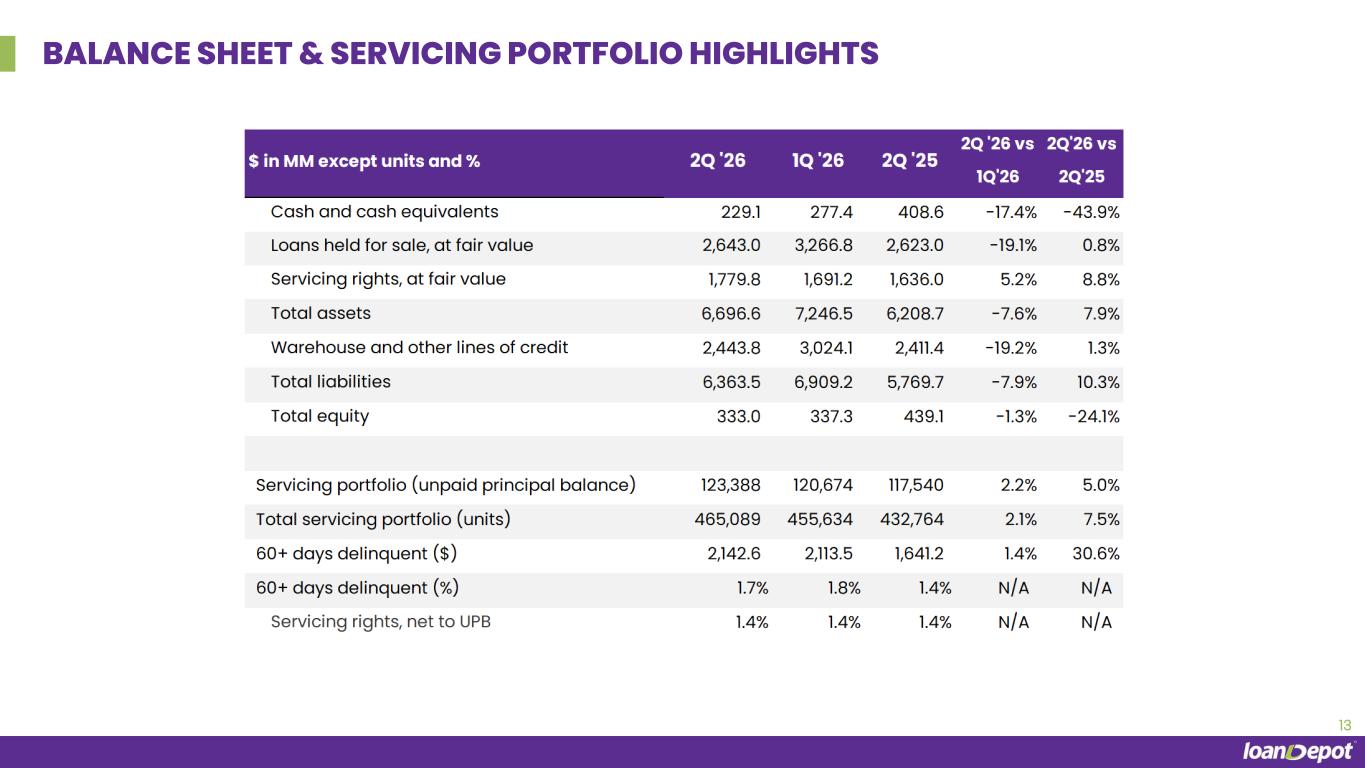
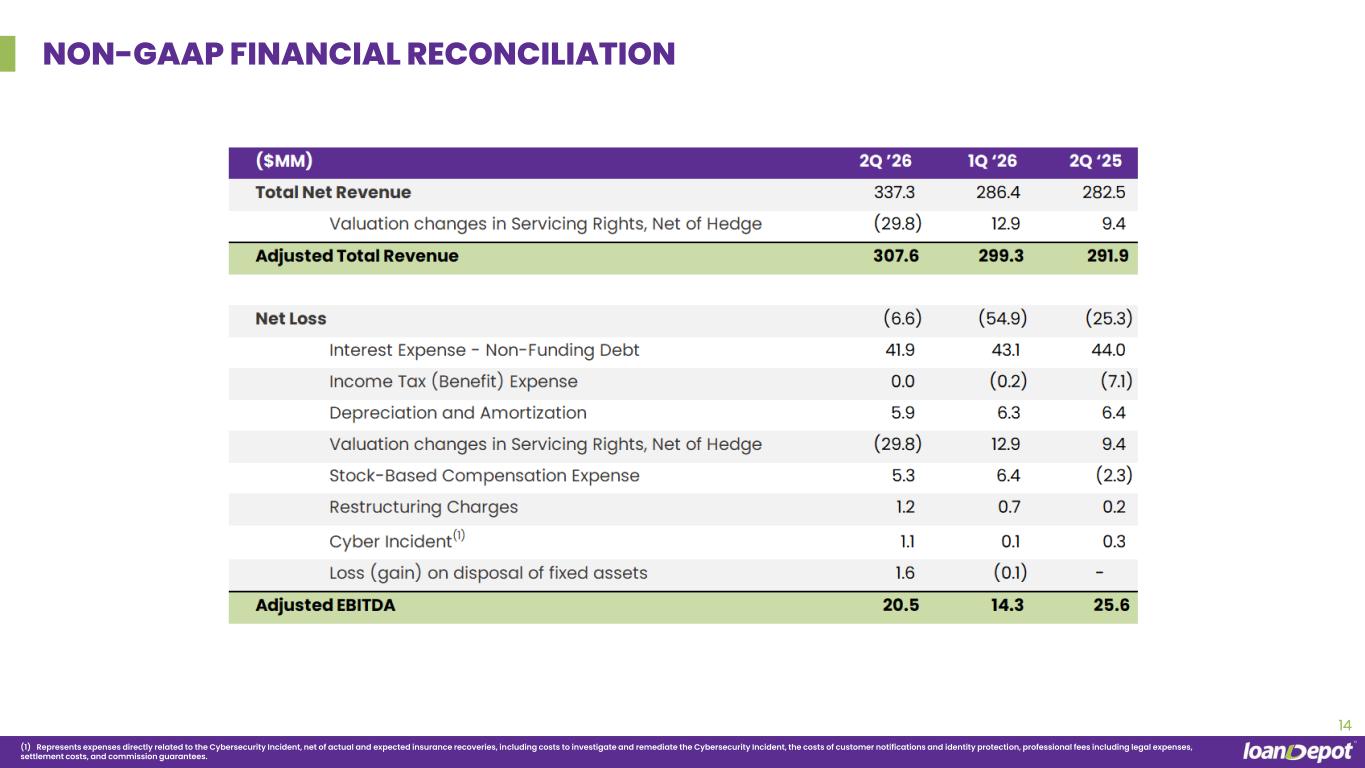
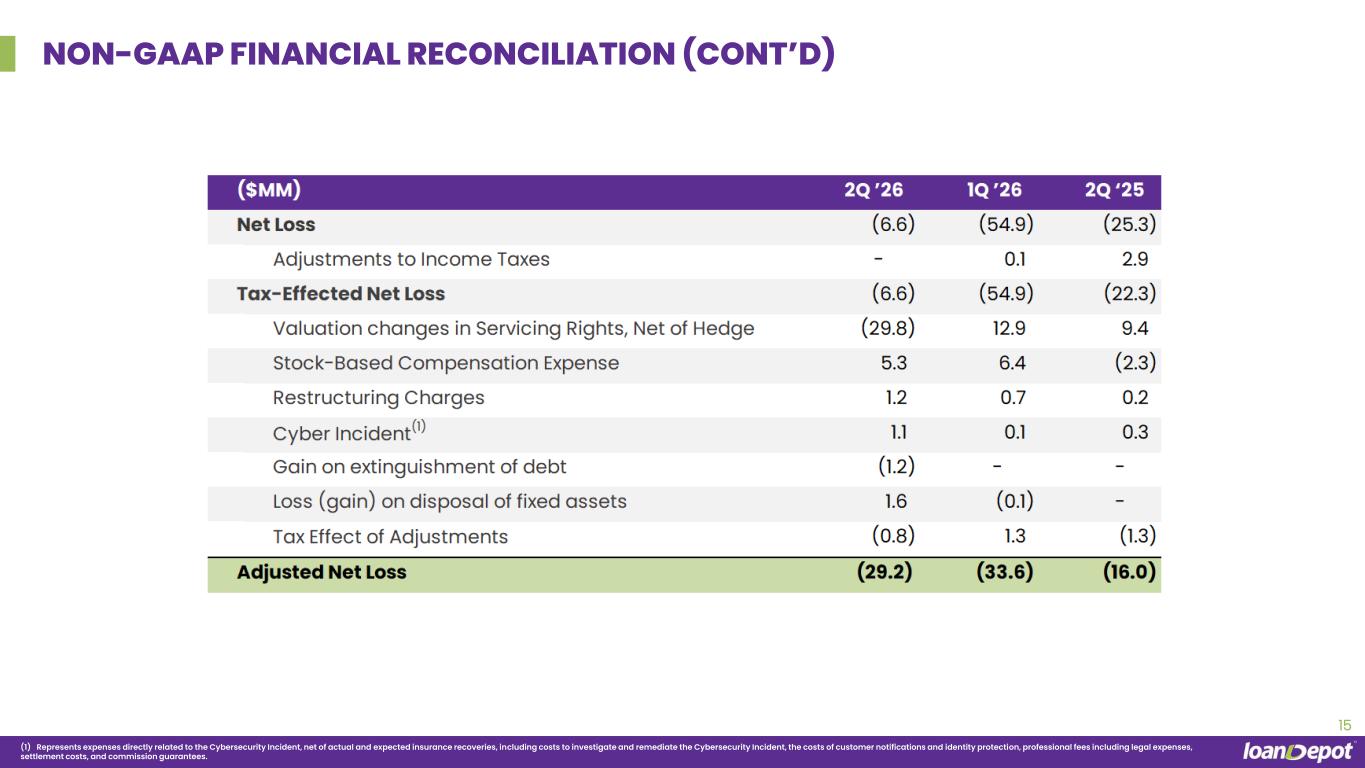
Thanks, Anthony, and good afternoon, everyone. The second quarter marked another meaningful step forward in our financial performance, demonstrating that we can grow volume while maintaining a focus on efficiency and profitability. We reported an adjusted net loss of $29 million in the second quarter compared to an adjusted net loss of $34 million in the first quarter due primarily to higher adjusted revenue, while limiting expense growth to primarily volume-related costs. During the second quarter, our loan origination volume was $8 billion for the quarter, an increase of 4% from the prior quarter's volume of $7.7 billion. This was within the guidance we issued last quarter of between $7.25 billion and $9.25 billion. The increase in closed loan volume was more notable given the mixed shift towards smaller 5x5 home loan products which carry a smaller loan balance compared to traditional firsts. On a unit basis, we increased volume 25% during the quarter reflecting the success of the product in the investment in our loan officers. As Anthony stated, we increased both loan officers and their productivity since last year. Pull-through weighted rate lock volume was $6.6 billion, which represented a 20% decrease from the prior quarter's volume of $8.3 billion. As a reminder, pull-through weighted rate lock volume is down primarily due to the product mix shift to HELOC, which does not record a lock. Pull-through weighted rate lock volume also came in within the guidance we issued last quarter of $5.75 billion to $7.75 billion and contributed to adjusted total revenue of $308 million, which compared favorably to $299 million in the first quarter. Our pull-through rated gain on sale margin for the second quarter came in at 345 basis points within our guidance range of 330 to 360 basis points and up compared to 271 basis points in the prior quarter. Our higher gain on sale margin primarily reflected product mix shift. The higher rate environment suppressed demand for first trustee loans, but demand for higher margin 5x5 home loan HELOC products increased. Their contribution can be seen in the 60% increase in origination income for the prior quarter. Servicing fee income increased from 109 million dollars in the first quarter to 112 million dollars in the second quarter, primarily due to a larger portfolio size and higher interest credit on our escrow balances. We hedge our servicing portfolio so we do not record the full impact of the changes in fair value and results of our operations. We believe the strategy helps protect against volatility our earnings and liquidity. Our strategy for hedging the servicing portfolio is dynamic and we adjust our hedge positions in reaction to changing industry environments. Maintaining a strong liquidity position remains a top priority for us, and as such, we took advantage of a strong market conditions to monetize approximately $10 billion of our servicing rights post-quarter end. We expect this trade to settle later in the year and will be reflected in the coming quarters. Our total expenses for the second quarter increased by $2 million or less than 1% from the prior quarter. The primary drivers of this increase were higher commissions and direct origination expenses reflecting the increase in origination volume. This was partially offset by the progress on operating leverage metrics that Anthony mentioned. Looking ahead to the third quarter, we expect pull through weighted lock volume of between $5.25 billion and $7.25 billion and origination volume of between $6.25 billion and $8.25 billion. These ranges reflect an ongoing mix shift as our five-by-five home loan product continues to be a popular product in the current rate environment. HELOC volume is not reflected in the LOC volume, but it is reflected in the closed loan volume. It is also worth noting that the shift to HELOC production resulted in higher unit volume and contribution margins, albeit at smaller average loan size. We expect our third quarter pull-through weighted gain on sale margin to be between 360 and 390 basis points. Our total expenses are expected to decrease somewhat in the third quarter, primarily due to the benefit of repurchasing our corporate debt at a discount, partially offset by higher volume-related costs as we continue to drive growth in our HELOC product. As part of our ongoing cost management strategy, the company has begun actioning approximately $12 million of annualized productivity initiatives progressing through the remainder of the year. We ended the quarter with $229 million in cash, decreasing by $48 million from the first quarter. However, the previously mentioned MSR sale and other financing strategies in flight should mitigate this decrease going forward. Additionally, we repurchased $16 million of senior notes at an average purchase price of 90% of PAR during the quarter and repurchase an additional $27 million of notes at an average purchase price of 86% of PAR post-quarter end through July 30, 2026. Finally, we continue to evaluate opportunities to optimize our capital structure. Addressing the company's bond materials remains a high priority for the management team, and we're evaluating a range of options with the help of our retained advisors. Anthony stated this earlier, but it bears repeating. Our goals are to continue investing and driving top line in market share growth, reducing our costs and increasing operating leverage, and applying automation and technology across the origination and servicing businesses to achieve consistent profitability in any environment. With that, we're ready to turn it back over to the operator for Q&A. Operator?
Operator
We will now begin the question and answer session. If you would like to ask a question, please press star one to raise your hand. To withdraw your question, press star one again. We ask that you pick up your handset when asking a question to allow for optimum sound quality. If you are muted locally, please remember to unmute your device. Please stand by while we compile the Q&A roster. Your first question comes from the line of Doug Harder with BTIG. Your line is now open. Please go ahead.
Thank you and good afternoon. On your guidance and as you think about the third quarter, you know, how should we think about the mix between HELOC and first mortgage and how that influences kind of the gain on sale range that you gave and volume range, you know, and I guess included in that, like, how do you think about on a like for like basis, the products, how the gain on sale margin is trending in the third quarter versus the second?
Hi, Doug, Anthony Shay here so you know I'm going to answer the question assuming rates are going to stay relatively in the same you know zip code and of course you know as rates change you're going to see a return and first mortgages more pronounced on the refinance side than on the resale or purchase side but certainly you know all that is directed by what happens to interest rates The home equity market, Doug, has been a strategy since my return. It has taken some time to retool marketing, retool technology, and to retool our point of sale system as well as retraining of our sales staff. So over the course of the last six months, this is starting to prove some traction. And the momentum is finally here. We're feeling pretty good about it. The market is a new entrant for us. So we do expect the momentum to continue. We are starting to be very opportunistic by adding loan officers on the direct lending side. I think you might have seen we just announced a new opening of our Miami Center, which will give greater coverage to the East Coast and that particular time zone. So, understanding the competition in the home equity market is uniquely different, Doug, than refinance as well as purchase market. A traditional mortgage player, it is much more difficult for a traditional mortgage company to attack the home equity market because you're relying on your loan officers to generate the production for you. Where in this case, the company generates the leads at the top of the funnel utilizing our capacity and our ability to develop loan officers organically to fulfill the customer's demand. So over Q3, we expect home equity to continue. But your question of what is the ratio there, it really depends on the interest rate sort of movement. Because as rates do fall, you're going to see the return of first mortgages. But if it stays static, I think you You can, I think you can safely assume that we will continue to penetrate and grow our HELOC volume, which ultimately will slant the margins upward.
I appreciate that, Anthony. And then just a clarification on the MSR sale. I guess what is the size? The presentation says $12 billion. I think you mentioned $10 billion. And is there any way you can frame kind of the total dollars that you expect to receive from that sale?
So, the sale was $10 billion. We'll double-check what your reference was on the 12. We did do a $12 million cost savings program, which was announced. But the overall sale of the portfolio was $10 billion.
So, yeah, slide six of your presentation has $12 billion.
Great. And any sense of the size, the amount of cash that you expect to receive from that?
Hey, Doug, it's Jeff DeGurion. We'll just say that the trade executed well through our marks. And, you know, we continue to evaluate opportunities in the market, as we've stated before on other calls. And we decided to execute here because it made sense given all the factors considered.
Operator
Your next question comes from the line of Mihir Bhatia with Bank of America. Your line is now open. Please go ahead. Please remember to unmute your device locally. Thank you.
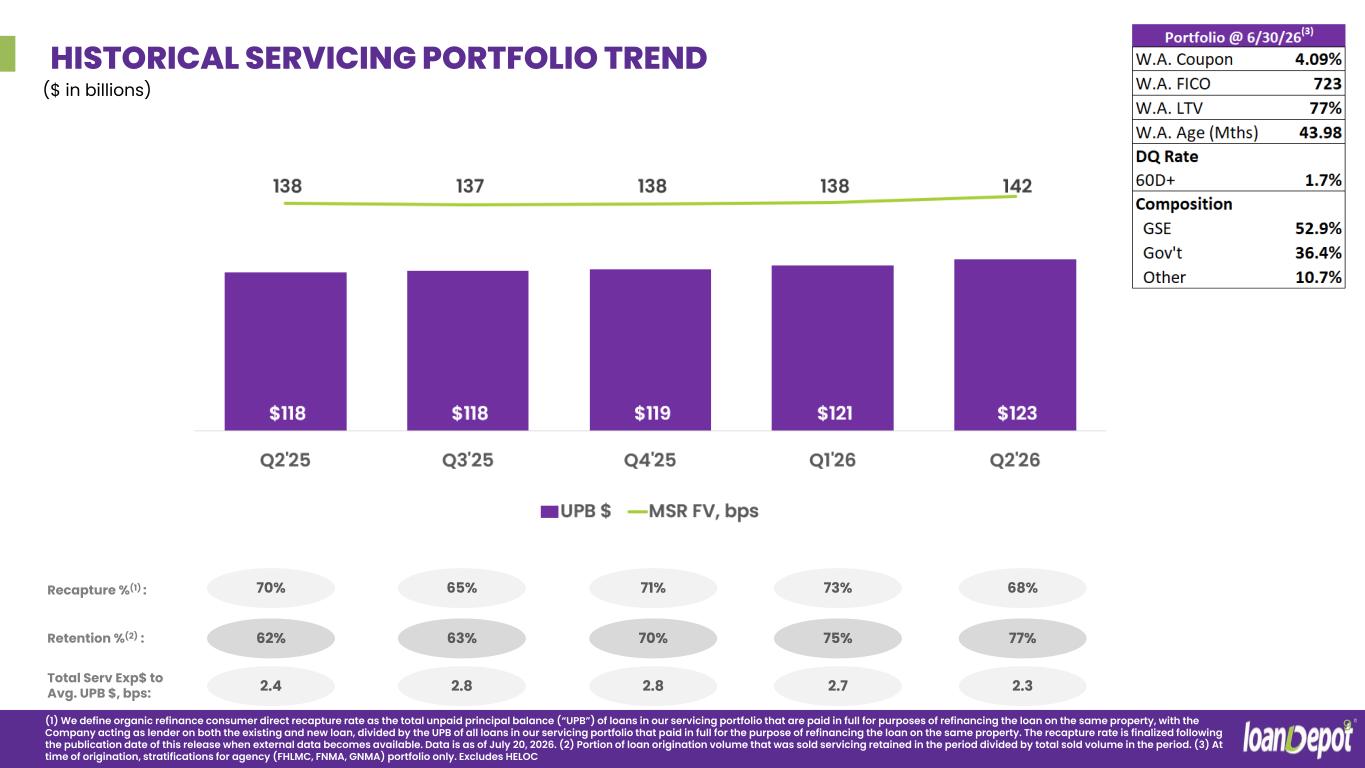
Hi, this is Caroline Lada. I'm on for Mihir. Thanks for taking my question. So looks like we're captured declined sequentially about five points. Was that driven primarily by customer behavior, competitive intensity or makeshift towards the home equity products and what recapture level should we think about going forward?
There's really no particular cause, Caroline. I would guess that it's due to the fact that interest rates went up Q2 over Q1. So, anytime rates go up, you'll have less attractiveness for consumers. I do expect that that amount of recapture will increase as we continue to develop our home equity offering. So I don't expect that to materially change over Q3.
Okay, cool. Thank you. And then maybe just on wholesale, since it was reintroduced earlier this year, is there any like quantitative metrics you can give us about where wholesale stands today and whether that channels tracking ahead of or behind where you contemplated when you re-entered the market?
Yeah, great question. Wholesale business is a compliment for us, Caroline. It is, you know, never slightly to be a major contributor of ours. But so far, I think it's been five or six months since we introduced it. We are tracking ahead of schedule. And so far, the business is doing quite well. And we've had positive responses from the broker community.
Operator
Your next question comes from the line of Mikhail Goberman with Citizens JMP. Your line is now open. Please go ahead.
Hey, good afternoon. Thanks for taking the question. Just wanted to get your general thoughts on the competitive landscape out there. We've seen some of the big banks report some pretty good numbers for origination sequentially. just wondering if they're taking share at the margin and just your general thoughts on the competitive landscape from a kind of big picture point of view. Thank you.
We haven't seen an increase in competitive pressure. Within the last 24 hours, we've had some news in the marketplace where a couple of competitors have exited the mortgage market or changed their strategy towards more of a B to B structure rather than consumer direct. What we've seen over the last quarter is our ability to hold on to margins in both purchases and refinances and our purchase share as an example from Q1 to Q2 our purchase share went up 33% while our volume increased 44%. on purchase business. At the same time, as we enter the home equity market from April to June, as an example, we have reduced our loss tremendously in April discounting fair value. We entered the quarter at a $15 million loss in April. And in June, we reduced that to 2 million. so we can see clear progress on our market penetration because we're entering a completely new market segment, which is the home equity market.
Thanks for that. And just if I can squeeze one more in your thoughts on technology and AI endeavors, you know, within the firm going forward any um any plans to sort of uh ramp things up and uh how would that lead to um further kind of operating leverage possibilities um yeah thank you yeah don marchetti's on on the line so don do you want to take that and maybe i can compliment your answer yes i'd love to Yeah, we've been spending huge focus on, first, the team, that we're able to take full advantage of the team and execute against our strategies.
We're leveraging the fact that we already have a proprietary platform and control of our own destiny. We have a diversified sales platform. Inside of that, we're very focused, first and foremost, on revenue-generating top-of-funnel emphasis with contact, transfer, origination-focused tools. and we've seen a huge benefit there that's enabled obviously five by five and our ability they can add diversified products on top of that platform second focus has been clearly around operational efficiency measures and we're already receiving feedback around you know very very highly improved performance from the agencies as it relates as it relates to verification processes and some of the underlying tools and capabilities that we've been leaning into and lastly just leveraging, you know, automation through a combination of pools available in the market and doubling down on our proprietary platform to drive, you know, additional opportunities that allow us to scale very, very effectively when interest rates decrease, and like I said, already seeing benefits of that in the notes that Anthony shared.
Great. Thank you. I appreciate it. Yeah, I just want to add to what Dom is saying real quickly, and that is, you know, this organization is about deploying modern technology so that it gives us a competitive advantage. AI right now everyone has a Q acronym or a nickname to their system. I think getting beyond all the cuteness of all the new entrants I think you need to really understand how to develop this technology and utilize it so that gives you a competitive advantage. edge. We continue to study it, we continue to evaluate it, and we continue to make the investments where it gives us an edge. AI will fundamentally change this industry, and we believe that given our assets and our strategy and our uniqueness of touching the customer at the top of the funnel, it's going to benefit us greatly. Thank you. Thank you.
Operator
There are no further questions at this time. I will now turn the call back to Anthony Shea for closing remarks.
Thank you. On behalf of Dave, Jeff, Dom, and the rest of our team, I want to thank you for joining us today. Since my return as CEO, I have been laser-focused on our digital transformation as a key enabler of our return to our market-leading position. We have focused on fully leveraging our unique assets and strategy, including one of the most differentiated customer acquisition or retention business models in the marketplace today. I'm proud of the work that has been accomplished since my return to a full-time operating role. Ultimately, our goals are to deliver profitable market share growth, improve the customer experience, drive customer retention, and deliver long-term shareholder value. This is our mission and what we are working towards every day. This is how we win. Executing these objectives positions us to create sustainable value for our shareholders while accelerating growth in a competitive landscape. So thanks again everyone and I appreciate your support. Bye for now.
Operator
This concludes today's call. Thank you for attending. You may now disconnect.