Operator
Greetings and welcome to the LTC Properties First Quarter 2026 Earnings Call. At this time, all participants are in a listen-only mode. Joining us on today's call are Pam Kessler, Co-President and Co-Chief Executive Officer, Clint Malin, Co-President and Co-Chief Executive Officer, Cece Chiquel, Executive Vice President and Chief Financial Officer and Treasurer, Gibson Satterwhite, Executive Vice President of Asset Management, Dave Bowentano, Executive Vice President and Chief Investment Officer. Before management begins its presentation, please note that today's comments, including the question and answer session, may include forward-looking statements subject to risk and uncertainties that may cause actual results and events to differ materially. These risks and uncertainties are detailed in the LTC property filings with the Security and Exchange Commission from time to time, including the company's most recent 10-K dated December 31, 2025. LTC undertakes no obligation to revise or update these forward-looking statements to reflect events or circumstances after the date of this presentation. Please note this event is being recorded. I would now like to turn the conference over to LTC management. Please go ahead.
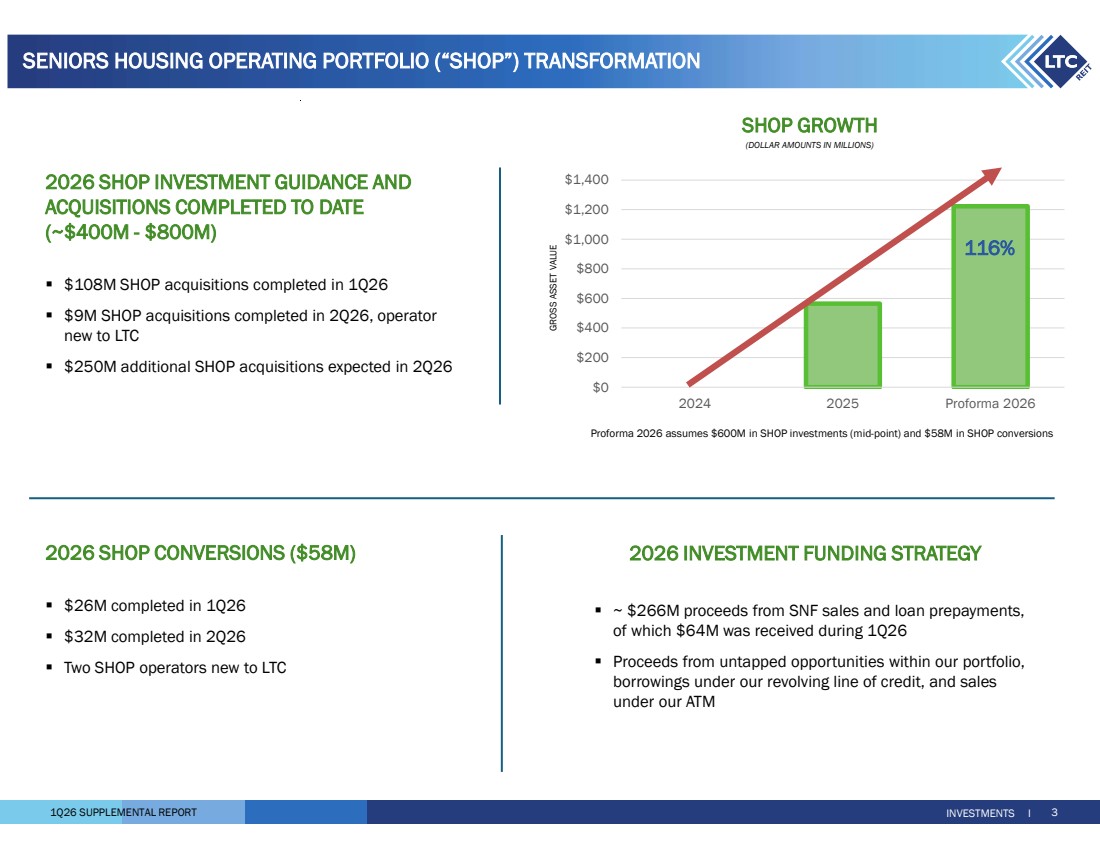
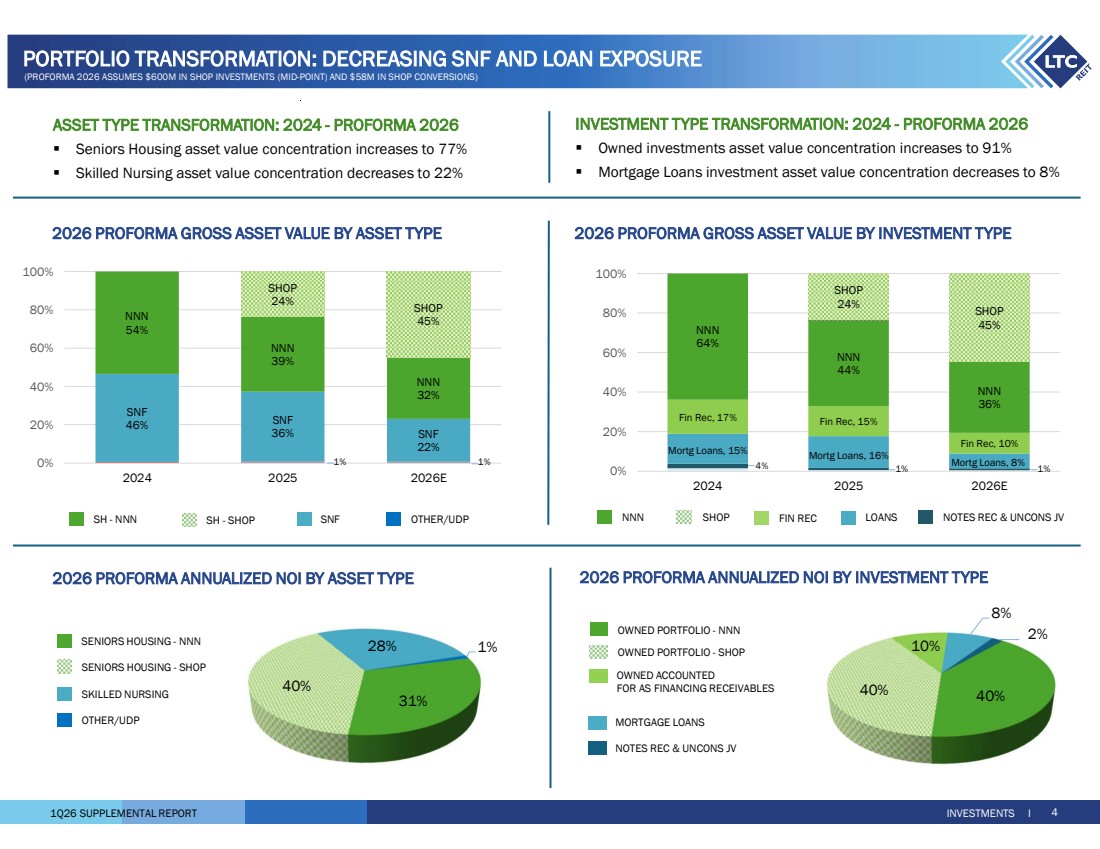
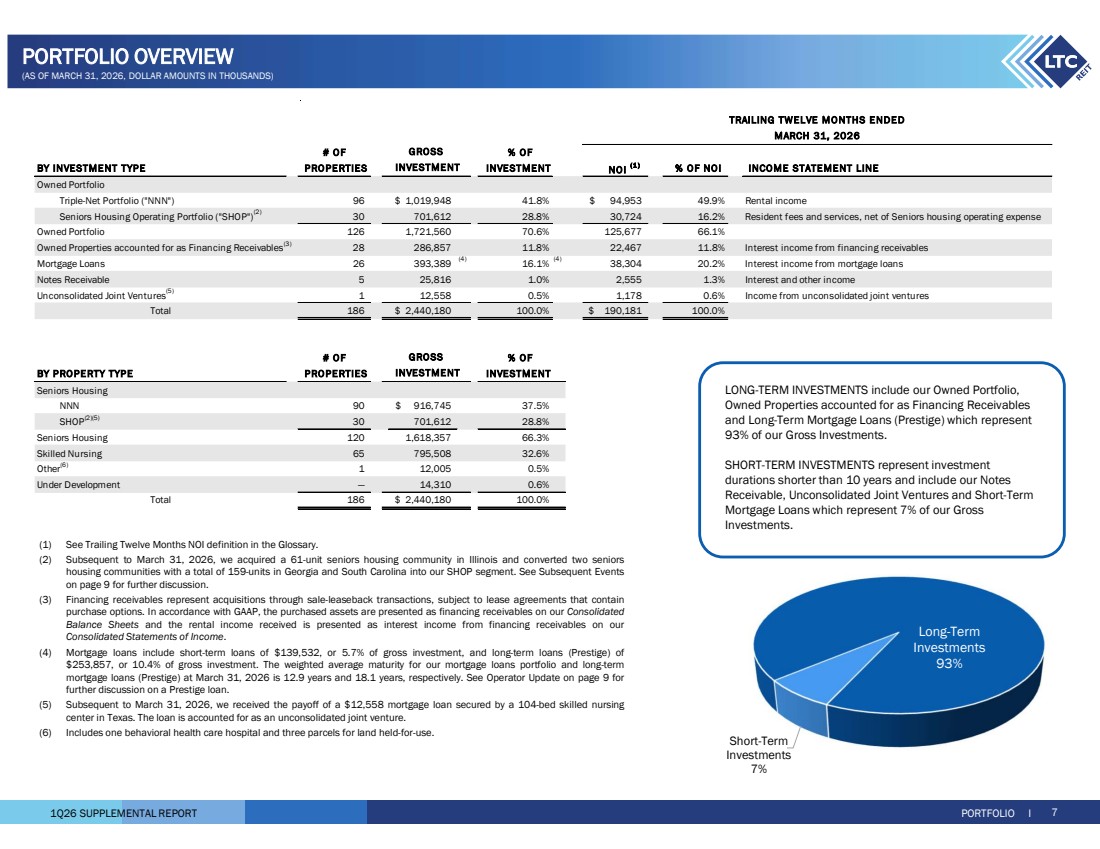
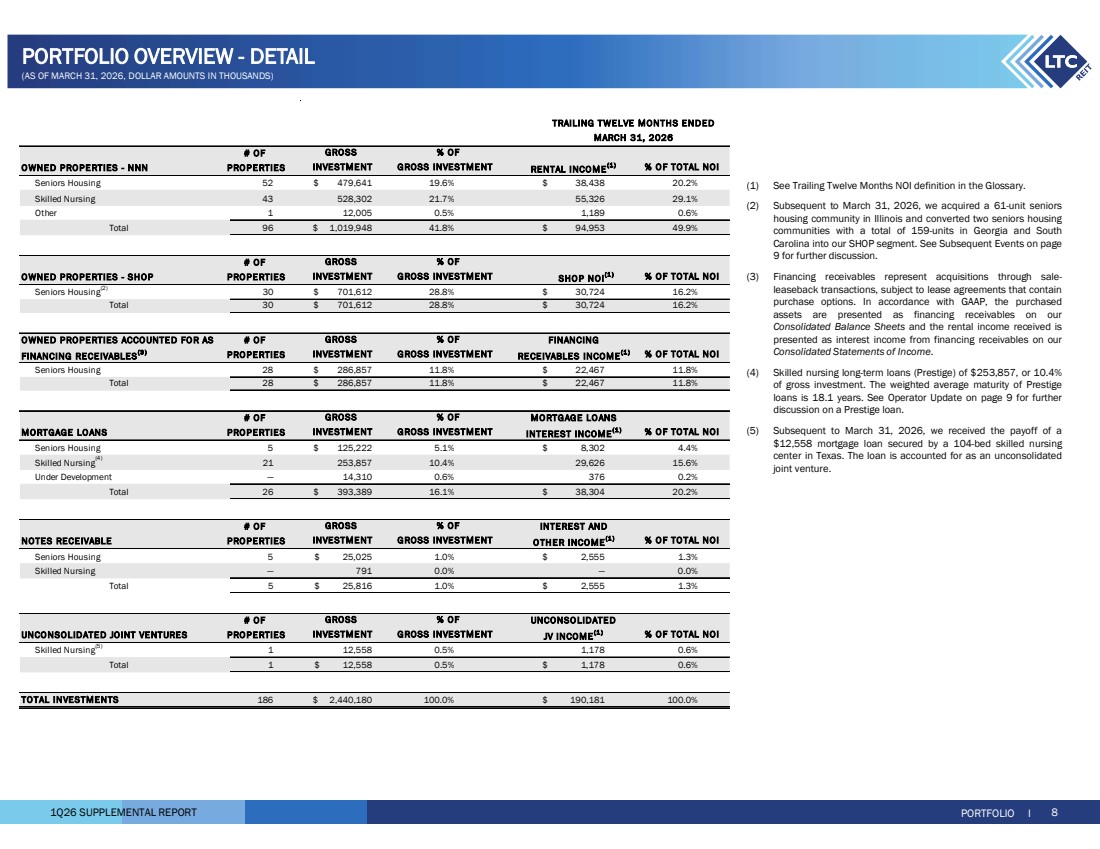
Good morning, and thank you for joining us. LTC is successfully executing our SHOP strategy. Our capabilities, reputation, and culture are resonating with sellers and operators, and these relationships are driving investment opportunities and record external growth, allowing us to scale incredibly quickly. We have strong conviction that our strategy is the right one to create a higher growth profile company with better risk-adjusted returns to drive shareholder value. With a shop currently projected to represent 45% of our total investments and 40% of annualized NOI by year-end, the shift in our portfolio mix is dramatically enhancing LTC's long-term ability to grow FFO and FAD per share above our historical rate. We are on track with our $600 million shop acquisition midpoint guidance, and with the expected closing of second quarter transactions, we will be more than halfway to that target. Additionally, to further increase our shop mix, we would consider transactions that capitalize on attractive skilled nursing pricing by recycling capital into higher-growth shop assets. Our operative partnerships, our relationship-centered culture, and our significant investment in the shop platform are driving our transformation and positioning LTC as a competitive force. I'll now turn it over to Gibson for more insight on the portfolio.
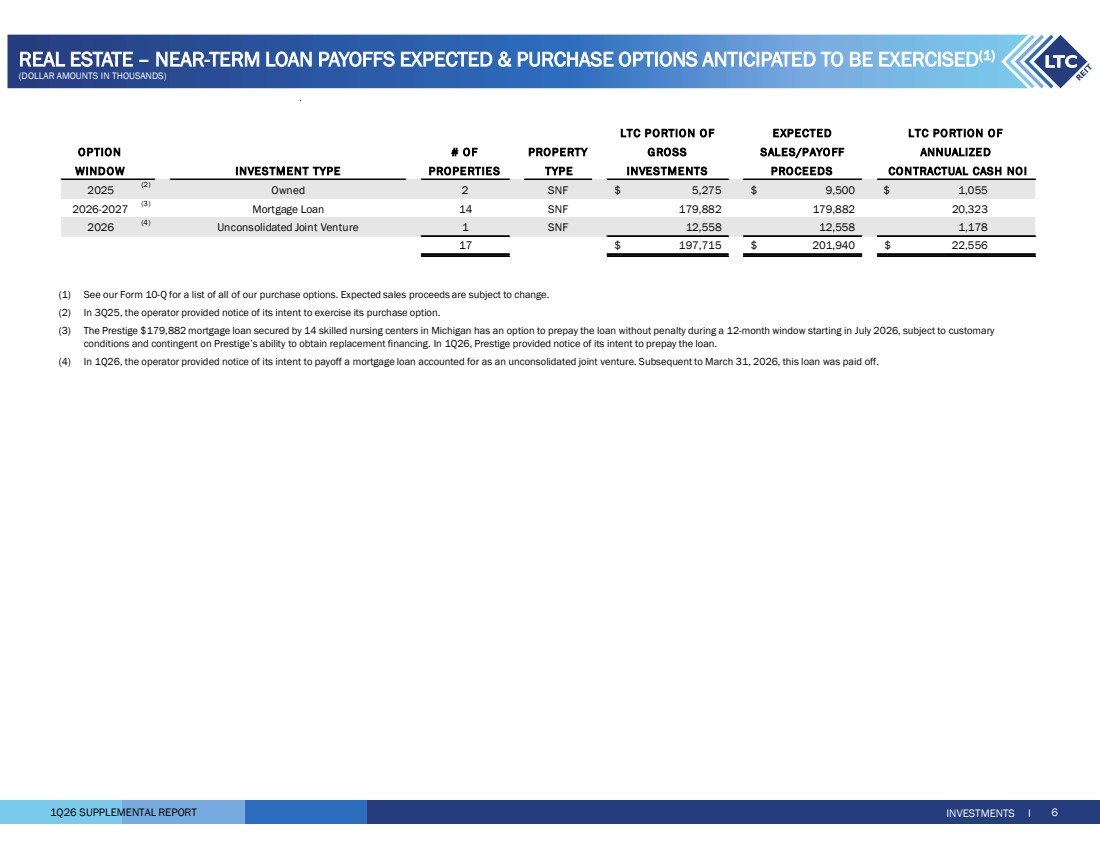
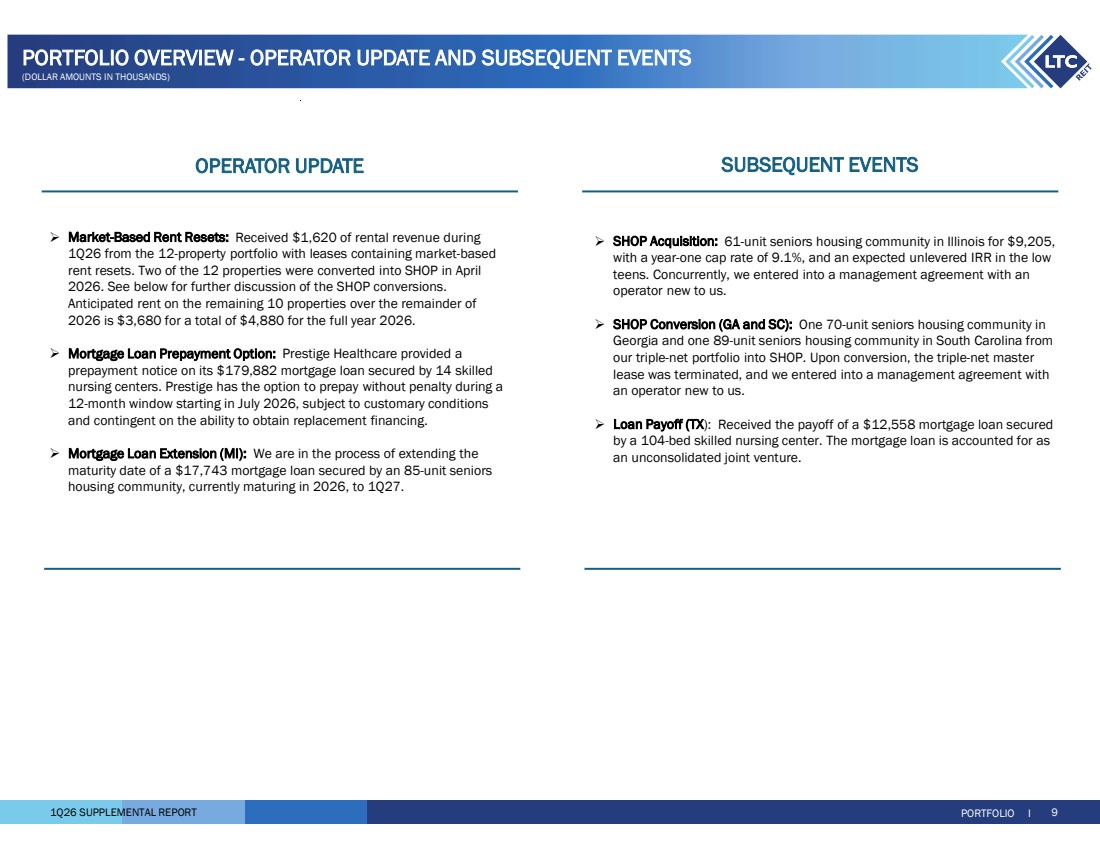
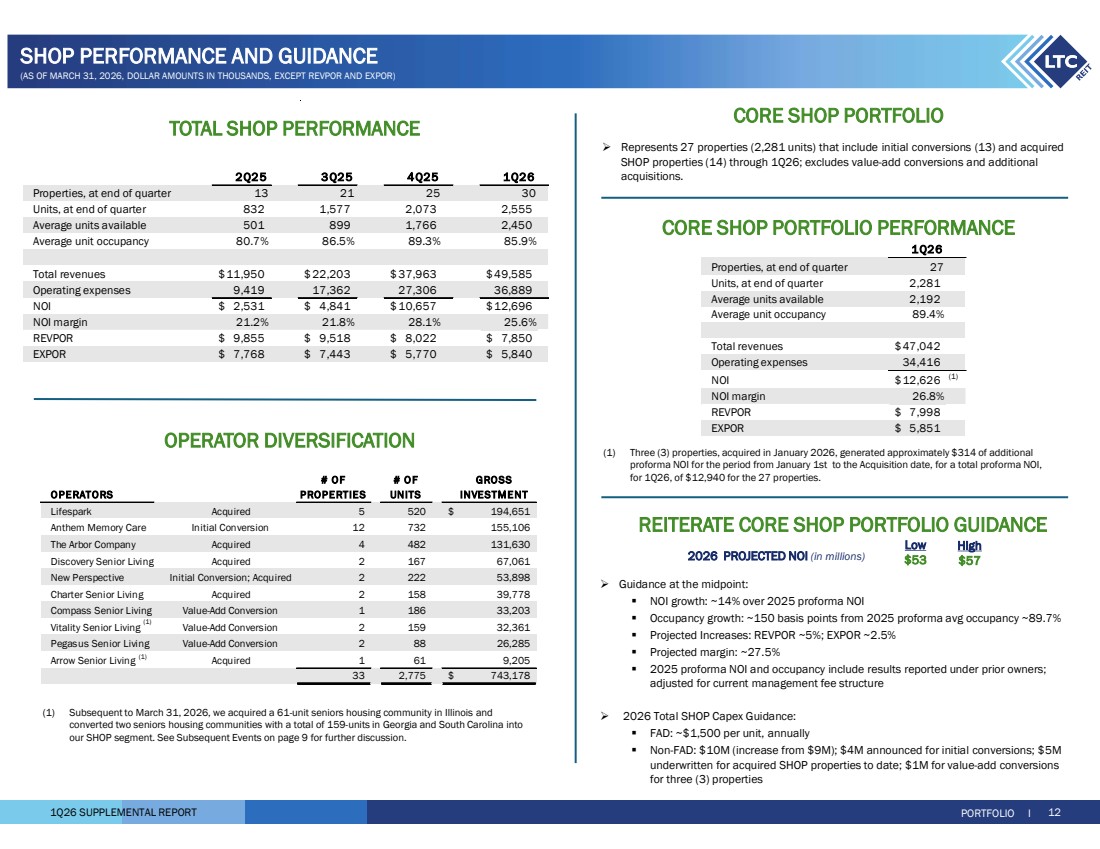
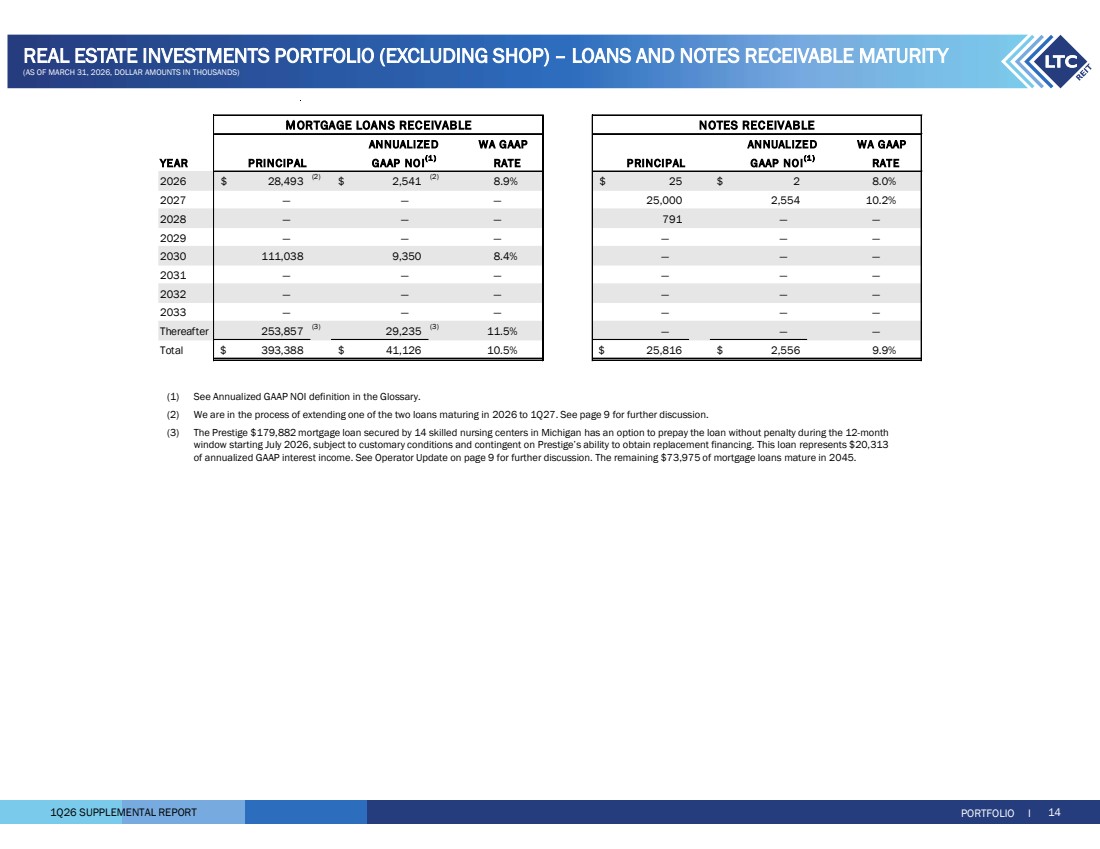
Thank you, Clint. We are focused on optimizing risk-adjusted returns for our shareholders by investing in our SHOP portfolio and opportunistically recycling capital, positioning LTC for higher intrinsic growth. As Clint noted, SHOP is expected to account for 40% of our annualized NOI by year-end, with the potential to expand even further. This target incorporates reinvestment of approximately $265 million in planned dispositions and loan repayments from skilled nursing assets this year. Of that amount, $77 million is closed and $190 million is expected to close in the third quarter. Our guidance projects the July 1 payoff of the prestige loan in line with their notice of intent earlier this year. SHOP performance continues to reinforce conviction in our strategy. First quarter SHOP NOI was in line with our expectations. For our core SHOP portfolio, which consists of 27 communities at or near stabilization, including those acquired through the first quarter of this year, we are reiterating prior guidance of 14% pro forma growth at the midpoint. You can find more information on this portfolio in our supplemental. To frame the impact of our transformation, the pro forma growth rate for our overall portfolio increases to 5% to 7% at our 40% shop NOI target from the low 2% range embedded in triple net leases. That change is driven by increasing exposure to shop assets with growth prospects in the low to mid teens over the foreseeable future. We can further increase our intrinsic growth rate should we choose to take advantage of opportunities to recycle more capital into shop given the strong pricing for skilled nursing assets. Our 2026 guidance includes platform investments, adding the people and data capabilities needed to scale and support double-digit shop growth. We expect the core infrastructure to be largely in place by year-end, enabling us to continue to scale rapidly and best support our operators. Now, I'll turn the call over to Dave to discuss investments.
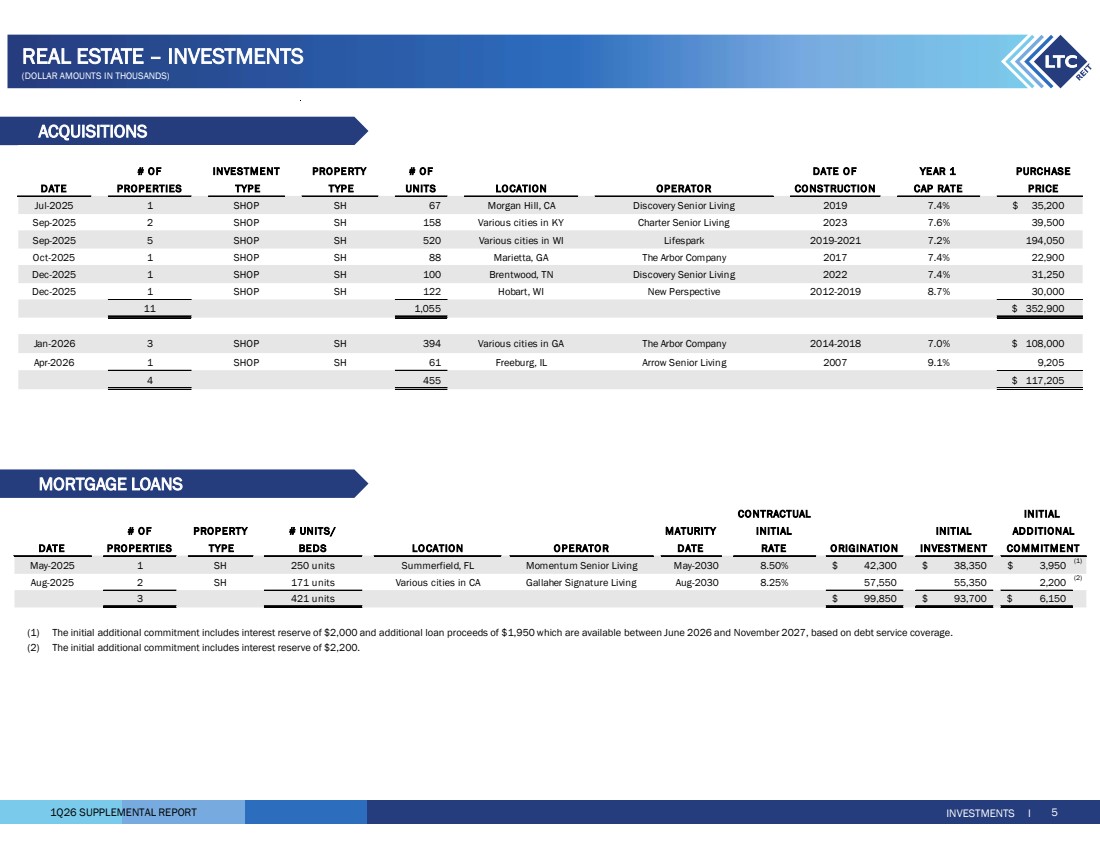
Thank you, Gibson. LTC has spent 18 months building a platform designed to execute with speed and certainty. We are well on track to achieving our $600 million midpoint investment target and believe, given the volume of opportunities we are evaluating, that a comparable level of annual investment is sustainable in 2027 and beyond. So far this year, we've closed around $120 million in investments with nearly $250 million on course to close in Q2. Additionally, we have signed LOIs for off-market third-quarter acquisitions totaling $90 million. Our pipeline continues to be robust with well over half a billion dollars of opportunities under consideration and visibility for continued investment growth. Our relationship-centric approach is working. By the end of the second quarter, we'll have 11 shop operators, including nine that are new to LTC in the past year, reflecting our success in retaining and growing with existing operators at the communities we've acquired. This strong pool of operating partners has been the source of several follow-on investments and provides great momentum as we continue to build our portfolio. E-LTC's growth is our legacy of deep industry relationships, which in combination with our transactional agility gives us an edge in gaining access and insights to growth opportunities. Several investments have come through partner referrals, underscoring the synergy of our culture and our commitment to relationships. And a number also have been off-market, demonstrating again the benefit of our relationship focus. Our rapid shop growth hasn't happened by chance. It is strategic and deliberate, reflecting an investment philosophy focused on assets 10 years of age or younger with operators of deep local and regional knowledge. We emphasize asset quality, size, mix, and market dynamics that favor a long-term competitive position. These criteria guide us toward the right balance of opportunities and durable returns. Today, we're seeing a high volume of potential transactions, and here again, our operator alignment is central to identifying the right assets and markets to support solid long-term performance. Experienced senior housing investors know that community performance depends on strong operating partners. LTC is deeply grateful for our operator colleagues and the excellence and commitment they bring every day to the seniors they serve. I'll now pass the call to CeCe for a review of our financial results.
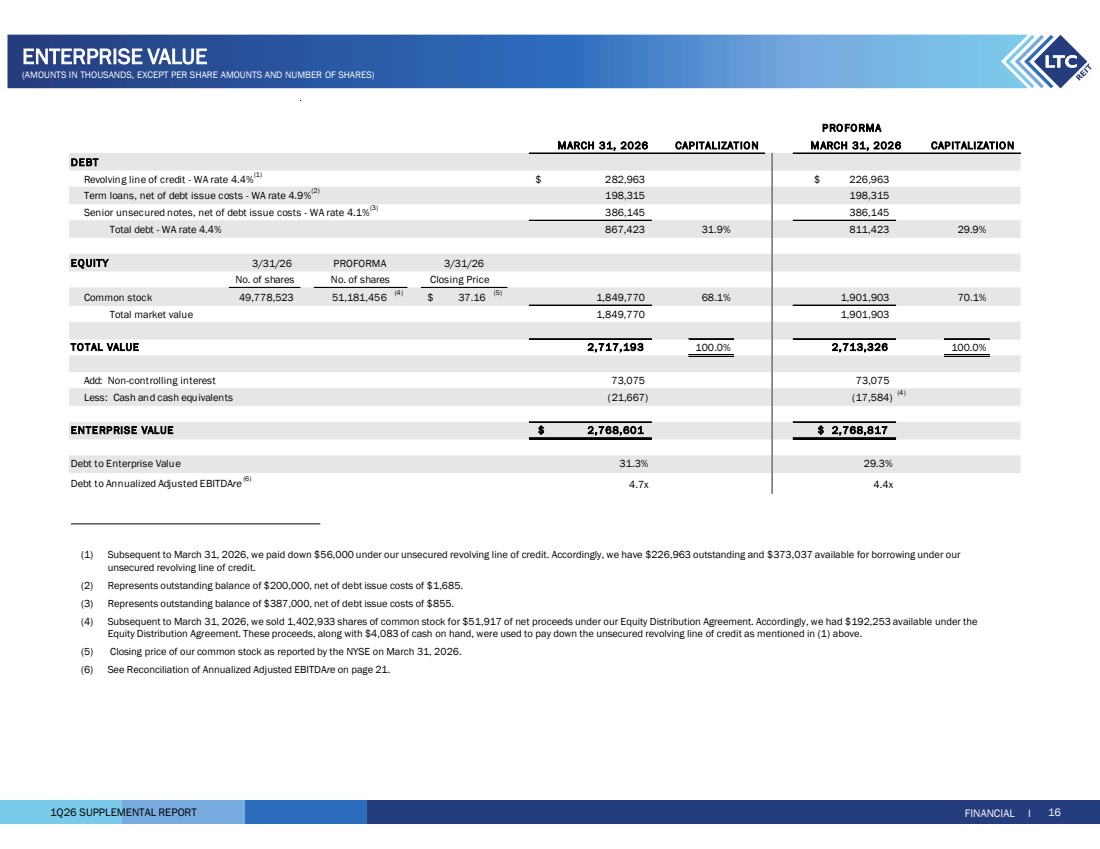
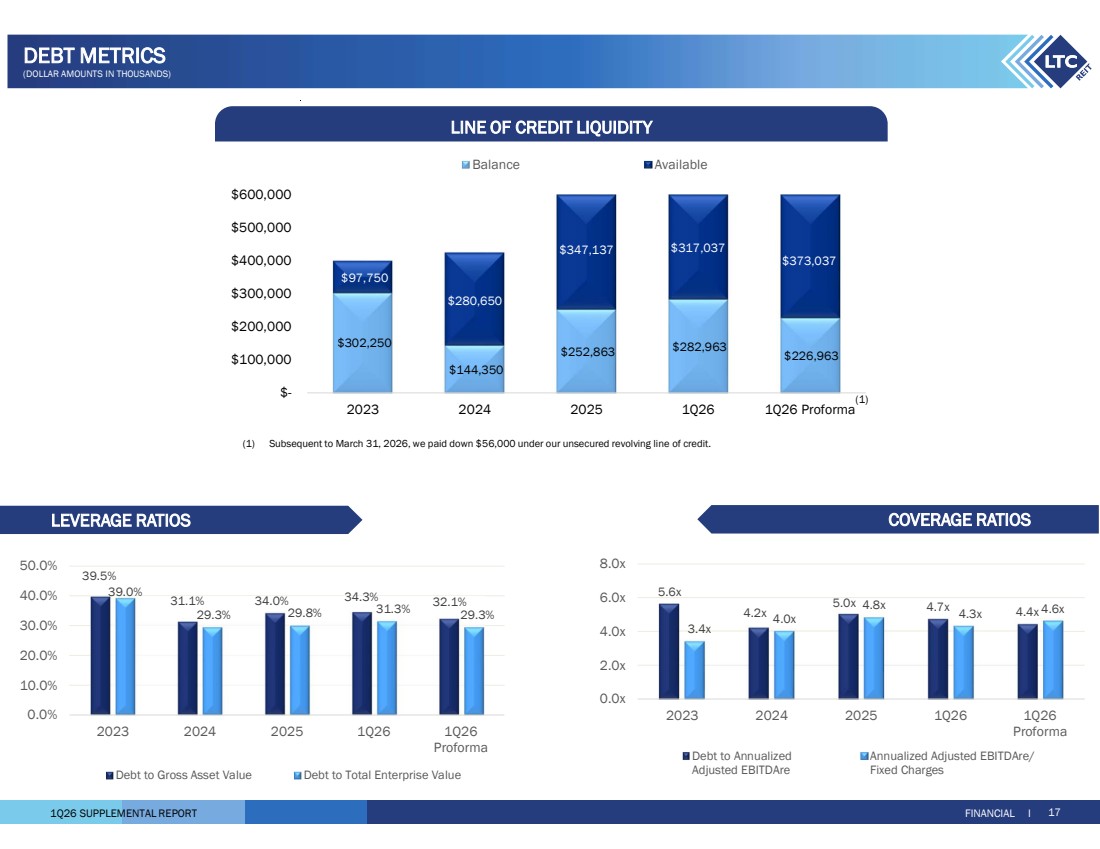
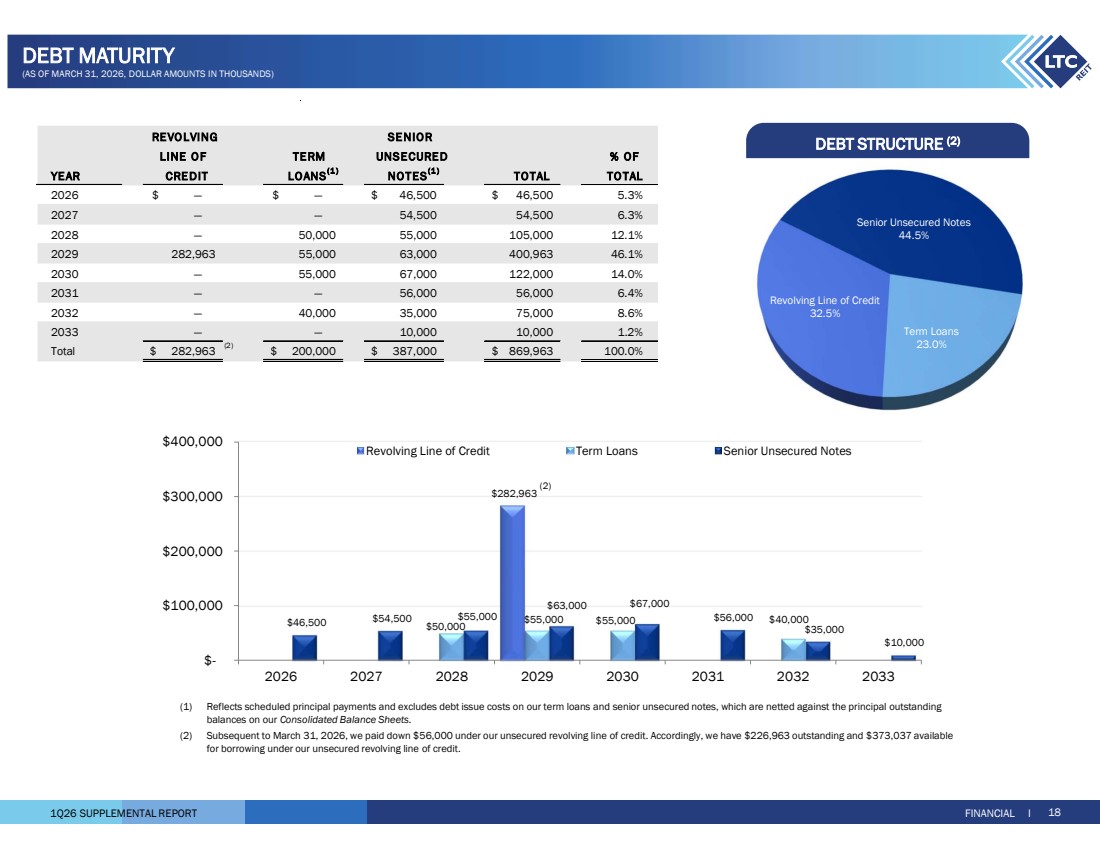
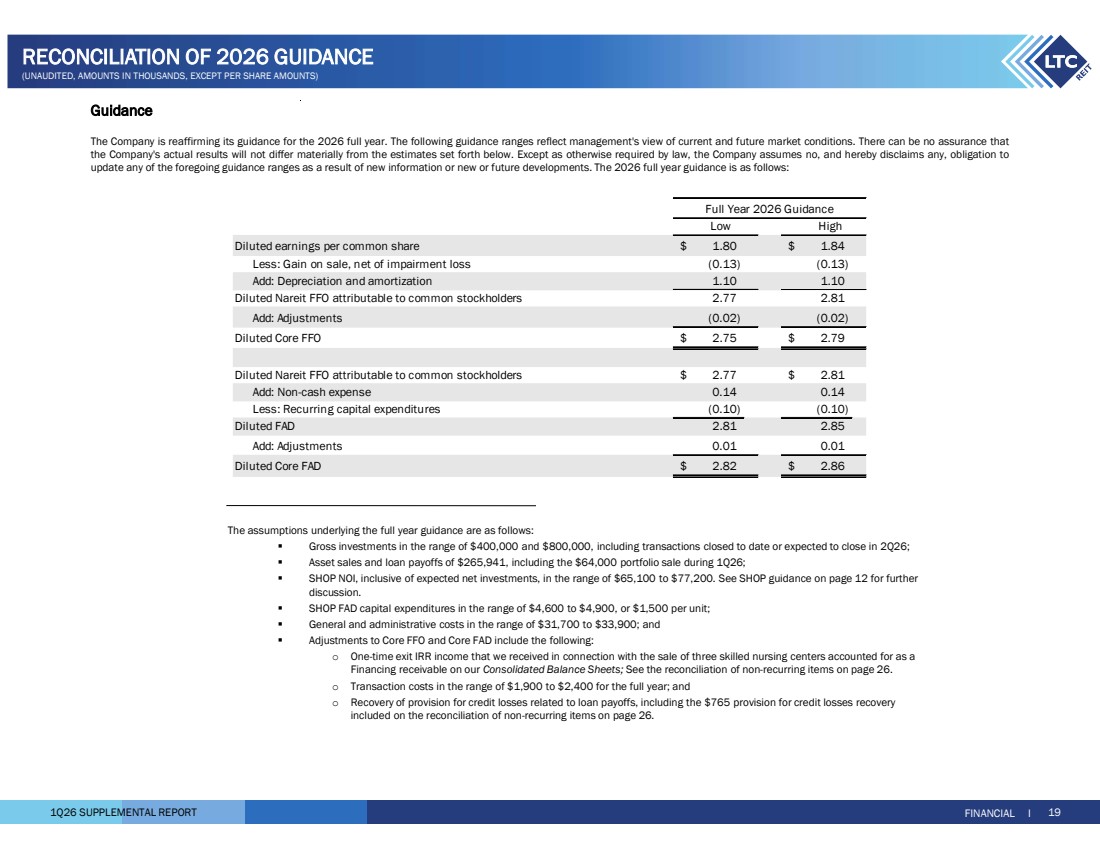
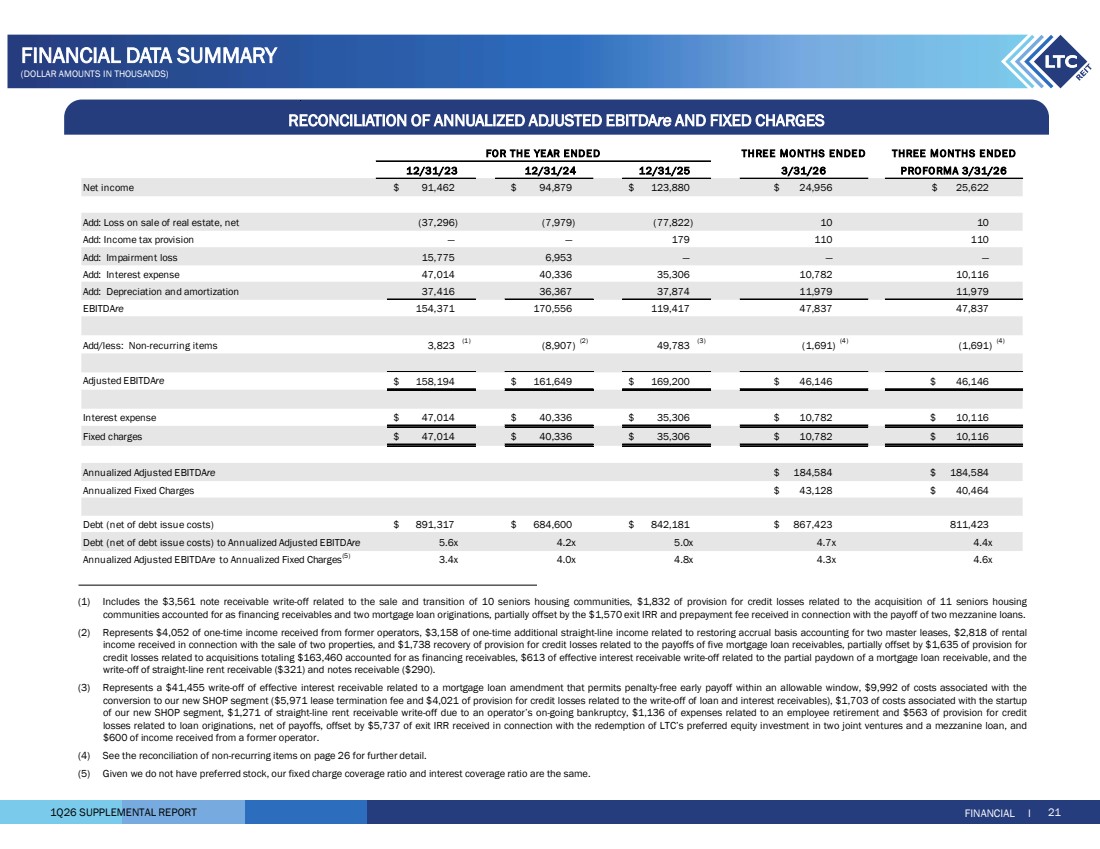
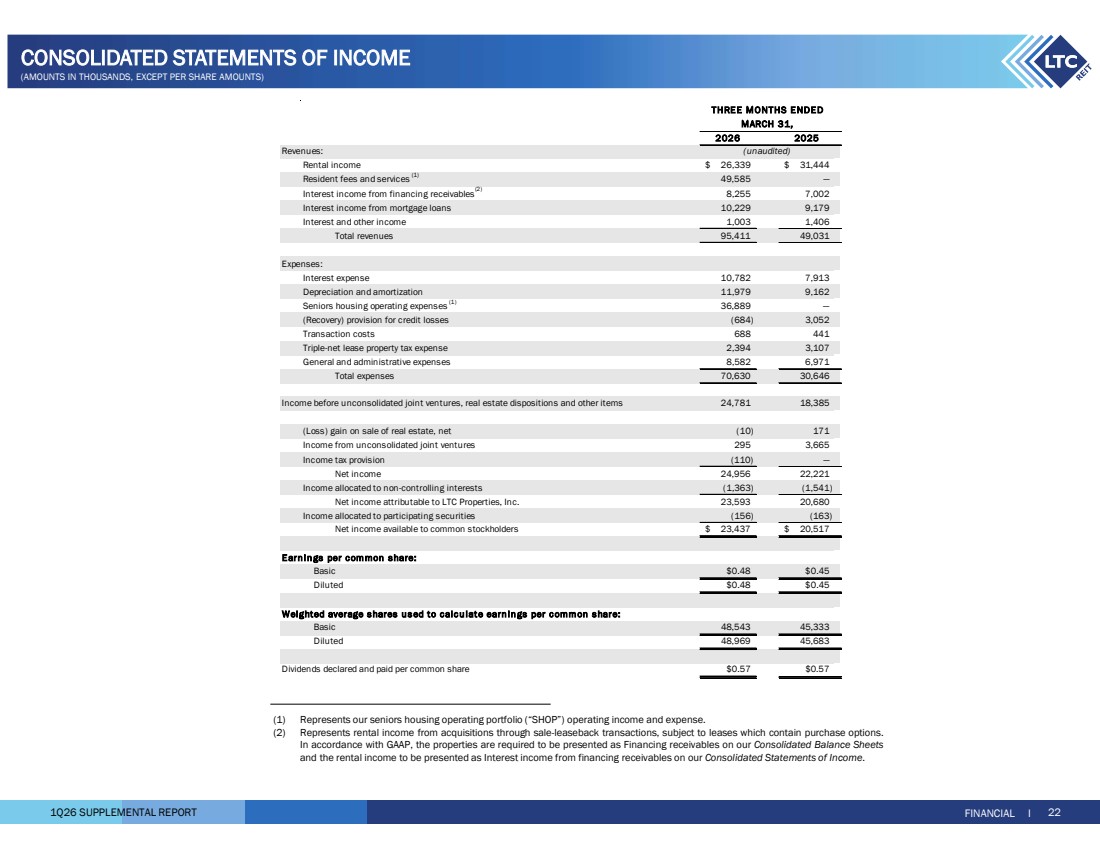
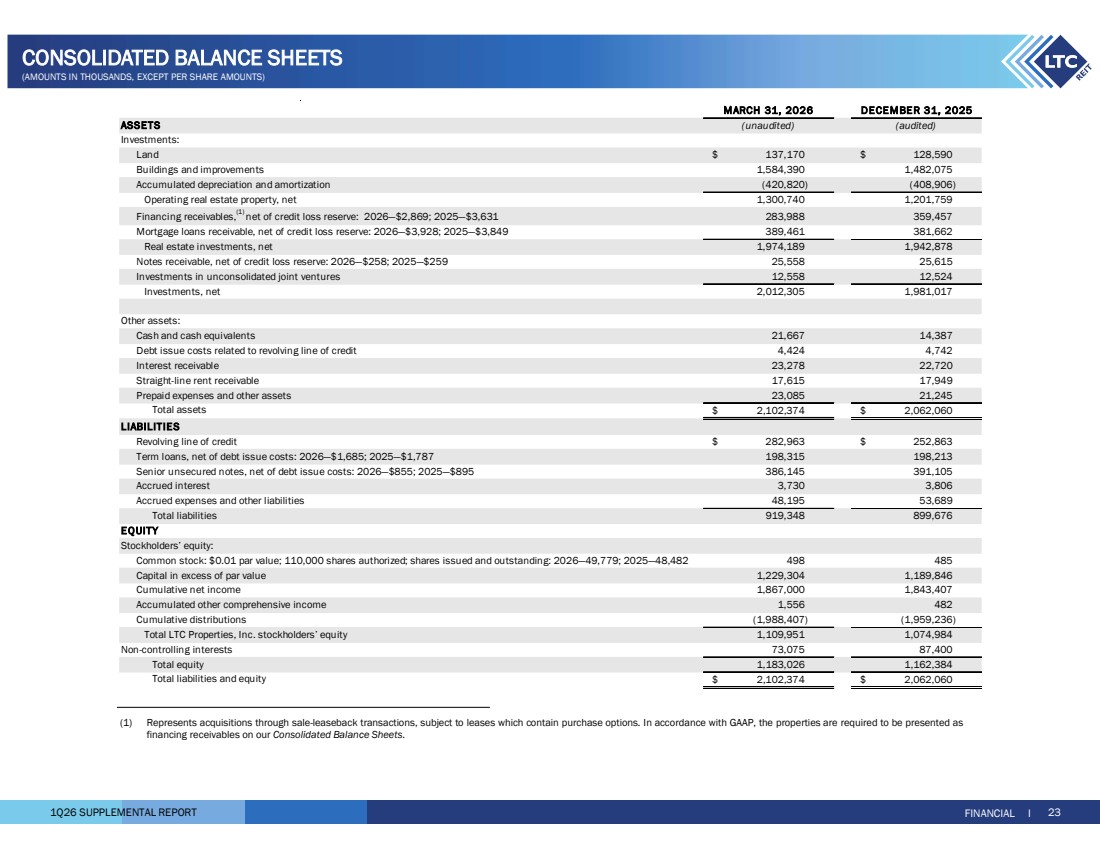
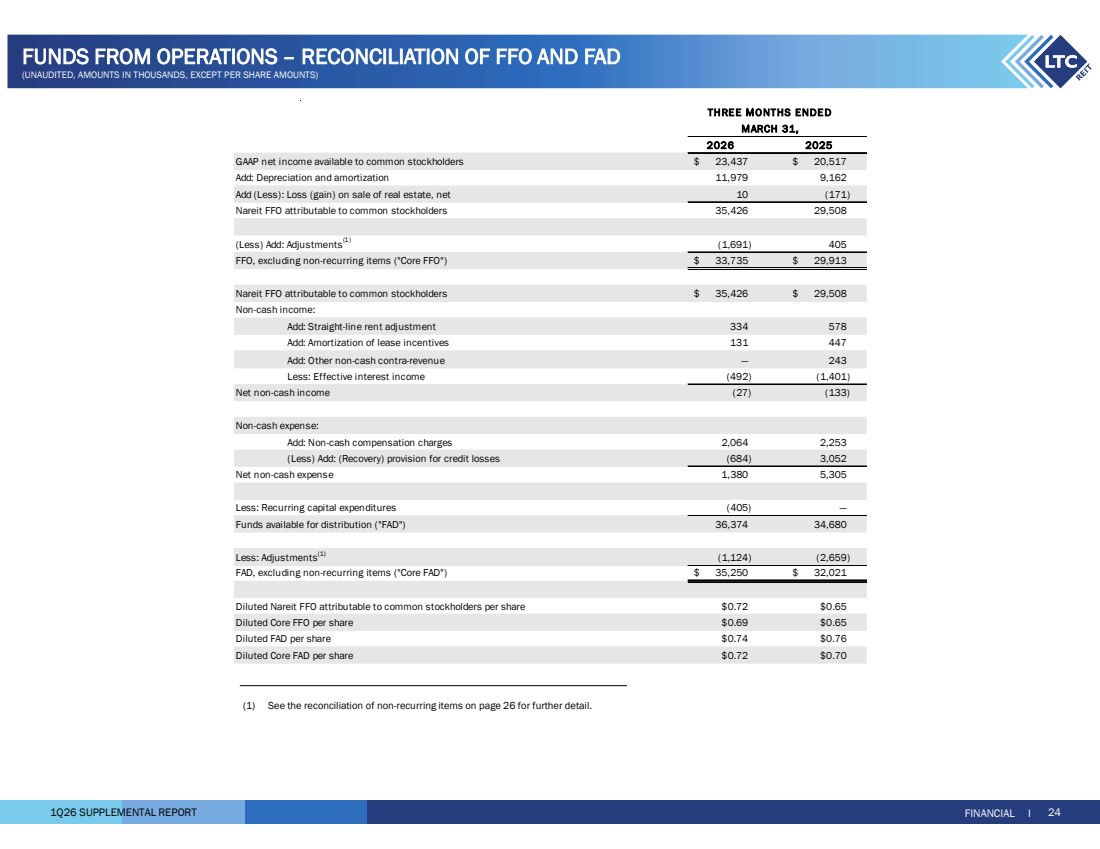
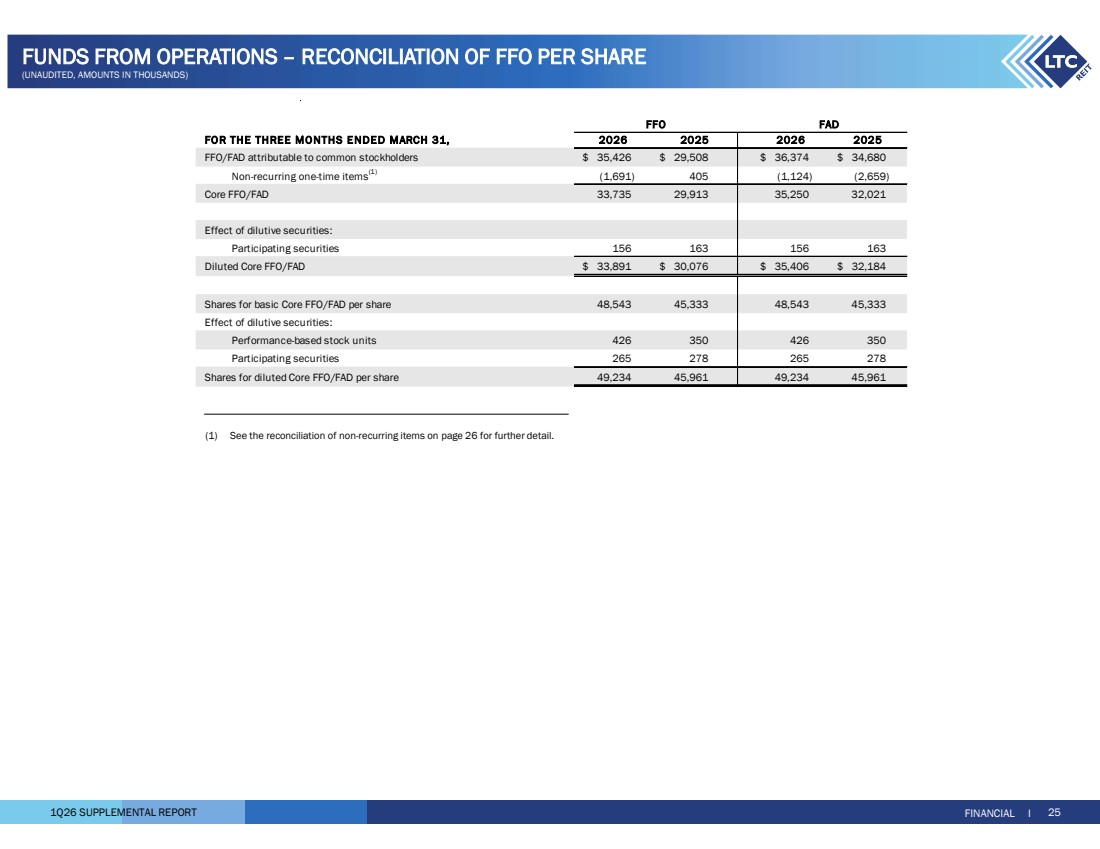
Thank you, Dave. Including year-to-date ATEM sales of $95 million, Our current liquidity is $585 million, and with $190 million proceeds expected from asset sale loans payoffs, we remain confident in our ability to finance future shop acquisitions. Our pro forma liquidity totals $775 million, providing a long investment runway. At the end of the first quarter, our pro forma debt to annualized adjusted EBITDA for real estate was 4.4 times, and our annualized adjusted fixed charge coverage ratio was 4.6 times. We remain well within our stated leverage target of four to five times, but believe that we can reduce stats further over time as a result of our organic shock growth. Compared with last year's first quarter, core FFO per share improved by $0.04 to $0.69 and core FAD per share improved by $0.02 to $0.72, representing 6% and 3% growth respectively. Increases were due to shop acquisitions and conversions to shop from triple net, increases in interest income from loan originations and additional loan funding, and higher rent from market-based rent resets. The increases were partially offset by an increase in interest and G&A expenses, primarily to support our growing shop portfolio, as well as a decrease in rent due to asset sales. We are reiterating our 2026 guidance, or core FFO per share, projected in the range of 275 to 279, and core FAD per share in the 282 to 286 range. As a reminder, our 2026 guidance includes $400 to $800 million of shop acquisitions, with shop NOI in the range of $65 to $77 million, and FAD capex of approximately $5 million. It also includes $265 million of proceeds from asset sales and loan payoffs. Other assumptions underpinning our guidance are detailed in yesterday's earnings press release and supplemental, which are posted on our website. Now I'll turn the call over to Pam for closing comments.
Thanks, Cece. LTC's transformation continues. What began last year through the combination of acquisitions and conversions of seniors housing communities ramps up this year with an additional $600 million of shop acquisitions projected at the midpoint of guidance, more than half of which will be completed by the end of the second quarter. We are deliberately curating a shop portfolio designed to compete effectively today and in the future when new supply eventually comes online, although new construction starts remain near historical lows nationally. We are accelerating LTC's organic growth profile and reducing our exposure to lower growth triple net lease investments, while expanding our roster of strong operators to support our mutual growth. In 2027 and beyond, our strategy will focus on tactical growth in shop, adding additional high-quality assets and driving outsized NOI growth. As a premier seniors housing capital partner, LTC is well positioned to drive substantial growth through SHOP. Our smaller size creates agility, allowing us to drive accretive change faster than our larger peers and move the needle through single asset and small portfolio acquisitions. Our SHOP focus over the past 18 months has enabled a successful transformation and created a clear execution advantage. From our cooperative conversions of 175 million triple net leased communities into SHOP a year ago, we will have grown our SHOP portfolio to nearly $1 billion by the end of the second quarter and significantly increased our ability to drive future earnings growth. The consistency of our execution and performance is driving results and reinforces the conviction in our SHOP strategy. Our goals remain clear. support our operators who care for our nation's seniors, and deliver superior long-term shareholder returns. With that, we're ready to take your questions.
Operator
Thank you. We will now be conducting a question-and-answer session. If you would like to ask a question, please press star 1 on your telephone keypad. A confirmation tone will indicate your line is in the question queue. You may press star 2 to remove yourself from the queue. For participants using speaker equipment, it may be necessary to pick up the handset before pressing the star keys. We'll pause for a moment to pull for questions. And our first question today, we'll hear from Austin Werschmidt with KeyBay Capital Market.
Hey, good morning, everybody. Could you provide some additional details around pro forma NOI growth for the 27 shop assets in the first quarter and then maybe give us a sense just how occupancy trended you know, sequentially and year over year within that NOI figure.
Hey, Austin. This is Gibson. I guess first to give you some context around the disclosure, so when we gave the Proforma 2025 for the 27 core shop portfolio, that was to help give an indication of the growth characteristics in that portfolio, you know, to the market, to our shareholders. But we've decided against giving that on a very detailed quarterly basis going forward. What we will do is roll that core shop performance forward, as you see in the supplemental, on a quarterly basis so you can track that with the metrics that we've realized during our ownership. For the color behind what's going on in Q1 in that core portfolio, it came in line with our expectations for EBITDA. Rates were a little higher. We did, you know, when we set guidance, we anticipated a little seasonal softness in Q1, which we realized. But, you know, directionally, occupancy turned around mid-quarter. If we look at it year over year, the occupancy troughed at a higher level, meaning the occupancy of the trough in Q1 of this year was higher than occupancy of the trough in Q1 last year. And we're seeing some green shoots in terms of occupancy increasing since it troughed out in February. So, you know, that, and then also we look in the sales pipeline at our leads and tour volume going into the summer, you know, the spring and summer selling season. We feel really confident, you know, given what we know right now and reiterating our guidance.
Helpful detail and appreciate the context. With respect to investments, there were $157 million, I think you said, last quarter that you had expected to close by the end of April. I'm just wondering what kind of drove the delay, and did the subset of that or all of those move within the $250 million, or were there changes in the investment pool? Just any details that you can provide on that, as well as expected pricing for those assets.
The delay was primarily related to a single off-market follow-on transaction. where the seller was focused on tax-efficient transaction. And so to accommodate that, we're working with them on structuring a down rate. And the seller needs some additional time to address some tax questions on their side. So really, in working on this off-market transaction, that aspect is what led to a little bit of delay. But we're very excited about this deal, about growing with this existing operator. And also, this deal will add two newer and two larger communities to our portfolio that have a continuum of care spanning I-L-A-L memory care. In the meantime, while that was slightly delayed, as Dave mentioned in his prepared marks, we've added another $200 million. We expect to close in Q2 and Q3. So Dave can talk about rates.
So cap rates going in yields have been right around that 7. We've been able to maintain that well. We're very pleased with that. So it ebbs and flows a little bit from deal to deal, but generally speaking, that's where we've been coming at, Austin.
And on Austin, also, I'd like to just add to maybe color about as we've increased the pipeline and we're seeing a lot of opportunities, you know, right now at the $460 million mark, which includes what we've closed to date and what Dave spoke about regarding investments by quarter, I mean, that will get us by 3Q at this point of 75% of our midpoint guidance at 600. So we feel very confident about where investments are right now. And what we have is we have eight transactions in total for 12 communities. And the average age of that 460, again, this goes back to what we already closed in Q1, is an average age of 10 years, which has been very consistent with what we've talked about. 65% of these deals in the pipeline are sourced off market. With the Q3 closings that Dave spoke on the LOI, that's going to add two more operators, four new operators this year, and get Q3 up to 13 operators. And we have two follow-on transactions. Sixty percent of the communities of this 460 span a continuum of IL-AL memory care. The average size of the community is 100 units, and 70 percent of these deals are in primary markets. So we feel very, very confident in our ability to source transactions. And as Pam mentioned in her comments about buying assets, they're going to be able to compete effectively against newer assets when eventually those do come online.
A lot of helpful detail, Clint. Just to clarify one thing before I yield the floor here, you said you added another $200 million. Is that specific to the operator that's focused on the tax-efficient transaction? because the 157 is now 250 closing, you know, in 2Q, and then there's 190 million of signed LOIs set to close in 3Q. So, you know, closer to 300 million. Can you just reconcile the adding 200 million versus what I'm getting to on the 300?
Austin, it's Pam. It was 90 million that's under LOI expected to close probably in the third quarter.
Operator
And our next question, we'll hear from Juan Sanabria with BMO Capital Markets.
Hi, good morning. Hope you can hear me okay. Just wanted to ask about the earnings guidance for the year. There's an implied D-cell from the first quarter run rate. So just curious on the drivers there. I'm not sure if there's any triple net softening in some of the rents versus the conversion in the shop with some, if there's any kind of noise or degradation in temporarily cash flows there, or if there's any one-timers flowing through the first quarter that maybe won't repeat?
Hey, Juan, it's Cece. It's first quarter, there was a little pickup just because of timing differences, but for the most part, no, we think we're going to be in line. There's going to be, you know, a ramp up for Shop NOI, as Gibson has talked about in the past, that, you know, we still think it's in line. And there are some uncertainties out there in the market with the interest rates. You know, we're not sure which direction it'll go with the new Fed chair, but we'll give you an update next quarter.
Great. And then second, you mentioned potential monetization of some skilled nursing assets. Just curious on the potential scope and where you see kind of market pricing for in-place rents.
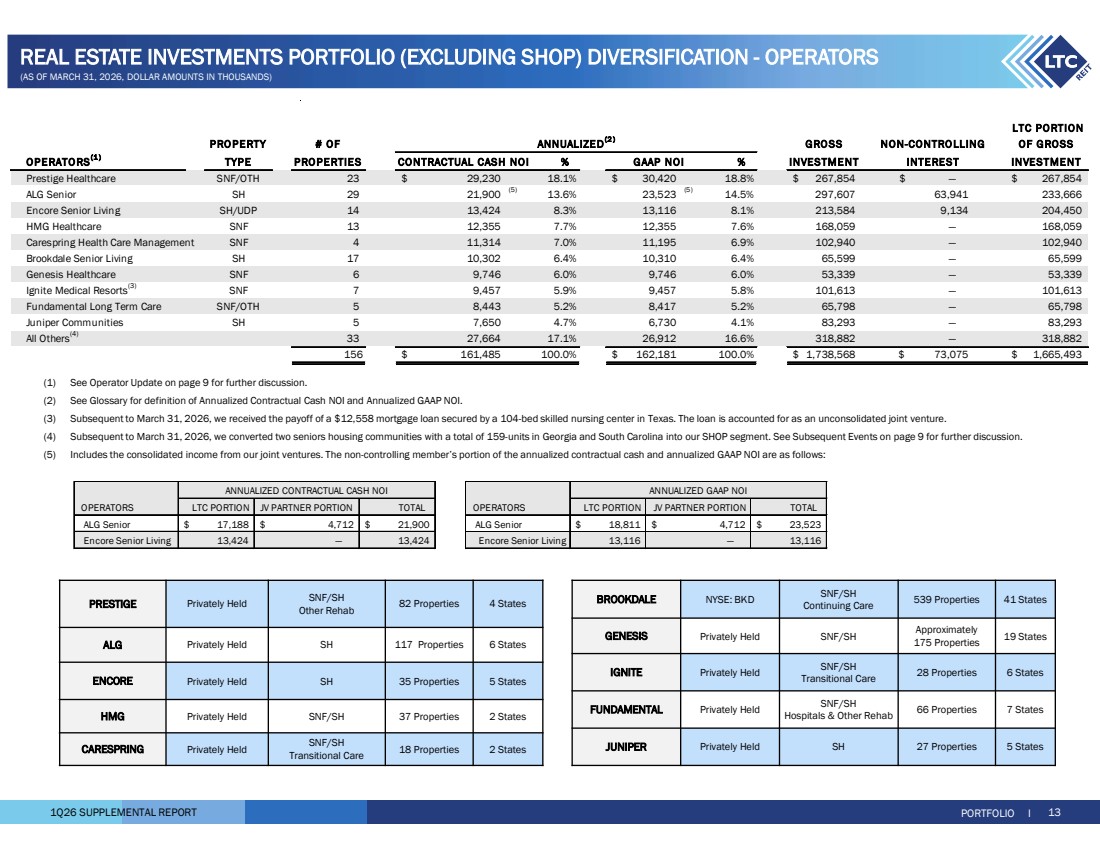
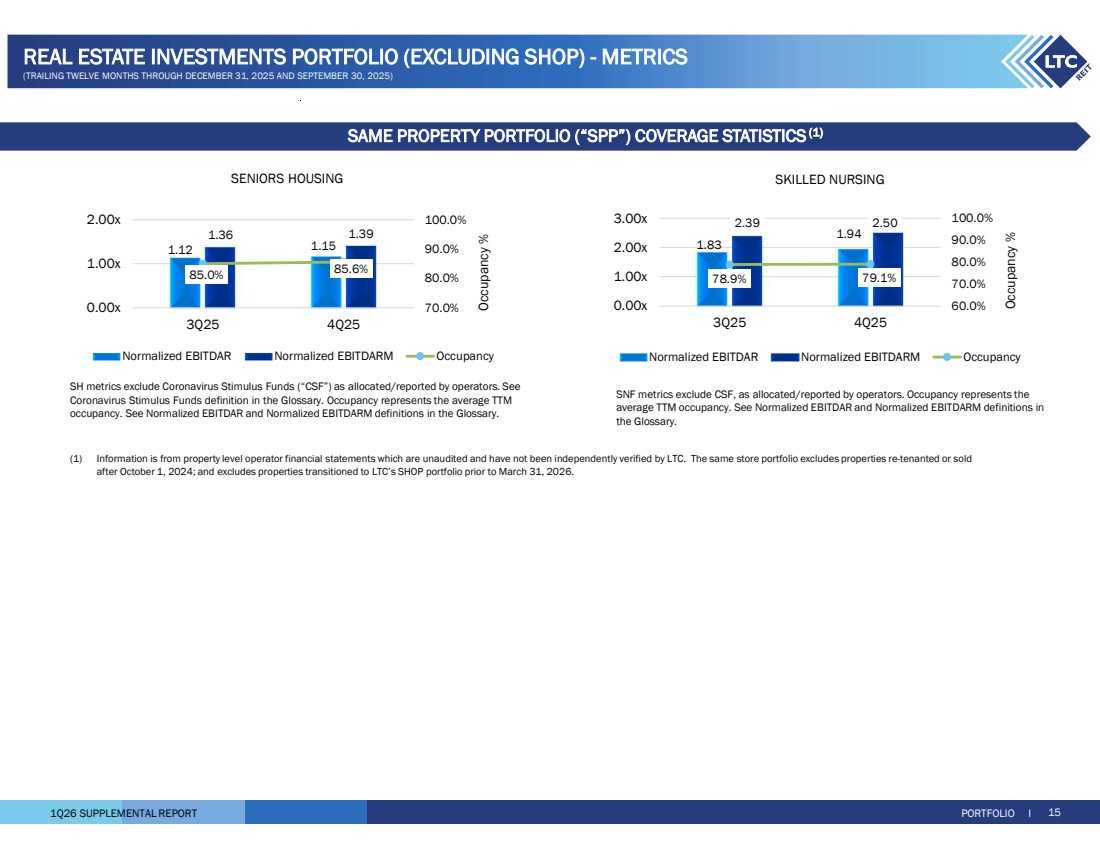
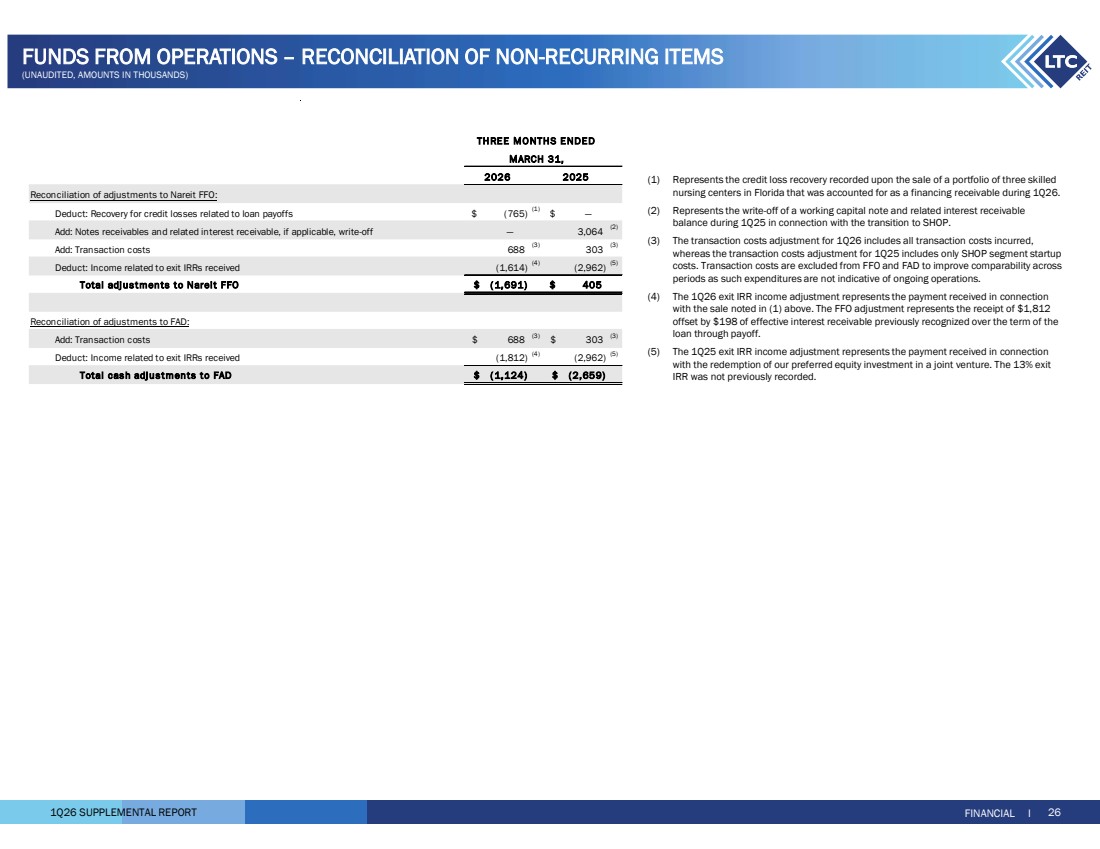
Yeah. This is Clint. I mean, you know, we're supportive of the skilled nursing industry, and, you know, we don't see any immediate near-term headwinds. I mean, what we have recycled to date, going back to the fall of 25, you know, those have really been for specific reasons. You know, it's been prestige, obviously, as Gibson mentioned on our last call. It's reducing concentration to an operator in state and reducing our loan book. Other sales were, you know, they were lease maturities and some purchase options. Those were unattractive. Eight caps, which we felt very good about. So, you know, going forward, it would really just be looking at capitalizing on these attractive pricing that we're seeing in the market. Anything we do going forward really would just be opportunistic to really look at, as Pam mentioned, you know, moving on beyond lower growth triple net leases into higher growth shop assets. And anything going forward, we really wouldn't be looking at limited, if anything, but no dilution effectively at all. So this is really all opportunistic going forward as far as what we look at in skill, because also our coverage on an EBITDA basis is almost, you know, two times, which is historically extremely strong. So we look at skilled nursing, we're very comfortable with our portfolio. We've been able to reduce that concentration within the portfolio. it would really just be opportunistic going forward.
Great. So said differently, just to summarize, given the high rent coverage, the yields could be closer to what you're – or close to what you're buying shop at around the sevens. Again, given the rent coverage yields. Okay. That's fantastic. Thank you. Thank you.
Operator
Next, I'll move on to Rich Anderson with Cantor Fitzgerald.
Thanks. Good morning. So I'm looking at slide 12 and the guidance you provided for shop. And, yeah, I appreciate you're in growth mode. So, like, you know, it's hard to get a real good sense of any sort of same store, you know, organic growth picture. Sure, but I am curious, like, if you were to sort of, you know, do a hypothetical stress test of your portfolio, would it be high single-digit NOI-type growth, you know, putting aside additional acquisitions? I mean, is that the type of growth that, you know, we should be expecting when the time comes that you're, you know, able to, you know, disclose a same-store, you know, perspective?
Yeah, so it's a good question, and I think you've asked similar questions on previous calls. So in my prepared remarks, you know, I gave just kind of the math of how the higher growth rate in SHOP moves the needle for our overall portfolio. And, you know, cited that if you assume kind of low to mid-teens SHOP and OI growth, that that, you know, that that was kind of the driver behind that math. I think, you know, what's changed from our prior calls is that now we have, you know, some experience with the portfolio. We're really confident in what we're assembling. We're really confident what the deal team's buying. And, you know, if you just think about the math embedded in that same store portfolio, we think you can get without the occupancy increases. So, you know, our guidance there, 150 bps of occupancy increase, 14% growth at the midpoint. If you strip that out, just to be really conservative, you can get double-digit, you know, 10% NOI growth with 150 to – or 170 to 200 basis point spread between REVPOR and XPOR. You know, we think that obviously kind of keys off REVPOR. You know, so that kind of 5% guidance, we feel pretty comfortable in that and see that the recent history has been able to sustain that. And then you just step back and you look at the overall supply-demand dynamics in the industry, baby boomers turning 80, the lack of new supply. You know, we feel more confident in that kind of higher growth profile going forward.
Good response. Thank you for that. So you mentioned platform investments that are being made that you expect to be largely completed and scalable by the end of this year. you know you've heard my gripe about all this right it's people are you and others are are growing shop through external sources but then you have to operate it right and you're you're married to it and i'm wondering how you've stress tested the history or excuse me the future of your shop portfolio it might be on the surface appearing like a layup to run these things with the demand and supply differential that we're seeing today but things can get complicated in this business and so i'm wondering how you know that when you talk about this platform investment you know what types of people are you bringing in what what are you doing to you know to um to stress test a not a autopilot type of environment but like things start to go wrong and how to manage through those things you know kind of new to the space so if you can comment on that that would be great Hi, Rich.
It's Pam. Well, I don't think anybody thinks it's Halea. We fully understand and appreciate the intensity with which you build a shop portfolio and operations. But as we've talked about on this call and for the past year, I mean, we really seek out the best managers that are the best in their markets, very strong and been doing it, have a strong track record, and then we supplement that with the database and the analytics that Gibson has talked about to help arrive at better decision making. Our value add to the operators is helping them with aggregating data, right? That's an expensive task, and that's what we've undertaken. We've hired people to help with the data analytics. We've hired strong asset managers. with historical track records, managing shop portfolios. So it's not something that we've undertaken lightly. And we've said before, if you're going to do shop, you have to go all in. We've completely fundamentally changed the way this company thinks, operates, the way we acquire properties. And, you know, we are not managers. We're not viewing ourselves as managers. We are hiring the best managers, but we're helping those managers create the best outcome for our portfolio.
And one thing also, Rich, we've done on top of that is just the portfolio we're acquiring. We've been very, as Dave said, his prepared remarks, very strategic on what we're buying, right, newer assets. We've retained the managers on the majority of all but one actually to date that we've closed. And we've done this by design to, you know, curate this stabilized portfolio, which we think occupancy stabilized, but the ability to drive a continued improvement that Gibson spoke about. So we're building this, larger assets and newer, that have the ability to compete. So we think we're putting this together and the combination of the people to be successful. As Pam mentioned, we understand we've been in the business a long time. This takes a lot of work.
And Rich Hayes, Gibson, I'll just add to that. You know, the structure is relatively new to us, to LTC, in terms of our implementation. But we've been hard at work at this over the last 18, 20 months and been very deliberate about forming a plan, working through, you know, the issues with the initial conversions and executing on that plan. But, you know, zooming out, again, relatively new structure for LTC. But, you know, we've had exposure to private-based seniors housing. We've all been in the business for a long time. And we're acutely aware of the challenges that operators face. It's a tough business, but we feel like we've aligned with, you know, with good operators. We've hired experienced people on the team, and we just want to be there to support them.
Yeah, I'm not meaning to trivialize the talent there. That's not my point, but I'm just, you know, stress testing you, I guess, in the process. So I appreciate all that color from all of you. And my last question is, when you think about structurally how you're compensating your managers, you know, what's the mindset there? Is it a, you know, a percentage of revenues? Is it a, you know, a skin in the game, NOI percentage? Like, I'm curious how you're doing that. And is there a sort of a specific model you're following, or is it a case-by-case basis with your separate managers?
I mean, it's a general, you know, model that we're following. We're looking at, you know, base fees to be, you know, calculated based on, you know, revenues as well as bottom line. We think that helps align interest in the, you know, in the current 12-month period. We're looking at incentive fees that we set budgets together, and if budgets can be, if they can exceed the budgets, we're looking to reward our operating partners for that. But we're also looking at aligning interest long-term and creating synthetic promotes over time, that when you have operators to make decisions today between growing occupancy or rate, it's got to be in the mindset of how it can benefit the community long-term to be able to achieve a financial award through a synthetic promote structure a couple years down the road. So we think when you look at the, you know, the current 12 months, the ability to beat the budget for the 12 months, and a long-term horizon on overall performance, we think that's a good alignment of interest for both parties.
Yep. Great. Thanks, Clint. Thanks, everyone.
Operator
And next we'll move to Michael Carroll with RBC.
Yep, thanks. Chris, looking at your shop operator list that you guys have, it does look like you have a number of operators kind of within your portfolio. Are there a handful that you kind of have closer relationships with that you kind of want to continue to expand? And I guess some of these that have maybe one or two assets, I mean, is the plan for that to grow? I mean, how hard is it to have one operator in your portfolio just managing one different I mean, does it make sense to have fewer operators managing bigger portfolios?
I would say, this is Clint, I mean, you know, obviously we've just started this investment platform, you know, mid-year last year through the initial conversions. I mean, we would look to grow with all of the operators that we have built relationships with, and we will be adding three more relationships following this. So we think this is a testament to the effort that we put in back in the fall of 24 when we first announced we were going to go this direction. You know, we took attention and time to go out and market what we were doing and let operators know. And this is a result of that intentional effort that we took on. So, yes, we would look to grow with each one of these operators.
And is it harder for you guys if there's more operators within the shop portfolio? So, I mean, is there a kind of like a limit? I mean, I'm assuming you're fine with what you have now since you're adding three more. But is it like 15 you're good with, but 20 or nine is kind of a limit that you want to make sure that you have to make sure that you're able to track each one of these relationships?
Well, we don't – we have not set any limit. And it really comes down to the investment opportunities. As Clint mentioned in his prepared remarks and follow-up Q&A, the majority of our investment opportunities are coming from our operators off-market. So to the extent that this is a source of deal flow for us, we would not limit that. We're obviously, as I said in a prior remark, that we're targeting the best operators in the geographical regions in which we have properties and where we're looking to grow. So, no, we wouldn't limit it. Obviously, you do get to a point where you've got the, you know, law of diminishing returns. So, I wouldn't ever say we'd have something like 50 operators. But where we are right now and adding operators, you know, in the, you know, next year or two, I think we're fine. That's very manageable by our asset management team.
Okay, great. And then circling back to – so, go ahead, Gibson.
Yeah, I was just going to say, we've built in our staffing plan, you know, additional resources. So, you know, the core platform Rich was just asking about, you know, we feel like all the major pieces will, you know, will be fully in place to allow us to scale. But we obviously have a staffing plan that's aligned with our growth strategy.
Okay, great. And then switching gears back to the SNF sales, have you started this process of marketing some of these portfolios? What was it really kind of indicating on the call as something that you would consider if something came up?
We're not actually active marketing at this point, but, I mean, we have received a lot of inbound phone calls about opportunities. So it's things that we're engaging with. But, again, it's got to be opportunistic pricing that works for us to recycle into higher growth shop assets.
And then, Clint, is there, like, specific sizes that we should think about of these potential sales? I mean, could it be like $100-plus million, or is it too early?
I think it could be situational, depending on what comes up. So, it could be larger or smaller.
Operator
And our next question, we'll hear from Tayo Akasanya with Deutsche Bank.
Yes. Good morning, everyone. I also wanted to focus on slide 12, the shop performance. And just curious, again, when you kind of take a look at the quarterly results you kind of have disclosed on the page, the REV4, so in 2Q25, when we just kind of had the shop conversion portfolio, the REV4 was almost like $10,000 or so. and then kind of in 3Q, it was like $9,500. It's gradually dropped to about $7,850 by 1Q26 with all the additional acquisitions that have happened. Can you just talk a little bit about, again, the post-conversion acquisitions, kind of post-original 13, just generally characteristics of that portfolio than maybe driving down the rev core from the original 13 conversion? Just want to kind of understand that a little bit and kind of if it's just targeted at different market segments or just how do we kind of think about what's being bought relative to the initial 13?
Thanks, Tayo. Yeah, I think if you go, it's a very simple explanation. You go back to that original 13 properties in 2Q, 12 of those were memory care, right? So memory care has a much higher rev core. And so, as you see us adding more, you know, traditional senior housing properties into our shop portfolio, you know, a mix of IL, AL, and memory care, you see that gradually go down. So, that's the – there's nothing to read into that other than the mix of the portfolio is changing as we diversify away from standalone memory care.
Gotcha. All right. Thank you.
Operator
If there are no further questions at this time, I would like to turn the floor back to Clint Malum for any closing remarks.
Thank you. And thanks to everyone on today's call. For your ongoing support, we look forward to updating you on our progress next quarter, as well as seeing some of you at upcoming investor conferences. Thank you. Thank you. This does conclude today's teleconference.
Operator
We thank you for your participation. You may disconnect your lines at this time.