Operator
Ladies and gentlemen, thank you for standing by. Welcome to the MetLife 4th Quarter and Full Year 2025 Earnings and Outlook Conference Call. At this time, all participants are in a listen-only mode. Later, we will conduct a question and answer session. Instructions will be given at that time. As a reminder, this conference is being recorded. Before we get started, I refer you to the cautionary note about forward-looking statements in yesterday's earnings release and to risk factors discussed at MetLife's SEC filings. With that, I will turn the call over to John Hall, Global Head of Investor Relations. Please go ahead.
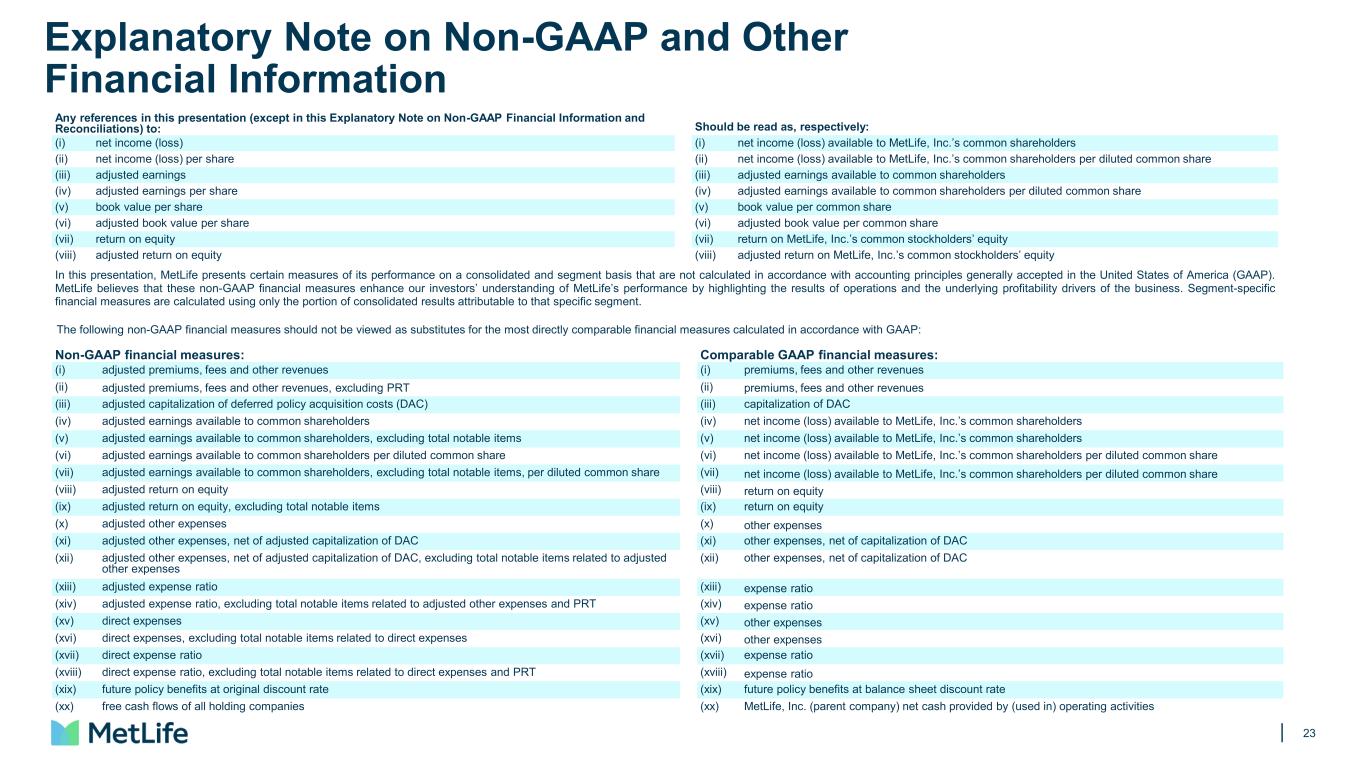
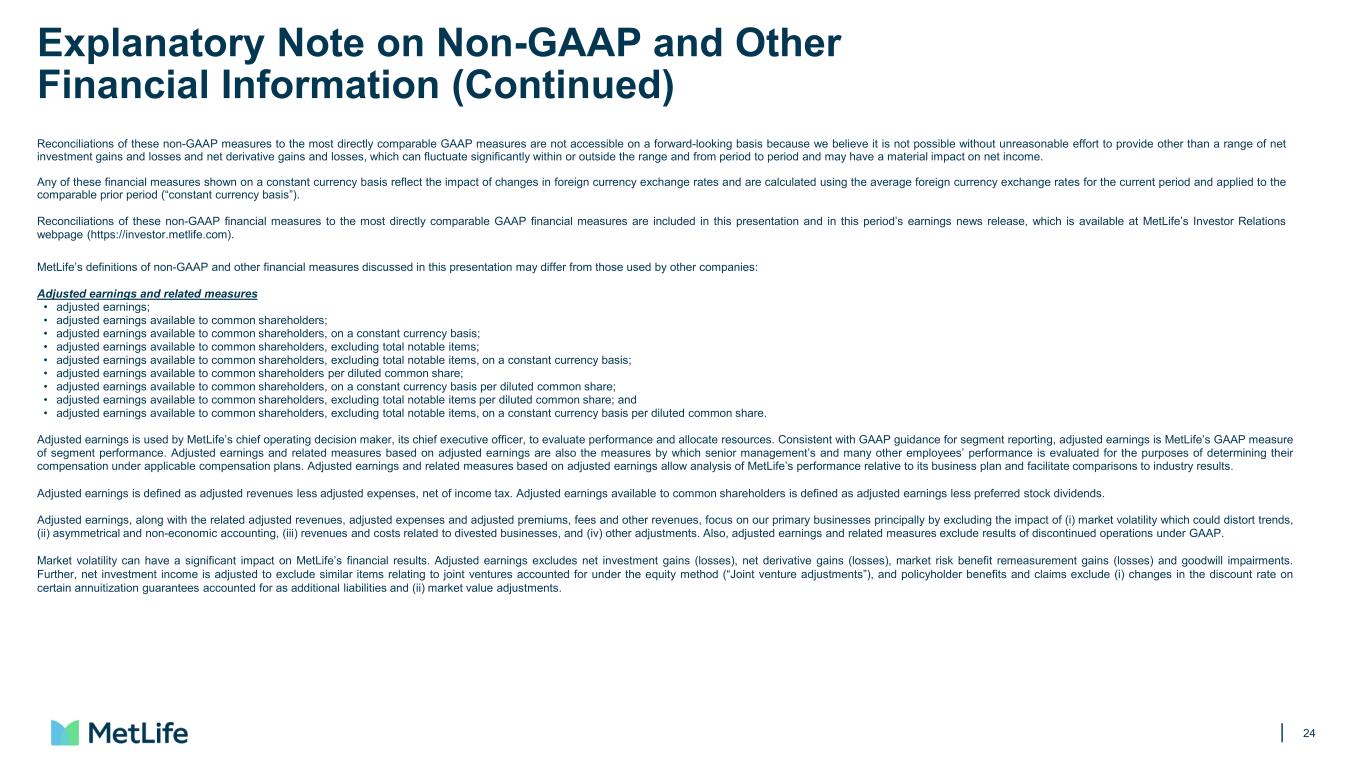
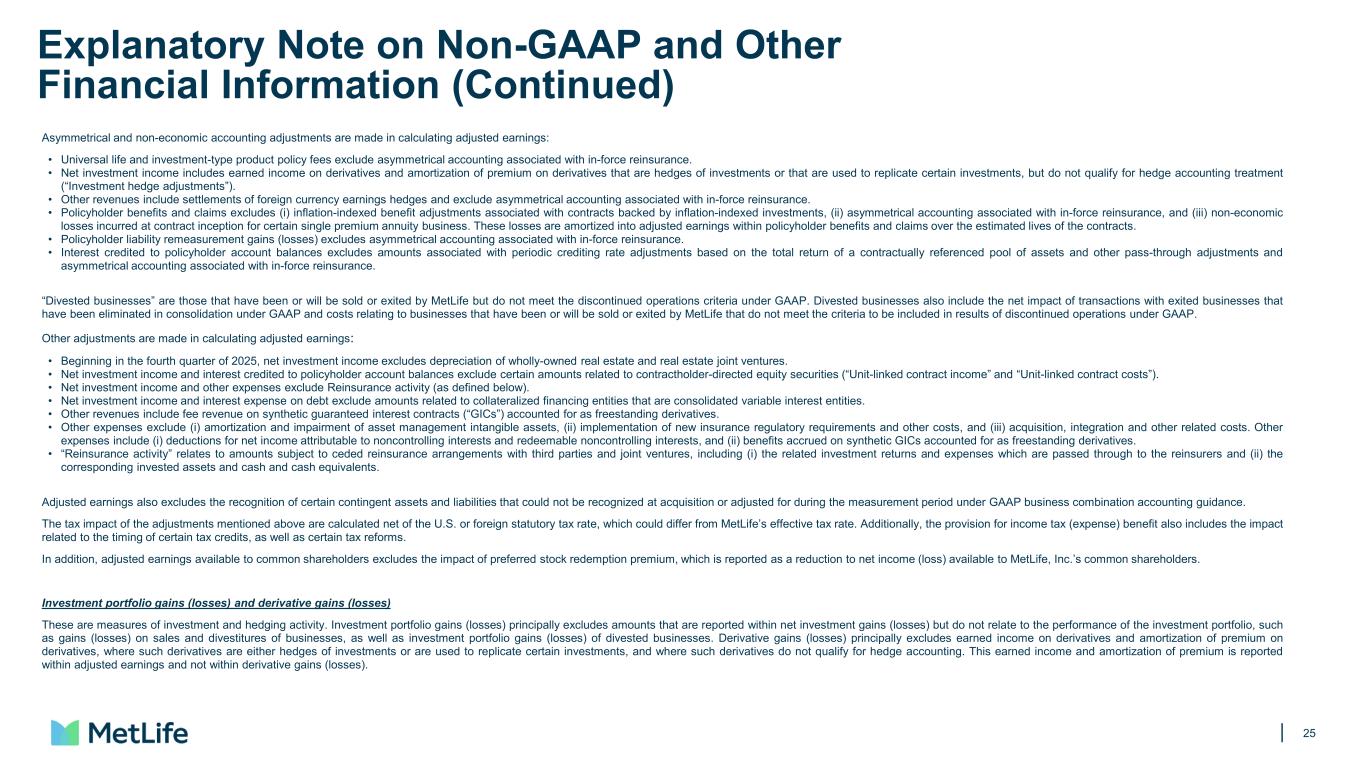
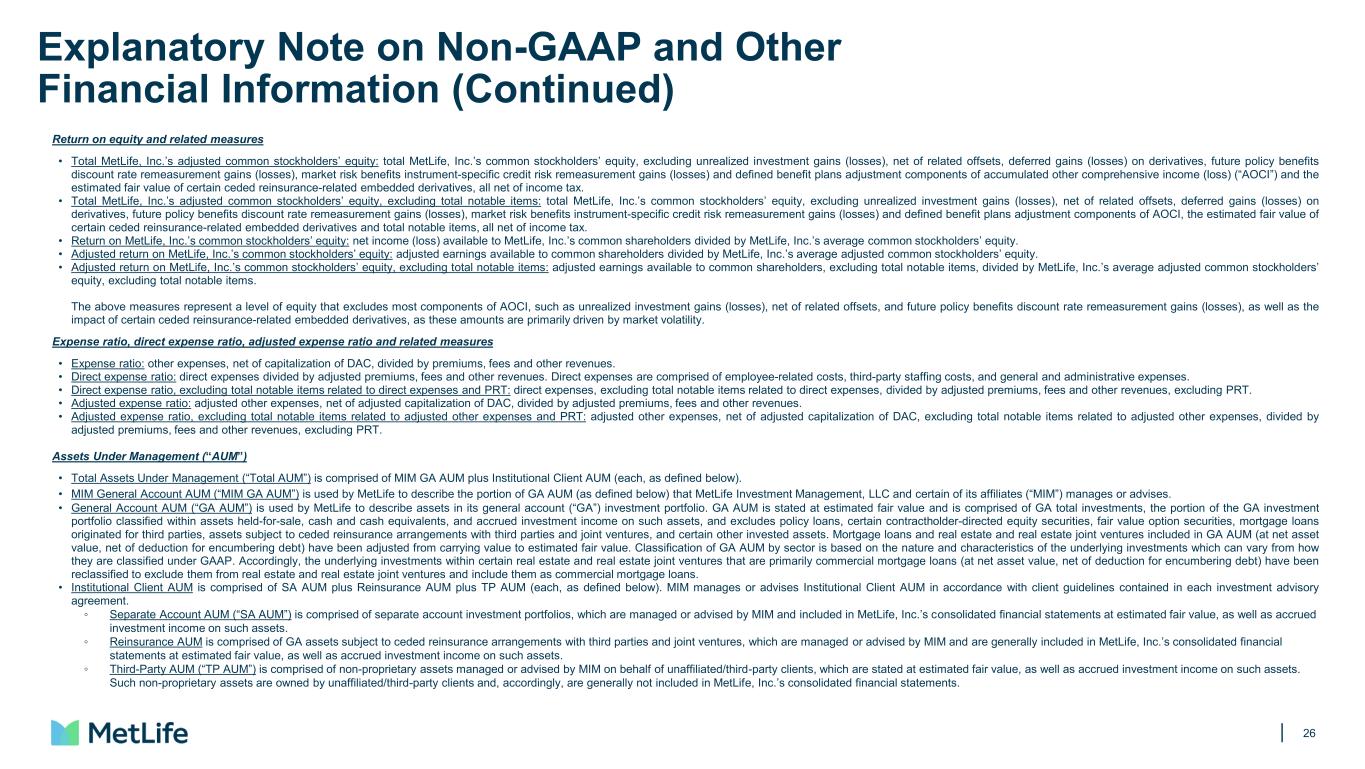
Thank you, Operator, and good morning, everyone. We appreciate you joining us for MetLife's fourth quarter 2025 earnings and near-term outlook call. Before we begin, I point you to the information on non-GAAP measures on the Investor Relations portion of MetLife.com in our earnings release and in our quarterly financial supplements, which you should review. On the call this morning are Michelle Halath, President and Chief Executive Officer, and John McCallion, Chief Financial Officer and Head of MetLife Investment Management. Also available to participate in the discussion are other members of senior management. Last night, we released an earnings call presentation, which addresses the quarter as well as our near-term outlook it is available on our website John McCallion will speak to this presentation in his prepared remarks an appendix to the deck features outlook sensitivities disclosures gap reconciliations and other information which you should also review after prepared remarks we will have a Q&A session which will end promptly at the top of the hour as a reminder please limit yourself to one question and one follow-up with that over to michelle thank you john and
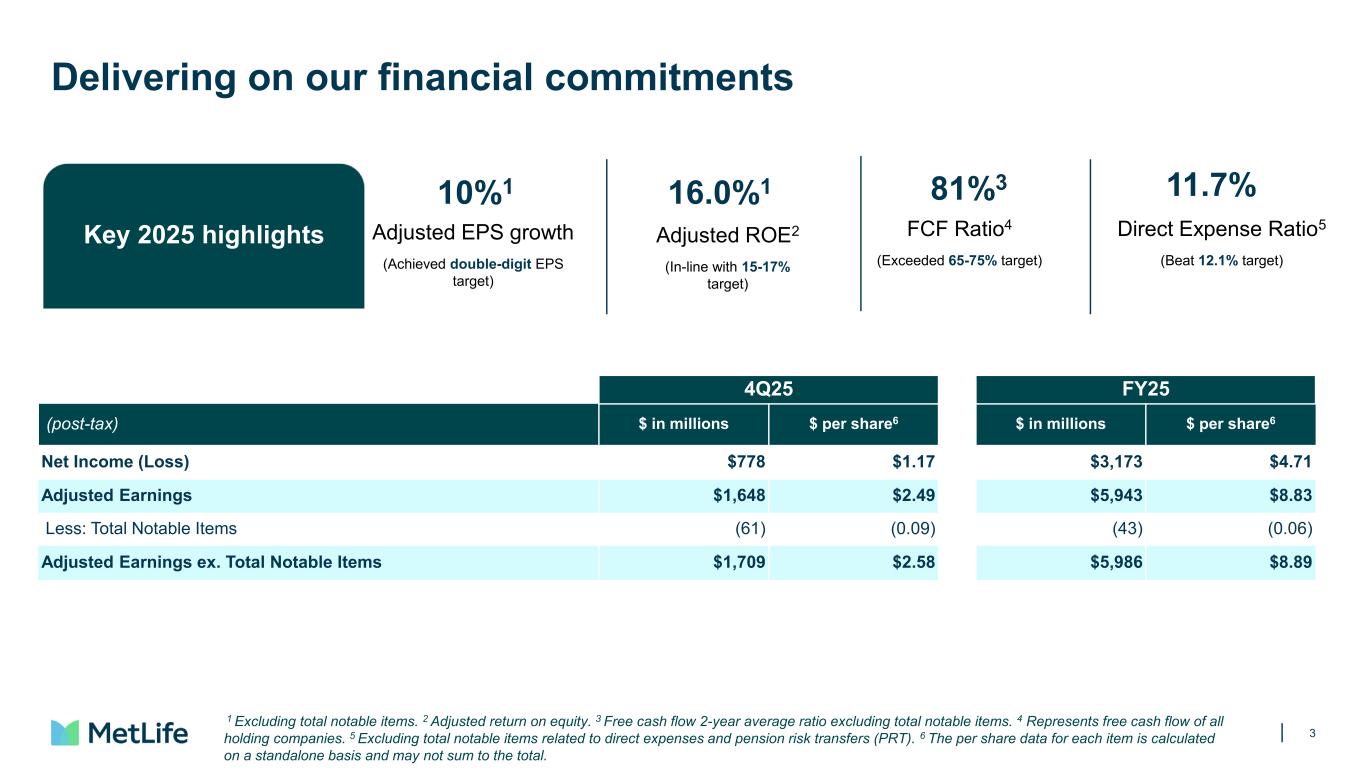
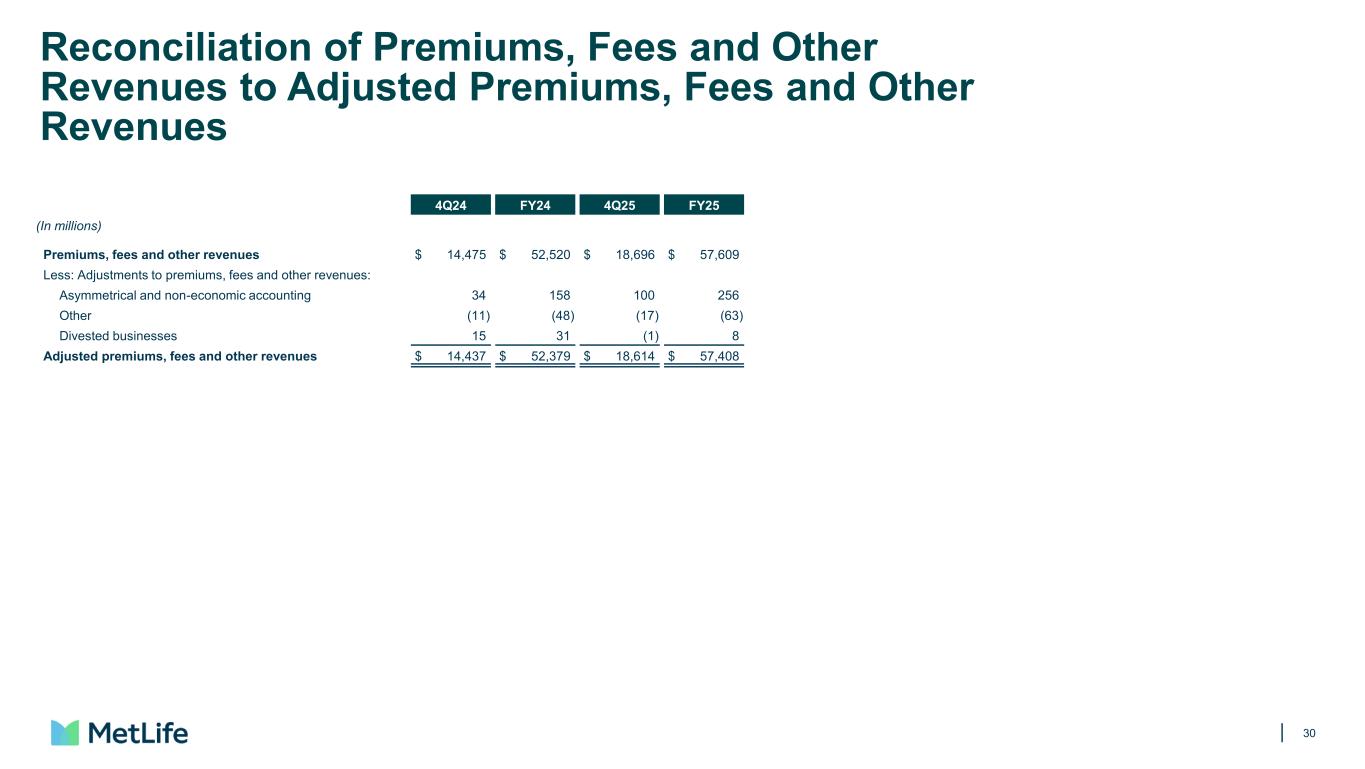
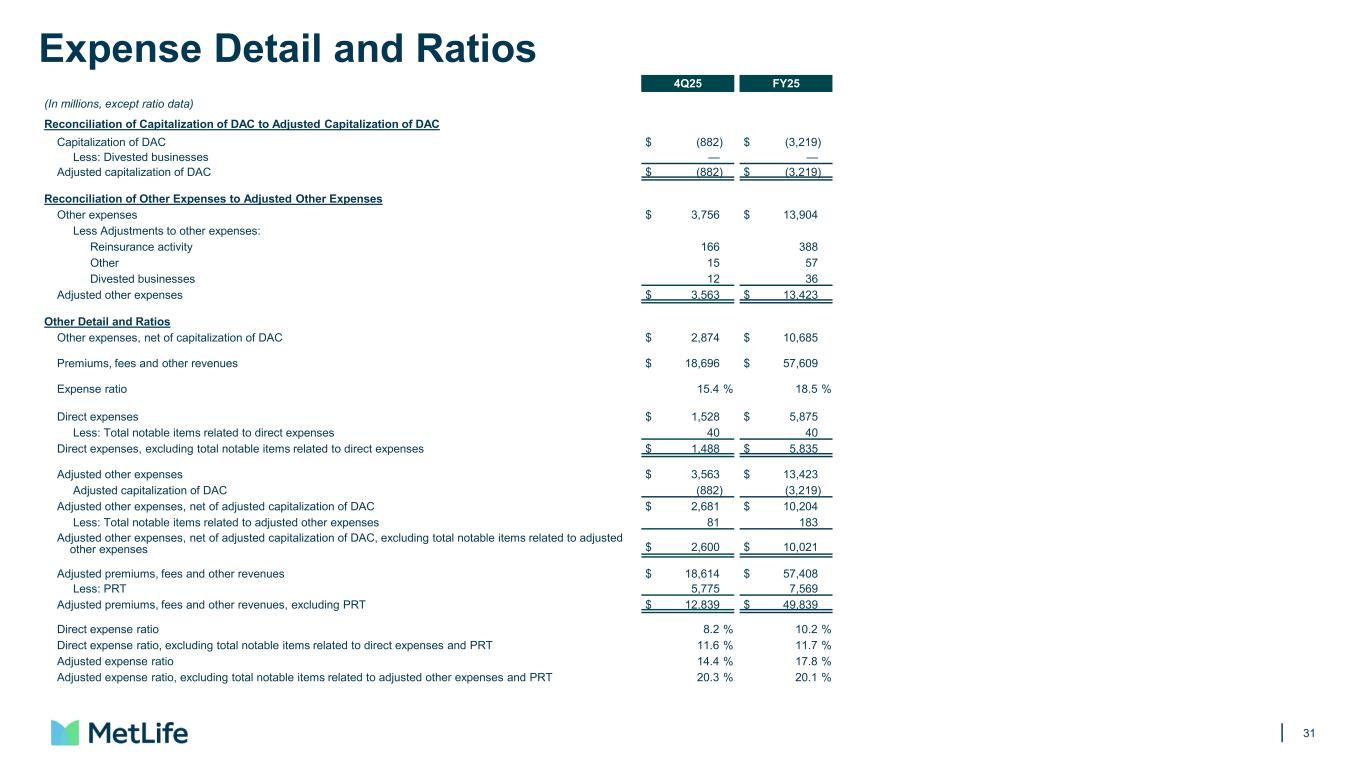
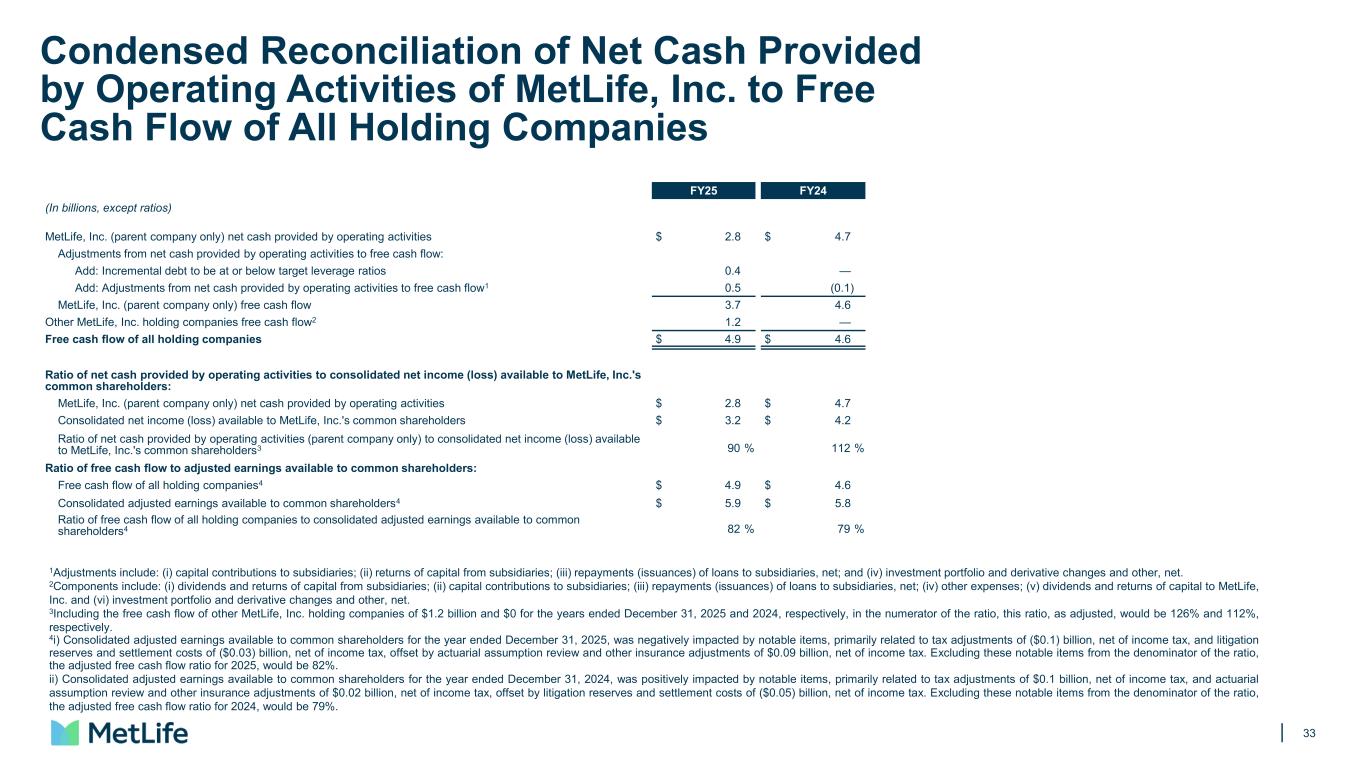
good morning everyone when we launched new frontier a year ago we introduced four strategic priorities with a greater emphasis on growth over the past 12 months we have advanced these strategic priorities growing our business responsibly deploying capital soundly and operating with speed and discipline, all while navigating a dynamic market and economic environment. Reinforcing our market leadership, our best-in-class group benefits business added approximately $600 million of new adjusted premiums, fees, and other revenues in 2025, with higher margin voluntary PFOs rising 10% year-over-year. Scale, technology, and discipline continue to drive this attractive business forward. We capitalized on our unique retirement platform by seeding a sidecar, Chariot Re, tapping the U.S. retail retirement space via Florey Insurance, and originating more than $14 billion of pension risk transfer sales, MetLife's highest ever annual PRT total. To accelerate growth in asset management, we closed on the acquisition of Pinebridge Investments and established a new business segment, MetLife Investment Management. At year-end, MIM had $742 billion of assets under management, up from roughly $600 billion a year ago. And our high-growth international markets demonstrated their strategic importance with impressive growth rates. In 2025, Asia saw constant currency sales jumped 18%, aided by a strong contribution from Japan, while Latin America saw constant currency sales rise by 12%, with Mexico leading the charge. Our business growth has been fueled by sound capital deployment and capital management, and 2025 was a seminal year for MetLife on this front. We expect to have deployed close to $4 billion to support organic new business in 2025, driven in part by the PRT origination and the Asia and Latam sales production that I just mentioned. We returned roughly $2.9 billion to shareholders via common stock read purchase and another $1.5 billion through common stock dividends, bringing the total to approximately $4.4 billion. We did this while funding about $1.2 billion of acquisitions and business investments, including Pinebridge and Masero, making two investments in Chariot Re, as well as boosting our investment in PNB MetLife, our India joint venture. And we executed several strategic re-insurance transactions. Among these were two separate deals with Charity Totaling about $11 billion of liabilities and a risk transfer agreement with Talcott Totaling $10 billion of liabilities. When we introduced our new frontier strategic priorities last year, we also established a fresh set of five-year financial commitments that underscore MetLife's superior value proposition. These commitments not only serve to challenge us, but more importantly, to hold us accountable. We committed to achieving double-digit adjusted EPS growth over the time frame, recognizing this will not always be a linear path. And in 2025, we delivered roughly 10% adjusted EPS growth excluding notable items. We committed to achieving a 15 to 17% adjusted return on equity. For the full year, X notable items, we delivered 16%. We committed to shaving 100 basis points over five years to achieve a direct expense ratio of 11.3%. In 2025 alone, aided by AI and other emerging technologies, we lowered our direct expense ratio to 11.7%, putting us well ahead of schedule. And where it all comes together, free cash flow, we committed to generate $25 billion over the course of five years. In 2025, we made a $4.9 billion down payment toward that cumulative target. Throughout Next Horizon, and now through New Frontier, the prevailing constant has been changed. The all-weather nature of our market-leading businesses position MetLife to adapt and succeed in a variety of economic environments. One year into New Frontier, it is clear we have the right strategy at the right time, focused on the right growth opportunities, and measuring ourselves against the right metrics. Turning to fourth quarter results, we reported strong quarterly adjusted earnings of $1.6 billion, or $2.49 per share. Excluding notable items, we reported $2.58 per share, up 24% compared to $2.08 per share a year ago. On an actionable basis, this represents MetLife's highest single EPS quarter. Contributing to the outperformance in the quarter was robust underlying business momentum across most segments, aided by another consecutive quarter of improved variable investment income, which totaled $497 million. Our private equity portfolio returned 2.8% in the quarter, and we also saw a modest rebound in returns on our real estate and other funds as well. Adjusted premiums, fees, and other revenues, or PFOs, rose 8% to $12.8 billion and rose 29% to $18.6 billion when retained pension risk transfer deals are included. For the full year 2025, we reported adjusted earnings excluding notable items of $6 billion or $8.89 per share, up roughly 10%. Higher variable investment income, volume growth, and capital management drove the growth in earnings per share. As we do each fourth quarter, we included our outlook for certain near-term targets and other elements of guidance in our earnings call presentation. This year, in view of our resegmentation, we have taken a more prescriptive approach. In a moment, John will delve into our near-term outlook in greater detail. But on a high level, it should be evident we are on track to achieve our five-year commitments for adjusted EPS, adjusted ROE, direct expense ratio, and free cash flow, among others established under new frontier. Turning to MetLife's businesses, Group Benefits adjusted earnings, excluding notable items, totaled $465 million in the fourth quarter, contributing to full-year adjusted earnings ex-notables of $1.7 billion. Life mortality continues to trend favorably, which we expect to persist in 2026. Repricing has returned dental to target profitability, while disability experience trailed our expectations in the quarter. This year anticipates 7% to 9% growth in adjusted earnings year-over-year, driven by PFO growth and supported by underwriting. In retirement and income solutions, adjusted earnings excluding notable items were $454 million for the quarter, up 18%, bringing full-year adjusted earnings ex-notables to $1.7 billion. For the year, RIS benefited from record origination in both PRT and UK longevity reinsurance. For Asia, adjusted earnings ex-notables totaled $444 million for the quarter and $1.6 billion for the year. Strong annual sales growth from new products, in particular foreign currency denominated products in Japan and Korea, pushed general account assets under management to advance 7% on a constant currency basis in 2025. Looking to Latin America, adjusted earnings excluding notable items came to $227 million, dollars, up 13 percent in the quarter. Business momentum in the region has been outstanding over the past several years, supplemented by the expansion of digital platforms such as Accelerator and growing strategic partnerships. Given the segment's strength in the quarter, it is not hard to see a pathway to one billion dollars in annual adjusted earnings over the near term. With EMEA, the segment continues to punch above its weight class relative to last year's outlook. The segment reported adjusted earnings ex-notables of $97 million in the quarter, which is close to the run rate implied by our 2026 outlook. And to close out business highlights, in the fourth quarter, we transitioned to new segmentation with the introduction of MetLife Investment Management as a business segment. This aligns with our new frontier strategic priorities, reflects the critical mass we've gained with the acquisition of Pinebridge, and underscores our intent to grow and further capitalize on the increasing conversions of life insurance and asset management. Moving to cash and capital, the fourth quarter serves as an excellent reminder of MetLife's capital strength and flexibility. After retiring half a billion dollars of debt, buying back around $430 million of common stock, paying roughly $370 million of common stock dividends, and funding close to $1 billion of acquisitions and other investments, We ended the year with $3.6 billion of cash and cash equivalents. This falls firmly within our target liquidity buffer of $3 to $4 billion. A final note on capital. In the month of January, we repurchased another $200 million of our common stock. We expect 2026 repurchases to be in line with 2025. To wrap up, the strategic actions we took in 2025 set the table for the coming years of New Frontier and position MetLife to deliver on our financial commitments and our superior value proposition of responsible growth and attractive returns with less risk. We are entering 2026 as a stronger company with sustained business momentum and expanding market leadership. While the macro and market environments continue to evolve, we remain laser-focused on the levers we control and on relentless execution to generate responsible growth, deploy capital with rigor and further drive operating efficiency. MetLife's financial strength feeds our ability to deliver for our shareholders as well as other stakeholders, including our customers, employees, and communities. In 2025, MetLife paid roughly $50 billion in policyholder benefits and claims and invested more than $90 billion to support our liabilities. The sheer scale of these numbers highlights the dedication of our people to MetLife's purpose, always with you building a more confident future. I am energized by our team's commitment and look forward to the future as there is still much for us to achieve. Now I'll turn it over to John to cover our performance and outlook in greater detail.
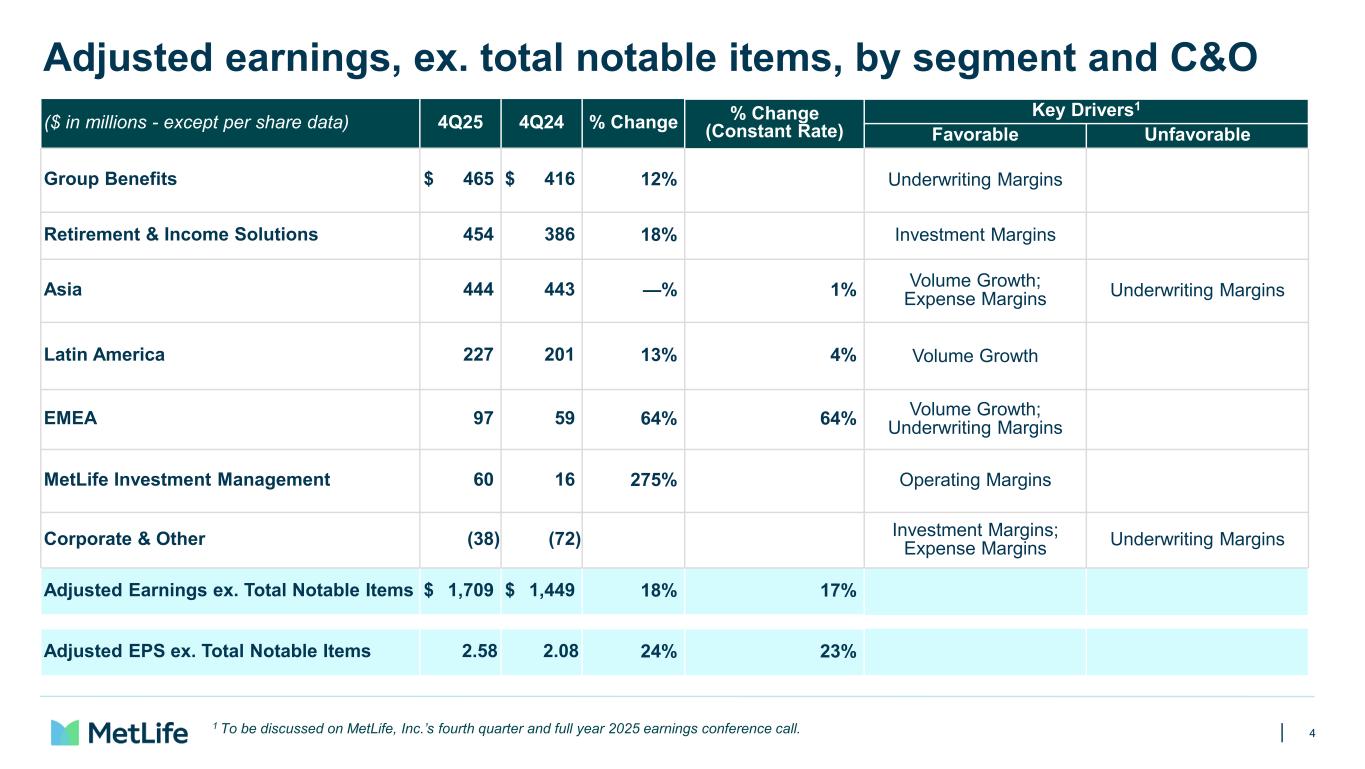
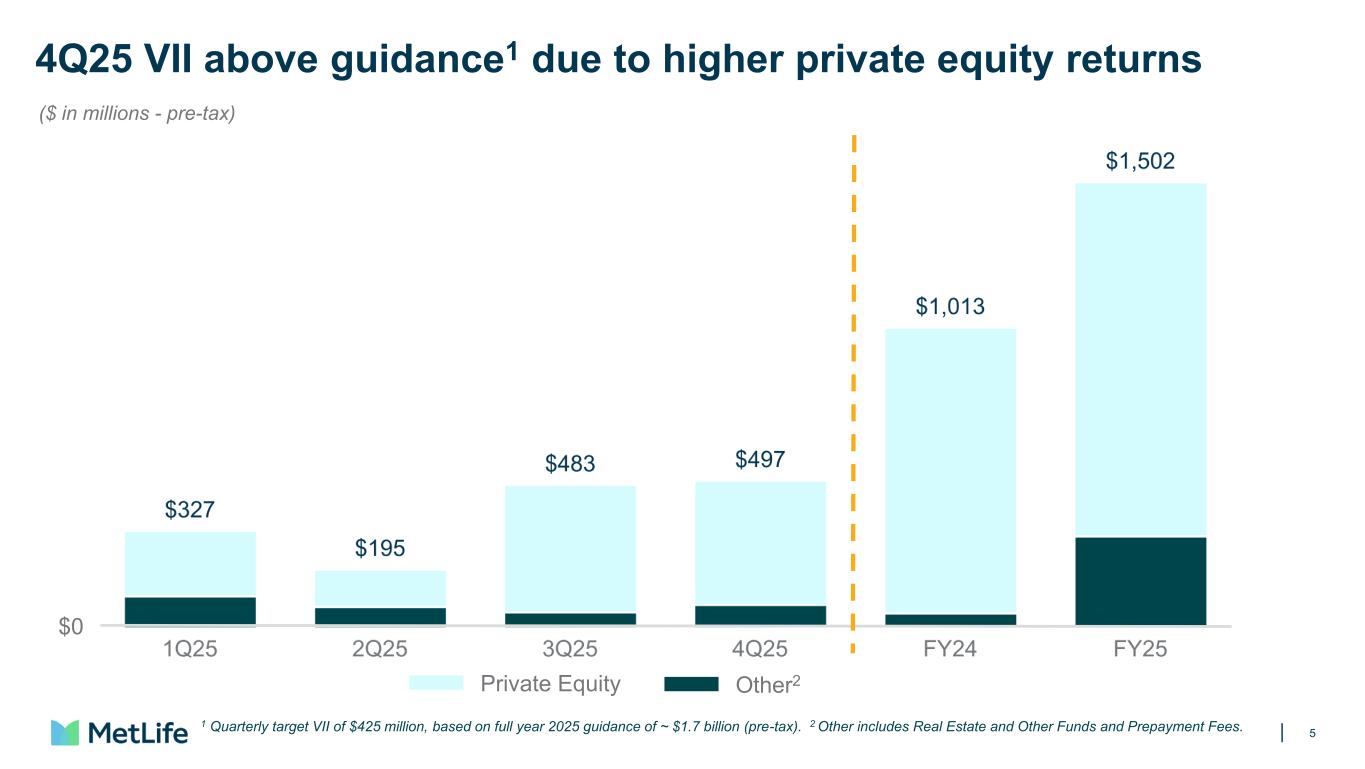
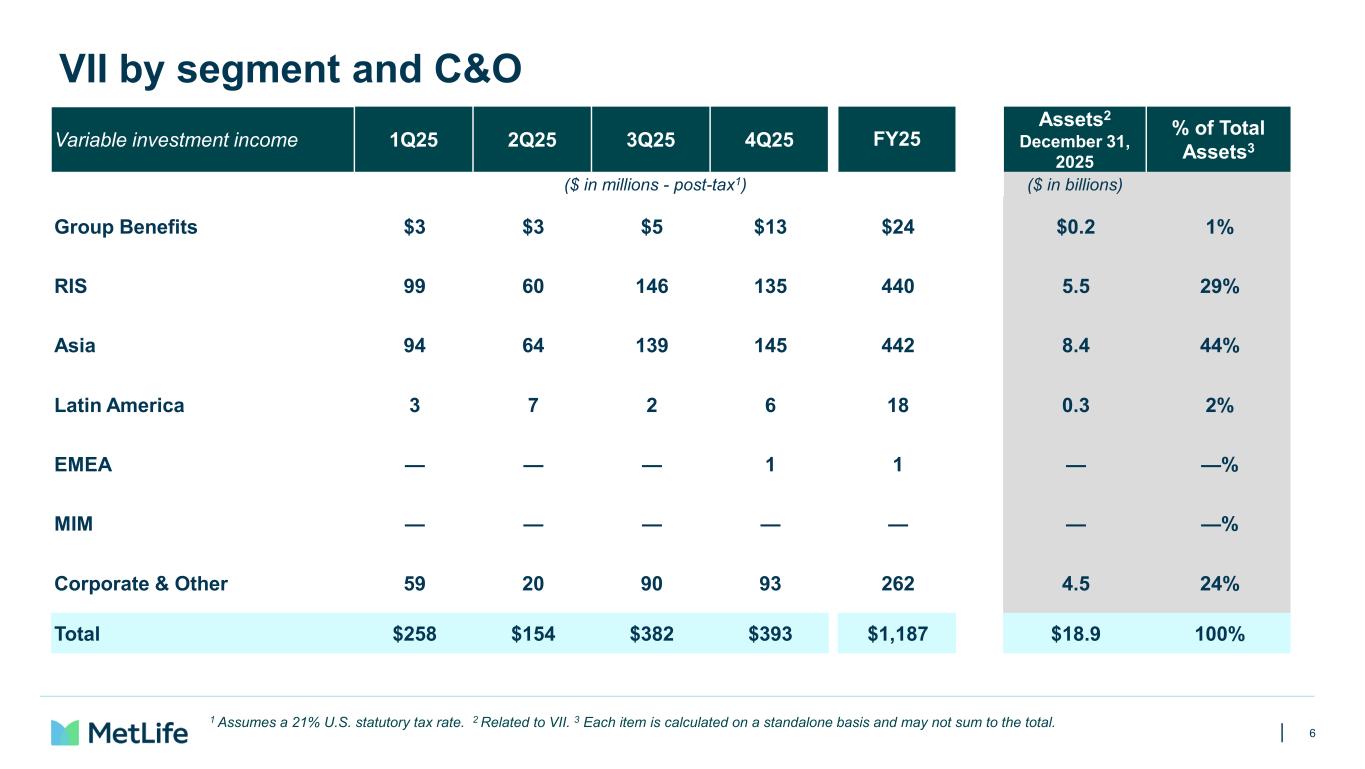
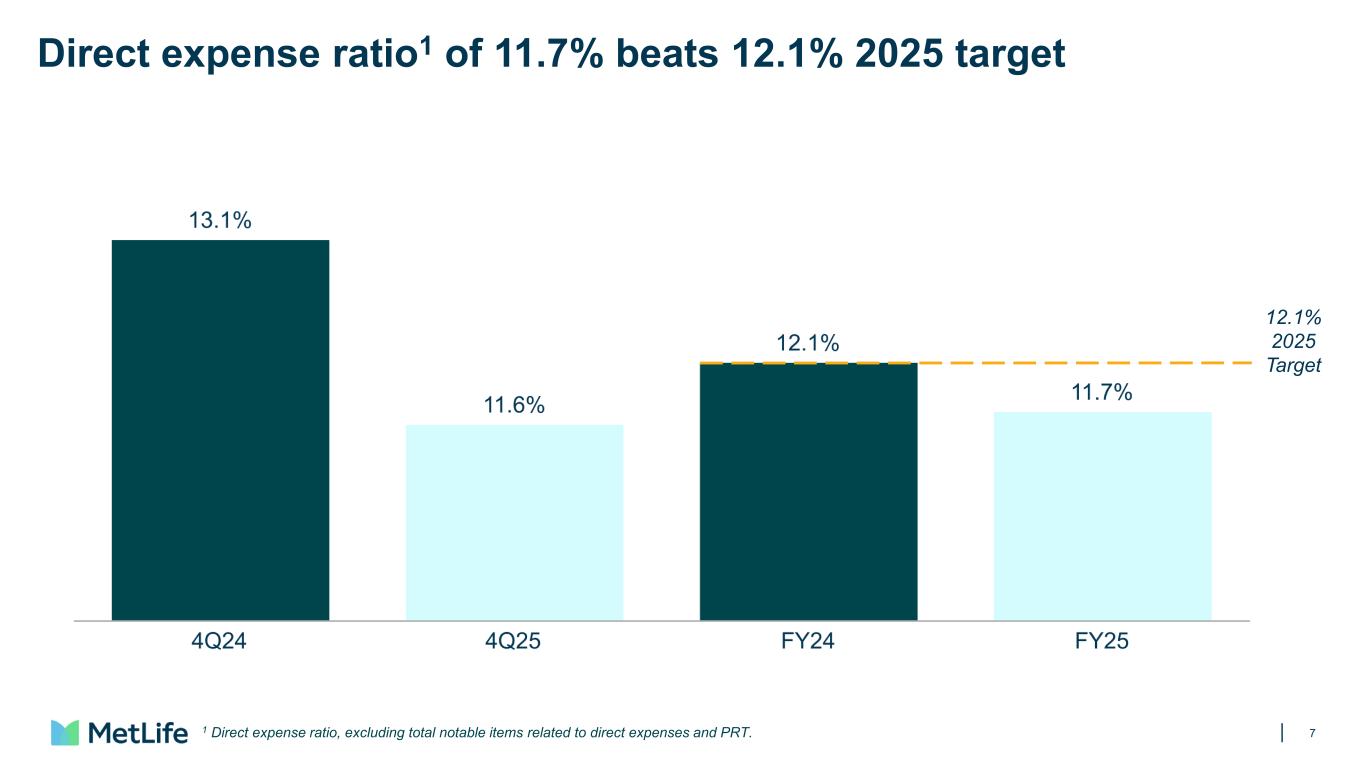
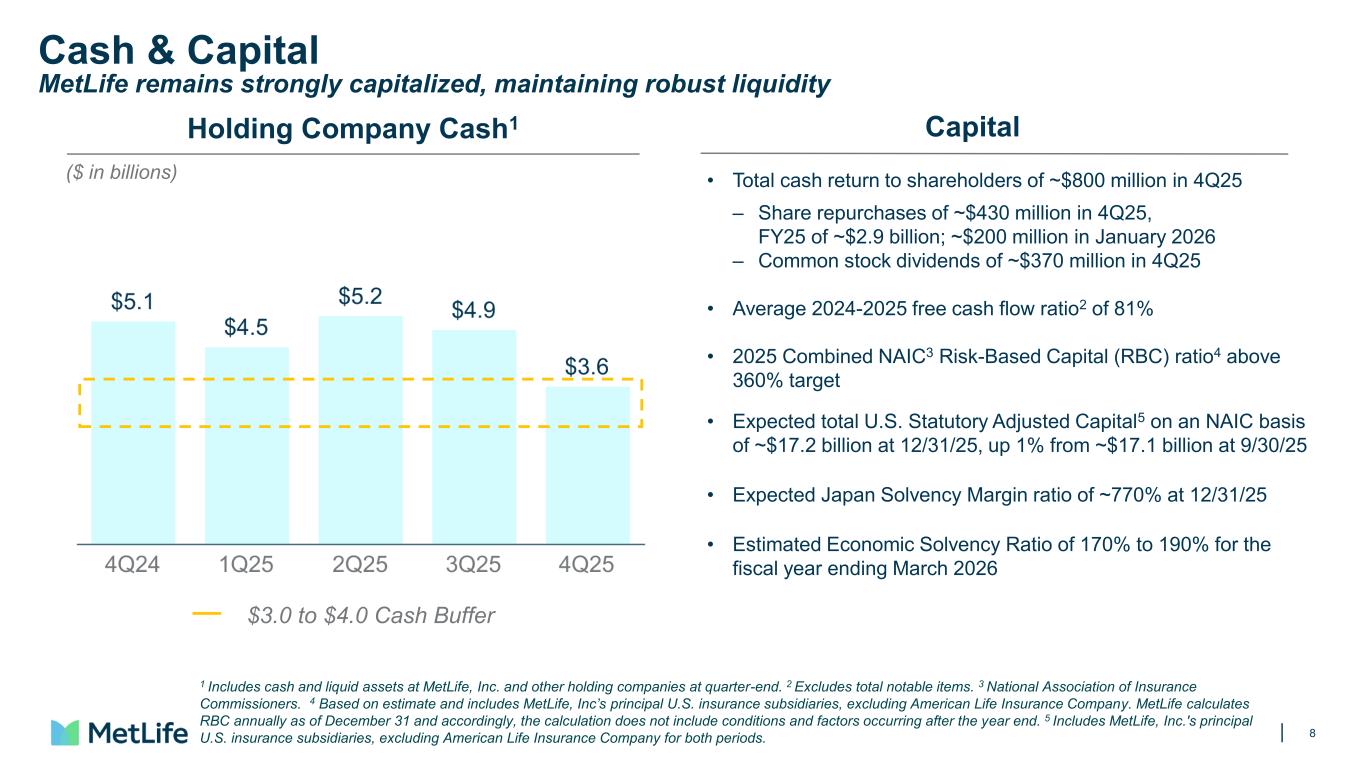
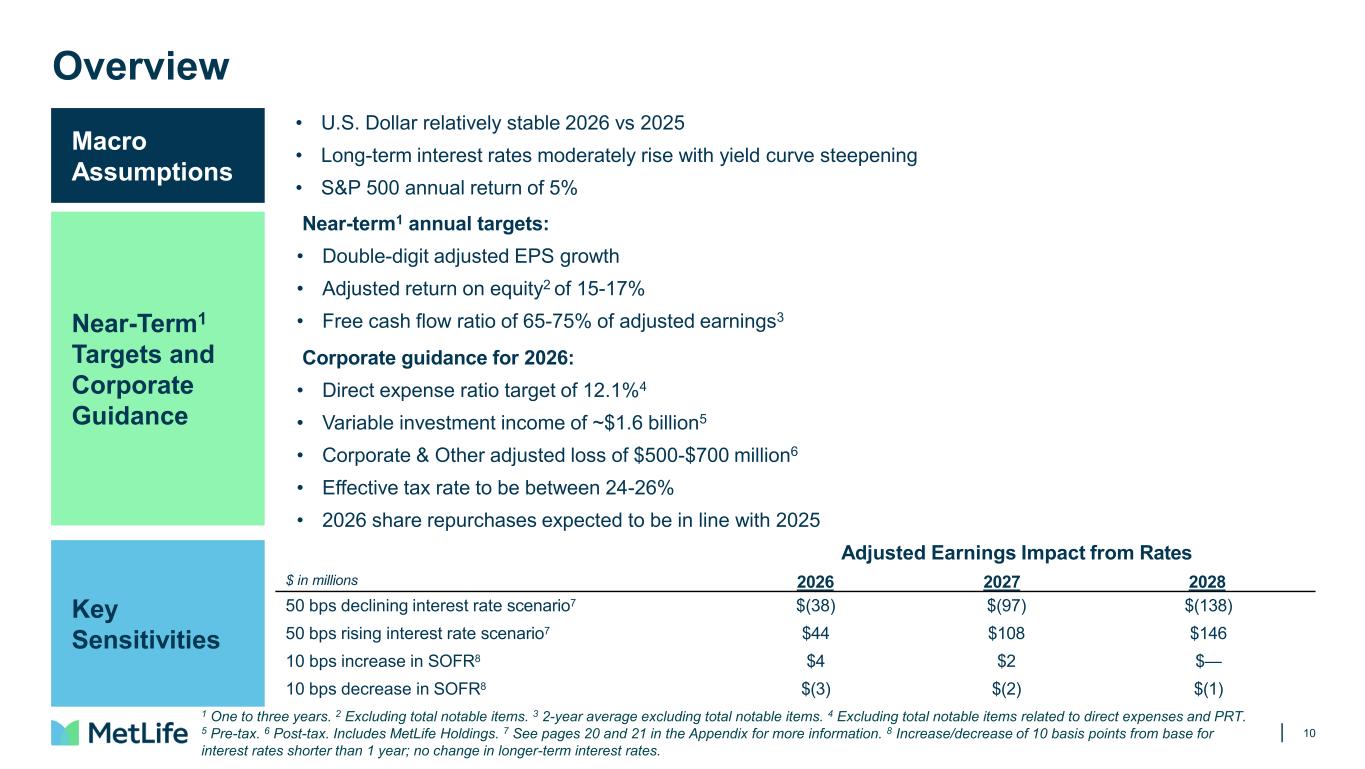
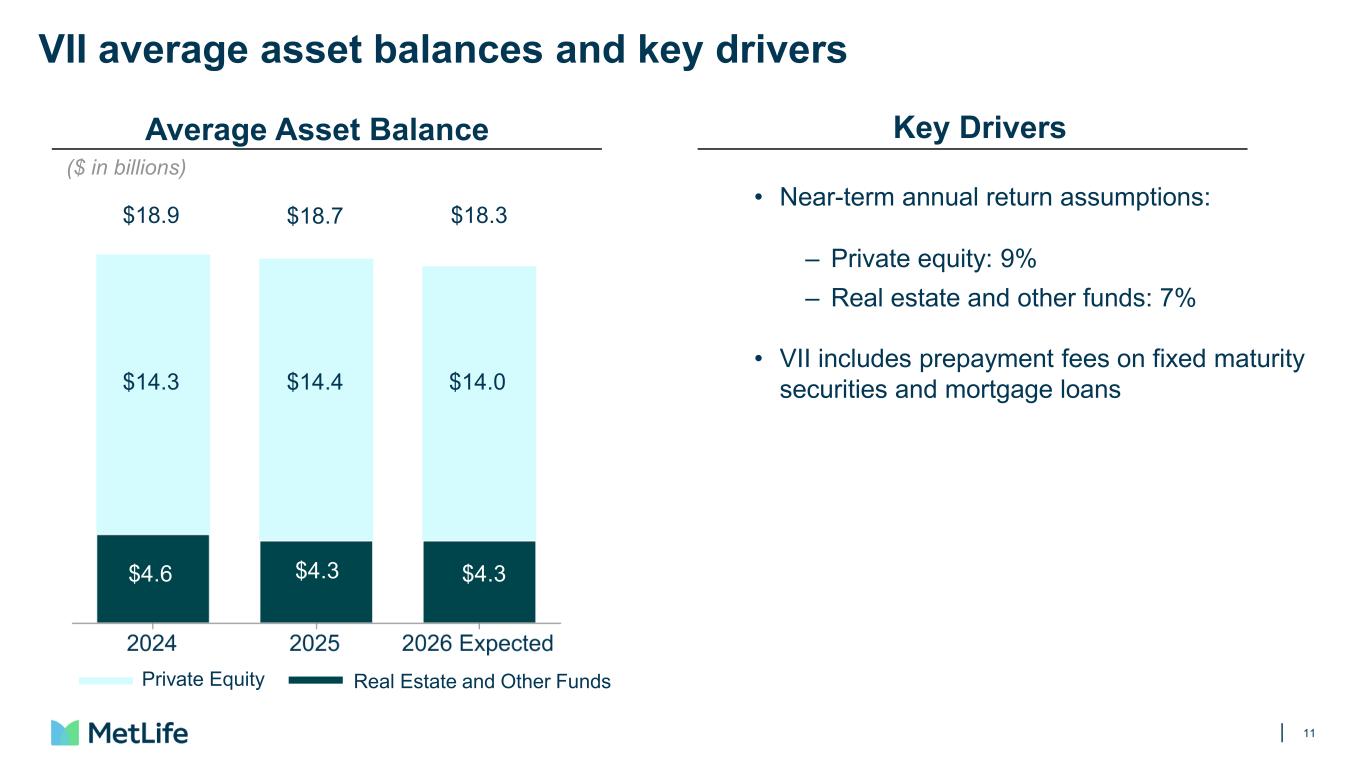
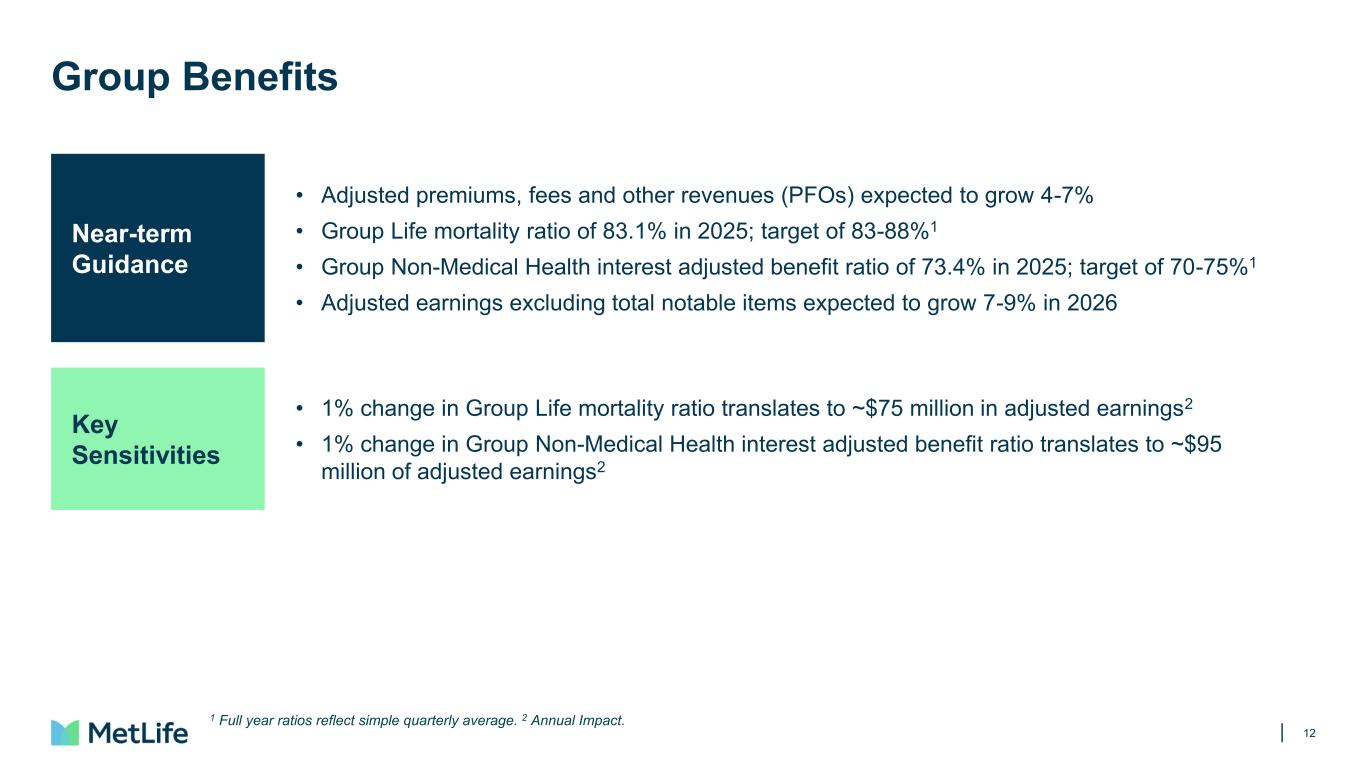
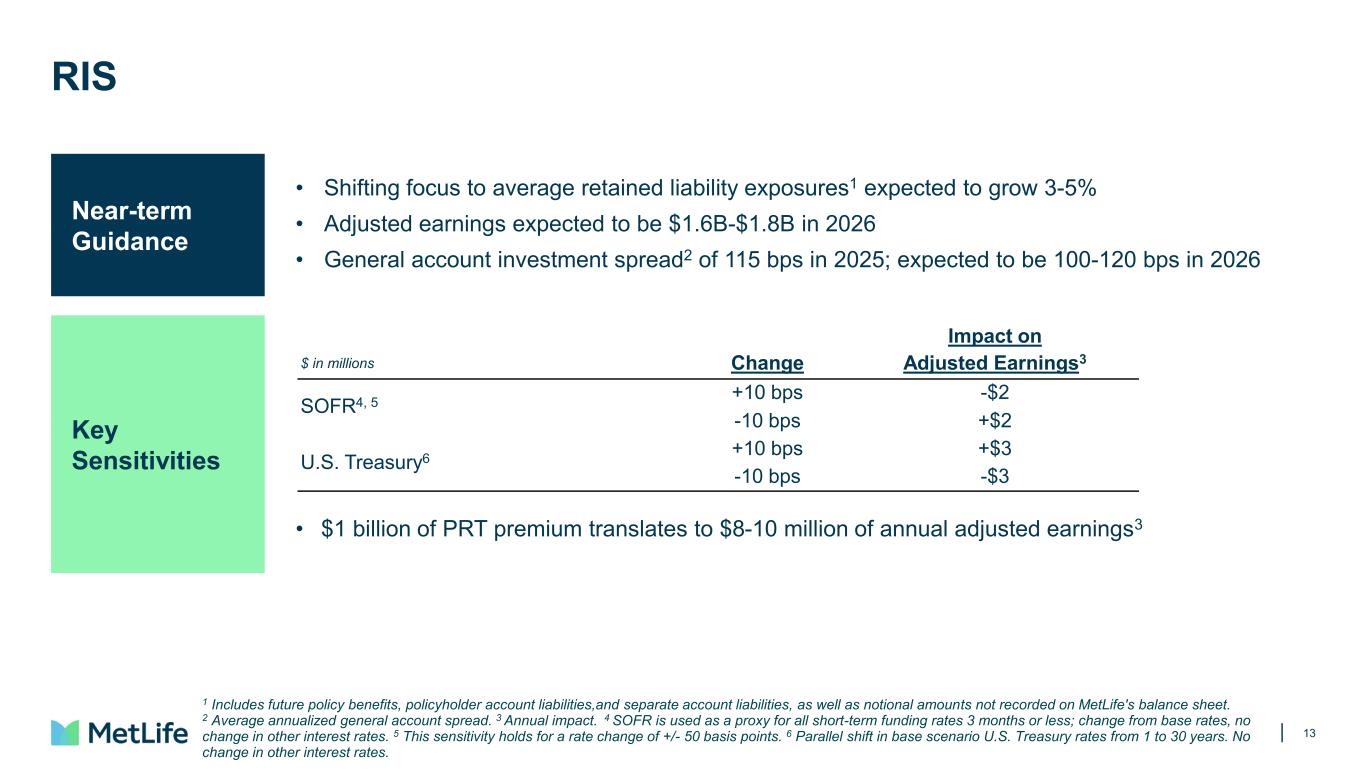
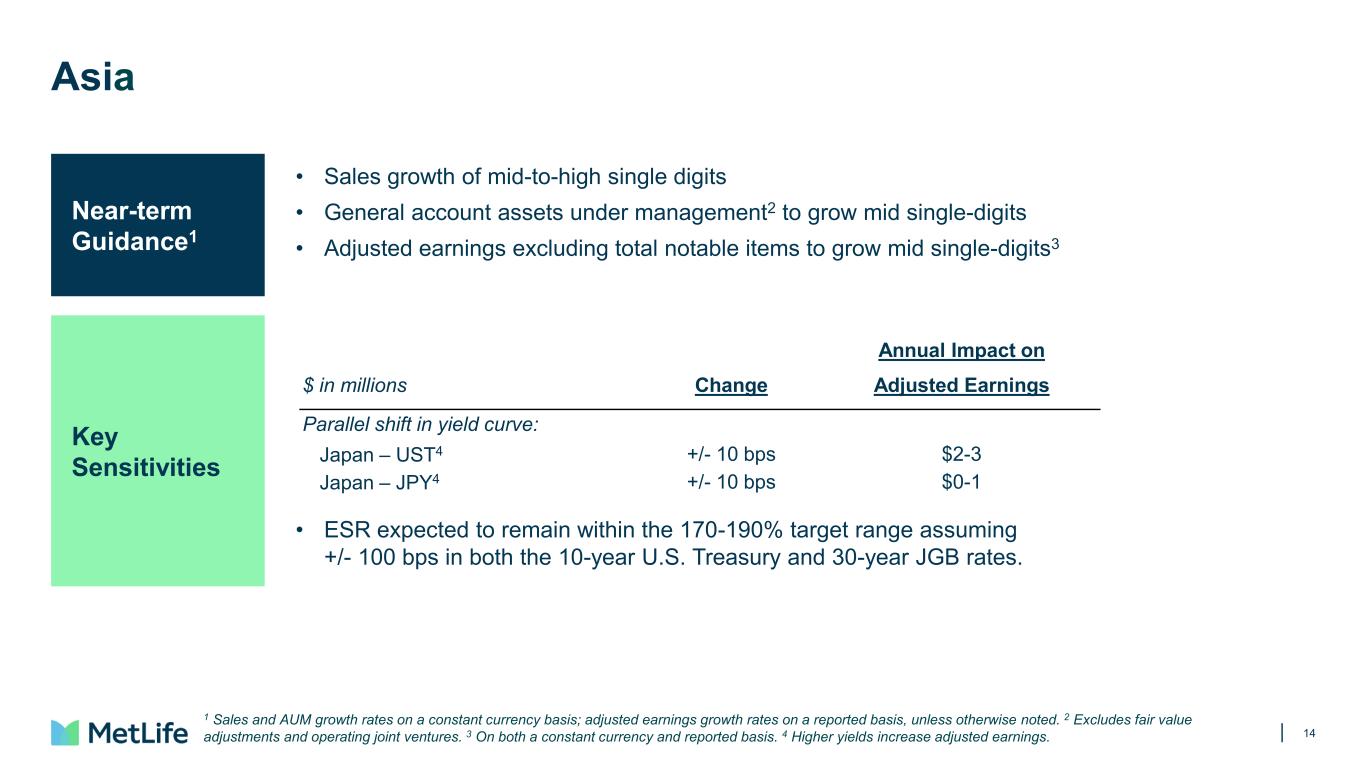
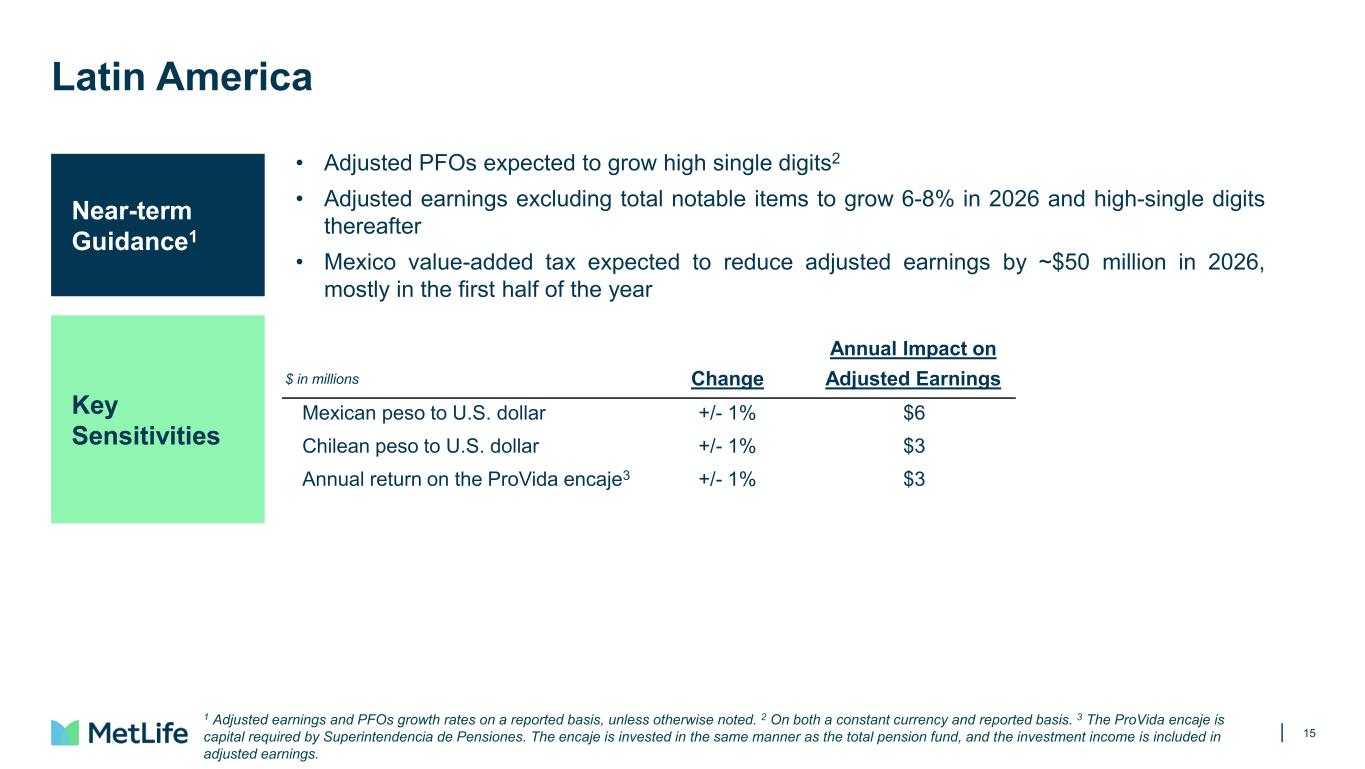
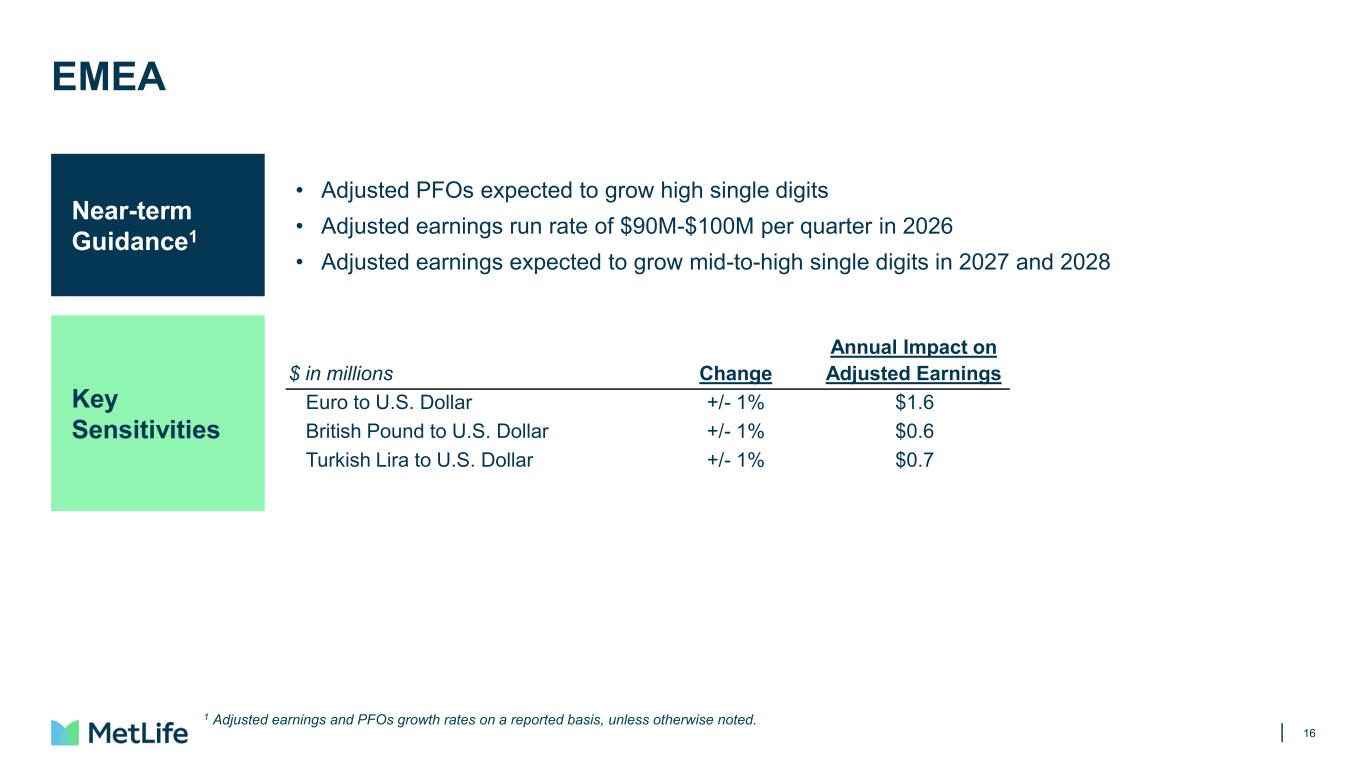
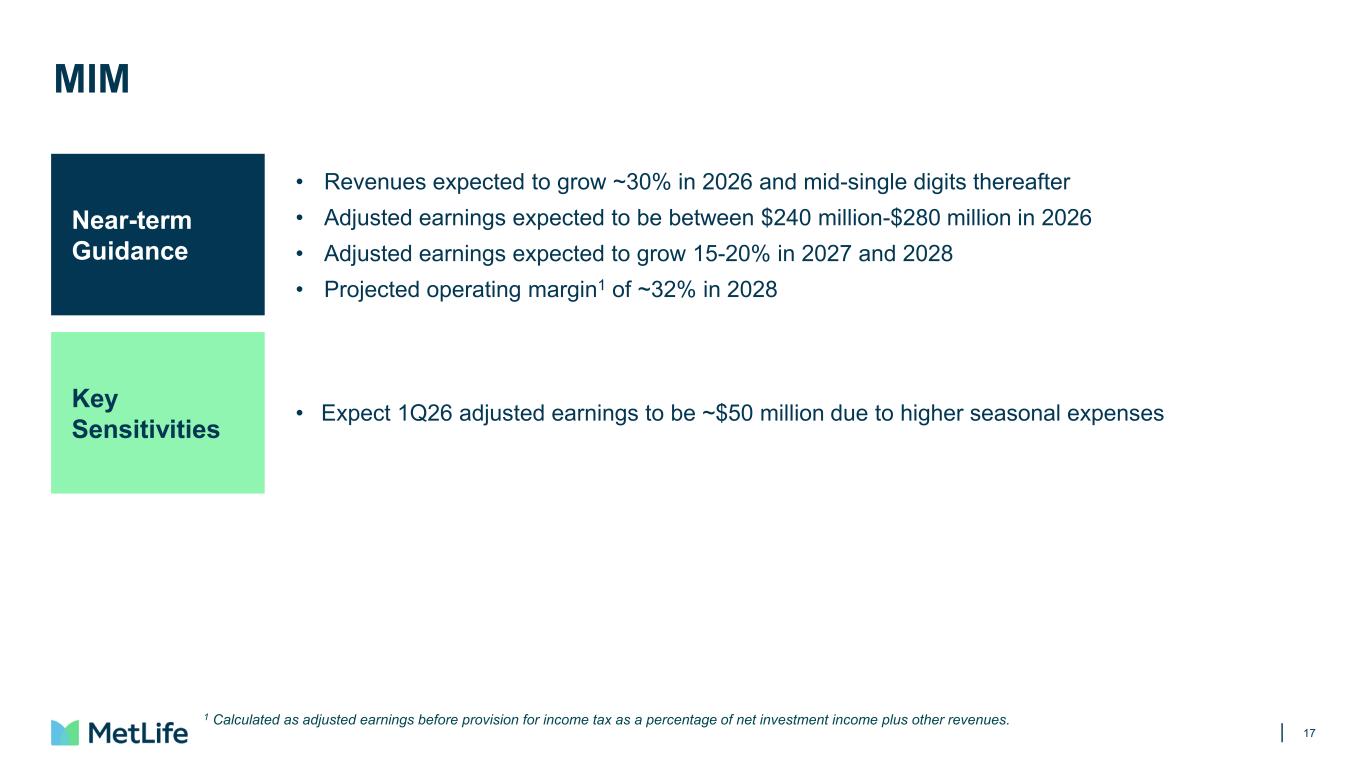
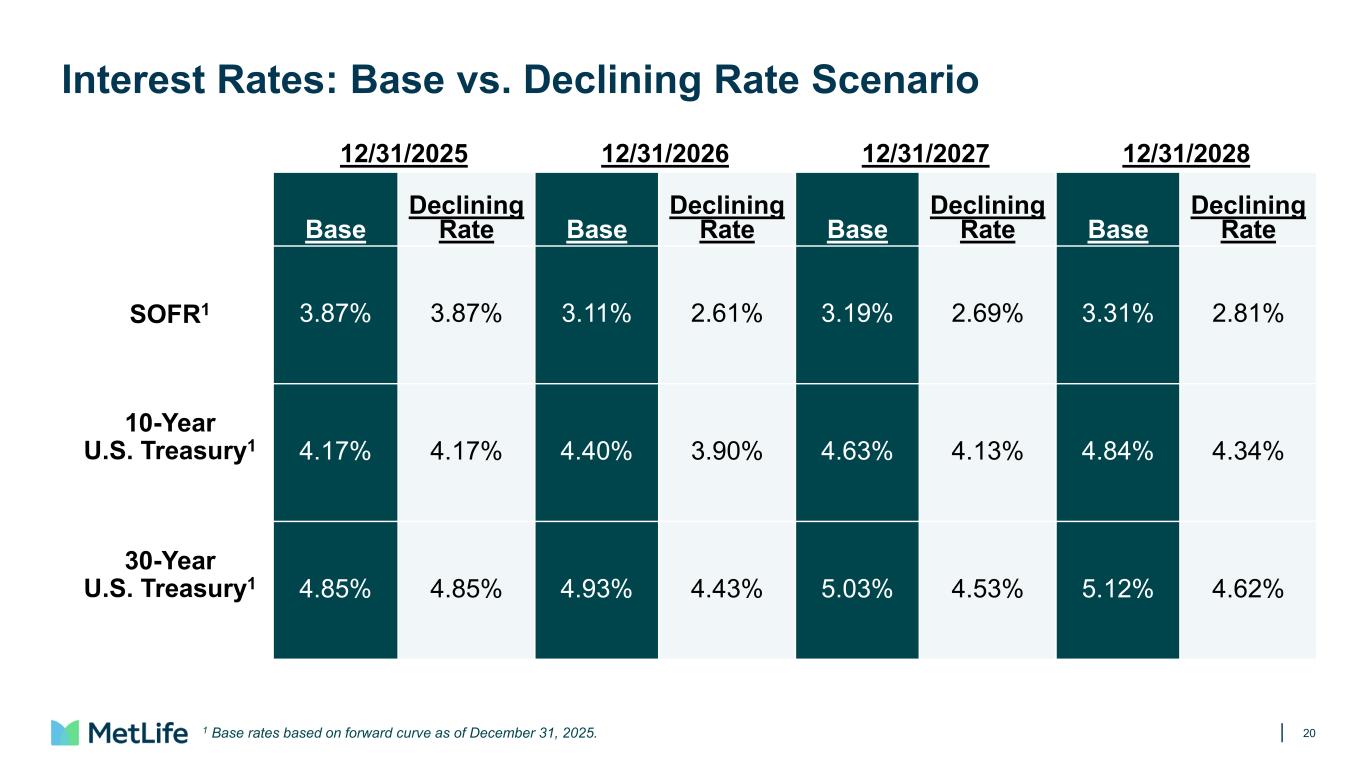
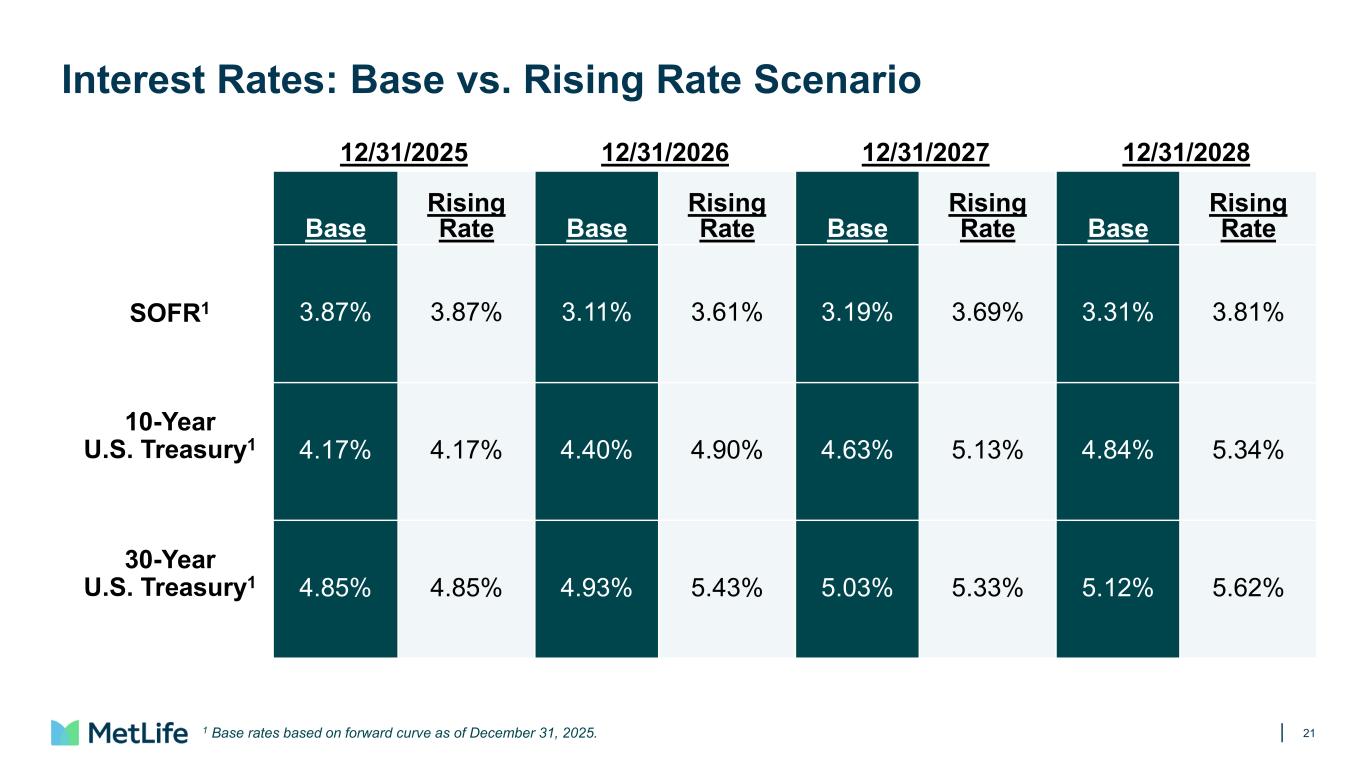
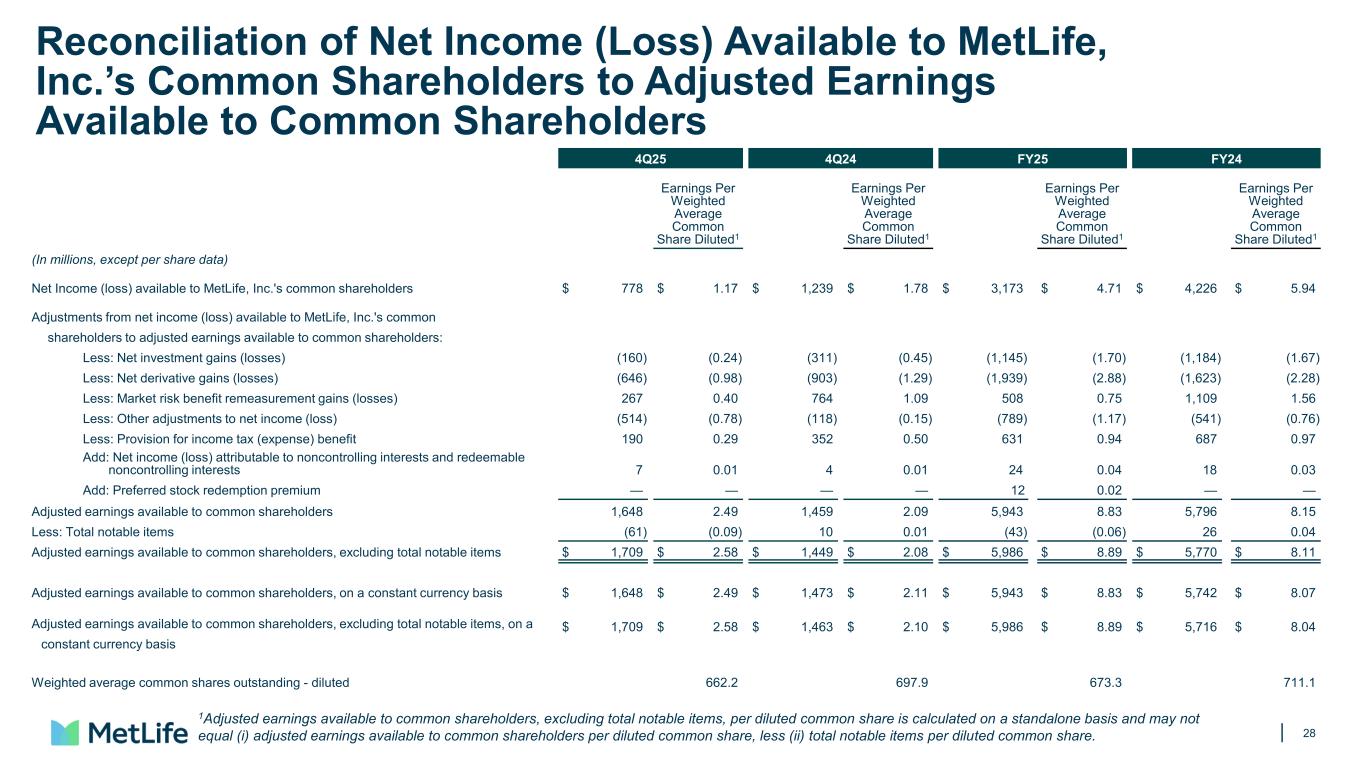
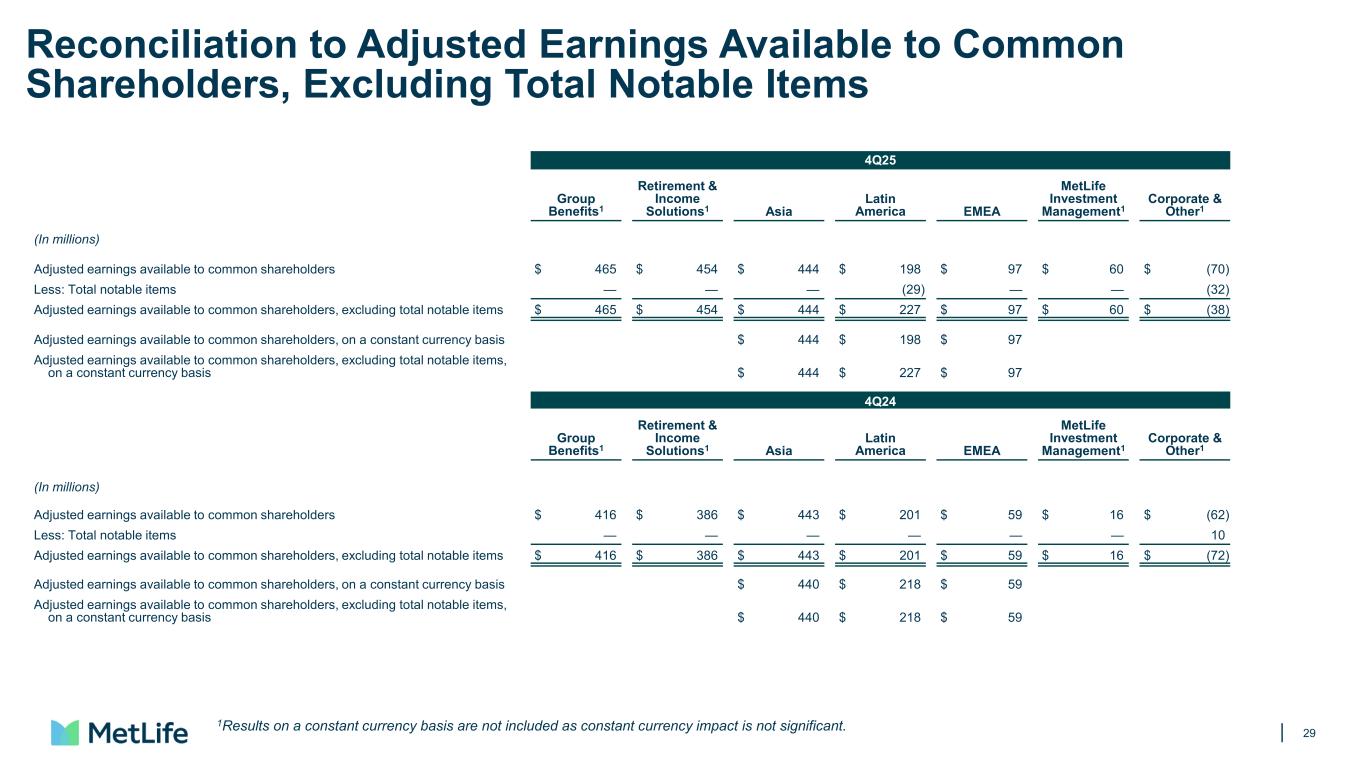
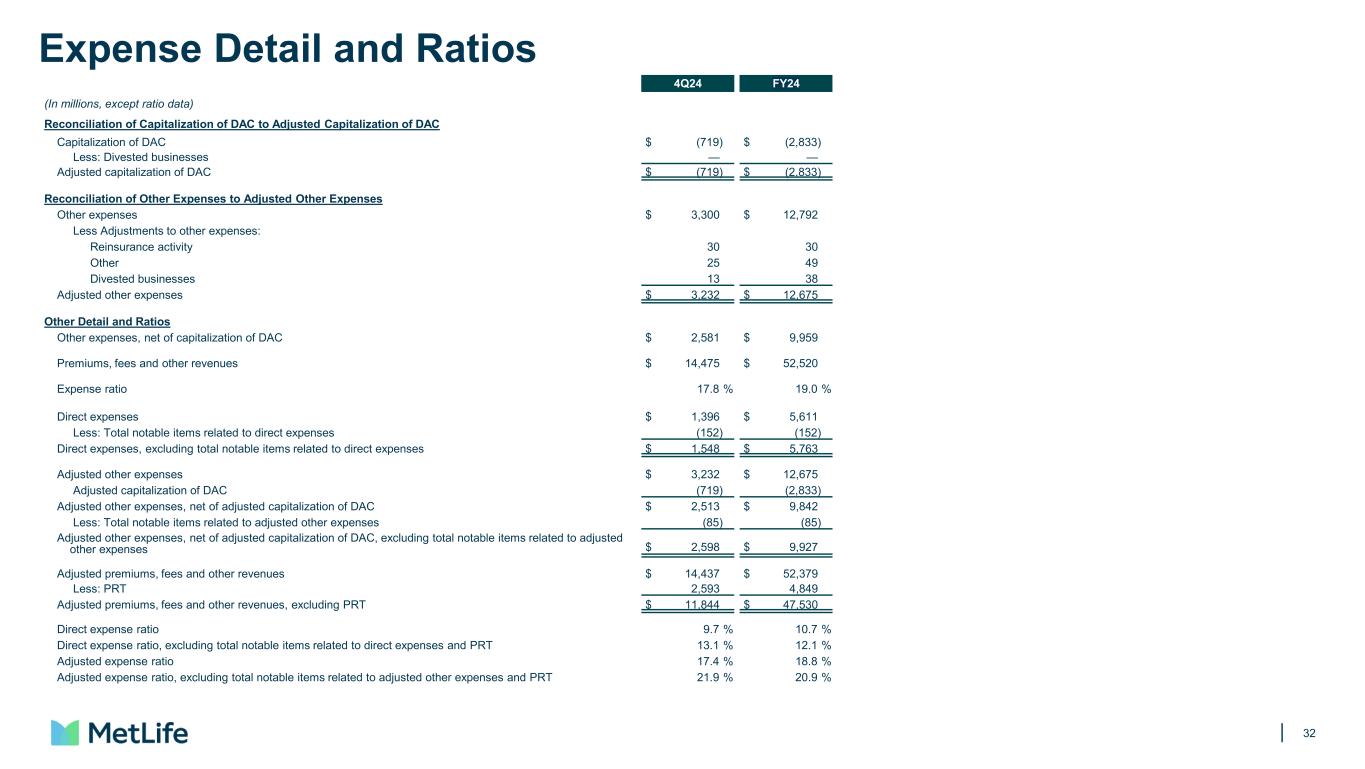
Thank you, Michelle, and good morning, everyone. I'll review our fourth quarter results and refer to the fourth quarter earnings call presentation for financial highlights, including our near-term outlook. Starting on page three, we made significant progress in 2025 toward our five-year financial goals. We achieved 10% adjusted EPS growth, an adjusted ROE of 16% within our target range, a two-year average free cash flow ratio of 81%, surpassing our target, and a full-year direct expense ratio of 11.7%, also beating our target. Overall, an excellent first year, which establishes a strong foundation for our new frontier strategy. Net income was approximately $800 million and $3.2 billion for the fourth quarter and full year of 2025, respectively. The difference between net income and adjusted earnings was mostly attributable to net derivative losses. primarily due to rising long-term interest rates, favorable equity markets, and stronger U.S. dollar. We use derivatives to hedge economic exposures where these offsets are either reported elsewhere in the financial statements or where the offsetting economics emerge over time. In addition, net investment losses were largely the result of normal trading activity on the portfolio and credit remains stable. We had two notable items in the fourth quarter that reduced adjusted earnings by $61 million in the aggregate, or $0.09 per share. The notable items were the Mexico VAT impact we discussed in the third quarter, and higher asbestos litigation reserves recorded in corporate and other. Moving to page four, this slide compares fourth quarter year-over-year adjusted earnings, excluding notable items, by segment and corporate and other. all my comments refer to figures excluding notable items adjusted earnings rose 18 17 in constant currency to 1.7 billion dollars driven by higher variable investment income strong volume growth and favorable expense margins partially offset by lower recurring interest margins also we have revised our definition of adjusted earnings to exclude the non-cash accounting of real estate depreciation to align the impact of real estate asset value changes and better reflect the recurring cash flow and returns of the investment in adjusted earnings. This change increased fourth quarter adjusted earnings by $57 million and is expected to add about $200 million annually, mostly benefiting corporate and other. Adjusted earnings per share were $2.58, up 24% and 23% on a constant currency basis. Growth was supported by disciplined capital management. Moving to the businesses, group benefits adjusted earnings were $465 million, up 12% year-over-year, largely driven by favorable underwriting, primarily in life and dental, partially offset by weaker disability. The group-life mortality ratio is 81.1% for the quarter and 83.1% for the full year, below our 2025 target range of 84 to 89%, reflecting continued improvement in working age mortality trends. The fourth quarter non-medical health interest adjusted benefit ratio of 72.2% was within our annual target range. Seasonally low dental utilization was in line with expectations, however, disability results came in below expectations due to higher average severity and higher incidence in the quarter, albeit within pricing expectations. Group benefits adjusted PFOs for the fourth quarter and full year 2025 was up 2% year-over-year. Excluding the impact of roughly two percentage points from participating life contracts, the growth would be 4%. RAS adjusted earnings were 454 million dollars up 18 percent year-over-year primarily driven by higher variable investment income investment spreads excluding vii remained relatively stable at 99 basis points up one basis point sequentially ras delivered substantial inflows in 2025 driven by record sales of 42 billion dollars in the year pension risk transfers were more than 14 billion dollars and uk longevity transactions were $11 billion, including $7 billion in the fourth quarter. The strength of this origination platform and growth throughout 2025 underscores the global demand for life and retirement solutions, as well as our focus in leveraging strategic reinsurance to enhance our capital flexibility to support this trend. Asia-adjusted earnings were $444 million, dollars essentially flat year over year up one percent on a constant currency basis. The primary drivers were volume growth and favorable expense margins. These were partially offset by less favorable underwriting margins versus the prior year quarter which had positive reserve refinements that benefited adjusted earnings by roughly 30 million dollars. Asia's key top-line growth metrics were robust in the fourth quarter and full year of 2025. The general account assets under management and amortized costs were up 7% on a constant currency basis. Sales were up 18% on a constant currency basis on both a quarterly and a full year basis. Primarily driven by Japan and Korea, our two largest markets in the region. Latin America adjusted earnings were $227 million, up 13% and up 4% on a constant currency basis, driven by volume growth across the region. Latin America's adjusted PFOs were up 25% and 16% on a constant currency basis, while sales were up 26% on a constant currency basis due to strong growth across the region, most notably in Mexico and Brazil. EMEA adjusted earnings were $97 million, up 64% on both the reported and constant currency basis. The primary drivers were robust volume growth as well as favorable underwriting margin. EMEA adjusted PFOs were up 21% and up 17% on a constant currency basis. Sales were up 24% on a constant currency basis, reflecting strong strength across most markets led by Turkey in the UK. Turn to MetLife Investment Management, or MIM, which we are reporting as a standalone business segment for the first time. MIM delivered adjusted earnings of $60 million in Q4 of 25 versus $16 million in Q4 of 24. The primary driver year-over-year was the transition to general account market fees as part of becoming a business segment. Looking ahead, we would point you toward MIM's key financial metrics as shown in our quarterly financial supplement. In addition to the statement of adjusted earnings, we provided AUM and revenue information for both institutional clients and the general account. Corporate and Other, which now includes MetLife Holdings, our legacy runoff business, reported an adjusted loss of $38 million for Q4 of 25, compared to an adjusted loss of $72 million in the same period last year. The primary drivers were favorable investment margins and expense margins. These were partially offset by less favorable life underwriting margins. page five shows our pre-tax variable investment income or vii for the four quarters in full year 2025 as well as full year 2024 variable investment income is 497 million dollars in q4 driven by private equities which had an average return of 2.8 percent while real estate and other funds had an average return of 1.1 percent as a reminder pe and real estate and other funds are reported on a one-quarter lag and accounted for on a mark-to-market basis. For the full year, VII was $1.5 billion, below our 2025 target of $1.7 billion, but well ahead of the prior year. Real estate and other funds accounted for much of the shortfall, while PE returns, which generated a full year 2025 return of 8.2%, were modestly below our annual expected return of 9%. On page 6, we provide VII post-tax by segment and corporate and other for the four quarters and full year of 2025. Most of the VII assets are concentrated in Asia, RAS, and our legacy runoff business now in corporate and other, consistent with the long-term nature of these obligations. As of December 31, 2025, total VII assets stood at approximately $19 billion. Asia represented nearly 45 percent of the assets while RAS and corporate and other accounted for about 30 and 25 percent respectively. Turning to page seven, this chart shows a comparison of our direct expense ratio for the fourth quarter and full year 2024 and 2025. As you can see, we continue to benefit from our efficiency mindset in driving down our cost curve with our direct expense ratio falling to 11.7% for the year, which is well ahead of target. This includes seeing the benefits from the adoption of AI tools and other emerging technology broadly across our company, as we've seen the opportunities to re-engineer processes while also injecting AI tools to enhance the speed and accuracy of our delivery, all of which improves the lives of our customers and our employees. Let me now review our cash and capital position as detailed on page 8. MetLife remains strongly capitalized with robust liquidity. As of December 31st, cash and liquid assets at the holding companies totaled $3.6 billion, in line with our target cash buffer of $3 to $4 billion. The acquisition of Pine Bridge, which closed in the quarter, was the main driver of the reduction in whole-code cash sequentially. In addition, total cash returned to shareholders in the fourth quarter was about $800 million, dollars, including approximately $430 million of share repurchases. An additional roughly $200 million of shares were repurchased in January. For the two-year period, 2024 and 2025, our average free cash flow ratio, excluding total notable items, was 81%, exceeding our 65% to 75% target range. In terms of statutory capital for our U.S. companies, our combined 2025 NAIC RBC ratio is expected to be above our 360% target. Our estimated U.S. statutory adjusted capital on an NAIC basis stood at approximately $17.2 billion as of December 31st, up 1% from the third quarter. We anticipate the Japan solvency margin ratio to be around 770% as of December 31st, pending the final statutory filings in the coming weeks. As a reminder, this will be the last STAT filing in Japan based on the SMR, which will be transitioning to an Economic Solvency Ratio, or ESR. As we have previously disclosed, we expect to report an initial ESR within a range of 170 to 190% from March 2026. Now let's discuss our outlook starting with the overview on page 10. Based on the forward currency curve, we expect the US dollar to be stable in 2026 relative to 2025. The forward interest rate curve projects long-term interest rates to be modestly higher and the yield curve expected to steepen a positive development. And we use an assumption of 5% annual return for the S&P 500. For our near-term targets, we expect to achieve double digit adjusted EPS growth. We expect adjusted ROE to be in the range of 15 to 17 percent. We expect to maintain our two-year average free cash flow ratio of 65 to 75 percent of adjusted earnings, which supports our five-year commitment to generate 25 billion dollars plus of free cash flow. Specifically for 2026, given asset management businesses tend to have higher expense ratios, the acquisition of Pinebridge will add 50 basis points to our direct expense ratio in 2026, with our 2026 target being 12.1%. However, with the considerable progress we've made in the first year under New Frontier towards achieving 100 basis point improvement over the five years, we intend to maintain our 2029 target of 11.3% despite the higher expense ratios associated with accelerating growth in our asset management business. Variable investment income is expected to be approximately $1.6 billion pre-tax. Our corporate and other adjusted loss is expected to be between $500 and $700 million after tax. We are maintaining our expected effective tax rate range of 24 to 26 percent. And, we expect our 2026 share repurchases to be in line with 2025. At the bottom of the page, you will see certain interest rate sensitivities relative to our base case, reflecting a relatively modest impact on adjusted earnings over the near Page 11 provides our outlook for VII. We expect the average asset balances for private equities to decline in 2026 and over the near term as we continue to strategically reposition the portfolio to higher yielding fixed income securities consistent with the higher interest rate environment we are assuming annual returns for private equity to be nine percent and real estate and other funds to be seven percent over the near term finally as a reminder we include prepayment fees on fixed maturities and mortgage loans in VII. Moving to our business segments on page 12, starting with group benefits, we are maintaining our adjusted PFO growth target of 4% to 7% over the near term as we continue to strengthen our market leadership. We are reducing our group life mortality ratio target range by one point to 83% to 88% as we expect favorable mortality trends will continue in 2026. For group non-medical health, we are increasing our interest-adjusted benefit ratio target range by one point to 70 to 75 percent. We are seeing the benefits of our leave and absence capability and technology investments take hold in the market, and therefore this range is reflective of our updated view of product mix over the near term. Taking all these factors into account we expect group benefits adjusted earnings x notables to grow seven to nine percent in 2026. Please keep in mind q1 tends to be seasonally low quarter with both life and non-medical health results skewing to the higher end of the target ratio ranges. RAS near-term outlook is on page 13. As part of new frontier we are strategically leveraging reinsurance to augment our organic capital with third-party capital to support the building demand for retirement solutions. This further supplements our liability growth while allowing us to maintain capital discipline. The common theme is capital flexibility. With our expanded toolkit, we're able to support liability growth and at the same time generate additional investable assets to be managed by MetLife Investment Management. As a result, we've enhanced the statistical pages in the QFS to more clearly reflect the impact of our growing use of reinsurance. As such, RAS segment earnings will be driven by retained liability exposures net of reinsurance. More specifically, the average retained liability exposures, which we expect to grow 3% to 5% in 2026, with growth weighted toward the second half of the year. We expect RAS adjusted earnings in 2026 to be between $1.6 billion and $1.8 billion. Given growth is weighted to the second half of 2026, Q1 adjusted earnings is expected to be relatively flat year-over-year. Finally, we expect total general account investment spread to range from 100 to 120 basis points in 2026. For Asia, on page 14, we expect annual sales growth to be mid to high single digits on constant currency basis over the near term and general account AUM growth in the mid-single digits. Asia adjusted earnings, excluding notable items, are expected to grow mid-single digits over the near term. Regarding the Japan ESR, assuming 100 basis point change up or down in either or for both the 10-year U.S. Treasury and or the 30-year JGB rates, we expect to remain within 170 to 190 percent target range. On page 15, for Latin America, we expect adjusted PFOs to grow high single digits over the near We expect Latin America adjusted earnings, excluding notable items, to increase 6 to 8% in 2026, including a roughly $50 million impact from the Mexico VAT change, which we expect to be mostly in the first half of the year. We expect adjusted earnings to return to high single digits growth in 2027 and 2028. Moving to EMEA, we expect adjusted PFOs to continue to grow high single digits given the strong momentum in the business. For adjusted earnings, we expect EMEA's new quarterly run rate to increase to 90 to 100 million dollars in 2026 and then grow mid to high single digits in 2027 and 2028. Finally, for MIM, we expect revenues to grow roughly 30 percent in 2026, largely driven by the combination of Pine Bridge, and then increase by mid single digits thereafter. For MIM adjusted earnings, we expect to be between 240 and 208 million dollars in 2026, then grow 15 to 20 percent per year in 2027 and 2028 from a combination of revenue and expense synergies as well as greater operating leverage. By 2028, we are targeting an operating margin of approximately 32%. In addition, we expect MIMS Q1 adjusted earnings to be approximately $50 million, lower than the implied quarterly run rate due to higher seasonal expenses in the first quarter. In total, MetLife delivered a strong quarter to close out another strong year. we successfully executed key strategic initiatives to support new frontier while achieving our financial commitments. Building on our clear momentum and solid fundamentals across our diverse set of market-leading businesses, we achieved robust top-line growth, maintained disciplined underwriting, and exercised prudent expense management. With a strong balance sheet and reliable free cash flow generation, we are well-positioned to achieve responsible growth and deliver attractive returns with lower risk, creating sustainable value for both our customers and our shareholders. And with that, I'll turn the call back to the operator for your questions.
Operator
Thank you. We will now begin the question and answer session. If you have dialed in and would like to ask a question, please press star 1 on your telephone keypad to raise your hand and join the queue. If you would like to withdraw your question, simply press star 1 again. As a reminder, we ask that you please limit yourself to one question and one follow-up to allow everyone an opportunity to ask a question. We'll take our first question from Jimmy Mueller at JPMorgan.
Hey, good morning. So first, just had a question on group benefits for Rami. Just comment on what you've seen through renewal season and various product lines. I know you've been pricing up dental over the past year. how you're seeing your, like, what you've done in terms of pricing in various product lines and whether you're seeing competition, pickup, or ease in any of the products and group benefits?
Thanks for the question, Jimmy. I would say if we look at our 1-1 results, in particular with respect to persistency and renewals, we're seeing pretty robust results. I would say increase in persistency in particular in dental as we've talked about uh we did take actions in 1-1 of 25 with respect to the dental business and responded quickly to kind of get back to our target margins and i would say at this point uh persistency is uh is improving and it's pretty robust and although we'll come back and talk to you about our full q1 results at this point we also have good sales growth across our book of business and in particular I would highlight disability here as a as an area of strength that we're starting to
see based on our one one results and then just another topic for Lyndon or maybe Michelle and in Japan you've seen pretty dramatic moves in some of the macro variables whether it's currency or interest rates how is that affecting your business in terms of persistency, maybe the sales mix, and any comments on the competitive
environment in that market as well? Hey, Jimmy, it's Lyndon here. So, yeah, we have seen some macroeconomic volatility recently, both in the FX as well as the rates. But just if you think about it, the short-term impact on sales could be due to rates. We see a short-term impact during during periods when we see significant macroeconomic fluctuations. What happens here, our customers tend to wait for the markets to stabilize before going out and buying foreign currency products. So we see these temporary fluctuations, but for the most part, our value proposition continues to remain solid with the customers. And given the breadth of our product portfolio and our distribution strength here, it really gives us, puts us in a good position to meet the demand through these periods, whether it's yen or
dollar products. And just with the issues at Prudential, obviously there are more company specific and don't have anything to do with you guys, but do you see any impact on your business just because of Prue and you both being American company in terms of sales, persistency, recruiting?
Yeah, look, you know, thanks for the question. We really don't have much to say about it. I mean, we're aware of the situation we're very optimistic about our position in japan as you are during investor day we think it's a very attractive market given the higher rate environment as well as all these positive macroeconomic trends there's a lot of capital coming into the market and it continues to be a competitive market but as i said we've got a really good platform strong multi-channel distribution a very diversified product portfolio you can see our sales results have been very strong this year they've been up 17 so we're very optimistic about our position in japan and optimistic about our potential and going into 2016. thank you we'll move next to
tom gallagher at evercore isi good morning first first question uh john just a question on this change in uh gap earnings state accounting i think the 200 million dollar benefit that you flagged Like, is this a gap-only impact, any expected change in statutory, or did statutory already have that adjustment? And why change this? Were you more conservative than peers, or is that more reflective of what you think the economics are?
Yeah, thanks. Good morning, Tom. Yeah, it's something we've thought about for some time. And, you know, I think just the resegmentation and change kind of gave us an opportunity to rethink just the reporting in adjusted earnings. And, you know, I think, you know, relative to peers, we probably had a higher allocation to real estate because of our expertise in the area. And so we tend to lean into this asset class. So, you know, we did a review as we thought about it. You know, quite honestly, the non-cash cost accounting construct really is not ideal for representing kind of the annual cash flows and annual returns of this product. It also doesn't really align with, you know, the changes, the book value, and then you have a sale that goes below the line. So we try to make this, you know, this change create a little more alignment in, you know, kind of the overall economics of the asset class and just more reflective of our operating cash flow.
That makes sense. Hey, I thought I'd throw out a MIM question since it's the new bright, shiny object this quarter. And it's a question that we've been getting recently, so I'm curious to what extent you can comment on Bright House. obviously going to be acquired by Aquarian I know that they're a partner of yours that's part of you know you have an investment management agreement with them any way you can sort of frame how meaningful that could be if that contract changes with the acquisition and is that is anything for that baked into your 26 guide or would that more likely be a 27 issue thanks yeah let me
start with first we're very excited about just closing Pine Bridge at the end of the year I think there's just been a excellent momentum hitting the ground 1-1 as one team and and just to kind of highlight you know we have historically in MIM you know been kind of a one MIM platform we really haven't built this boutique style so there's a there's a natural process for you know how these complementary businesses can come together and integrate and we're really excited about what's ahead. You know, even looking at things from between sign and close, you saw kind of our flows in MIM were very strong, and Pinebridge did great. And that's just a testament to why this makes sense and how it's resonated in the market. And so we're really excited about, you know, what's ahead. And it just gives us a bigger, you know, even further expansion of our solutions that we can provide to clients, and particularly insurance clients. you know we can be a full service provider to insurance clients not a product pusher but just really kind of focusing on what's best for them we serve their needs and you know as you mentioned Bright House Bright House is a you know great relationship for us we have a long history we we take pride in that you know we're we're excited to have the opportunity to work you know with the the new combined firm that they have and I know they're going through a process right now. So, you know, we're here to help them. Look, at the end of the day, we have a diversified set of clients across our MIM platform. You know, we have, you know, close to $150 billion of AUM in insurance. And, you know, we have a diversified set. And to the, you know, I think when it comes to exposure, you know, while we are excited about keeping and growing our relationship with Bright House. That's kind of our expectations. You know, at the end of the day, you know, to the overall firm, this would be, you know, worst case scenario would, you know, at the end of the day would be a very modest impact to EPA. Okay. Thanks for that. We'll move next to Joel Hurwitz at
Dowling. Hey, good morning, Michelle. In your prepared remarks, you mentioned that you guys had tapped the U.S. retail retirement space with low reinsurance. Can you just provide an update on what you've done to date and your outlook for that opportunity at this point?
Hey, Joel. It's Rami here. I'll take this one. I would say first you just need to put this in the broader context of our retirement strategy in the U.S. that we talked about as part of our new frontier strategy. And at the highest level, look, our approach here is to compete in the retirement space in areas which play to our strength. and leverage our competitive advantage and we looked at that and as part of that looked at a fast-growing U.S. retail annuity market and identified an opportunity to participate in that market in a way that does leverage our competitive advantages and in this case the path that we have chosen is to participate in that market on an institutional basis as a reinsurer. And look, testament to the discipline of execution here, in under a year, we executed against that strategy. We now have two partners with flow reinsurance deals in place that have kicked off over the past couple of months. We value these partnerships, and our partners value what we bring to the table, in particular in terms of financial strength, investment capability, capital flexibility. So this is exactly what we mean when we say we're looking for opportunities that play to our strength. And at the end of the day, this is going to add to our ability to grow liability origination and capture the momentum that we're seeing in the retirement market in a way that works well for economics and plays to what we can bring to the
table here. Got it. That makes sense. And then just wanted to follow up on Jimmy's question on Japan and the macro and on persistency. Did you guys see any increased surrender activity in Q4 thus far in Q1? And I guess, is there anything baked into your outlook for potentially higher
surrenders just given uh the effects and and rates yeah um hey joel it's uh linden here so yeah we did see the trend surrender trend in the fourth quarter was a little bit higher than than it had been sequentially in the third quarter and that was primarily because we saw the yen had depreciated relative to the u.s dollar uh for the full year in 25 our surrenders have come down relative to where they were in 24 and for 26 we're assuming that surrenders come back to our long-term assumption over there and that is baked into our
Operator
2026 guidance that's it thank you we'll go next to Sunit Camus at Jefferies
thanks good morning I wanted to start with group you know one of the questions we always get is you know AI is coming in it's going to take out X percent of the workforce. That's going to negatively impact group benefits companies. And if I look at your guidance, you know, it looks like growth on top of, you know, pretty good growth this year. So it doesn't feel like you're building anything in related to that. So can you just talk about what you're seeing maybe at the customer level in terms of either hiring or layoffs, just so we can
kind of see what the scope is in terms of where we are? Thank you, Sunit. It's Rami here. So So, look, when we construct our PFO outlook, we look at a number of factors. We have certainly incorporated what we have been seeing in our book with respect to employment actions that some of our clients have taken, be they AI-driven or otherwise. And the outlook assumes that this trend would continue in 2026. So we are taking a very grounded view of where that picture is heading. But look, at the same time, in our outlook, we also incorporate what we're seeing in terms of growth, be it in terms of adding coverages to existing employers, and new sales, increase in participation rates via our enrollment effort, and a piece of that is the very strong start to 1.1, which I've talked about earlier, and that's been a strong start both in terms of persistency and sales, and really sales across the entire book, inclusive of disability. So when you put all of this thing together, we feel comfortable with the Outlook range. The diversified nature of our book across industry, size of employers, and geography are all helpful factors for us here. if we were to see more ebbs and foreclose in terms of the employment levels across economies as well as across sectors. So net-net, we feel comfortable with the outlook, and we are incorporating what we're actually seeing by way of employment actions in our book as well.
Okay, that's helpful. And then I guess for John on capital, I wanted to ask about Japan, because one of the things that we're hearing is that you know unrealized losses in japan can influence the sort of dividend formulas in terms of uh getting capital out um so i just wanted you to maybe address that and kind of how you think that could play out in 2026. thanks yeah good
morning sunit um yeah like you said there in in japan and elsewhere quite honestly um you know there's multiple factors when you think about dividend capacity right you have your uh you have your solvency ratios. You also need to look at kind of the retained earnings. And that is true, but, you know, there's other factors that go into that from the balance sheet as well. So there's multiple things that get in there. I think at the end of the day for us, we're not seeing any constraints on our dividend capacity in Japan. So there's really no change. And that includes, you know, as it relates to transition to the ESR. And we feel like we're in a healthy position when
it comes to, you know, retained earnings as well. Can you just size what percentage of the Japan
book has been reinsured out of Japan? I don't have that off the top of my head. We've done, but we've done reinsurance for quite some time over the course of, you know, the last probably decade. And we've utilized mostly, you know, our Bermuda entity when it comes to that. But it's a It's a portion, but it's certainly not a majority.
Operator
We'll go next. Wes Carmichael at Wells Fargo.
Hey, good morning, and thank you. First question on group disability. I think you had a little bit of less favorable experience in the quarter, and I think the non-medical health loss ratio was kind of flattish sequentially. We've heard similar comments, I think, from peers. Just wondering if you could unpack a little bit what you saw in disability and if you'd expect that to kind of continue into 2026.
Yes, it's Rami here. So we did have some pressure in the quarter with respect to disability. Think about it as just slightly over a point in our non-medical health ratio. There are a few moving parts here. So one, we did see a slightly higher average severity across our long-term disability book. We did see social security decisions come a bit down this quarter. those tend to kind of fluctuate quarter to quarter recoveries and incidents i would say recoveries were slightly down in the quarter but for the full year they were strong and above expectations incidents slightly ticked up in the quarter but again for the full year they were also largely in line with expectations so if you think about how we were to trend this while this has been an unfavorable quarter. It certainly does not make a trend, and I wouldn't extrapolate from the outcomes in this quarter into 2026. That's very helpful. And maybe, Rami, just sticking with you,
but in terms of mandatory paid family leave and related products, I think a few states are rolling out new mandatory programs. But as I kind of look across the map of the U.S. with mandatory leave, it looks like there's a lot of white space. There's no Texas, no Florida. A lot of central U.S. states don't have the programs yet. So I know the offerings maybe aren't as profitable as some of the other products in Group, but do you see that as a big opportunity to take more market share from MetLife as more states come online?
Yeah, thank you for the question. So maybe I'll just step back and talk about disability in general and then come back to paid family leave and really also bring you back to the context that we talked about at our Invest today. We identified the disability space in general as an attractive growth opportunity a lot of secular trends are driving that growth inclusive of the state-based regulations are coming through we made investments in this space both to provide best-in-class capabilities to employers and employees we talked about some of our digital capabilities as well and that value proposition is resonating well in market and look as part of that strategy we also talked about employers wanting to do more with fewer and talked about absence and disability as a an anchor product for us and the proof point in here is that the vast majority of our absence and disability sales are actually bundled with our overall suite of products so that's kind of the broader context around disability and absence in general when you think about paid family medical leave this has been a piece of that puzzle and one that has given us some nice tailwinds as more states have rolled out programs including Minnesota and others and we talked about the picture of that continuing because of the white space you've just mentioned and our approach in this space leverages all the capabilities that I've talked about but also leverages the breadth of our product portfolio and just to give you another data point here when I look at our one-on-one sales for PFML on average they came with four or five additional coverages that were bundled with those sales so this is a really classic example of us identifying an opportunity formulating a strategy and just executing really well against it, and we're very pleased with the outcome. Thank you. We'll go next to Alex Scott
at Barclays. Hi. Thanks for taking it. First one is on corporate. I just wanted to understand the 500 and 700. I mean, there's some different moving pieces there with the resegmentation. So is there any, I guess in particular, is there anything that's more specific to 26 in that number it just felt a little higher than i was expecting when i was sort of going back and understanding holdings and corporate and what the combination and mem would mean hey good morning
alex you you're saying uh you you were assuming a higher you would know i was thinking it wouldn't
be quite that high of a or i wouldn't expect it as big a loss i guess so i just wanted to understand if there was something more one time in nature for 26 and the numbers sorry yeah i mean maybe
I'll use Q4 to maybe try to get you there, right? So on an ex-notable basis, our loss was 38. And you have to take into account if there was some, you know, I'd say non-recurring items in taxes, expenses, we had some reserve releases, and we had some excess quarterly NII in that, in CNO. that probably gets you up to a run rate of around a hundred and then when you translate that into the next year you have to take into account and I think this is important so I appreciate the question the you know we did some reinsurance transactions in the fourth quarter so the Talcott rent transaction we announced you know that's about a hundred million of lost earnings we did the chariot one so think close to 30 of additional lower earnings from MLH which is now in corporate and other and then the other thing you have to take into account just for seasonality is remember every first and third quarter we have about 15 million more of cost for preferred dividends so that should help you with your quarterly modeling but that's that that's a little bit of very
hopeful next one for you is just on the artificial intelligence topic and I I think you touched some on just employment sensitivity and group. But is there any other, you know, opportunities or risks that you'd point out? And can you talk about even just your investment portfolio, you know, exposure to software, et cetera? This is just a topic that we're beginning to get a lot more questions on, and it's very theoretical, hard to answer, but would be interesting in your take.
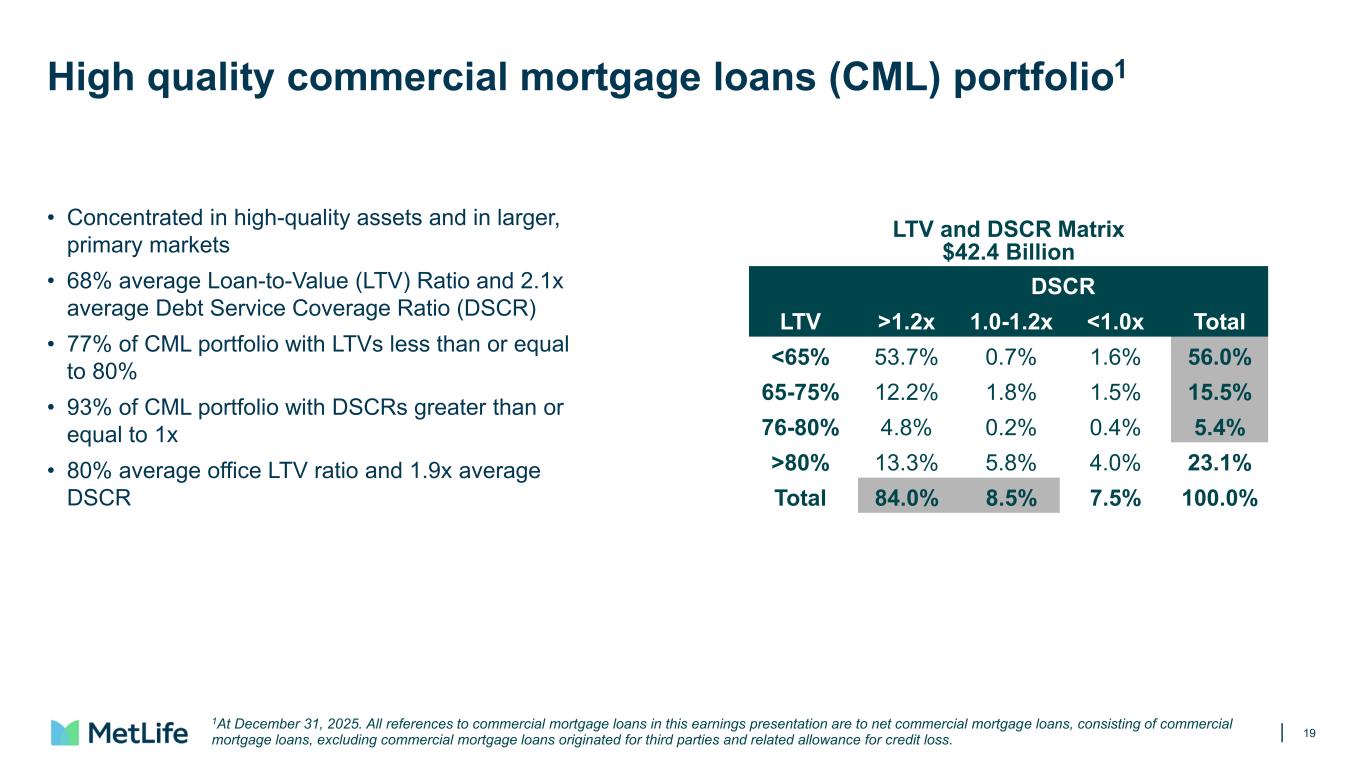
Good morning, Alex. Maybe I'll just start. I mean, look, I think, you know, one of the things that we pride ourselves in, and not just in the investment portfolio, but across our firm is, and we've referenced this quite a bit at Investor Day, is diversification. And whether that's diversification geographically, we have diversification in types of businesses. So we have, you know, healthy balance sheet businesses, and then we have very healthy capital light businesses across the globe. On top of that, we have different risk profiles. And then if you go to the investment portfolio, I think it's fair to say, and we've seen other numbers of internal analyses that kind of prove it, we're probably the most diversified across the industry in terms of our approach. We're able to do that because we have a fully scaled global asset manager where we are, you know, because some people, if you say diversified, you'd say, well, how do you stay close? We're able to stay close to every credit that we underwrite and monitor because we have scale. So we're able to do this because of our scale and our competitive advantages. And, you know, when it comes to the software point that you referenced, at the end of the day, you know, there's a variety of different cycles out there. This is probably in places where I think in the industry we're probably not that exposed, just given our approach to kind of investment-grade oriented investing. So we've seen it. I'm not so sure, you know, we really weigh in too much here because we don't think it's that much of an exposure to the industry or us.
Operator
And that is all the time we have for questions today. I will now turn the conference back over to John Hall for closing remarks.
Thanks, everybody, for joining us today, and have a good day.
Operator
This concludes today's conference call. Thank you for your participation. You may now disconnect.