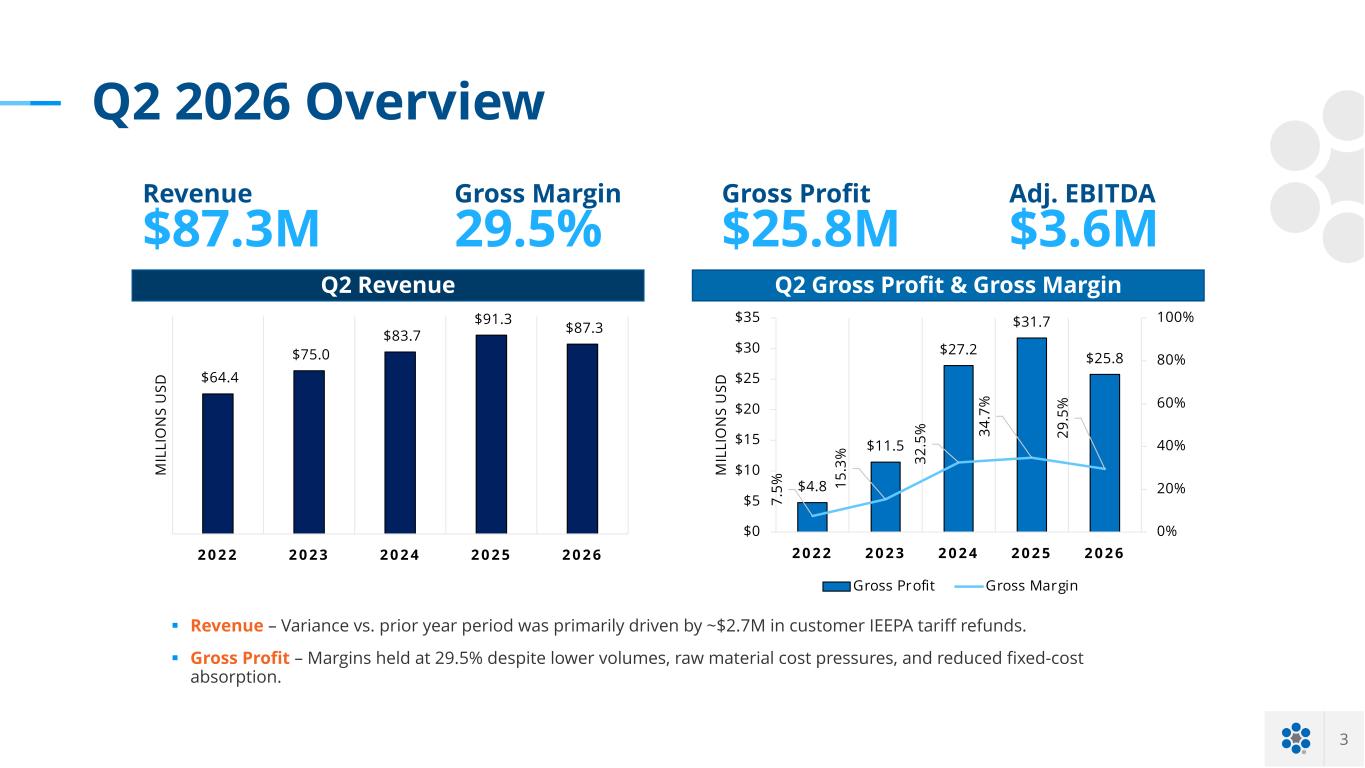
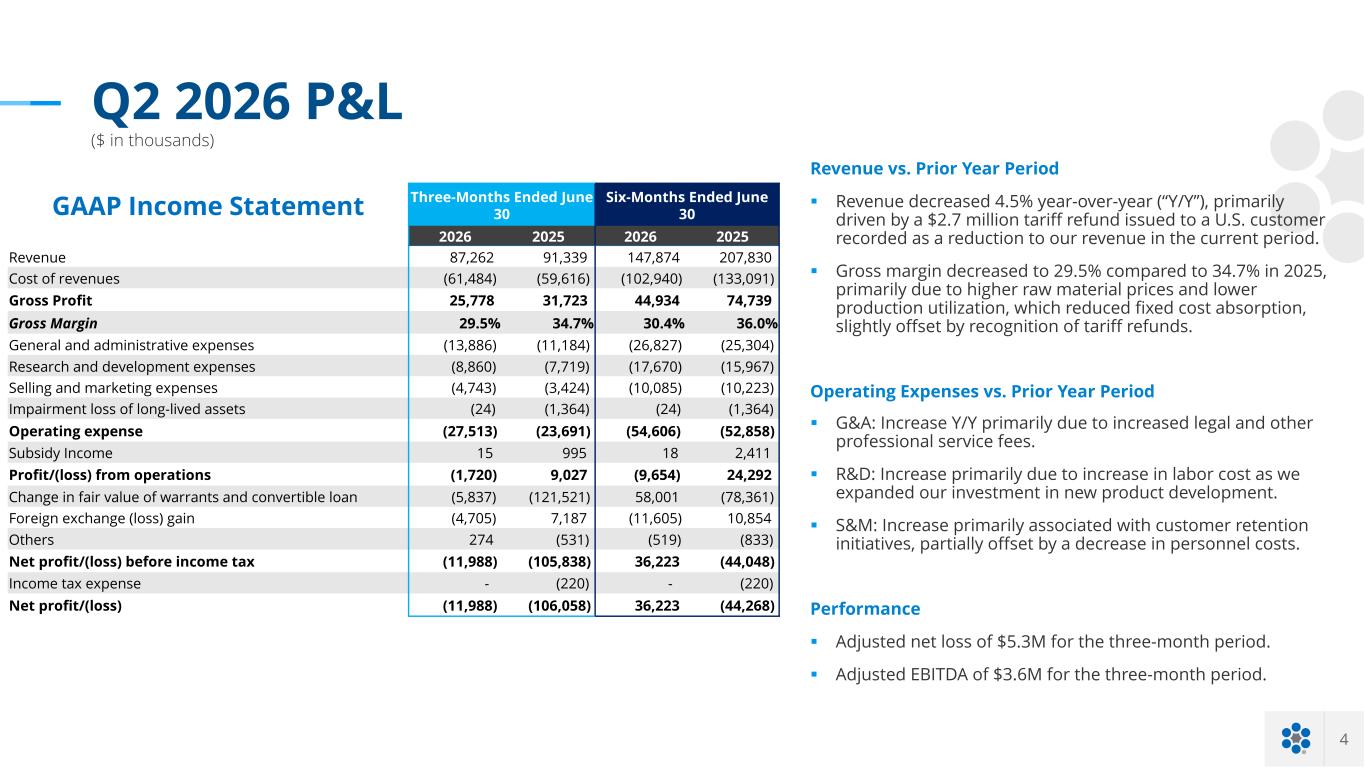
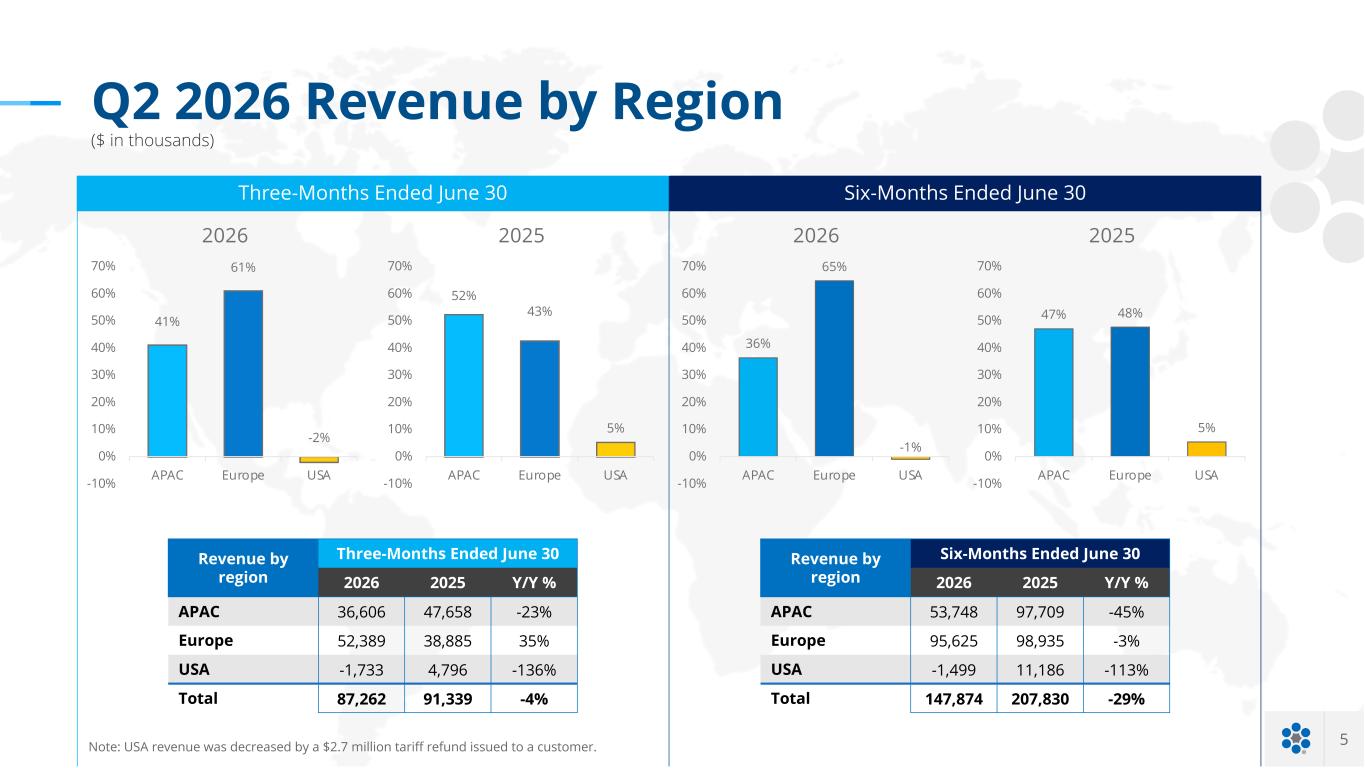
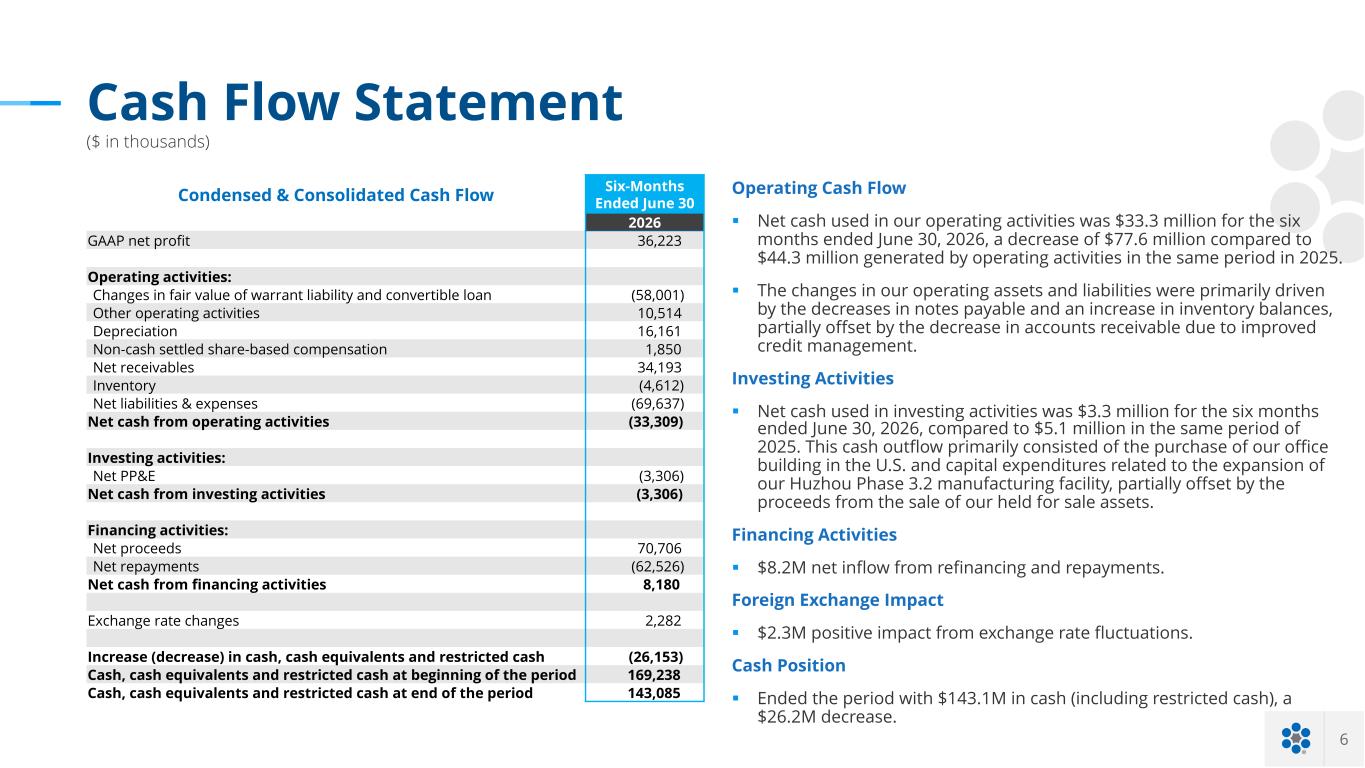
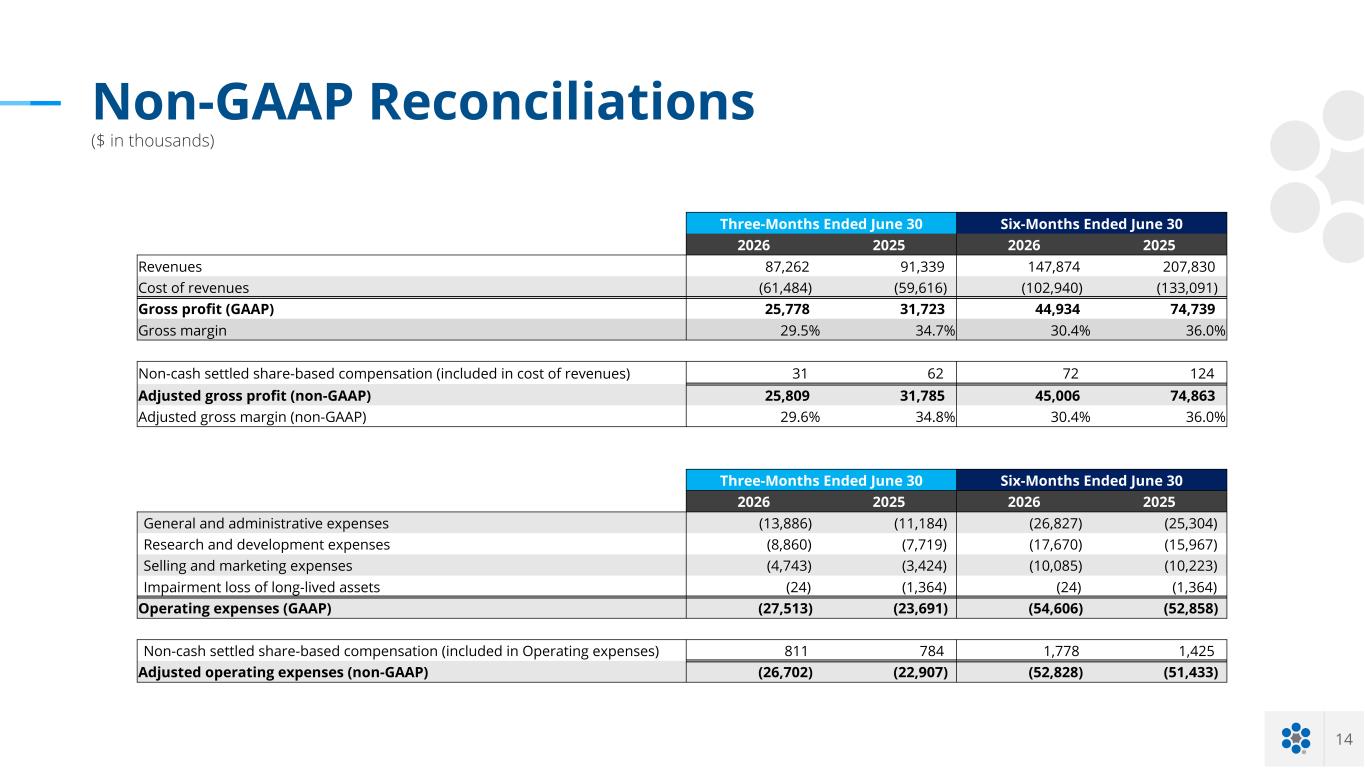
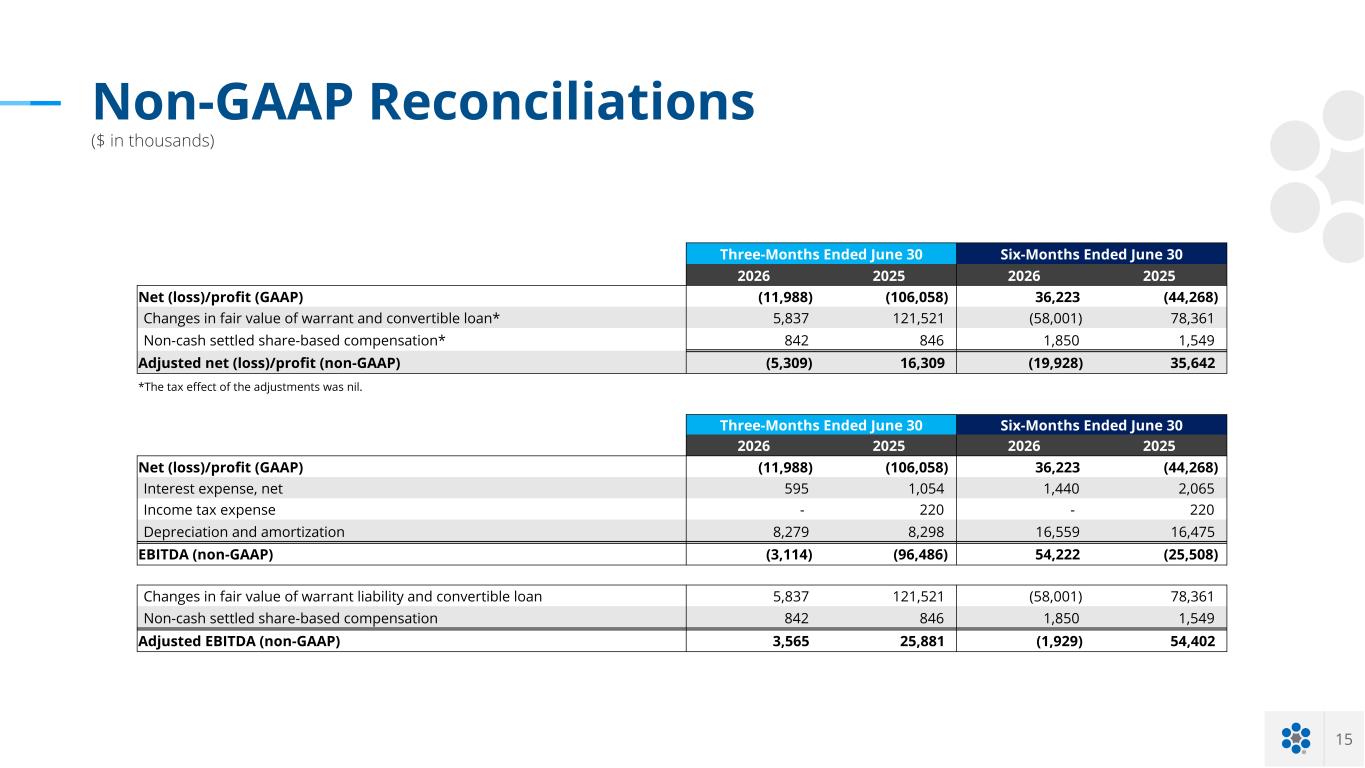
Thank you, operator, and thank you everyone for joining our update today. This is Rodney Worthen, Chief Financial Officer of MicroVest, and with me on today's call is Mr. Yang Wu, founder, chairman, and Chief Executive Officer of MicroVest. I will start off with a review of the second quarter results before handing it to Mr. Wu to provide some operational and business updates. Ahead of this call, MicroVast issued its second quarter earnings press release, which can be found on the Investor Relations section of our website, ir.microvast.com. We have also posted a slide presentation to accompany management's prepared remarks for today's call. As a reminder, please note that this call may include forward-looking statements. These statements are based on current expectations and assumptions and should not be relied upon as representative of our views for subsequent dates. We undertake no obligation to revise or release the results of any revision to these forward-looking statements due to new information or future events. Actual results may differ materially from expectations due to a variety of risks and uncertainties. For more information on material risks and other important factors that could affect our financial results, please refer to our filings with the SEC. We may also discuss non-GAAP financial measures during this call. These measures should be considered in addition to, and not as a substitute for, or in isolation from, GAAP results. These non-GAAP measures have been reconciled to the most directly comparable GAAP metrics in the tables included at the end of our earnings press release and this slide presentation. After the conclusion of this call, a webcast replay will be available on the Investor Relations section of MicroBath's website. Please join me on slide three, which details results for the second quarter over the past several years. Our revenue for the quarter was $87.3 million, a decrease of $4.1 million, or 4.5%, compared to the same period in 2025. The decrease was primarily driven by a $2.7 million tariff refund issued to a customer, which was recorded as a reduction to our revenue in the current period. Gross profit for the second quarter was $25.8 million, with a gross margin of 29.5%, compared to 34.7% in Q2 2025. The decrease in gross margin was primarily due to higher raw material prices and lower production utilization, which reduced fixed cost absorption, slightly offset by recognition of the tariff refunds. Turn to slide four to view our P&L for the quarter and year to date. Let's jump to the operating expenses, which increased to $27.5 million for the quarter compared to $23.7 million in 2025, a 16.1% increase year over year. General and administrative expenses for the three months increased by $2.7 million, or 24.2%, compared to the same period in 2025. This increase was primarily due to $2.6 million increase in legal and other professional service fees. Research and development expenses for the second quarter increased by 1.1 million or 14.8 percent compared to the same period in 2025. The increase is primarily due to increase in labor costs as we expanded our investment in new product development. Selling and marketing expenses for the three months increased by 1.3 million or 38.5 percent compared to the same period in 2025. This increase is primarily due to 1.5 million increase in service fees associated with customer retention initiatives partially offset by a decrease in personnel costs. We reported a GAAP net loss of $12 million in the quarter. After adjusting for non-cash expenses, such as stock-based compensation expense of $0.8 million and fair value changes of our warrant liability and convertible loan of $5.8 million, we reported an adjusted net loss of $5.3 million compared to an adjusted net profit of $16.3 million last year. Non-GAAP adjusted EBITDA was $3.6 million in Q2-2026 compared to non-GAAP-adjusted EBITDA at $25.9 million, Q2, 2025. For the six-month period, revenue decreased by $60 million, or 28.8%, compared to the same period in 2025. The decrease was primarily driven by a 24.3% reduction in sales volumes from approximately 947 MWh in 2025 to approximately 717 MWh for the same period in 2026, and a $2.7 million tariff refund issued to a customer, which was recorded as a reduction to our revenue in the current period. Gross profit margin was 30.4% for the six months, compared to 36% in 2025. Decrease in gross margin was primarily due to higher raw material prices and lower production utilization, which reduced our fixed cost absorption, slightly offset by recognition of the tariff refunds. Operating expenses increased to $54.6 million for the year-to-date period, compared to $52.9 million in 2025, a 3.3% increase year-over-year. General and administrative expenses for the six months increased by $1.5 million, or 6%, compared to the same period in 2025. This increase is primarily due to a $4 million increase in legal and other professional service fees, partially offset by a $3.1 million decrease in allowance for credit loss due to improved credit management. Research and development expenses for the six months increased by $1.7 million, or 10.7%, compared to the same period in 2025. The increase was primarily due to a $1.4 million increase in labor costs as it expands our investment in new product development. Selling and marketing expenses of the six months decreased by $138,000, which was stable compared to the same period in 2025. We reported a GAAP net profit of $36.2 million for the six-month period. For the six months, non-GAAP adjusted net loss was $19.9 million, compared to non-GAAP adjusted net profit of $35.6 million in the prior year period. Non-GAAP adjusted EBITDA of negative $1.9 million in the six-month period compared to non-GAAP adjusted EBITDA of $54.4 million in the prior year. Reconciliation is needed to be non-GAAP metrics. The most comparable GAAP metrics are included in the table at the end of this presentation in our earnings press release. Please turn to slide five while we review our revenue by region. U.S. sales decreased year-over-year, primarily driven by both a $2.7 million tariff refund issued to a U.S. customer recorded as a reduction to our revenue in the current period, and by our largest customer bringing the product into 2025 due to uncertainty around the tariff outcomes. Before the revenue reduction of the tariff refunds, a total of $0.9 million and $1.2 million revenue was realized for the three and six-month periods, respectively. European sales increased 35% in the quarter compared to prior year period. The region accounted for 61% of quarterly revenue, up from 43% last year. Year-to-date sales were down 3% impacted by customer platform rollout delays in the previous quarter. APAC sales declined 23% in the quarter compared to the prior year period, with year-to-date sales down 45%. The reduced sales performance in APAC is primarily due to shifting regulatory and geopolitical dynamics and a demand shift towards lower-cost products in India. Now turning to slide six, we'll walk through our cash flow performance for the year. Net cash used in our operating activities is $33.3 million for the six months in June 30th, 2026, a decrease of $77.6 million compared to $44.3 million generated by operating activities in the same period in 2025. This change is primarily due to $60.6 million reduction in net income after adjusting for non-cash items and a $17 million net change in operating assets and liabilities. The changes in our operating assets and liabilities are primarily driven by a decrease in Exxon notes payable and an increase in inventory balances, partially offset by a decrease in accounts available due to improved credit management. Net cash used in investing activities was $3.3 million for the six months into June 30, 2026, compared to $5.1 million in the same period of 2025. This cash outflow primarily consisted of the purchase of our office building in the U.S. and capital expenditures related to the expansion of our Hujo Phase 3.2 manufacturing facility, partially offset by the proceeds from the sale of our Held-for-Sale assets. Net cash generated by financing activities was $8.2 million for the six months, an increase of $15 million compared to $6.8 million used in the same period of 2025. The increase primarily due to $9.8 million increase in proceeds from bank borrowings, $7.4 million decreased in deferred payments related to purchases of property, plant, and equipment, as the majority of them were settled during the first quarter of 2026. This was partially offset by a $4.6 million increase in repayments of bank borrowings. After accounting for foreign exchange adjustment of $2.3 million, our cash decreased by $26.2 million, and we ended the quarter with cash equivalents and restricted cash of $143.1 million. Now, I'll hand it over to Mr. Wu to go over some operational and business updates.
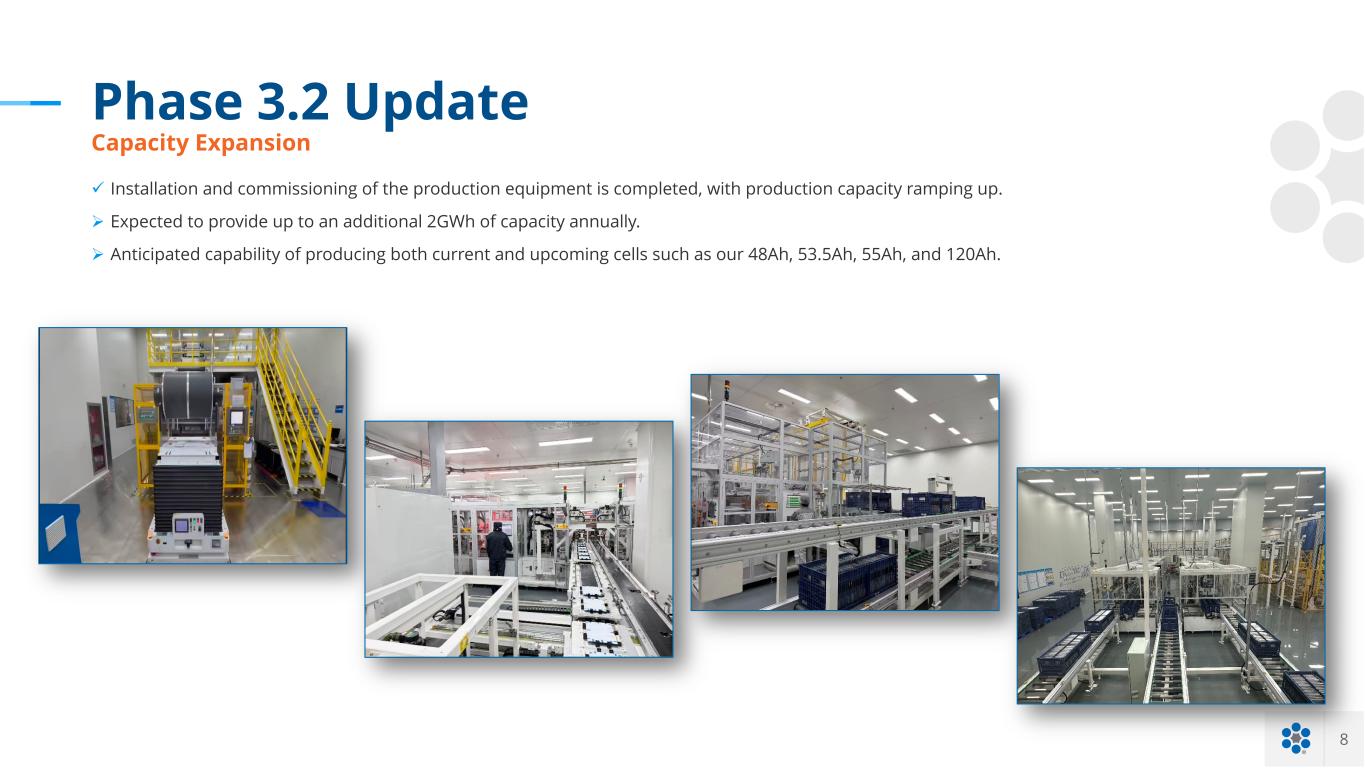
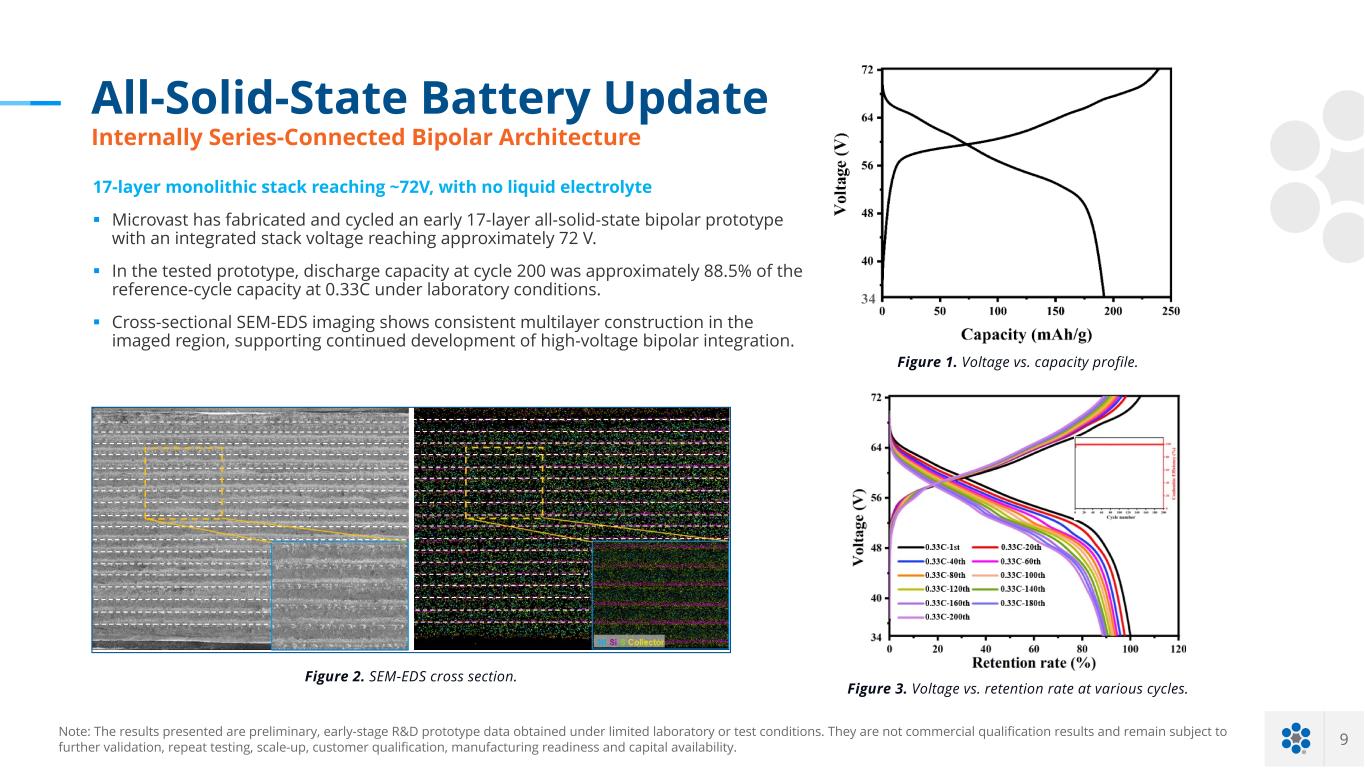
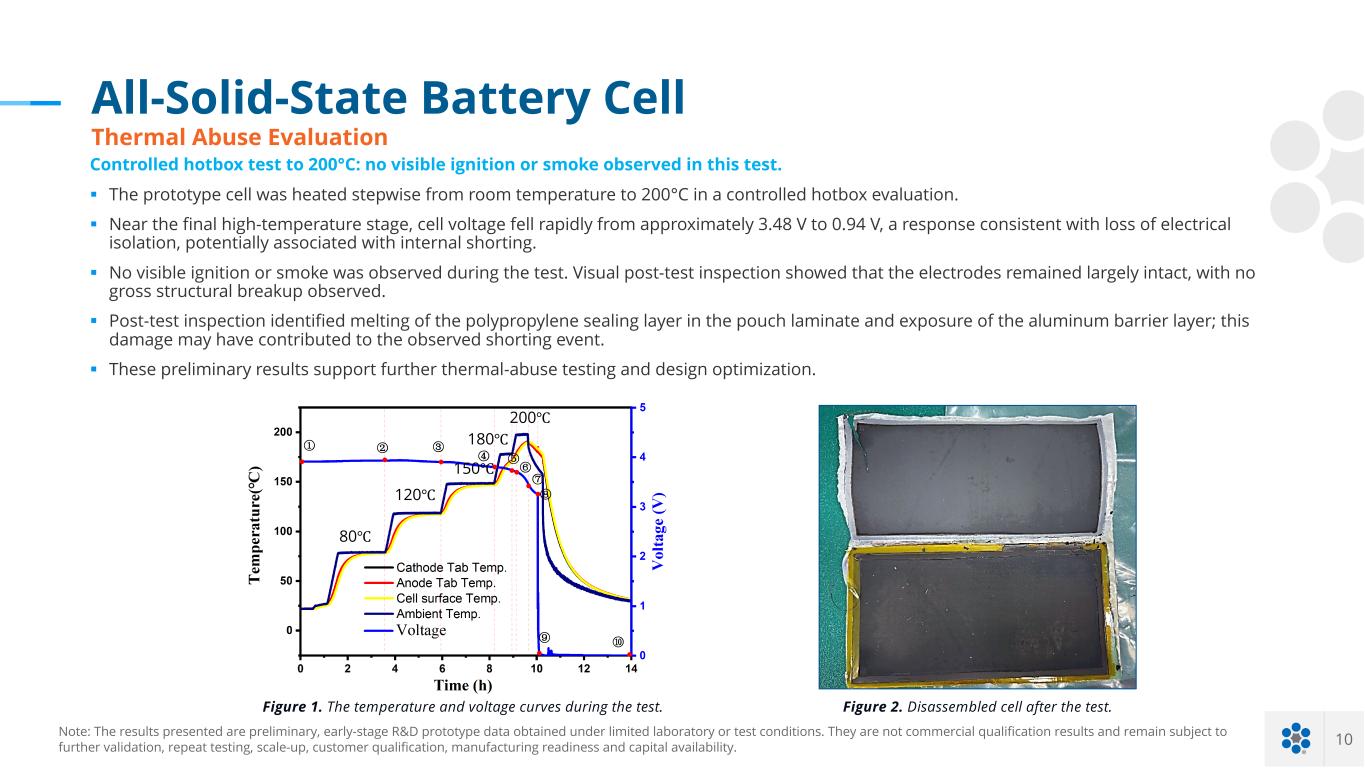
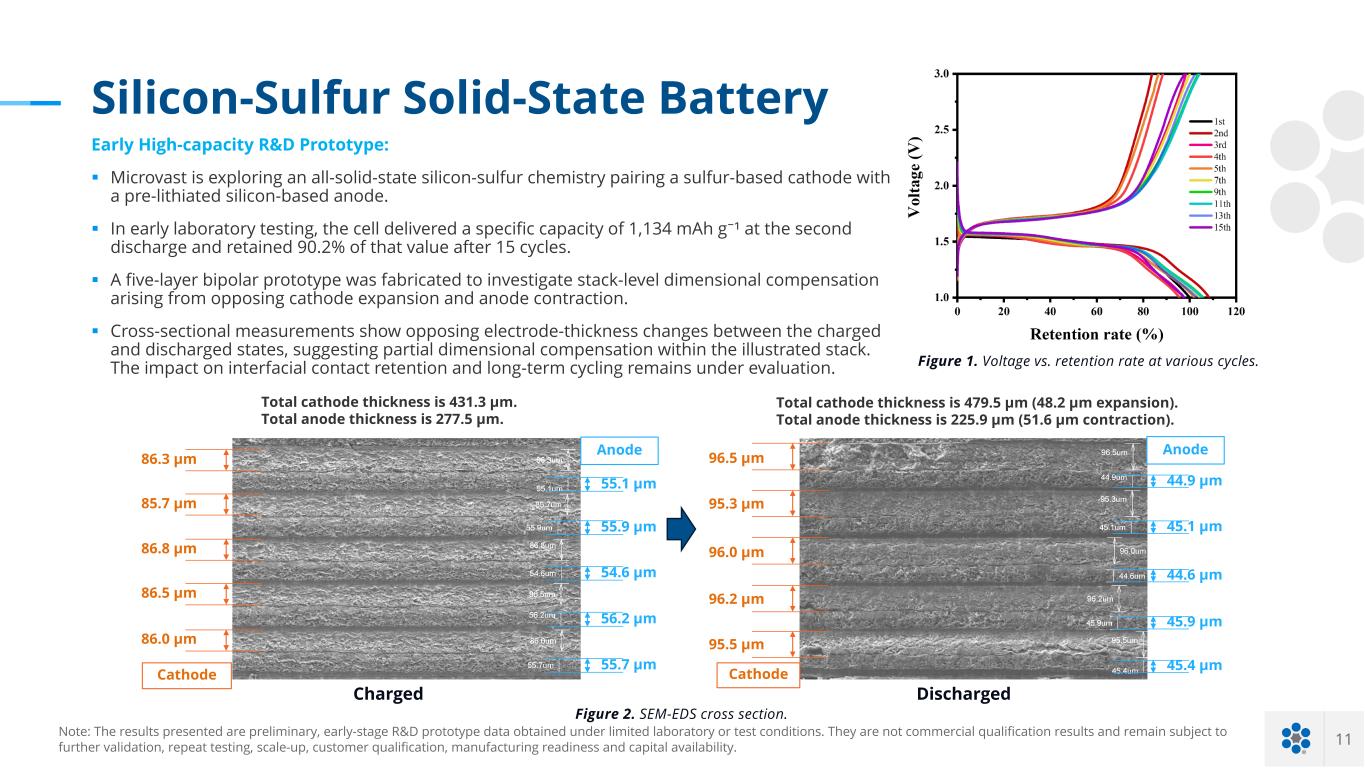
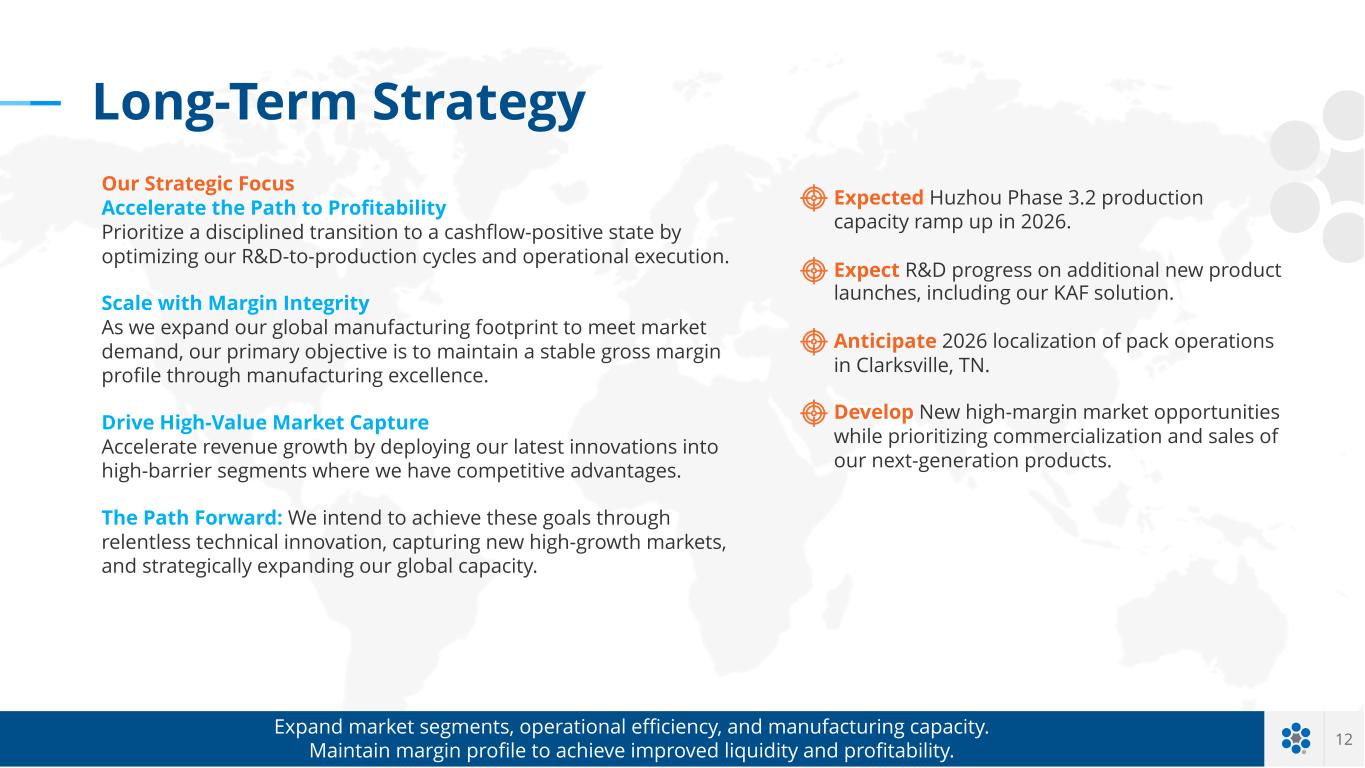
Hello, everyone. Thank you for joining us today. Please join me on slide 8 for a quick operational update on our Huzo Phase 3.2 extension. Installation and commissioning of the production equipment is completed. With production capacity ramping up, we expect the SOP in 2026 and Phase 3.2 is expected to add up to 2 gigawatt-hour of annual production capacity and anticipated to be modular across our large battery cell platform. Next, I'd like to go over some of our latest updates in research and development. Please join me on slide 9. We have reached the next milestone with our development stage series connected bipolar cell architecture. Under laboratory test condition, we have successfully scaled to a 17-layer monolithic stack that delivers approximately 72 volts with zero liquid electrolyte. In extended testing, this prototype demonstrated the durability, retaining approximately 88.5% of its capacity after 200 cycles at 0.33c. Cross-sectional SEM imaging confirms a uniform multilayer construction, validating the stability of our high-voltage solid-state platform. By delivering 72 volts, this architecture is primarily focused on robotics. Our design has the potential to eliminate heavy interconnects and electronics typically required to drive high-torque robotic motors. Eliminating liquid electrolyte has the potential to provide better thermal safety for human-robot environments, while the compact monolithic design is intended to allow seamless integration into space-constrained robotic frame limbs and autonomous mobile platforms slide 10 displays the safety is the core differentiator of our solid state program in controlled hotbox testing up to 200 degree Our prototype cell exhibited exceptional thermal stability with no ignition or smoke observed throughout the test. Even following a high-temperature internal shock event, post-test disassembly showed the internal electrode structure remained large intact, demonstrating the significant safety potential of eliminating liquid electrolytes. And finally, on slide 11, we are seeking to expand our long-term technology platform by exploring ultra-high-capacity chemistries, including an all-solid-state silicon sulfur cell pairing a sulfur cathode with a silicon anode. Early laboratory prototypes achieved the initial specific capacity of over 1,000 mAh per gram, retaining over 90% capacity after 15 cycles. Crucially, our five-layer bipolar design utilizes simultaneous castle expansion and anode contraction to self-compensate for volume change during cycling. mitigation, mitigating contact loss, and opening new paths for high-energy density storage. As illustrated in the SEM core sections, during cycling, the 48-micron expansion of the cathode is closely offset by a 52-micron contraction of the anode. This internal strain neutralization maintains continuous physical contact across solid interfaces without requiring heavy external compression hardware. For targeted applications like commercial and defense drones, eliminating external pressure fixtures while maximizing gravimetric energy density can potentially translate directly into extended flight endurance. higher payload capacity, and a seamless integration into lightweight airframes. Stay tuned for additional developments. Please turn to slide 12. As we transition into second half of 2026, our strategic priorities remain clear. Accelerating our path to profitability, scaling with margin discipline, and expanding in high-barrier-heavy industry and transit markets. We are titling operational execution to streamline the transition from R&D to production, protecting our growth margins, and seeking to deploy targeted innovations like our CAF electric powertrain to ensure high-margin customer commitments. Operationally, Huzo Phase 3.2 remains our central catalyst of 2026, with equipment commissioning progressing toward the serial production later this year to support next generation cell demand. Domestically, pack line assembly in Clarksville, Tennessee, remains on schedule for initial output by year end. While four-scale battery plant construction at the site remains contingent on securing additional financing or strategic partnerships, overall, our team continues to navigate the global market environment, and we remain focused on executing our milestones to drive long-term shareholder value. Thank you for your continued support. We look forward to sharing further updates in the months ahead.