Operator
Hello, everyone. Thank you for joining us and welcome to the NextPoint Residential Trust Q2 2026 earnings call. After today's prepared remarks, we will host a question and answer session. If you would like to ask a question, please press star 1 to raise your hand. To withdraw your question, press star 1 again. I will now hand the conference over to Kristen Griffith, Investor Relations. Kristen, please go ahead.
Thank you. Good day, everyone, and welcome to Next Point Residential Trust conference call to review the company's results for the second quarter in the June 30th, 2026. On the call today are Paul Richards, Executive Vice President and Chief Financial Officer, Matt McGriner, Executive Vice President and Chief Investment Officer, and Bonner McDermott, Vice President, Asset and Investment Management. As a reminder, this call being webcast through the company's website at nsrt.nextcoin.com. Before we begin, I would like to remind everyone that this conference call contains forward-looking statements within the meaning of the Private Securities Litigation Reform Act of 1995 that are based on management's current expectations, assumptions, and beliefs. Listeners should not place undue reliance on any forward-looking statements and are encouraged to review the company's most recent annual report on form 10k and the company's other filings with the sec for a more complete discussion of risk and other factors that could affect any forward-looking statements if statements made during this conference call speak only as of today's date and accept as required by law and expertise does not undertake any obligation to publicly update or revise any forward-looking statements this conference call also includes an analysis of non-GAAP financial measures. For a more complete discussion of these non-GAAP financial measures, see the company's earnings release that was filed earlier today. I would now like to turn the call over to Paul Richards. Please go ahead, Paul.
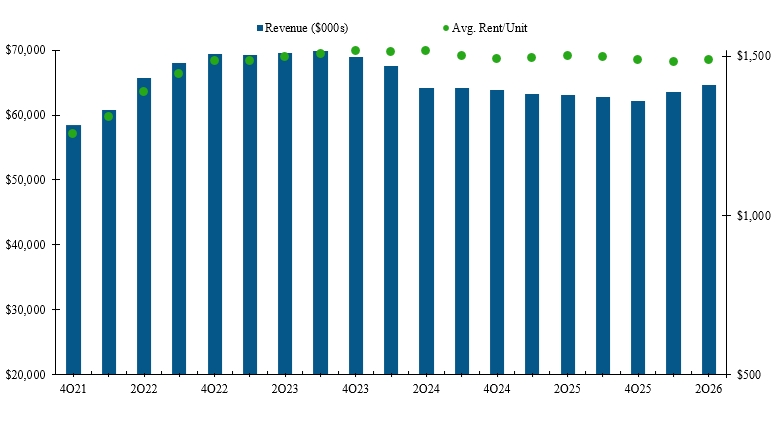
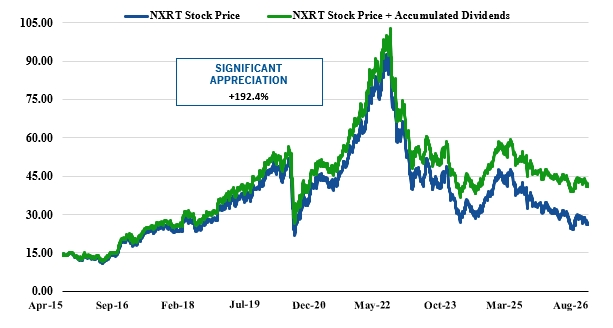
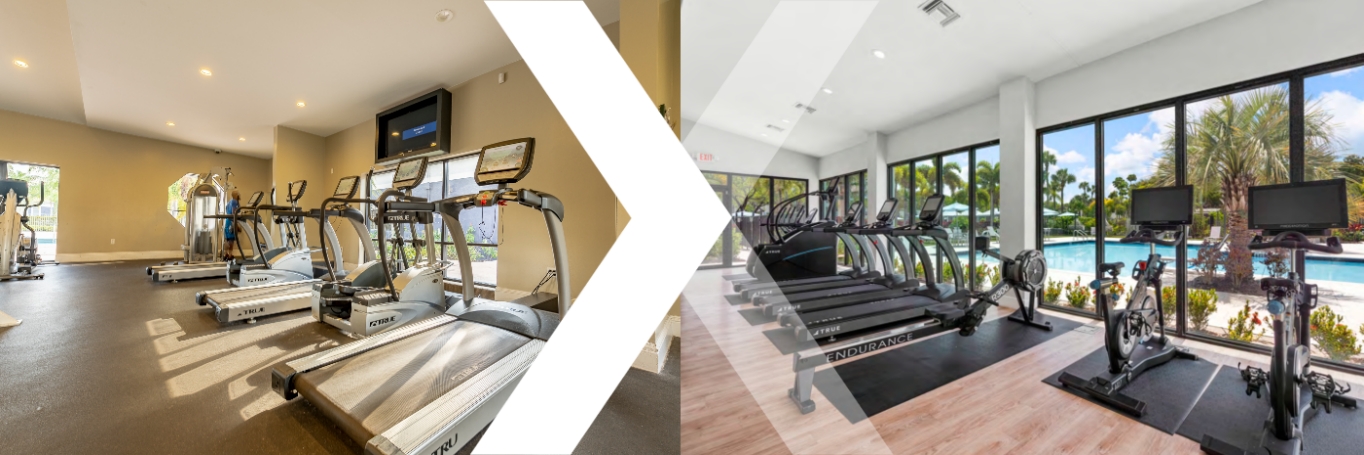
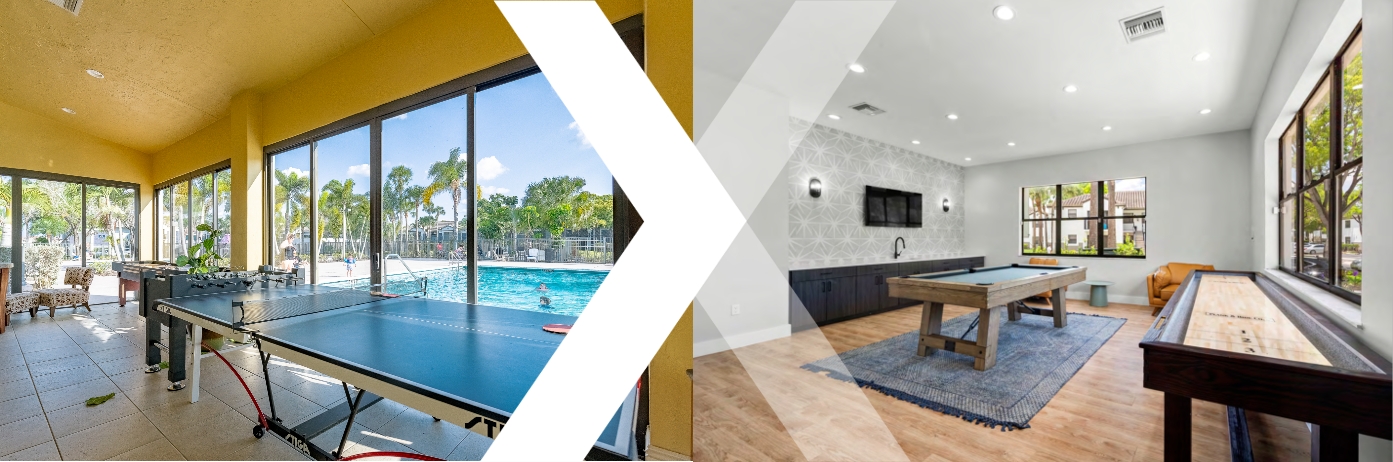
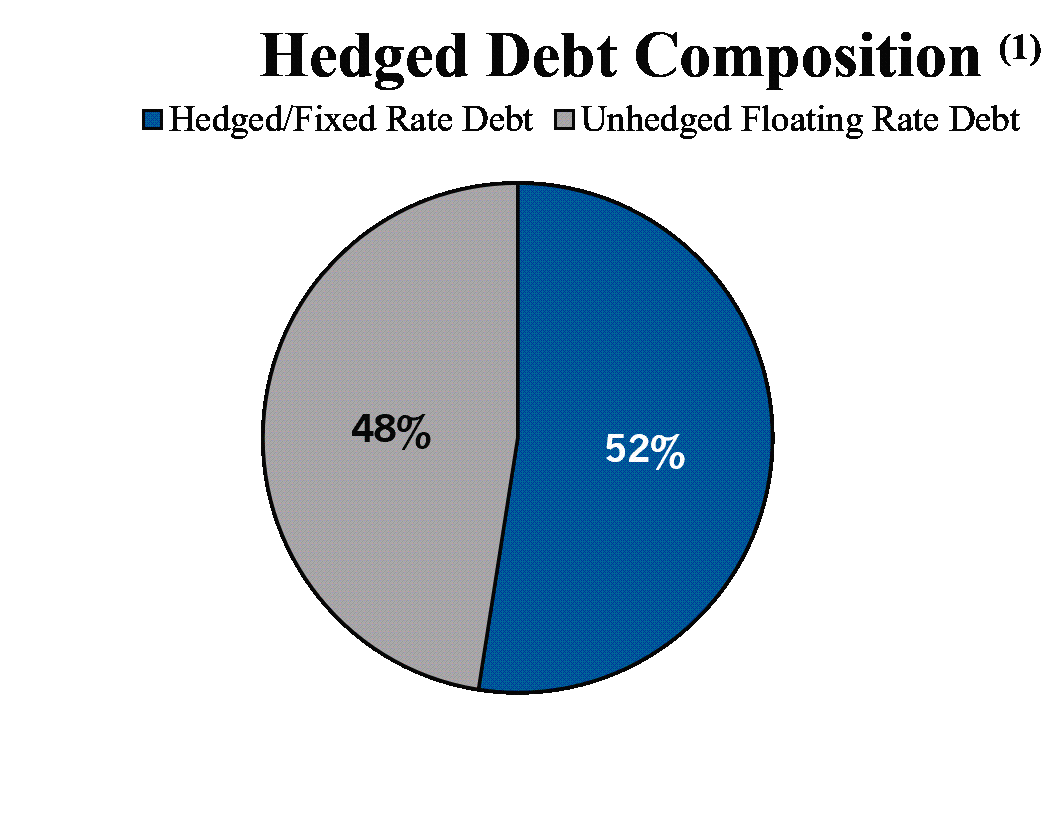
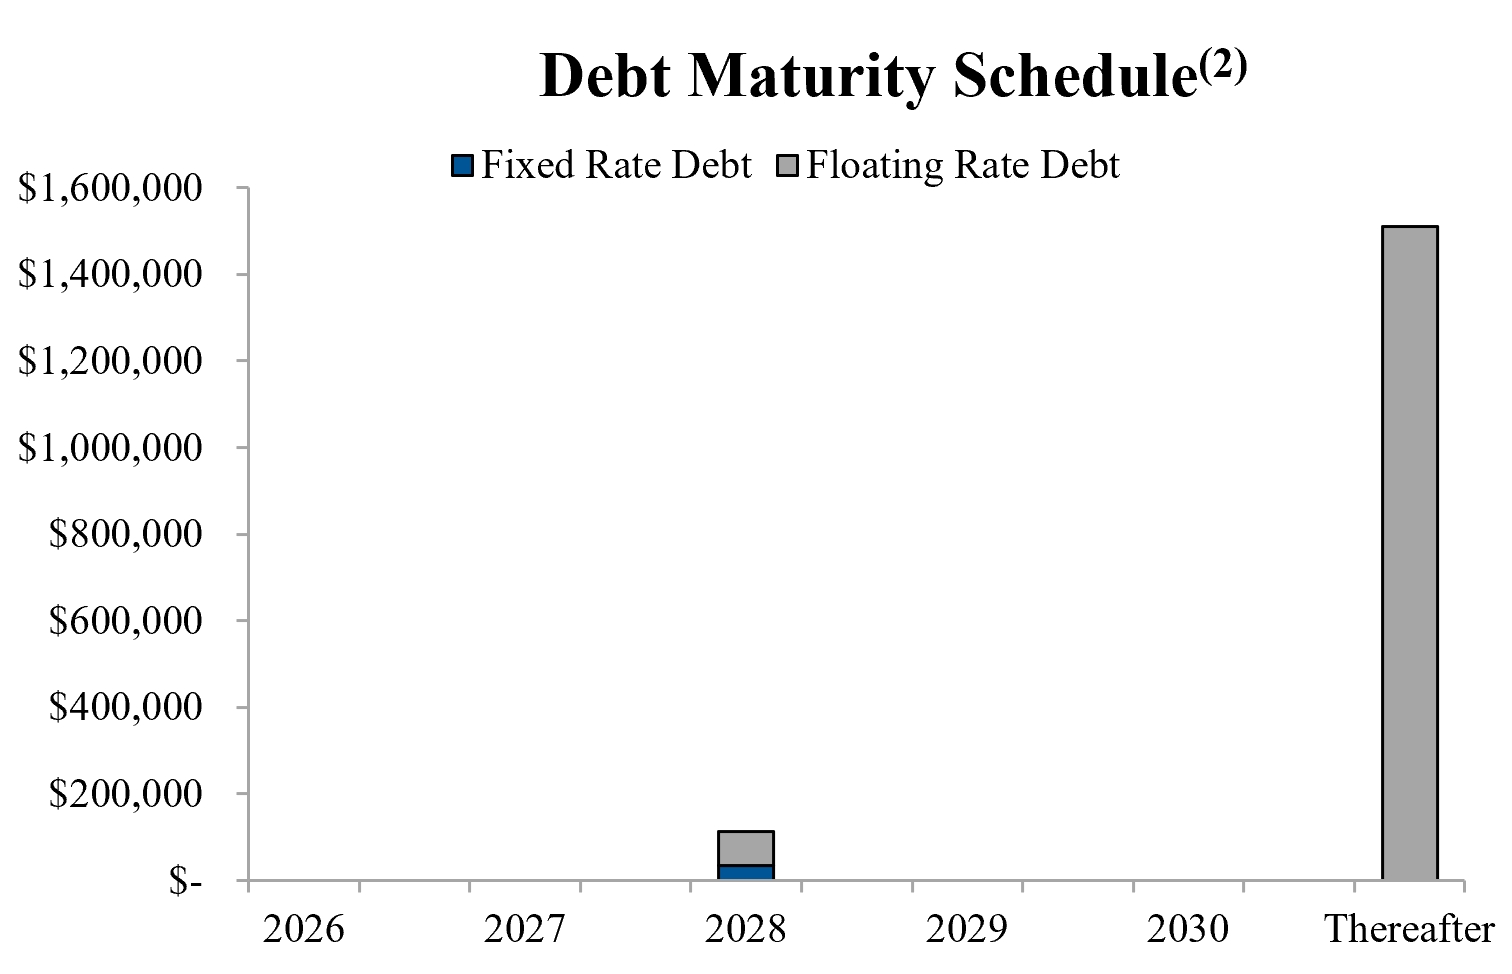
Thank you, Kristen, and welcome, everyone. We appreciate you joining us this morning. I'll take you through our second quarter results and the changes we're making for a full-year outlook, and then Matt will cover the operating environment, our leasing trajectory, the technology platform, and how the portfolio is positioned. In April, we affirmed our full year guidance. This morning, we are lowering it to a core FFO midpoint of $2.45 per share, down 12 cents from $2.57. I'll explain what drove the change and what has and has not changed. In short, most of the reduction is from higher interest rate expense, reflecting an upward shift in the forward curve since our last update. A smaller portion reflects a slower same-store revenue rebound, which affects the full year. Importantly, our operating trajectory continues to improve month by month. Given recent macro shifts and clear visibility into Q3 operating performance, we believe this is the right time to update our forecast. Q2 2026 results. Second quarter core FFO was $16.9 million or $0.66 per diluted share, a penny ahead of consensus. That compared to $18 million or $0.71 a year ago, FFO was $15.2 million, or 60 cents per share, and AFFO was 19.7 million, or 77 cents per share. Total NOI was 37.9 million across our 36 properties, essentially flat with last year. Net loss for the quarter was 8.6 million, or 34 cents per diluted share, which includes 23.9 million of depreciation and amortization. That compares to a net loss of 7 million, or 28 cents per share, in the second quarter of 2025. Toll revenue was $64.6 million, up from $63.1 million a year ago, as Setona came online and into the numbers. On a same-store basis, 35 properties, which is about 98 percent of our units, toll revenue was $62.4 million, down 0.6 percent, and same-store NOI was $36.9 million, down 2.9 percent. Same-store occupancy closed the quarter at 93.6 percent, up 30 basis points from a year ago and the average effective rent was $1,487 down 80 basis points. One point on the first half of the year before I get into guidance. It came in about where we expected on that. The company earned 68 cents in the first quarter and 66 cents in the second, which equates to $1.34 through June, each quarter a little ahead of the street. The revision today is almost entirely about the back half and is driven mostly by interest expense as our swap protection steps down, which I'll run through now. interest expense and hedging we've mentioned since our initial guidance that 2026 carries a world interest rate interest expense headwind as certain swap positions roll off and the step down lands in the second half q2 interest expense was 15.8 million versus 15.2 million a year ago what's changed since april is the rate curve the fourth silver has moved higher roughly 30 basis points in the third quarter and 72 basis points in the fourth relative to our assumptions in practical terms that's about 14.6 million fewer projected swap inflows over the rest of the year or roughly 16 cents per share of additional interest expense it's the single largest piece of today's revision for your 2026 interest expense is now projected at approximately 71.2 million up there up from roughly 69 million discussed last quarter and 67 million in the original model one timing note the The Federal Reserve met last week and held its benchmark rate at 3.5% to 3.75%, with a few members dissenting in favor of a hike. Interest rate swaps currently fix the rate on 817.5 million, or approximately 51.5% of our floating rate mortgage debt, and we have full visibility into the maturity schedule. The bulk of that protection, approximately 717.5 million, at a weighted average fixed rate near 1.1392%, rolls off in September. We have the ability to layer in more protection, and we'll do it when the risk-adjusted economics makes sense. Second, on the affirmation, in April, we mentioned the offsets we identified neutralized this headwind, and we affirmed. The curve then moved against us more than we assumed, and a handful of markets' revenue production came in softer than we modeled. Rather than lean on offsets to hold that number, we're resetting to a level we're confident we can deliver. I'll walk through the bridge in a minute. Moving on to expense detail. The expense side is where we're picking up real ground. We're lowering our full-year same-store expense growth outlook by 140 basis points to about 2.1% at the midpoint from 3.5% originally. It's broad-based. Every market in the portfolio is now guiding to lower expense growth than we assumed at the start of the year. Led by real estate taxes, insurance, and continued payroll discipline from the centralized operating model Matt was described. Our April insurance renewal, which came in more than 30% year-over-year, is now fully in the run rate. Let me put some numbers on the quarter itself. Same-store operating expenses were up 2.4% year-over-year, and the mix is favorable where it counts most. Real estate taxes were down 3.5%. Insurance was down 11.7% on the April renewal. And payroll was down 1%, with property management fees and office operations each down about 1%. The pressure sat in two lines. Repair and maintenance of 13.9% and marketing of 38.2% off a small base where we leaned into lead generation at properties below target occupancy. Utilities were up 6.1%. The repair and maintenance increase is concentrated rather than broad, and we treat that as episodic rather than a change in our underlying cost base. net controllables held roughly in line while our two largest non-controllables real estate taxes insurance came down which is what underpins the improved full-year expense outlook one important note regarding the elevated R&M cost we aggregate resident amenity services including bulk fiber into total here the resident amenity services subcategory drives 83 percent of total R&M growth and it's concentrated in the four markets undergoing a fiber build-out Atlanta, Nashville, Phoenix, and South Florida. We see a corresponding offset to these expense increases within the resident amenity fee subcategory of other income, which is a significant driver of the 29.2 other income growth for the quarter. A value-add update. During the second quarter, we completed 459 full and partial upgrades and at least 258 upgraded units at an average monthly rent premium of $89 and a 23% return. Since inception, for the properties currently in the portfolio, we've completed 10,474 full and partial interior upgrades, over 5,100 kitchen and laundry packages, and roughly 11,200 tech packages, generating average monthly rent increases of $152,000, $50,000, and $43,000 per unit at returns of 20.7%, 63.4%, and 37.2% respectively. This is still one of the most reliable, capital-efficient sources of growth we have moving on to the dividend for the second quarter we declared a dividend of 53 cents per share payable september 30th since inception we've raised the dividend 157.3 percent as of june 30th total indebtedness was approximately 1.6 billion and an adjusted weighted average interest rate of approximately 3.58 percent we held approximately 14.6 million of unrestricted cash on 118.9 million of undrawn capacity on the credit facility for a total available liquidity of approximately $133.5 million. We have no scheduled debt maturities until 2028, which consists of only a small $33 million fixed rate loan. Net leverage is about 57% of our internal lab estimate, and deleveraging over the medium term, funded mainly through disposition proceeds, remains a priority. Our estimated net asset value at the quarter ended is $46.76 per diluted share at the midpoint, using a cap rate range of 5.25 to 5.75 quarters across the portfolio. The rate runs $40.35 at the high end and $53.16 at the low end. At a recent price of $25.91, the stock trades at more than 40% discount to that midpoint. Even at the most conservative end of our range, it's meaningful discount to estimated liquidation value. We think the gap between where the stock trades and what the real estate is worth is significant and our capital recycling and buyback tools give us a way to close that. 2026 guidance revised. I'll now walk through the revised guidance by component. We're lowering full year 2026 core fulfill guidance to a range of $2.35 to $2.54 per diluted share at a midpoint of $2.45 down from a prior midpoint of $2.57. We're lowering same store NOI guidance to a range of negative 2.5% to 0.5% at a midpoint of negative 1% from a prior midpoint of negative 0.5%. The components of the bridge from $2.57 to $2.45 in five pieces are as follows. Interest expense down 16 cents. Again, the forward curve move described before. We have about $14.6 million of fewer projected swap inflows, the largest single driver. Same store revenue down nine cents. We're taking full year same store revenue growth down about 90 basis points to roughly 0.2% at the midpoint. It's concentrated. Matt has the market detail with Nashville accounting for most of the same store NOI reduction. Same store expense up six cents. The 140 basis point improvement I recently walked to for about 2.1%. Fourth component is interest income up five cents. Realized income from bridge lending investments tied to Waterford DST transaction, which Matt will put in context. And lastly, corporate G&A and other up two cents, favorable G&A management. That nets a 12-cent reduction to $2.45. A brief word on where the same-store cut sits. Because it's concentrated rather than broad, Nashville is about 85% of the same-store NOI reduction. Software revenue combined with the steepest same-store expense growth in the portfolio, near 15%. So there's a little expense cushion there. Four markets are guiding to better same-store NOI than we assume to the start of the year, South Florida, Atlanta, Phoenix, and Raleigh-Durham, and Dallas is a good example of the expense discipline at work. Roughly 590,000 revenue reduction was almost entirely offset by about 505,000 of expense savings, so very little drop to NOI. This is a concentrated revision, not a portfolio-wide one. On where this puts us versus street, consensus is about $2.51 with a few more recent estimates closer to two dollars and 40 cents a share our new midpoint is in general agreement with external estimates the first half is in the books ahead of plan the revision is forward-looking larger liberator than reset to the back half our acquisition with disposition assumptions are unchanged at zero to 200 million each 100 million at the midpoint reflecting continued capital recycling within guidance and with that let me turn it to matt all right thank you paul i'll I'll start with the backdrop because the fundamental setup for our portfolio keeps improving.
Starting with supply, national deliveries peak near 700,000 units in 2024, starts are off roughly 70% from the peak, and deliveries this year are tracking to the lowest level in more than a decade, and in our Sunbelt submarkets, the drop-off is steeper still. Two-thirds of our submarkets have less than 2% active annual inventory growth, and more than half have fewer than 500 units under development today. The first half bore that out. Our submarkets absorbed almost 6,000 units in the second quarter against 3,146 units of new supply, net absorption of a positive 2,852 units, and that follows a positive 1,307 in the first quarter. The remaining 2026 supply is real and concentrated. The most meaningful pressure for us is in north charlotte south las vegas in the southern portion of orange county in orlando still the supply cliff remains intact and the backdrop continues to improve we think leading to a clean inflection approaching in late 2026 and into 2027 on demand the structural case hasn't changed and the affordability channel has only gotten more extreme john burns has the premium to own versus rent at 44% against a 17% long run average. Zellman has the entry-level payment gap at its widest since 1984, and move outs to buy a home were 8.7% this quarter, down from 10.9% a year ago. Here's the part I'd underline. On 135 million households, every 50 basis point decline and homeownership rate creates 675,000 renter households, two years of normal absorption from a channel that requires no population growth at all. And on the geography, Zellman's own work has national household growth running at near 70 basis points annually through the end of the decade. Our markets run at roughly twice that. And per Witten advisors, job growth, population, and domestic migration continue to favor the Sun Belt for the balance of the decade. Slower national household formation is a real headwind to the national number. It is not the same input as the one that drives our markets. On to leasing. The leasing cadence is the real story this quarter. Across 1,360 new leases, our new lease tradeout was negative 5%, and across 1,684 renewals, we were positive 1.9% for a blended tradeout of negative 1.16%, roughly 75 basis points better than the first quarter. The month-to-month tells a more encouraging story. Blended tradeouts went from negative 1.7% in April to negative 1.2% in May to negative 50 basis points in June, and it turned positive at about 30 basis points in July. New lease tradeouts, the hardest line, improved from negative 5.4% in April to negative 2.3% in July, roughly 310 basis points, while renewals held above 2%. That is the first positive blended print since early 2025 for us. It is just one month, but encouraging nonetheless. Raleigh was our only market with positive new lease tradeouts in the quarter, and the laggers on the new lease line, Orlando, Charlotte, Dallas, and Nashville, are the same markets carrying the most remaining supply. On the occupancy and revenue front, the same-store portfolio closed at 93.6% physical occupancy, up 30 basis points year-over-year, and flat sequentially, with leased at roughly 95%. Retention was 55.9%, and turnover improved to 44.1% from 46.5%. Same-store total revenue was 62.4 million, down 60 basis points year-over-year. The number I'd point you to is the trajectory in that comparison. We went from a negative 2.2% year-over-year in the first quarter to just negative 60 basis points in the second, 160 basis points improvement in the year-over-year comp in a single quarter. Effective rent was down 80 basis points, a much shallower decline than the new lease line alone would suggest, and that is occupancy and retention discipline doing its job. On bad debt, 60 basis points of gross potential rent against 1.02% in the first quarter of last year, a roughly 40% improvement and a fraction of where we ran before centralization rebuilt our screening process. Rent-to-income ratios remain 20% across the portfolio, a very healthy margin. On to concessions. Two different measures to discuss here. Utilization, the share of new leases taking a month free. we cut that roughly in half from 55.6% in the first quarter to 27.7% in the second quarter. An average week's free fell from two weeks to 1.1 weeks. South Florida drove most of that going from 87.6 utilization to just 4.8% utilization in the second quarter. On cost, concession dollars as a percentage of gross potential rent, we ran at about 1% for the quarter, still slightly above our forecast and use was heaviest in tampa orlando nashville and dallas about a third of the portfolio has no active concession offering today and roughly half are offering selective pricing only on age vacants and specific floor plans we project utilization falls another 50 cent by year end on to our technology platform a lot of what you're seeing in the quarter especially on the expense side comes out of the technology work we've laid out during REIT week in June. We run a two-layer model. Property operations go through VH management and their funnel leasing platform. At the advisor level, we're building Next Point Intelligence. That's deliberate. Self-managed peers have to spend across every layer at once, while our model captures a disproportionate share of that benefit at a fraction of the capital. In the quarter, the the platform converted 24,703 leads into 1,321 applications and 1,226 move-ins, a 5.3% lead to application rate, and a 34.6% tour to application rate. Both improved from the first quarter. Self-guided touring keeps scaling. 26.2% of tours in the quarter were self-guided, and and that's up from 18.7% in the first quarter. And that's after hours demand we otherwise would lose. Quick word on Sedona Mountain, the 321 unit community in North Las Vegas that we bought in December of last year for 73.25 million. The occupancy of the property closed at 92.2% for the quarter of 430 basis points from the first quarter. And NOI is beating budget by almost 5% with expenses 12.2% under forecast. Roof, exterior paint, smart rent, and amenity work are complete, and we're still targeting and on track to generate a 7.2% NOI CAGR through 2029, taking a high five cap rate purchase to a 7.5% to an 8% stabilized yield. On the transaction market and capital allocation, institutional volume remains well below last year, and cap rates have remained sticky, and the bid ask remains wide, with most participants pointing to a 2027 for a clearer recovery and more transaction volume. That said, we've watched well-located Sunbelt assets trade materially tighter than our own implied cap rate, which reinforces the NAV gap all inscribed. our capital allocation priorities are straightforward our job is to close the value gap through operating execution into 2027 recycling capital and buying back stock one item on earnings composition our revised guidance includes about five cents of realized interest income from a bridge lending investment tied to a waterford dst transaction sourced through our advisors platform it's it's a discrete realized deployment of balance sheet capacity earning an accretive market return we're carrying it as as realized income rather than embedding a forward estimate and we'll report it as it happens in closing the first half beat our plan same store revenue improved 160 basis points in its year-over-year comp between the first and second quarters blended lease tradeouts went from a negative 1.7 percent in april to a positive 30 basis points in july occupancy is stable retention is up and expenses are coming in better across every market and supply is rolling over fastest in the markets where we've been most pressured that's what makes the setup compelling 2026 we absorb the rate repricing and the last of the supply 2027 we get to get to the supply cliff and the leasing earn in and the earn in is not a forecast it's math on leases we've already signed we're moving into the best supply demand backdrop in five years and the renter by necessity cohort is only expanding as affordability stays extreme. The fundamental recovery is more certain today than it has been in recent memory. I want to thank everyone here at NextPoint and BH for their hard work and with that, the operator, let's open it up for questions.
Operator
We will now begin the question and answer session. If you would like to ask a question, please press star one to raise your hand. To withdraw your question press star one again we ask that you pick up your handset when asking a question to allow for optimum sound quality if you are muted locally please remember to unmute your device please stand by while we compile the q a roster your first question comes from the line of peter abramowitz with deutsche bank your line is open please go ahead yes thank you for taking the question.
I appreciate it. I just want to go back to Matt. I think you had some comments about the improvements in the operating environment. And I think you used the term, you know, sort of expecting a clean inflection in the second half of the year and into 2027. I guess just wondering how to interpret that. What do you consider sort of a clean inflection as you described it? Is it, you know, positive new lease rates or otherwise?
Just help us frame how you're thinking about that and how it kind of shapes uh uh how you're thinking about the operating environment into into next year yeah i was i was referring to to positive new lease rates um you know our revisions to the guidance uh are are concentrated um really really in four assets uh four or five assets um that make up about 2.2 million dollars of gross um potential rent um revisions. And really those markets were just not as strong as we originally thought. And so as we look forward in the new guidance and what it implies for new leases, we're slightly negative in the third quarter and then modeling slightly positive in the fourth quarter. And that's the quarter that I think we feel the best about of the year. And that kind of clean inflection is the positive new lease pricing that's implied in that guidance.
Okay, that makes sense. And then I think your average occupancy was 93.6 for the entire quarter. I know in your May REIT update, I think you were running around 94% at the end of April and the end of May. So just wondering, I know there can be differences between average occupancy and month end and quarter end, And but did you have a little bit of occupancy kind of give back as pricing was starting to ramp or continuing to ramp throughout June? And I guess what was the update on occupancy in July as well?
Yeah, Bonner, can you get a July occupancy for me? But the in terms of the strategy we had, we were deliberate in trying to hold rates, you know, on the new lease front. And so, you know, we lost a little bit of, you know, call it 30, 40 basis points, you know, good memory back to Nary. But, you know, the strategy was to try to hold pricing as much as we could, which bore out, you know, sequentially month by month. You know, the new lease pricing did improve as we just reported in the Bonadio.
Yeah, and just a little bit of clarification. So, Peter, the occupancy numbers we report in the supplement are, you know, as a point in time. So that 93.6 is a 6.30 physical end date. So the average financial occupancy for the quarter was about 93.8. You're right. When we were at NAIRED early June, you know, we were 94 flat physical. I think, you know, looking at where we thought we had some better pricing, we were a little bit more aggressive, both on new lease pricing and renewals. I think that, you know, a certain number of these assets that Matt's, you know, talking to, we thought we had a little bit more pricing power than was borne out. And that, you know, ultimately eroded, you know, call it 40 bips of occupancy between, you know, first week of June toward the end of the month. Rolling into July, you know, I think in the operational update we provide the supplement, you'll see like the leasing funnel is working. We're generating, you know, pretty high lead volume. We think it's a very healthy season all the time, and the inflection to a positive blend on rates, we're prioritizing pricing a little bit. We're trying to push pricing, and we're okay. I mean, certainly we'd love to be a little bit healthier on occupancy, but running kind of mid-93s and getting to that inflection point in new lease rates is more of a focus today.
All right. That's all for me. Thanks for the time.
Operator
There are no further questions at this time. I will now turn the call back to the management team for closing remarks.
Thank you for everyone's participation today and look forward to speaking after Q3. Have a good day.
Operator
This concludes today's call. Thank you for attending. You may now disconnect.