Operator
Thank you for standing by. My name is Carly and I will be your conference operator today. At this time, I would like to welcome everyone to the Next Point Residential Trust Q1 2026 earnings call. All lines have been placed on mute to prevent any background noise. After the speaker's remarks, there will be a question and answer session.
If you would like to ask a question during this time, simply press star followed by the number one on your telephone keypad if you would like to withdraw your question press star one again thank you i would now like to turn the call over to kristen griffith investor relations please go ahead thank you good day everyone and welcome to next point residential trust conference call to review the company's results for the first quarter and in march 31st 2026. on the call today are paul richards executive Vice President and Chief Financial Officer, Matt McGriner, Executive Vice President and Chief Investment Officer, and Bonner McDermott, Vice President, Asset Investment Management. As a reminder, this call is being webcast through the company's website at nxrt.nextpoint.com. Before we begin, I would like to remind everyone that this conference call contains forward-looking statements within the meanings of the Private Securities Litigation Reform Act of 1995 that are based on management's current expectations assumptions and beliefs listeners should not play undone reliance on any forward-looking statements and are encouraged to review the company's most recent annual report on form 10k and the company's other crimes with the sec for a more complete discussion of risk and other factors that could affect any forward-looking statement the statements made during this conference call speak only at the state date and accept as required by law, NXOT does not undertake any obligation to publicly update or revise any forward-looking statements. This conference fall also includes an analysis of non-GAAP financial measures. For a more complete discussion of these non-GAAP financial measures, see the company's earnings release that was filed earlier today. I would now like to turn the call over to Paul Richards. Please go ahead, Paul.
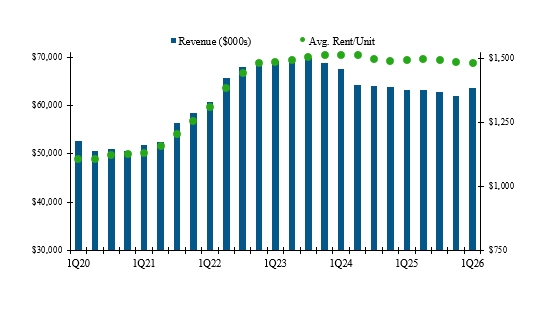
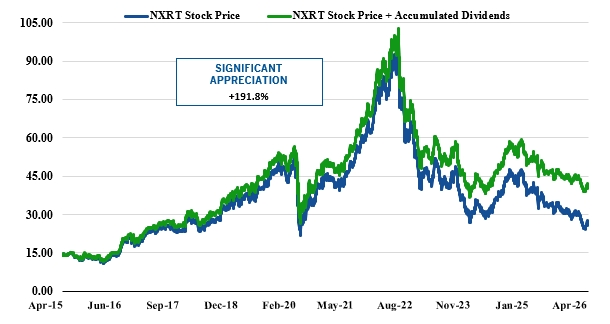
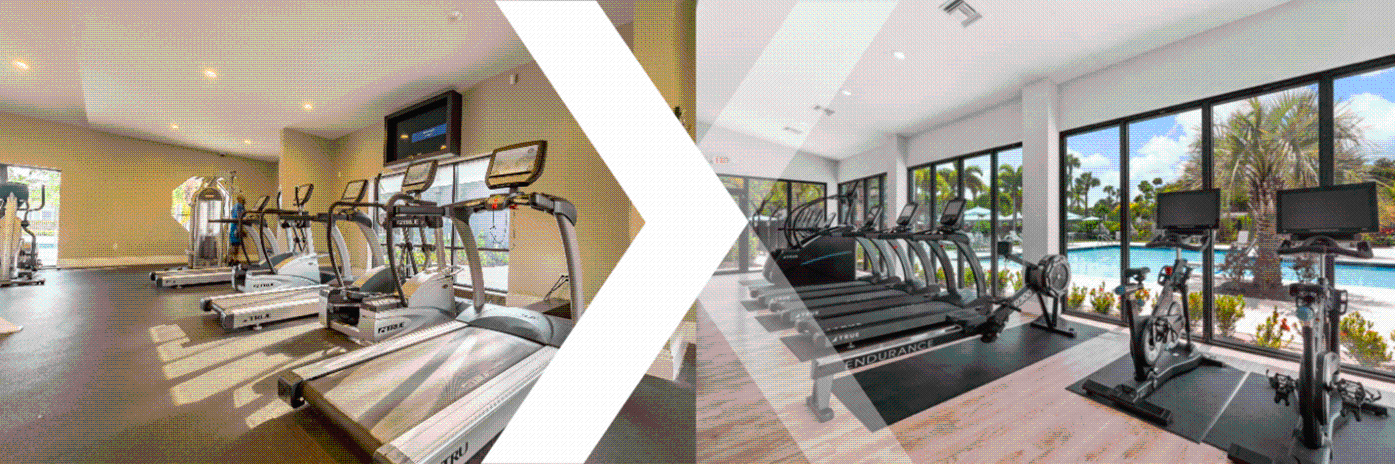
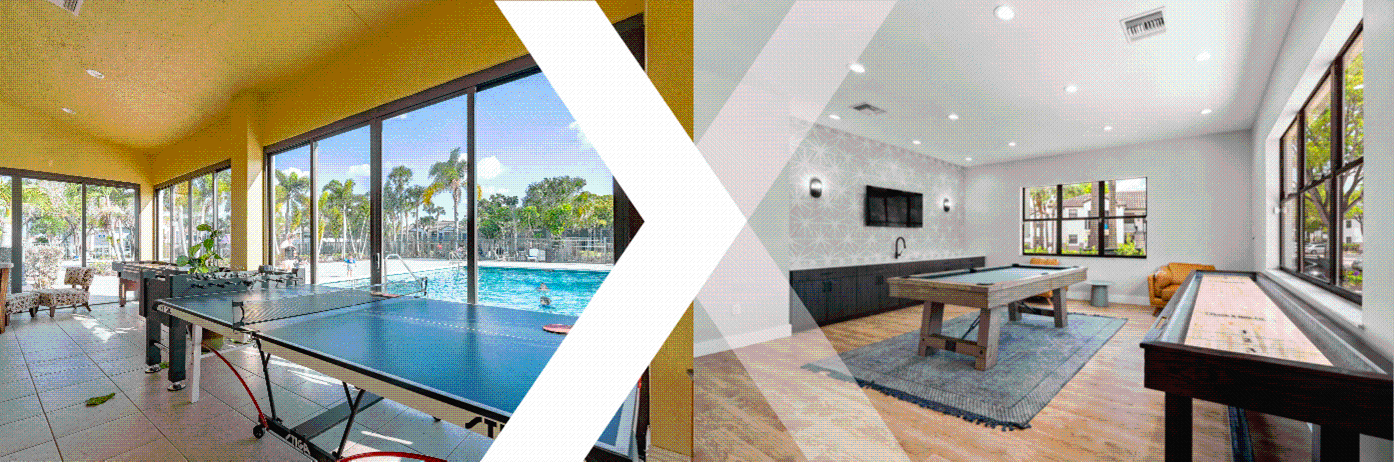
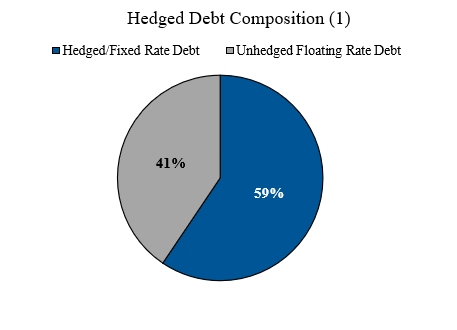
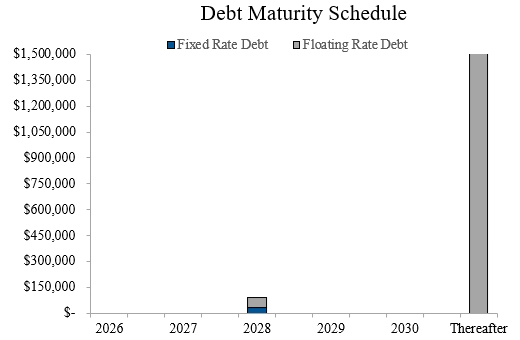
Thank you, Kristen, and welcome everyone joining us this morning. We appreciate your time. I'll cover our Q1 2026 financial results and then walk through a refresher on our full year outlook. Matt will then discuss the operating environment, our technology platform, and AI strategy, as well as portfolio positioning. Q1 2026 results are as follows. Net loss for the first quarter was $6.8 million or $0.27 per diluted share on total revenue of $63.5 million. This compares to a net loss of $6.9 million or $0.27 per diluted share in Q1 2025 on total revenue of 63.2 million total noi was 37.6 million across 36 properties including sedona at lone mountain which we acquired last december this compares to 37.7 million on 35 properties for q1 2025. on the same store basis across our legacy 35 legacy properties and 12 984 units total income was 61.4 million down 2.2 percent year over year total operating expenses declined 1.6 percent to 24.8 million, resulting in same-store NOI of 36.7 million, a 2.7 percent decrease, and an NOI margin of 59.8 percent. Same-store Occam C closed the quarter at 93.6 percent. While the year-over-year comparison reflects the tail end of supply-driven pricing reset, our monthly trajectory is improving materially, and Matt will walk you through that cadence on the structural factors driving our confidence in the second half. We reported Q1 core FFO of 17.3 million or 68 cents per diluted share three cents better than consensus compared to 75 cents per diluted share in q1 2025. the year over year decline is primarily driven by interest expense which i'll address now we have always been transparent that 2026 carries a meaningful interest expense headwind as certain swap positions fall off q1 total interest expense was 15.4 million versus $14.4 million in Q125, with the swap benefit declining from $8.4 million to $5.5 million. Since we issued initial guidance in February, the forward SOFR curve has shifted 7 to 47 basis points higher across the remaining quarters of 26. This adds approximately $2.2 million, or roughly $0.08 per diluted share, of incremental interest expense versus our original assumptions. Q1 came in essentially in line with our prior model. Q2, modestly higher. Q3 steps up as swap positions begin to expire, and Q4 reflects the full run rate impact. Full-year 26 interest expense is now projected at $69.3 million versus $67.1 million in our original model. We do not attempt to forecast rates. We manage the risk. The same volatility that has moved the curve against us in recent weeks creates the entry points for our next swap execution. We have visibility into the maturity schedule, the optionality to execute forward starting hedges before september and we will move when when economics are compelling as we did with the 100 million gpm forward swap last april at 3.49 percent we are not waiting for the september first interest rate swaps currently fixed the rate on 917.5 million or 62 percent of floating rate mortgage debt we continue to evaluate opportunities to layer additional hedges and will act when risk adjusted economics are compelling moving to expense detail on the expense side same store operating expenses improved 1.6 percent year over year payroll declined 4.3 percent a direct output of centralized operating model and a high enhanced leasing platform that matt will discuss in detail real estate taxes decreased 11.2 percent and insurance declined 23.5 percent partially offset by a 15.2 percent increase in repairs and maintenance which included bulk fiber service contract costs offset by revenue gains and a 50.5 percent increase in marketing spend as we invested in lease-up velocity at properties below target occupancy. The R&M increase reflects two primary drivers. First, we accelerated deferred maintenance at several properties as part of a deliberate portfolio quality initiative. Second, we incurred elevated one-time costs associated with lender-required CapEx at select Florida properties. These are episodic expenses that position the affected units for improved performance and do not reflect a structural change in our cost base. Importantly, our expense outlook is steady relative to our original model. Operating expense is on track, as is corporate G&A. On insurance specifically, we settled rates for our new policy renewal on April 1st, achieving 13.3% reduction year-over-year, better than the strongest end of our originally guided range of 0% to negative 10%. Moving to value-add update. During the first quarter, NXRT completed 252 full and partial upgrades, at least 225 upgraded units, achieving an average monthly rent premium of $69 and a 19% ROI. Since inception, NXRT has completed over 10,100 full and partial interior upgrades across the portfolio, generating average monthly premiums of 13.3% and inception-a-day ROIs of 20.7%. In addition, we have completed 5,027 kitchen and laundry appliance upgrades and 11,199 tech packages, generating ROIs of 63.5% and 37.2% respectively. For Q1, we declared a dividend of $0.53 per share, paid March 31, 2026. Since inception, we have increased our dividend 157.3%. We remain fully committed to the current distribution level. At our core FFO guidance midpoint, coverage stands at approximately 1.21 times, and we expect coverage to improve as revenue trends strengthen through peak season into 2027. On the balance sheet and liquidity, on January 30, 2026, the company entered into a 55% LTV, $40.3 million mortgage loan secured by Sedona at Lone Mountain with Newmark. The loan matures on February 1, 2033, with all principal due at maturity, and bears interest rate based on 30-day average sober plus a margin of 1.23%. As of March 31st, 2026, total indebtedness was approximately $1.6 billion at an adjusted weighted average interest rate of 3.3%. We have $18.5 million of unrestricted cash and $143 million of undrawn capacity on our credit facility, providing approximately $161.5 million of available liquidity. We have no scheduled debt maturities until 2028 when our 33.8 million dollar 4.4 4.24 fixed rate loan matures at residences at West Place. That loan should be easily refinanced with a new agency senior when the time comes. Nav per share. Our estimated net asset value per quarter at quarter end is $47.70 per diluted share at the midpoint using a blended cap rate of 5.5% across the portfolio. The range spans $40.56 at a 5.75% cap rate to $54.74 at 5.25%. Based on approximately 25.6 million diluted shares outstanding, the closing stock price as of yesterday at $26.36 represents a 44.7% discount to our midpoint NAV. Even at the most conservative end of our range, stock trades at a 27% discount to estimated liquidation value. We believe the disconnect between public market pricing and the underlying real estate value is significant. In the capital recycling initiatives, we will discuss providing a path to validating these values through third party transactions. 2026 guidance reaffirmed. We are reaffirming our full year 2026 core FFO guidance range of $2.42, $2.71 per diluted share, as well as our same store NOI range of negative 0.5% at the midpoint. Two months ago, we issued initial guidance. Since then, we have absorbed two distinct headwinds and realize meaningful offsets that in aggregate fully neutralize the pressure on the headwind side a 7 to 47 basis point shift in the forward silver curve adds approximately eight cents per share of incremental interest expense and a slightly lower than model q1 leasing environment on the offset side a stronger insurance renewal expense discipline and strategic fee income from our advisor private capital platform which matt will address in a moment. Together, fully absorb those pressures. Our core FFO and same-store guidance ranges unchanged. We're also reaffirming our same-store submetric ranges for the year. To reiterate, our full-year targets, we see the ranges are as follows. Same-store rental income growth of 0% to positive 1.9% with a midpoint of 0.9%. Same-store revenue growth of positive 0.1% to positive 2% with a midpoint of 1.1%. Same-store expense growth of positive 2.8% to positive 4.2% with a midpoint of 3.5%. And lastly, our same-store NOI growth of negative 2.5% to positive 1.5% with a midpoint of negative 0.5%. With that financial overview, let me turn it over to Matt.
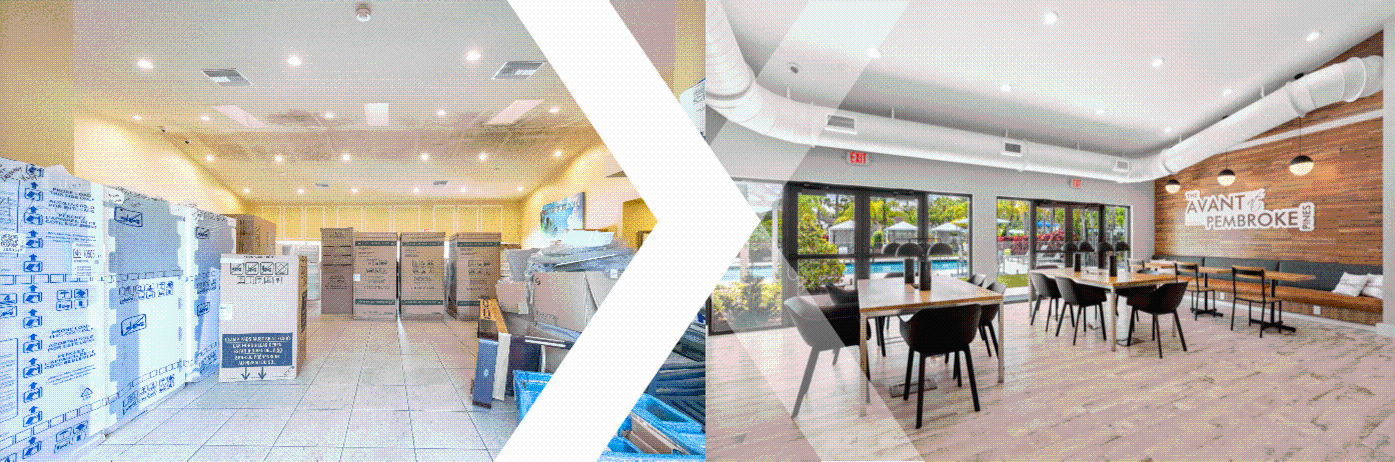
Thank you, Paul. Let me start with the macro backdrop because the structural setup for our portfolio has become increasingly compelling and even the largest real estate investors in the world are now publicly validating the thesis we have been articulating last week john gray described real estate as a sleeping giant at blackstone and signaled conviction that an acceleration is approaching particularly around sectors with favorable supply demand fundamentals reinforcing this point they highlighted the collapse of new supply will be very supportive of fundamentals over time across major sectors including multi-family where industry forecasts call for deliveries this year to be at their lowest level in 12 years 12 years that's the headline that multifamily deliveries in 2026 will be at their lowest level since 2014 that is precisely the supply backdrop we are operating in and it is the primary structural driver of our confidence in the second half of the year and in and into 2027 let me put some numbers around it national multifamily deliveries peaked near 700 000 units in 2024 and are declining sharply new construction starts have fallen 70% from their peak, and units under construction nationally have declined 29% from their Q1 2024 high of 760,000 units. By Q4 of this year, net deliveries are projected to fall to roughly 69,000 units nationally, the lowest level in a decade. In our sunbelt markets, this deceleration is even more pronounced. In NXRT's specific submarkets, the demand picture is compelling. Q1 net absorption was positive 1,307 units against supply of 2,426 units with total demand of 3,733 units. For the full year, our submarkets are projected to see 10,158 units of supply against 10,239 units of demand, effectively a balanced market with demand now outpacing the remaining supply wave. On the demand side, homeownership remains increasingly out of reach. Today, average monthly mortgage payments run 36.7% above average multifamily rents nationally. Moveouts to purchase a home fell to 7.9% for the quarter, down from 10.6% a year ago. The longer-term demographic picture remains favorable, as I covered last quarter. The bottom line here, while near-term fundamentals are weaker than initially expected in select markets the structural setup is improving quarter by quarter the supply cliff the construction starts collapse the demand supply convergence these are all intact and accelerating the recovery is asymmetric rather than synchronized with roughly 35 of our noi already at or near equilibrium and another 44 reaching that threshold through the balance of the year we expect fundamentals to stabilize and then accelerate as the back half of 2026 unfolds On to operating performance. Let me walk through the leasing cadence because the monthly trajectory tells the story. Across 1,388 new leases signed in Q1, our new lease tradeout was a negative 6.6% or a $97 per unit decrease. On 1,528 renewal transactions, we achieved positive 2.3%, or $33 per unit increase. The blended rate across 2,916 total transactions was negative 1.9%. The monthly progression is what matters. New lease tradeouts improved from negative 7% in January to negative 5.6% in March. Blended tradeouts narrowed from negative 1.9% in January to negative 1.7% in March. And the momentum has continued into April. New lease tradeouts have improved to approximately negative 4% month-to-date, a 300 basis point improvement from January to April. Blended tradeouts have narrowed to approximately negative 1.2%. At the market level, Las Vegas renewals led the portfolio at positive 12.2%, or $164 per unit increase. Raleigh renewals grew 2.2%, with new lease tradeouts at a negative 3.8%, the shallowest decline in the portfolio. Dallas even generated 181 renewals at a positive 1.9 percent. On the occupancy front, the same store portfolio closed Q1 at 93.6 physical occupancy, up from 92.6 at the start of the quarter and 92.7 at the end of Q4. April month-to-date has improved to 93.9 percent, and our lease percentage reached 95.9 percent, the highest since Q3 of 2025. Per Apartment IQ data, our portfolio is outperforming market comps by 136 basis points in occupancy, which validates both our pricing discipline and the effectiveness of our centralized leasing program. Resident turnover was 44.4%, essentially flat sequentially, but down from 46.3% a year ago. Resident retention improved to 55.6%, with March reaching 57.2%. Same-store total income was $61.4 million, down 2.2% year-over-year. Rental revenue declined 3.1%, partially offset by a 39% increase in other income driven primarily by resident amenity fee programs, which added $469,000 of incremental revenue versus the prior year. The standout within revenue is bad debt. We achieved 55 basis points of gross potential rent in Q1, down 45.7% year-over-year from 1.02% of GPR. This is a structural improvement driven by AI-enhanced screening and centralized credit evaluation, not a one-quarter anomaly. On to concessions. Let me address concessions directly because I know this is in the front of mind for our investors. First, the context. Our portfolio-level concession rate is 1.9% of gross potential rent per apartment iq the competitive set in our sub markets is running 5.7 that is a 380 basis point advantage and it reflects a deliberate operating philosophy we compete on occupancy through operational execution and technology not through concession givebacks our revenue per available unit exceeded costs by 3.77 percent in q1 second the concentration Total concessions were approximately $1.15 million in the quarter, up from $271,000 in Q1 of 2025. However, a 39% of the year-over-year increase, or $342,000, was driven by a single asset, Avon at Pembroke Pines, where a concentrated competitive supply wave entered the sub-market in Q4 of 2025. Concessions were deployed proactively to defend occupancy and market position, and that strategy has worked. We closed Q1 at 94.1% occupancy at Pembroke and have continued to build, reaching 94.9% quarter to date. Concessions at Pembroke have already been reduced from one month free to a $500 incentive, which is a 75% reduction. Excluding a bond, the portfolio concession increase was approximately $535,000, or roughly two times the prior year. Elevated, but a fundamentally different story than the headline. Third, and most importantly, the forward trajectory. Our four-year 2026 operating forecast projects concession utilization declining 75% from Q1 levels by the second half of the year. Q1 again ran at 2% of GPR. We forecast Q2 at 1% of GPR. Q3 at 50 basis points and Q4 at 40 basis points. Simultaneously, financial occupancy improves from 92.8% in Q1 to 94% in Q2 and 94.1% in Q3. Six of our 10 markets showed improving concession environments sequentially in Q1 versus Q4 of 2025. Those are Atlanta, Las Vegas, Nashville, Orlando, Raleigh, and South Florida. Even in the foreign markets still facing supply-driven pressure, the rate of deterioration has stopped. As one-month free concessions roll off, we realize an eight approximately eight percent pop in effective rents without raising prices this is an embedded tailwind that begins to materialize through the balance of the year as supply deliveries decelerate and seasonal demand strengthens we believe q1 was the trough for concession deployment in this cycle let me spend a few minutes on the technology platform as paul alluded to because q1 results are a direct product of the investments we have been making we're deploying a two-layer architecture model for technology layer one is property operations ph management and their funnel leasing ai crm platform handling day-to-day leasing maintenance and resident services under their centralized operating model layer two is what we are building at the advisor level next point intelligence an asset management platform that drives better decisions at the portfolio market and unit level we are literally building agents per property across the portfolio to enhance predictive analytics this architecture is deliberate self-managed peers investing in ai must spend must spend across both layers simultaneously our model delivers a disproportionate share of the ai impact at a fraction of the capital outlay bh management's funnel ai platform gives us the property operations layer as a managed service and we focus our investment on the intelligence layer where the highest value judgments happen. We will provide the full AI product roadmap and financial impact thesis at REIT Week in early June. Q1 results from the platform. Our AI-powered leasing platform processed 31,882 leads and converted them into 1,571 signed leases during the quarter, A 4.9% lead-to-lease conversion rate versus the industry benchmark of 3.2%. Year-over-year, leads were up 26%, and applications were up 34%, with move-ins up 53%. Our tour-to-application conversion hit 36.8% for the quarter, the best of the four quarters since we launched our new AI-enabled CRM system. Self-guided touring technology enabled 24.7 of our leases to be executed after business hours, demand that would have been lost entirely without technology-enabled engagement. We hosted nearly 800 self-guided tours during the quarter and expect to surpass 1,000 per quarter as we move into peak leasing season. 59% of self-guided visitors submit a lease application and extraordinary conversion rate that speaks to the quality of the funnel. The 4.3% payroll reduction, the 45.7% improvement in bad debt, the 136 basis point occupancy advantage over comps, and concessions at 1.9% of GPR versus 5.7% for the comps, these are all outputs of the centralized data-driven model. Turning to Sedona at Lone Mountain as a quick update on our latest acquisition. As a reminder, we acquired this 321-unit community in North Las Vegas in December for $73.25 million. Occupancy closed Q1 at 87.9%, and as of April 28th, the property is approximately 90.3%, with a projected 30-day trend of 92.2%. The rent roll cleanup and operating recovery is ahead of our underwriting and tracking well ahead of budget. Q1 rental income beat budget by 6.7%, or approximately $88,000, driven by lower-than-expected bad debt write-offs. Total expenses beat budget by 13.4%, or $71,000. All-in, NOI is leading budget by 13.4%, or $130,000, through Q1. We continue to target a 7.2% NOI CAGR through 2029, taking this asset from a high-five cap acquisition to a 7.5% stabilized yield. On to the transaction market, capital recycling, and other earnings opportunities. For Walker and Dunlop, Q1 2026 institutional multifamily sales volume was $15.1 billion across 213 deals at a weighted average cap rate of 5.09% and $260,000 per unit. Full year 2025 volume reached $161.6 billion, up 9.1% year over year. Institutional capital is returning selectively with institutions and REITs comprising 36.6 of multifamily acquisitions in 2025, the highest share since 2019. Related to our capital recycling and transaction activity, I want to address proactively one element of our potential earnings growth that Paul touched on, the role of strategic fee and interest income generated through our advisor's DST platform. Some context. Our advisor, NextPoint, is one of the largest sponsors of Delaware Statutory Trust in the United States, distributing through the NextPoint Securities Broker-Dealer Network. Since 2017, NextPoint has sponsored over $4 billion of DSTs across a variety of property types, including core and core plus multifamily. The DST market itself reached a record of $8.4 billion of equity raised in 2025, a 49% year-over-year, and multifamily is the largest category within it. Each DST transaction generates fee opportunities for sponsors, financing, acquisition, asset management fees, and creates lending and bridge capital opportunities where a balance sheet partner is needed. Looking forward, we see meaningful potential for additional activity of this type within XRT. The DST platform is active. The multifamily category within it continues to grow, and NXRT's balance sheet positioning is well suited to participate selectively. While we are not embedding additional transactions in our 2026 guidance, we believe the platform represents a credible source of incremental earnings optionality, potentially in the range of 10 to 20 cents of core FFO over the next 12 months under favorable conditions, balanced against our risk-adjusted return discipline and capital availability. More broadly, this reflects a deliberate strategy to diversify NXRT's earnings streams. Larger peers like Prologis, Welltower, Realty Income, Ventos, Equinix have all built private capital platforms in response to capital markets dynamics where public equity costs can be prohibited. NXRT, through its external advisor, possesses the core infrastructure to pursue a similar, appropriately scaled strategy. We will be outlining the broader our vision at this at NARIC in early June. Let me close with this. We are entering the most favorable supply of backdrop in over a decade. Again, Blackstone is calling multifamily a sleeping giant. New construction starts are down 70% from the peak. Deliveries are projected at their lowest level in 12 years, and demand is absorbing the remaining supply wave in our sub markets. The setup is asymmetric. 2026 absorbs the swap repricing and the supply tail. 2027 captures the supply cliff and earn-in to put numbers around that earn-in. If new lease growth returns 2% by Q4 of this year, consistent with the deliveries cliff, the carryover earn-in alone delivers 150 to 200 basis points of 2027 same-store revenue growth before a single new 2027 lease is signed. We're not providing 2027 guidance today, obviously, but the structural drivers are clear and they compound in our favor. Against that backdrop, our operating platform is performing. Bad debt is at a multi-year low. Payroll is declining. Insurance renews significantly better than expected. Leasing conversion rates are at record levels. Concessions at 1.9 percent of gross potential rent versus 5.7 percent for the competitive set. Occupancy is building, again, 93.9 percent in April and rising. Potential for DST transactions generate incremental fee and interest income to diversify our earnings streams, but the operating thesis still stands on its own. The monthly trajectory is encouraging. New lease tradeouts improve 300 basis points from January to April, and we're entering the peak leasing season with strong conversion metrics, declining supply, and really tepid expectations. Indeed, the trends and trajectories give us reason for optimism. We appreciate everyone's continued hard work here at Next Point BH, and with that, we'll turn the call over to the operator for questions.
Operator
At this time, if you would like to ask a question, press star, followed by the number one on your telephone keypad. We'll pause for just a moment to compile the Q&A roster. There are no questions at this time. Oh, sorry. We do have a question from Michael Lewis with Truist Securities.
Thank you. My first question, I wanted to ask, you talked about it a little bit, this 200 basis point difference between the occupied and least percentages. I was just wondering if there's any opportunity to narrow that. And likewise, you know, the resident retention in the mid-50% range looks like it was going up the last couple of months. You know, do you see upside there through operational efficiencies as well?
Yeah, definitely. Thanks, Michael, and good morning. You know, we definitely see an opportunity to continue to drive renewals and also retention, particularly as, you know, you get into the summer months. Folks don't want to move, you know, in our southeastern and southwestern markets. So, that's always been a core focus, and any incremental improvement there just, you know, obviously allows us to drive new lease growth as the supply, you know, wave captures. And, Bonnar, I don't know if you have anything to add to the first point.
Yeah, I think on that spread, I mean, you know, here we are in April, right? The start of kind of peak leasing season, the properties are looking great, traffic flows. You know, I think in the highlight section, you can kind of see due to last year, you know, traffic patterns, right? this this is where we our demand funnel is the widest um getting getting that lease percentage higher that helps us with pricing power right fewer units available we're able to push pricing dynamics a little bit more uh try to you know continue to narrow that gap on the new lease pricing side so you know that's that's the focus pushing you know this map of lucas who's going into the back half of the year continuing to you know hopefully start to inflect positively on on rates. So, you know, the more leases we can sign, I think the better pricing dynamics we have.
Okay, thanks. And then, you know, you talked about the core portfolio like it was, you know, essentially in line. You kept the full year same-store guidance. But occupancy was up quite a bit in almost all the markets. You know, Vegas was up a lot sequentially. I was wondering if the occupancy increase surprised you at all. And, you know, So is it fair that 1Q kind of ran in line with your expectations, or are you running a little bit ahead to start the year? How would you kind of frame that?
I think Q1, to me, and Bonner, you can give your thoughts, but to me, Q1 felt better. I wouldn't say we hit our budget. In fact, we missed, you know, I think we missed our NOI budget by a quarter million or $300,000. But it did feel better from a demand perspective in that, you know, we saw the rent rolls continue to firm. We saw trends build. And we didn't particularly give up that much or at least give up that much relative to the prior quarters. And so, I personally was pleased with, and as you can tell from my prepared remarks, I think it's firming out there. And I'm pleased with the trajectory and the trends in occupancy. Bonner, if you have anything to add to that.
Yeah, I think, look, on our, you know, aggressive forecast internally, I think we'd love to squeeze, you know, 10, 20 bases going higher in occupancy. It is improving, and that's, you know, structurally where we're looking to go. in the peak leasing season, I would say that the major wins, and Matt, you know, described it in the call, the ability to squeeze that debt back down to 55 basis points, I mean, that's a real win. I think that, you know, we utilize a software technology called TwoDots. We're getting to a point now where we can get to a credit screening approval on an app in a 15-minute interaction, and being able to close those leads, you know, same day, same interaction, where, you know, some of our prospects may be you know applying here and across the street that time to decision is really important to us so that that's helping some of the occupancy you know the operating platform that we're building is really helping so i i would say you know we're happy with with occupancy we'd love to continue to build it um you know we described a little bit of the uptick in concession utilization um you know hoping hoping to see that moderate but but overall you know know, revenue expectations are within, you know, one penny of kind of our, you know, optimistic goal for the quarter.
Okay. And then lastly, for me, this seems like the most interesting question. I don't know exactly how to frame it or if you can answer it, but, you know, so the interest expense is going to be higher because rates are higher. It sounds like the offset is the fee income that you talked about. Is there anything, you know, you said you're going to give more details at NAIRED. Is there anything more to say about how that's kind of offsetting this year, what you're investing or what you're earning or what exactly you're going to be doing to earn, I think you said, 10 cents to 20 cents over the next 12 months? Is there any more detail you could share on that?
Yeah, happy to. So one thing we know is that um you know we're going to be wrong on the curve you know it's bouncing around it has bounced around and you know i think unfortunately for us the sell side uh tends to model uh max rate pain and uh weakest fundamentals out there possibly so that's that's the backdrop um as our you know uh as the next point platform we manage about you know 20 billion or so uh across a variety property types and have built out broker-dealer infrastructure, you know, across those property types. And that allows, you know, NXRT to utilize that broker-dealer infrastructure. And what I mean by that is NXRT would sponsor the DSP program. And so, basically, utilizing the balance sheet, we could be a lender to the transaction and make a spread above our credit line, you know, 300 to 400 basis points spread there. The sponsor typically takes acquisition fees, which could be, you know, one to two percent of the gross purchase price of the deal. So, you know, you can estimate that fee income to be, you know, typically one to two and a half million dollars per transaction.
Speaker 5
And so it adds up.
And, you know, given given the fact that, you know, we I think we've been an aligned shareholder here since inception. You know, when we took public with fee deferrals, fee waivers, extraordinary side-by-side alignment and ownership, this is just another tool in our toolkit to help earnings and diversify And so we think it's, you know, the right thing to do for the business. And look, hope is we don't need it.
Speaker 5
You know, the curve comes our way. were able to you know swap um appropriately and opportunistically and then you know i just add this extra earnings layer on top of it um so we see it as a good thing okay thank you you bet your next question comes from buckhorn with raymond james hey good morning guys congrats um i'm just wondering if you could give us a little bit more detail on the the real estate taxes line And I guess, you know, what were the good guys and kind of how that, you know, those year-over-year comps are looking as you peer into the back half in terms of appraisals or potential, you know, recoveries or just kind of what's going on with taxes this quarter and the outlook for the remainder of the year?
Yeah, I'll be happy to help you with that. So, you know, Q1, we were still fighting last year's taxes, right? we got got some wins on the board i think uh in particular dallas dallas county dfw uh had had a number of favorable protests from last year rolling to the q1 booking um in terms of kind of the you know overall i would say you know we've been working with our tax consultants right we've gotten kind of initial values notices um in may and taxes and a couple other of our municipalities And, you know, overall, I think our outlook, you know, is pretty stable. It's, you know, valuations are down. There's less, you know, ammunition. There's less, you know, sales that are really pushing kind of the equal and uniform story for us. So we believe, you know, I think taxes, you know, should be favorable this year to the last couple. I think we've got, you know, we've got in our numbers roughly 4.1% year over year growth it at the midpoint um with with some of the savings you know in the q1 booking so you know we're going to continue to shoot to outperform that um work work to do there some of those you know fights roll into the next year but overall the outlook is kind of in the you know three to four percent range and we and we booked i think three or four settlements in q1 to help help that quarterly number.
Speaker 5
Got it. Got it. That's a very helpful color. And just on the repairs and maintenance expenses, you mentioned you pulled forward some deferred CapEx. Is that trend going to continue into the second quarter? When does that kind of deferred CapEx spending or that maintenance spend start to normalize?
Yeah, I think there were a few things that were a little noisy again it's one quarter um you know some of that uh is seasonal some of that is lender driven uh on this 2024 we we think we think rnm broadly stabilizes and and when you look at the component parts of rnm that we report one of the things that's in there is that service contract revenue and it probably deserves some some better uh specification outside that that that includes our bulk fiber contract billing so it looks a little bit you know outsized but there's there is a revenue offset there um so you know q1 i would say we we got hit by a couple kind of one-timey things a few of the deferred maintenance items matt mentioned but i think that outlook for a year generally is pretty favorable again kind of you know inflation um levels of the barnum growth and then we're certainly, you know, working to, you know, outperform.
Speaker 5
Got it. All right. Very helpful, guys. Congrats. Good job. Thanks, both.
Operator
There are no further questions at this time.
All right. Thanks for everyone's participation and look forward to speaking and seeing everyone at AREIT in June. Have a good day.
Operator
Ladies and gentlemen, this concludes today's conference call. Thank you for participating. You may now disconnect.