Operator
Hello, and thank you for standing by. My name is Tiffany, and I will be your conference operator today. At this time, I would like to welcome everyone to the Next Point Residential Trust Q4 2025 earnings call. All lines have been placed on mute to prevent any background noise. After the speaker's remarks, there will be a question and answer session. If you would like to ask a question during that time, simply press star, then the number one on your telephone keypad. I would now like to turn the call over to Kristen Griffith, Investor Relations. Kristen, please go ahead.
Thank you. Good day, everyone, and welcome to Next Point Residential Trust Conference Call to review the company's results for the fourth quarter into December 31, 2025. On the call today are Paul Richards, Executive Vice President and Chief Financial Officer, Matt McGranner, Executive Vice President and Chief Investment Officer, and Bonner McDermott, Vice President, Asset and Investment Management. As a reminder, this call is being webcast through the company's website at nxrt.nextpoint.com. Before we begin, I would like to remind everyone that this conference call contains forward-looking statements within the meaning of the Private Security Litigation Reform Act of 1995 that based on management's current expectations assumptions and beliefs listeners should not place a new reliance on any forward-looking statements and are encouraged to review the company's most recent annual reports on form 10k and the company's other filings with the sec for a more complete discussion of risk and other factors that could affect any forward-looking statements the statements made during this conference call speak only as of today's date and except as required by law, NSRT does not undertake any obligation to publicly update or revise any forward-looking statements. This conference call also includes an analysis of non-GAAP financial measures. For a more complete discussion of these non-GAAP financial measures, see the company's earning relief that was filed earlier today. All right, now let's turn the call over to Paul Richards. Please go ahead, Paul.
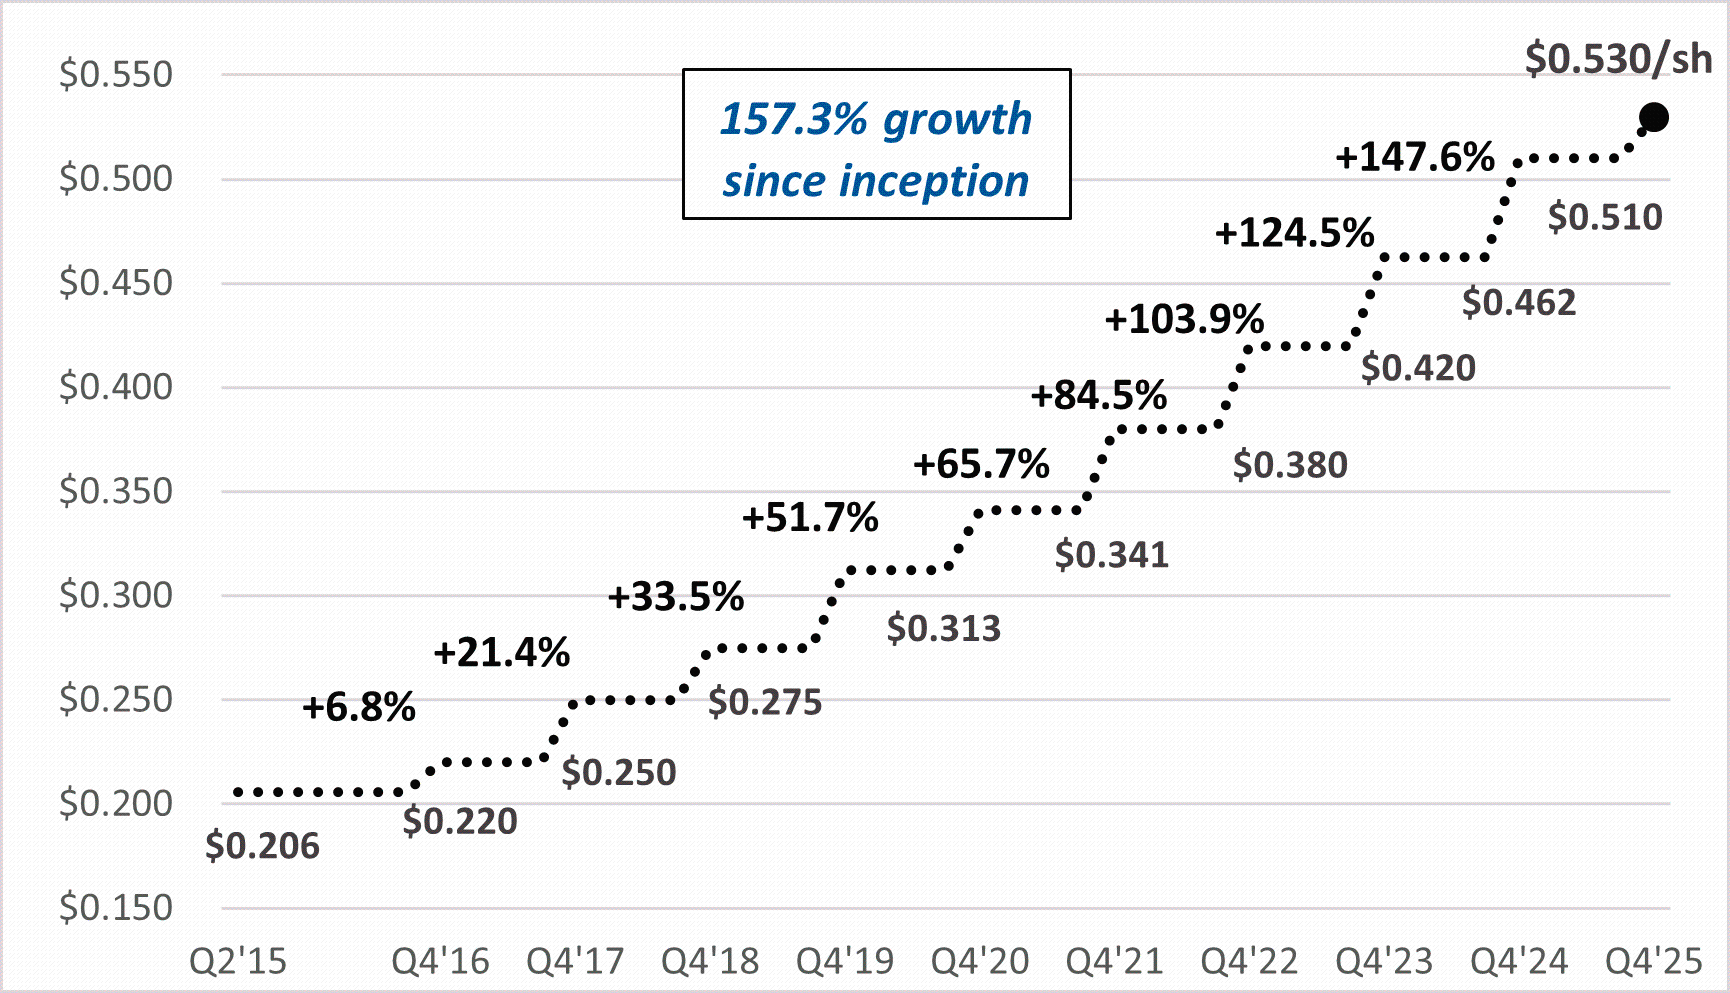
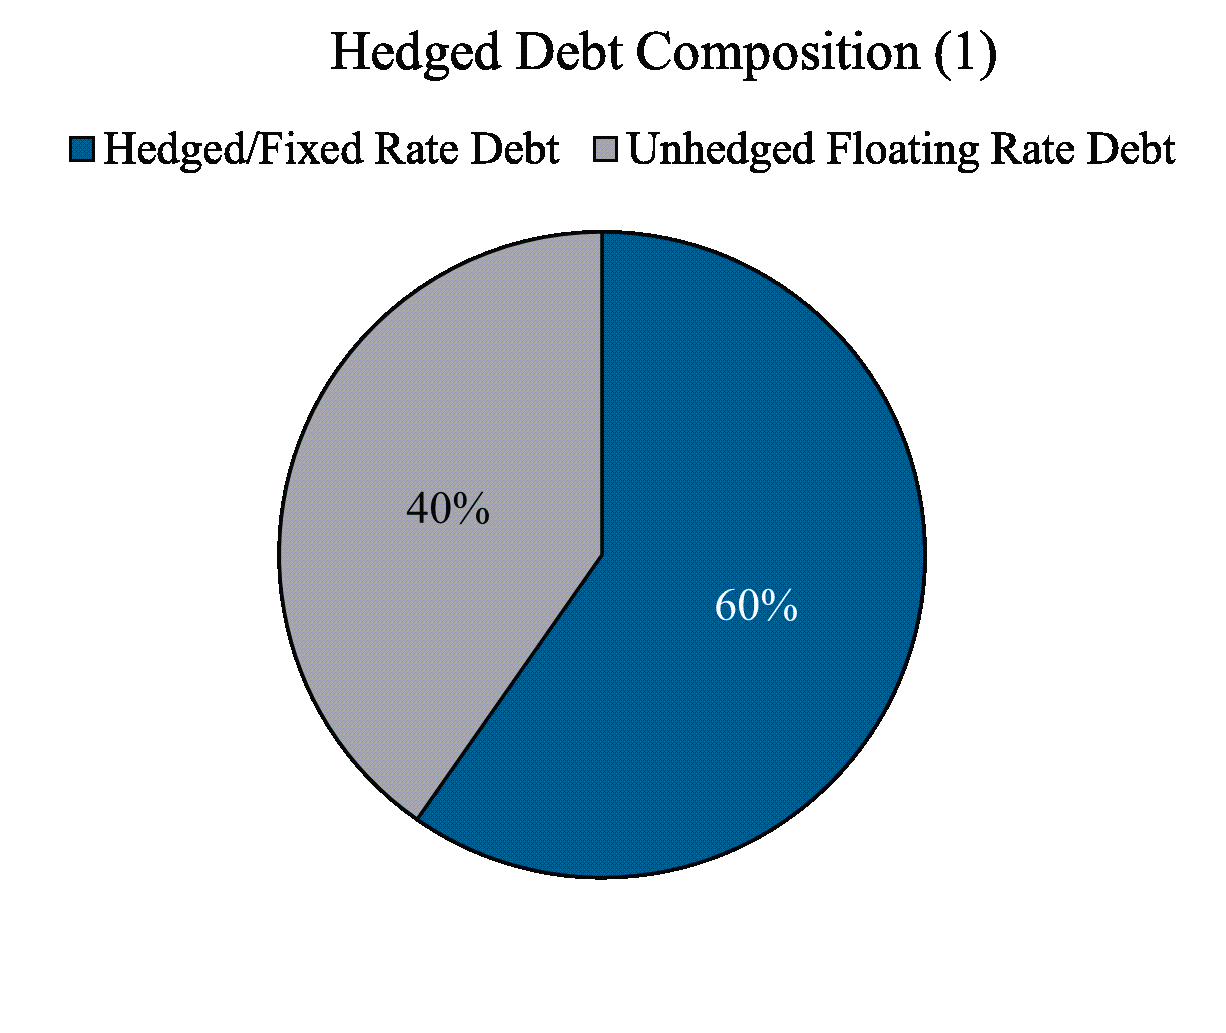
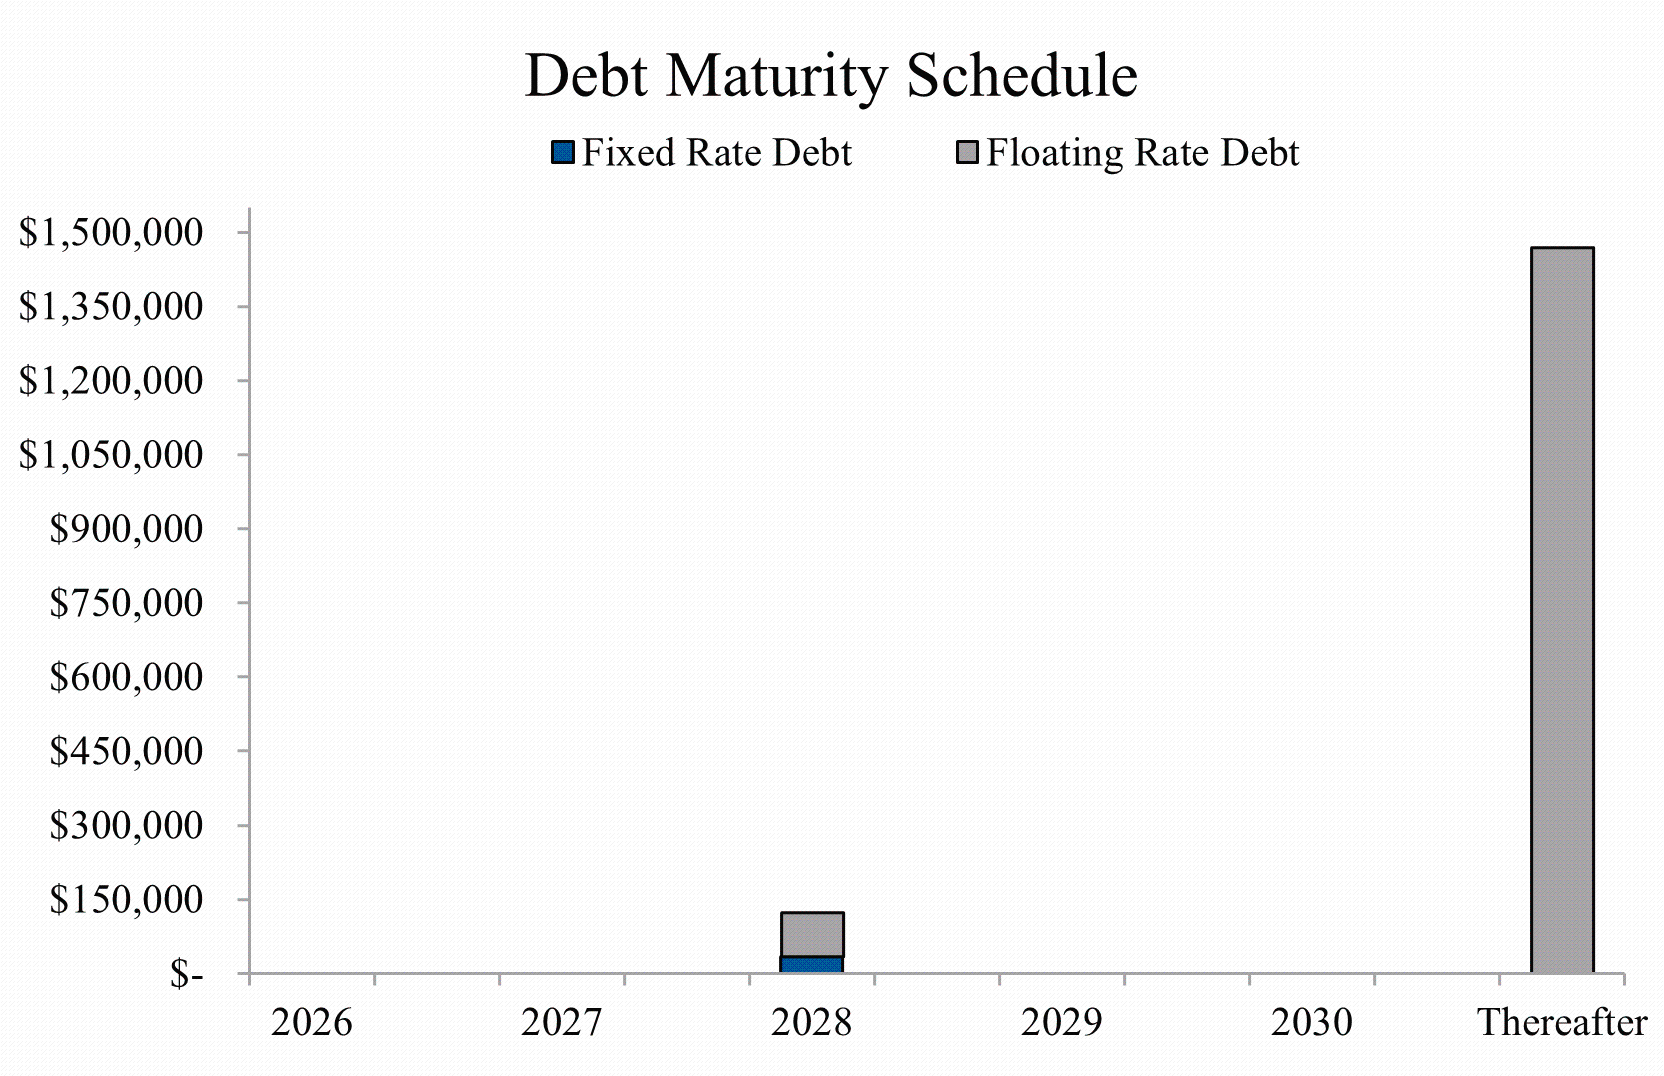
Thanks, Kristen, and welcome everyone joining us this morning. We appreciate your time. I'll kick off the call and cover our Q4 and full year results and highlights, update our NAB calculation, and then provide initial 2026 guidance. I'll then turn it over to Matt to discuss specifics on the leasing environment and metrics driving our performance and guidance and details on the portfolio. Results for Q4 are as follows. Net loss for the fourth quarter was a loss of $10.3 million, or $0.41 per diluted share, on total revenue of $62.1 million as compared to a net loss of $26.9 million or $1.06 per diluted share in the same period in 2024 on total revenue of $63.8 million. For the fourth quarter, NOI was $37.1 million on 35 properties compared to $38.9 million on 35 properties for the fourth quarter of 2024, a 4.7% decrease in NOI. For the fourth quarter, same-store rental income decreased 2.8% and same-store occupancy closed at 92.7%. This, coupled with an increase in same-store expenses of 1.1%, led to a decrease in same-store NOI of 4.8% as compared to Q4 2024. We reported Q4 core FFO of $16.5 million, or $0.65 per diluted share, compared to $0.68 per diluted share in Q4 2024. During 2025, NXRT repurchased 223,109 shares for a weighted average price of $34.29 per share, which is approximately 29% discount to the midpoint of our Q425 NAV, to be discussed here shortly. We continue to execute our value-add business plan by completing 388 full and partial renovations during the quarter and leased 275 renovated units, achieving an average monthly rent premium of $74 and a 22.2% ROI. Since inception, NXRT has completed installation of 9,866 full and partial upgrades, 4,979 kitchen and laundry appliances, and 11,199 tech packages, resulting in 158, 50, and $43 average monthly rental increases per unit, and 20.8%, 63.7%, and 37.2% ROI, respectively. Results for the full year 2025 are as follows. Net loss for the year ended December 31st was $32 million, or a loss of $1.26 per deluded share, which included a $95.8 million of depreciation amortization expense. This compared to net income of $1.1 million, or income of $0.04 per deluded share for the full year of 2024, which included a gain on sale of real estate of $54.2 million and a $97.8 million of depreciation and amortization expense. As a quick reminder, the company sold our two remaining Houston assets, as well as Radborn Lake in Charlotte in 2024. For the year, NOI was $151.7 million on 35 properties as compared to $157 million on 35 properties for the same period in 2024, or a decrease of 3.4%. For the year, same-store rental income decreased 1.3%, and same-store occupancy closed at 92.7%. This, coupled with a slight increase in same-store expenses of 0.1%, led to a decrease in same-store NOI of 1.6% as compared to the full year in 2024. We reported core FFO in 2025 of $71.3 million, or $2.79 per diluted share, compared to $2.79 per diluted share for 2024. Since inception of the business in 2015, NSRT has generated 8.54% compounded annual growth rate in our core FFO. Moving to the NAV per share. Based on our current estimate of cap rates in our markets unchanged at 5.25% to 5.75% and our 2026 NOI guidance, we are reporting a NAV per share range as follows. $41.43 on the low end, $55.72 on the high end, with a $48.57 at the midpoint. Next, our dividend update. For the fourth quarter, we paid a dividend of $0.53 per share on December 31st. Since inception, we have increased our dividend 157.3%. For 2025, our dividend was 1.35 times covered by core FFO with a payout ratio of 73.8% of core FFO. Now our capital markets balance sheet, leverage, and liquidity. On July 11th, 2025, the company entered into a $200 million revolving credit facility with JPMorgan Chase Bank. and the lenders party there too from time to time. The credit facility may be increased by up to an additional $200 million if the lenders agree to increase their commitments. The new facility improves pricing by 15 basis points across all leveraged years, to term SOFR plus 150 to 225 basis points. The credit facility will mature on July 30, 2028, unless the company exercises its option to extend for a one-year term. NXRT has 13.7 million of unrestricted cash and $108 million of available undrawn capacity on our unsecured corporate credit facility, giving the company $121.7 million of available liquidity as we head into 2026. We have no scheduled debt maturities until 2028. Over time, we will look to reduce leverage, credit facility leverage in particular, through a disposition and recycling of long-held, lower-growth assets where we have the ability to harvest gains and put capital back into work into more productive strategies and investments. As of December 31st, 2025, we had total undeadiness of $1.6 billion at an adjusted weighted average interest rate at 3.28%. Interest rate swap agreements effectively fixed the interest rate on $0.9 billion, or 62% of our $1.5 billion of floating rate mortgage debt outstanding. As we have done historically, we will continue to evaluate the credit markets for opportunities to hedge or restructure our debt to best positions our assets and the portfolio for future growth, while maintaining the highly liquid low-friction optionality afforded to us through the use of floating-rate agency mortgage financing arrangements. Full Year 2026 Guidance For 2026, we are issuing the guidance as follows. Rental income, on the low end, 0%, with a midpoint of 0.9% and a high end of 1.9%. Total revenue, low end of 0.1%, with a midpoint of 1.1% and a high end of 2%. Total expenses. Low end of 4.2%, midpoint 3.5%, high end 2.8%. Same store NOI. Low end negative 2.5%, midpoint negative 0.5%, and the high end of 1.5%. Earnings per diluted share. Low end negative $1.54, midpoint negative $1.40, and the high end negative $1.26. And lastly, core FFO per diluted share, low end $2.42, midpoint $2.57, and at the high end $2.71. Matt will go into detail on our SAME-STAR operating assumptions with his prepared remarks and the largest driver from our 25 actuals to 26 midpoint guidance as interest expense. And again, Matt will provide details on our thoughts regarding upside on the operational front and our SAME-STAR operating assumptions. And with that, I'll turn it over to Matt for commentary on the portfolio. Thank you, Paul.
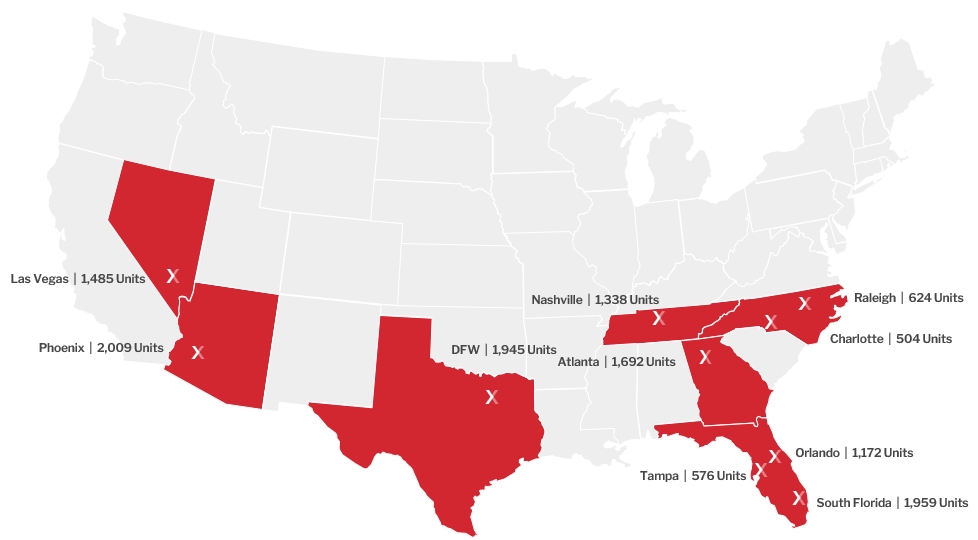
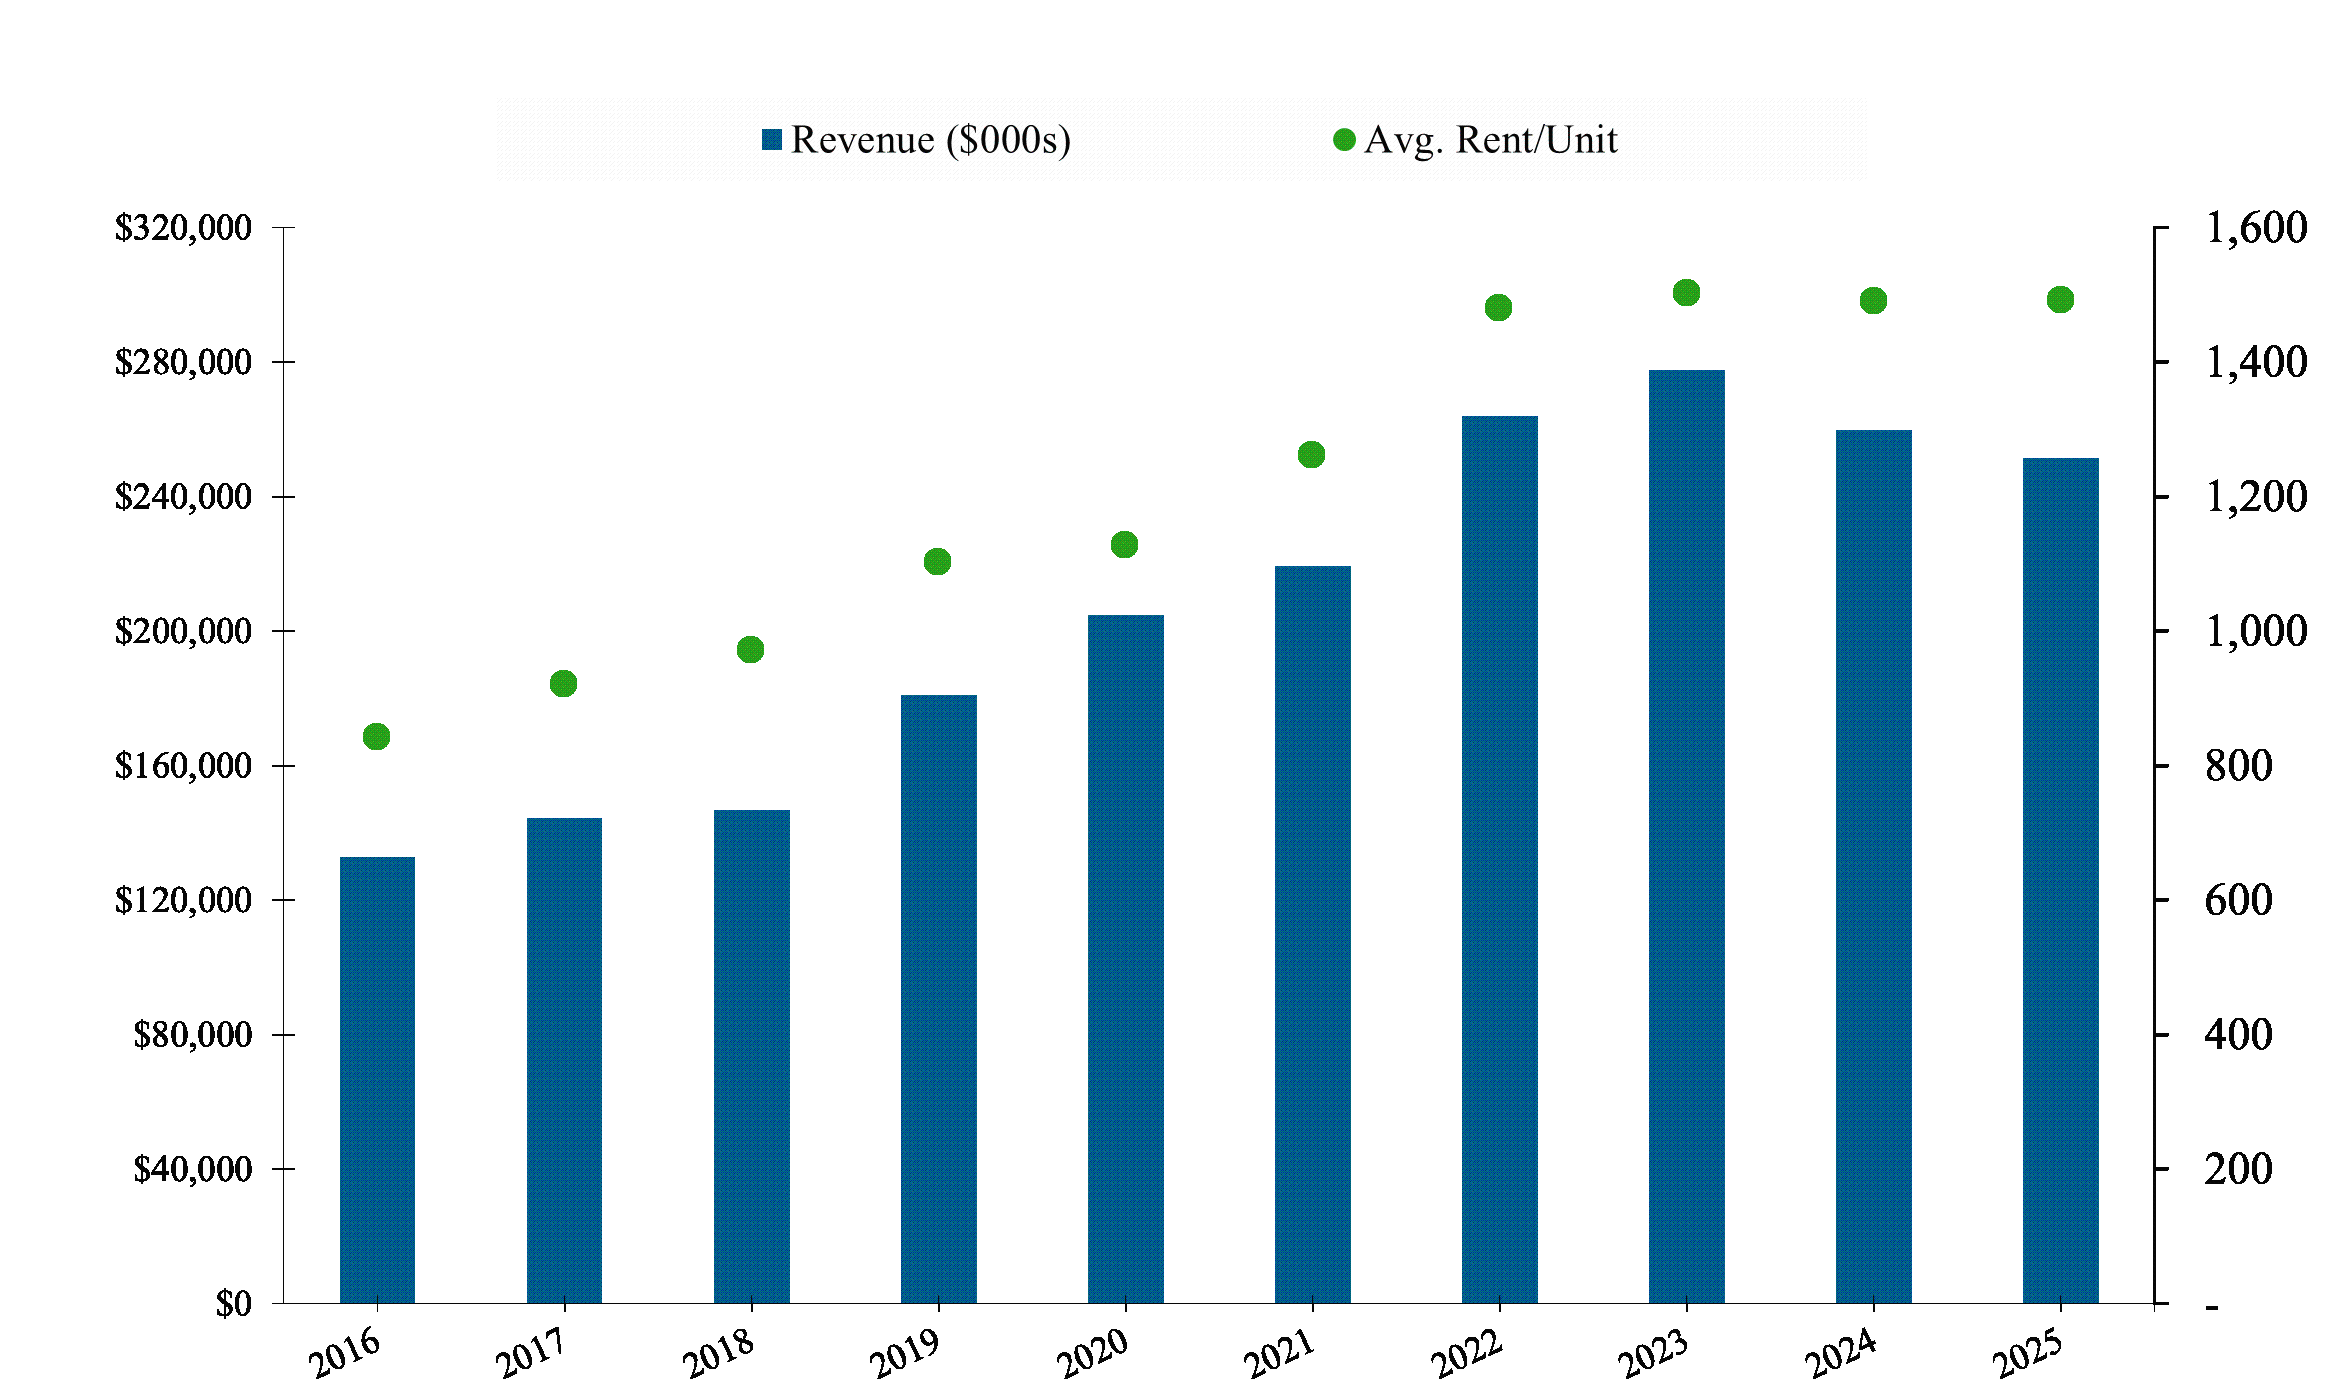
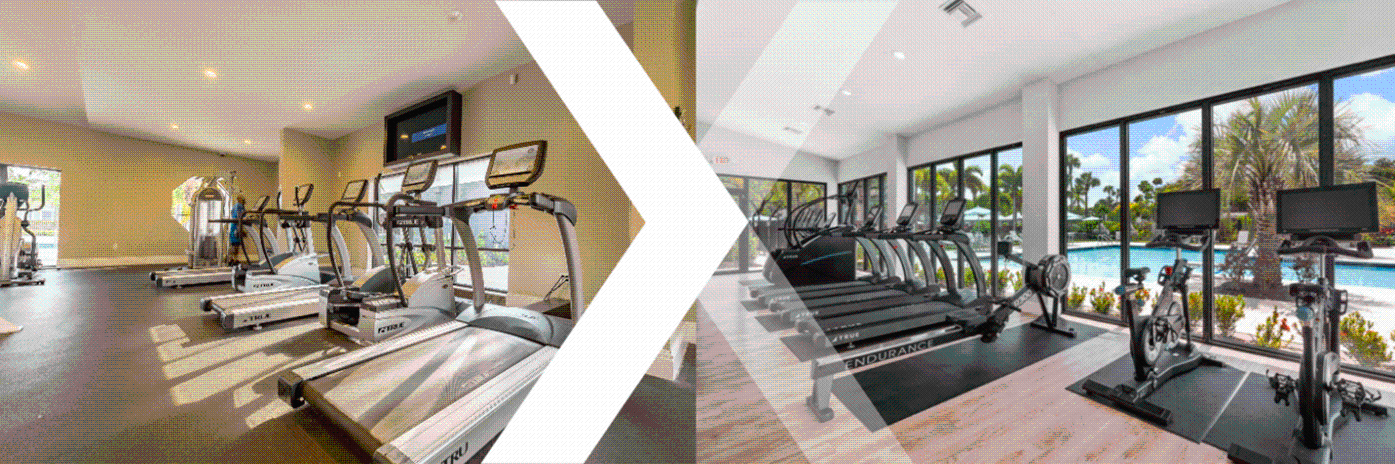
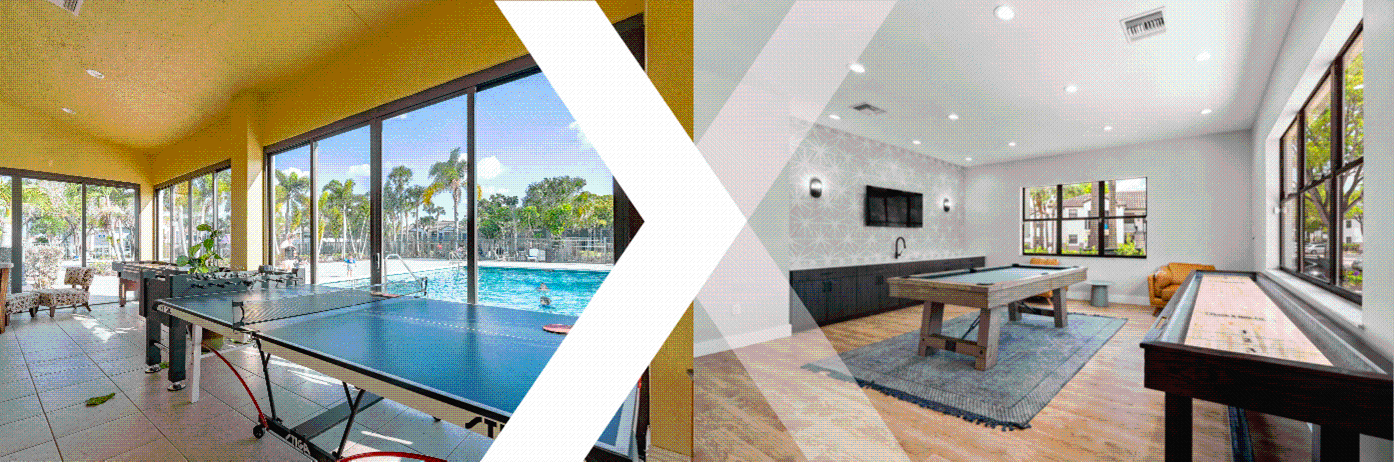
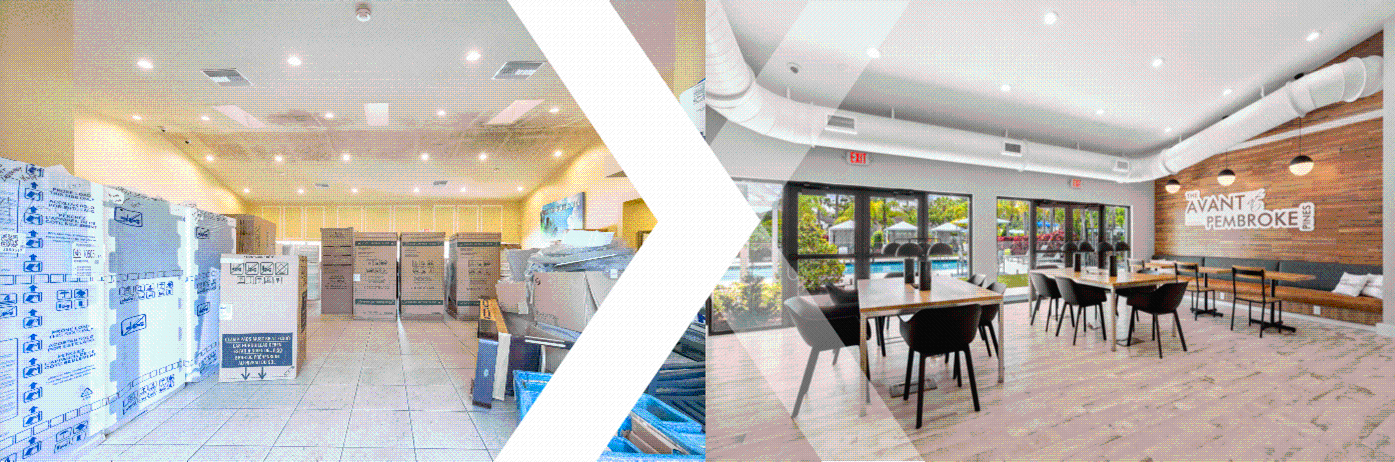
Let me start by diving a bit deeper into our fourth quarter same-store operational results. Same-store average effective rents closed the year at $1,489 per unit per month down 10 basis points year-over-year. Six of our 10 same-store markets generated positive year-over-year growth and effective rents, with Tampa leading the way at 3.1%, followed by Las Vegas, South Florida and Charlotte at 2.1%, 1.6%, and 1.3% respectively. On the occupancy front, the same store portfolio closed the year at 92.7%, down 195 basis points year-over-year. South Florida took the poll position at 94.5%, with Phoenix, Charlotte, then Raleigh rounding out the top four markets with at least 93% occupancy as of the year-end. We saw noteworthy occupancy improvement in Phoenix in particular, building to 94.5% as the team maintained heavy focus on defense to combat the heavy delivery of new units over the past several quarters. Renewal conversions were 57.4% for the quarter and 54.25% for the full year, with 2026 retention being starting off strong, with January over 50% and February month-to-date is 51.6%. March is projected to finish around 56%. Revenue for the year of five of our 10 same-store markets delivered positive revenue growth with South Florida, Atlanta, and Raleigh each growing at least one percent. Tampa and Charlotte rounded out the growth markets. Bad debt continued to trend down, finishing the year at 80 basis points of GPR, a 42 percent improvement year-over-year, demonstrating both the health of our tenant demographic as well as the efficacy of the centralized screening techniques we have employed to strengthen our portfolio post-COVID. Tampa, Raleigh, and Atlanta saw particular improvements to bad debt, with each reducing losses by more than half the prior year total. Concession utilization has increased from 38 basis points as a percentage of gross potential rent in 2024, up to 69 basis points for the full year of 2025. The most noteworthy increase clearly seen within our phoenix market at 1.4 percent of gpr as our value-added assets were made to contend with the significant market level i can see acquisition acquisition strategies for merchant builders throughout the year phoenix orlando south florida and atlanta each saw a need for increased concessions with 1.1 percent for 0.47 percent 0.4 percent and 0.36 percent increase in utilization respectively. Overall, same-store revenues were down 1% year-over-year and turning to the expense side. With limited catalysts for revenue growth in 2025, the team paid particular attention to expense management and were pleased to report a full-year decline of 10 basis points to same-store operating expenses. Advances in AI and our strategic focus on its development to streamline workflows across both our resident and property staff experience enabled us to achieve a 3.7% year-over-year decrease in total payroll costs and an 80 basis point decline in office operations expense. We see this trend continuing, and I'll have more detail later on this in my prepared remarks. Thoughtful asset management, zero-based budgeting, and our sharp focus on turn cost management and material contract negotiation kept the lid on repair and maintenance expense inflation, growing by just 2.5% for the year. Other favorable results were realized through our real estate tax and insurance strategies, up 1.8% and down 12% for the year, respectively. Our full-year same-store NOI margin was a stable 60.8%, while our year-over-year same-store portfolio finished down 1.6%, as Paul mentioned. Notable same-store NOI growth markets for the year were South Florida, Charlotte, and Nashville at 1.4 percent, 1 percent, and 90 basis points, respectively. On December 11th to 2025, NXRT purchased Sedona at Lone Mountain in Las Vegas, Nevada for $73.25 million. Management identified an opportunistic high-growth acquisition in a long-term market. The strategy involves deploying accretive value-add capital to normalize economic occupancy and expand operating margins through targeted demand generation, interior and amenity enhancements lifestyle upgrades and disciplined execution ultimately driving asset appreciation and outsize returns recent large-scale developments have driven significant expansion job growth and residential revitalization in north las vegas which is now the las vegas valley most prominent industrial market over 15 million square feet of industrial space is currently under construction or planned supporting the creation of 8 000 new jobs in the market as a reminder we intend to improve economic occupancy by approximately 900 basis points over four years while upgrading 182 units and installing smart home technology throughout the community driving a 7.2 percent NOI CAGR through 2029. Now turning to 2026 guidance. As Paul said, we were guiding between two and a half percent decline and a 1.5 percent increase in same-store and OI growth for 2026 with the midpoint projecting a 50 basis points reduction year-over-year. Our 2026 guidance includes the following assumptions. A 90 basis point rental income growth at the midpoint, forecasting 93.4% to 94.1% financial occupancy, with peak occupancy modeled for Q3, with a more normal seasonal demand and performance expectation for the year. A negative 30 basis point earn-out from lease trade-outs and a gain-to-lease inversion in 2025. A positive 1.2% market rent growth in 2025, with roughly 40% realized this year, predominantly in the second half of the year. A positive 40 basis point top-line growth attributable to ROI capex spending is detailed further hereafter. Flat economic occupancy at 91.8% at the midpoint, 30 basis points lower vacancy costs at the midpoint, 93.7 versus 93.4 for the prior year. We're stabilizing bad debt at approximately 80 basis points with a range of 70 basis points to 90 basis points, down more than 75% from peak pandemic-era payment behavior. And then flattish concession utilization at 71 basis points to GPR, heavily weighted in the first half of the year. We're assuming 1.1% total revenue growth at the midpoint, driven by modest rental income growth expectations I just went over and mid-single-digit other income growth. Turning to expense guidance, we're assuming 6.4 controllable expense growth at the midpoint. 80% of this growth is attributable to bulk increased Wi-Fi contract costs that have a direct revenue offset. We're assuming down 1% R&M and turn cost growth with turnover and interior R&M is expected to decrease 375,000 or 8.4% due to effective cost management and an increased volume of renovations. 2026 we're assuming two percent labor growth the continuation of our rollout of ai technology and centralization of operations contribute to modest labor growth we see optimism optimism in outperforming our midpoint as we further implement agentic ai strategies and maintenance potting across our markets we're assuming a 7.4 growth in advertising and marketing expense and just a 10 basis point growth in gna expense we're assuming total expense growth to 3.5% at the midpoint, which is a 4.5% increase in the utility expense slide item, a 2.1% insurance premium reduction, assuming a 0-10% renewal on April 1st of this year. For that, our team, including Paul here, were recently meeting with the markets in both London and New York, and we're optimistic we'll achieve another favorable outcome for the program with this 2026 renewal. On the real estate tax expense growth side, we're assuming a positive 4.4% growth. Real estate taxes make up 31% of the 3.9 total expense increase at the midpoint and are expecting the band of real estate taxes to increase from 2 to 8% across the portfolio. And, of course, we will protest and litigate outsized value assessments vigorously throughout the year. On the value-add side, we continue to be an internal growth business at our core, and to that end, our guidance includes the following assumptions regarding our value-add programs, which remain aligned with our historical 15 to 20 percent roi targets we expect to accelerate value add capex deployment toward the back half of 2026 and into 2027 as our sub market see net demand and occupancy pricing power improves for landlords we're assuming approximately 300 full interior upgrades in the average cost of 16 500 per unit and generating a 240 average monthly premium we're assuming approximately 400 partial interior upgrades at an average cost of 3 500 per unit generating a 70 average monthly premium these partial upgrades include varying varying bespoke additions such as new stainless steel appliances hard surface countertops updated tub enclosures and private yards among other aspects these partial bespoke rehab initiatives are strategically tailored by property to drive rate growth where we see opportunities among competing properties blended roi expectations here are the low to mid 20s and if market conditions allow we have identified another 1500 bespoke upgrades across the portfolio with double digit rois finally we also plan to install 680 washer dryer installed at an average cost of 1200 per unit generating a 54 monthly average premium or 54 percent return on investment now turning to summarize uh the our outlook for the 2026 year basically we like what we own we believe affordable residential assets and well-located suburbs and the top job growth and net migration markets in the country will outpace demand over the near term our markets are business friendly with the continued and persistent tailwind of factors pointing towards sunbelt growth you name it we have it taxes weather business climate jobs investment and physical and digital infrastructure. Indeed, many signs for growth were already pointing to the Sunbelt, and we believe still are. In underpinning our guidance for the year is cautious optimism. We think the Sunbelt multifamily market is approaching its long-awaited inflection point. After absorbing the largest supply of weight since the 1980s, with completions peaking at almost 700,000 units in 2024, a 54% increase from 2021 baseline completions, we are optimistic that new lease growth is set to turn positive across most sunbelt markets in the second half of this year with sharp acceleration into 2027 reasons for our belief include persistent structural demand the cost to own a home is three times more than to rent an apartment in our markets a 60 decline in new market rate deliveries from the peak and construction starts running approximately 70 70 below their 2022 peak locking in a multi-year supply trough weighting each nxrt market by unit exposure the portfolio level to jobs new construction unit ratio bottomed at approximately one and a half jobs to one unit of new delivery in mid 2025 and our entire portfolio is projected across back above the historically significant ratio of four jobs to one unit by q1 of 2027. However, the recovery is highly asymmetric. Roughly 35% of our portfolio, South Florida, Las Vegas, and Atlanta, is already at or approaching equilibrium, while 44%, including Phoenix and DFW, won't reach that threshold until 2026. But for example, South Florida, or 21% of our NOI, has an adjusted BLS non-farm payroll divided by the costar and yardy delivery ratio of seven and a half jobs to one unit well above the equilibrium atlanta or twelve and a half percent of an oi just crossed back over five to one and given that supply is now relatively muted over the near term the key variable is whether sunbelt job growth and debt migration can maintain its recent pace if it can the supply cliff now baked into every nxrt markets pipeline creates the conditions for a sharp and synchronized recovery in the second half of 2026. Another reason for optimism is the demographic profile of our renter population. We do believe in AI and it will have a near-term chilling effect over entry-level white-collar jobs. But today, the NXRT average renter is largely blue-collar, 38 years old, with a household income of $90,000 per year, not really the AI bullseye. Furthermore, advances in health and wellness are adding longevity of the population, creating somewhat of a demographic backstop to demand. The 65-plus population is growing at 3% to 5% across NXRT markets, and Harvard JCHS projects the senior renter population to double, from 5.8 million households to 12.2 million households by 2030. While, obviously, a senior housing tailwind, we're starting to see sizable signs of this trend in our own revolts. So, in closing, and though the last few years have indeed been difficult, we're optimistic that new lease inflection will happen in the Sunbelt this year for the vast majority of our portfolio. In the meantime, we will continue to do all that we can to utilize technology to become more efficient, drive value-add programs, and ultimately drive value for our tenants and our shareholders. That's all I have for prepared remarks. Thanks to our teams here at NextPointBH for continuing to execute. And with that, we'll turn the call over to the operator for questions.
Operator
At this time, if you would like to ask a question, press star, sending number one on your telephone keypad. To withdraw your question, simply press star one again.
We'll pause for just a moment to compile the Q&A roster. your first question comes from the line of amateo akosanya with deutsche bank please go ahead uh yes good morning everyone um first question around the refurbishment and remodeling i think you mentioned that in 2026 you're going to do about 400 of those and then you do like 600 washer dryer uh installation so that's like a thousand altogether versus i think in 2025 it is about 1800 total volume just kind of curious why uh you kind of have the drop especially as you're
talking about you know they could still do another 1500 you know if uh if market conditions allow yeah it's bad uh good morning i um maybe i didn't um come across uh or or uh you misheard of the categories so the plan is to do um 300 full upgrades across the portfolio an additional 400 partials um and then roughly uh yeah and so i think that was the delta but we're ending up basically at the same place about 1700 units and then as you know if we're um you know if what we believe will happen happens then we'll be able to drive this those incremental bespoke upgrades that
mentioned that they can't reach up to 1500 additional units that's awesome uh unhelpful and then in regards to the interest rate swaps uh again a few years ago you guys kind of successfully uh uh negotiated uh some of these swaps and kind of came out ahead with some lower rates uh just kind of curious as you kind of think about 26 uh how you kind of see that playing out this time around, especially when, again, you do kind of see rates have been coming down at least to start the year?
Yeah, great question, Tayo. This is Paul. So, yeah, we look at 26 and what the swap market's pricing, you know, a three, five, seven-year swap, and it just isn't taking in what we fully expect on the rate cut side. If you look at the current Fed dot plot, the dispersion is extremely interesting. You have a deeply divided committee with 175 basis points of actual spread with Mirren at the bottom end at two and one eighth percent. And you have a few multiple hawks that are pricing in zero rate cuts this year. You have three dissenters this past meeting. So it's a really deeply divided dot plot, which is affecting swap markets and not really pricing what we truly believe will be at the end of the year with rate cuts. So we're holding tight right now um on putting and layering in additional swaps but again this can change in in a moment's notice so it's a constant daily um you know recheck and refresh of those rates to see if they're you know hitting what we believe to be kind of two and a half to three three rate cuts for the year and you know we're i'm a little more bullish too on that too so it's it's just a constant uh refresh and remodel of our models and when we want to layer in additional swaps for the year to layer in behind the ones that are burning off here uh in q uh q3 q4 this year gotcha thank you your next question comes from the line of buckhorn with raymond james
please go ahead hey good morning guys um just wondering if you could give us any updates on either january and or february trends uh since quarter end in terms of new renewal blended lease rates just occupancy and any additional color on how uh early spring leasing has gone Hey, Buck, good morning.
It's Matt. January, new leases were down 7%. Renewals were 1.6 for a blended minus 2.6 or 2.7 or $40 tradeout. February is better and getting better and firming. The new leases were down 5.7 percent and renewals were up a positive 1.7 percent for a blended negative 1.8 percent. And again, we're seeing pretty positive trends on the renewal side too, so on the trend.
Gotcha. Gotcha. Appreciate the color there. And then I think secondly, my other question was on CapEx and maybe potential CapEx spending for the upcoming year. Looks like the trend in both kind of the recurring and non-recurring maintenance CapEx numbers still trending above normal or above trend line historically. You know, what were some of the key drivers for that this year?
And then how are you thinking about total CapEx spending for this coming year? yeah on the on the maintenance side um i'll kick that to bonner but some of the outsized things that we're doing um are um the uh you know the bulk wi-fi on the resident amenity side which again has a direct offset so um that's that's kind of elevated um the numbers but again the net effect of that is um is minimal on the um on the income statement bonner do you have anything that on the Venus side yeah so our 2026 outlook and relative that you know 25 you see you know 2025 we had a little bit of a pickup and interior rehab spending we had less of the exterior and
common area this year post you know refinancing the portfolio that's a 2.2 million in 2024 there was some more major projects there so I think outside outside the Sedona acquisition There is about a million bucks of exterior work to do there. The capitalized rehab should be pretty stable year over year. And I think that same for the capitalized maintenance, the recurring and non-recurring. We're certainly looking to control those expenses, understand that's roughly 30 million bucks for the full year 2025. I think that we've seen some price easing. We're certainly being thoughtful about that as a team. And, you know, as Matt has mentioned, we kind of have a strategic approach here where, you know, pricing power is going to dictate the volume of renovation output for the year. So, if we can get healthy tradeouts that justify the spend, we'll see a little bit higher spend, probably more in line with 2025. But if we're not getting to the, you know, the tradeouts that we need, the ROIs that we want, we may look to skinny that down a bit.
All right. your next question your next question comes from the line of michael lewis with truest security please go ahead great thank you um maybe this question kind of logically follows after talking about capex um when when we subtract capex from your affo calc it looks like the dividend isn't covered i know you recently um raised the dividend this is always a tough i realize it's a board decision it's a hard question to answer but as you look forward to 26 i mean do you think the dividend is covered by cash flow and maybe just kind of remind us of what the dividend policy is
uh yes the dividend is covered by cash flow and it's a target ratio 65 to 75 percent of core ffo okay okay and then i wanted to ask you know you gave a lot of great data about supply and demand really detailed.
The occupancy for 4Q was a little lower than we expected. I was wondering if it was lower than you expected and, you know, how you're kind of managing pricing versus occupancy, you know, right now where we are before we kind of get to that inflection whenever it comes.
Yeah, that's a great question, Michael. It is lower than we expected, but it was somewhat intentional so um you know concession utilization uh it has was increased over the over the fourth quarter um and into january it's abating somewhat in february but we reluctant to utilize you know more than a month of concessions you know on um particularly when we you know believe pricing power will significantly increase over the year and also didn't want to look you know look to lock in a negative 12-month, you know, earn in and cannibalize what we believe is a, you know, an inflection year. You know, we truly believe that on a deal-by-deal basis, largely for the vast majority of our portfolio and, you know, not, you know, jumping up and down happy with 92.7%, but the good news is our first quarter guidance is at 93%. So, you know, I think we're, you know, think we're on track to hit that and hopefully we'll capture some of this inflection.
Operator
Your next question comes from the line of Linda Tsai with Jeffries. Please go ahead.
Hi, thanks for taking my question.
In terms of your comment on the senior renter population doubling by 2030 and that you're seeing sizable signs of this trend in your markets, can you delve into this comment more and then you know would you start to amenitize your properties any differently based on an aging population um yes again great question we're seeing it because our average age is ticking up um and we're just getting you know anecdotally um from the sites especially in um you know the sunbelt and particularly in florida for um you know for resident amenities um that cater more to the senior housing population it's something that we've you know, I guess, you know, taken notice of as, you know, Welltower and the others catch a really good bid and believe in the, you know, this demographic backstop, as I mentioned in my preparing remarks, we do believe this trend. We think AI is going to, you know, be positive for GDP growth ultimately and have, you know, people when, you know, when they live longer and, you know, make more money, they want to invest in their health and entertainment. And so we are, you know, actively looking to resource our portfolio designed to, you know, to cater to health and wellness and entertainment. And I think that those things will, you know, produce a wider demand funnel than what we've historically been used to and catering to blue collars. And so there's no reason in our portfolio why we can't attract, you know, in Richardson, Texas, a well-located suburb outside of Dallas, some empty nesters that want to be closer to their kids that go to SMU, for example. So I think that that trend will continue, particularly in the Sun Belt, particularly in our markets, and just follow the same net migration trends as we've seen over the last five years.
Are you seeing new renter income from the older population increasing?
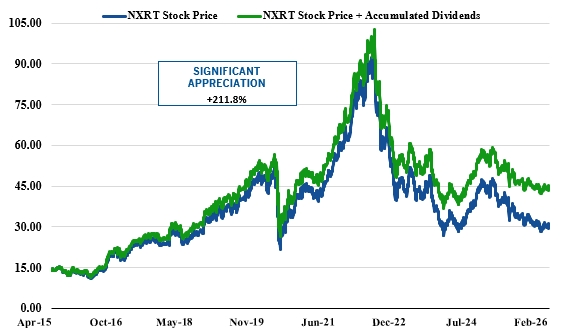
Yes, indeed. And that's adding to both of our, you know, both our age and our average household, you know, demographics. When we started this company, you know, 11, 12 years ago, you know, our average renter was, you know, 28 years old and, you know, made $60,000 a year. so we're increasingly catering i think to a purpose-driven renter um and you know it makes sense the aging population they want less yard when they want you know more amenities they don't want to deal with you know maintenance themselves and um they want to travel so um we like that trend we're going to play into it and i think we have the portfolio to take advantage of it thanks and then just one guidance question it doesn't seem like your guidance incorporates buybacks are you still considering buybacks in 26 yeah we are um we'll always consider them i i think that um you know we we the sedona deal uh was important because we liked um you know we like the ability to take that cap rate from a five seven going into a seven and a half and that was you know one off opportunity and those opportunities will always will always do but in the meantime you I think if we do sit at a stock price sub-30 and a 6.6 implied cap rate and we stay here for a while, I think you'll see us buy back some stock. That being said, I really do believe that this year is the year that we will inflect and I think stock prices will follow that upwards in the second half of the year.
Operator
Thank you. That concludes our question and answer session. I will now turn the call back over to management team for closing remarks.
Thank you for all your time this morning. I appreciate everyone's, again, time and attention and look forward to speaking to you next quarter.
Operator
Ladies and gentlemen, this concludes today's call. Thank you all for joining. You may now disconnect.