Operator
Welcome to the Simpson Manufacturing Co-incorporated Second Quarter 2026 Earnings Conference Call. At this time, all participants are in a listen-only mode. A question and answer session will follow the formal presentation. If anyone should require operator assistance during the conference, please press star zero on your telephone keypad. Please note this conference is being recorded. I will now turn the conference over to Kim Orlando with Investor Relations. Thank you.
You may begin. good afternoon ladies and gentlemen and welcome to simpson manufacturing company's second quarter 2026 earnings conference call any statements made on this call that are not statements of historical facts are forward-looking statements such statements are based on certain estimates and expectations and are subject to a number of risks and uncertainties actual future results may vary materially from those expressed or implied by the forward-looking statements We encourage you to read the risks described in the company's public filings and reports, which are available on the SEC's or the company's corporate website. Except to the extent required by applicable securities laws, we undertake no obligation to update or publicly revise any of the forward-looking statements that we make here today, whether as a result of new information, future events, or otherwise. On this call, we will also refer to non-GAAP measures such as adjusted EBITDA, which is reconciled to the most comparable GAAP measure of net income in the company's earnings press release. Please note that the earnings press release was issued today at approximately 4.15 p.m. Eastern Time. The earnings press release is available on the Investor Relations page of the company's website at ir.simsimmfg.com. Today's call is being webcast, and a replay will also be available on the Investor Relations page of the company's website. Now, I would like to turn the conference over to Mike Oloski, Simpson's President and Chief Executive Officer.
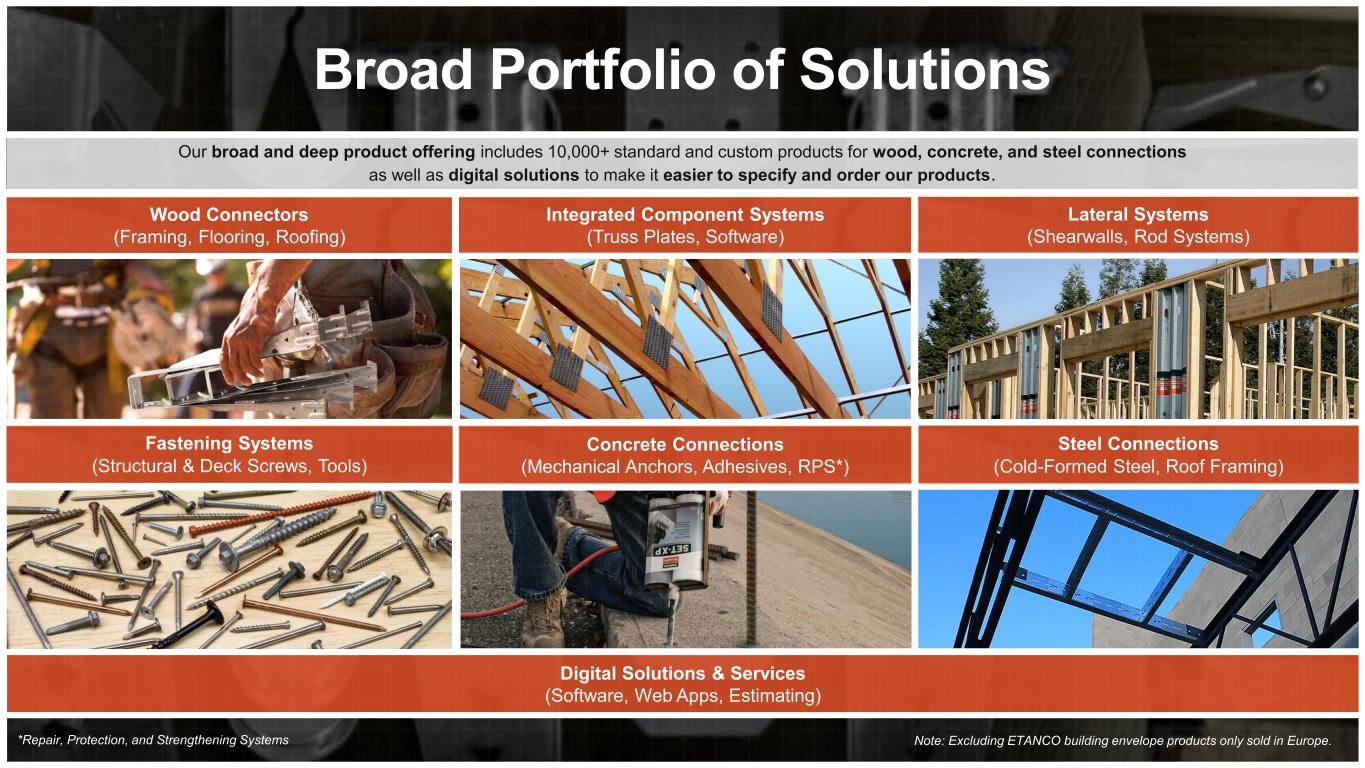
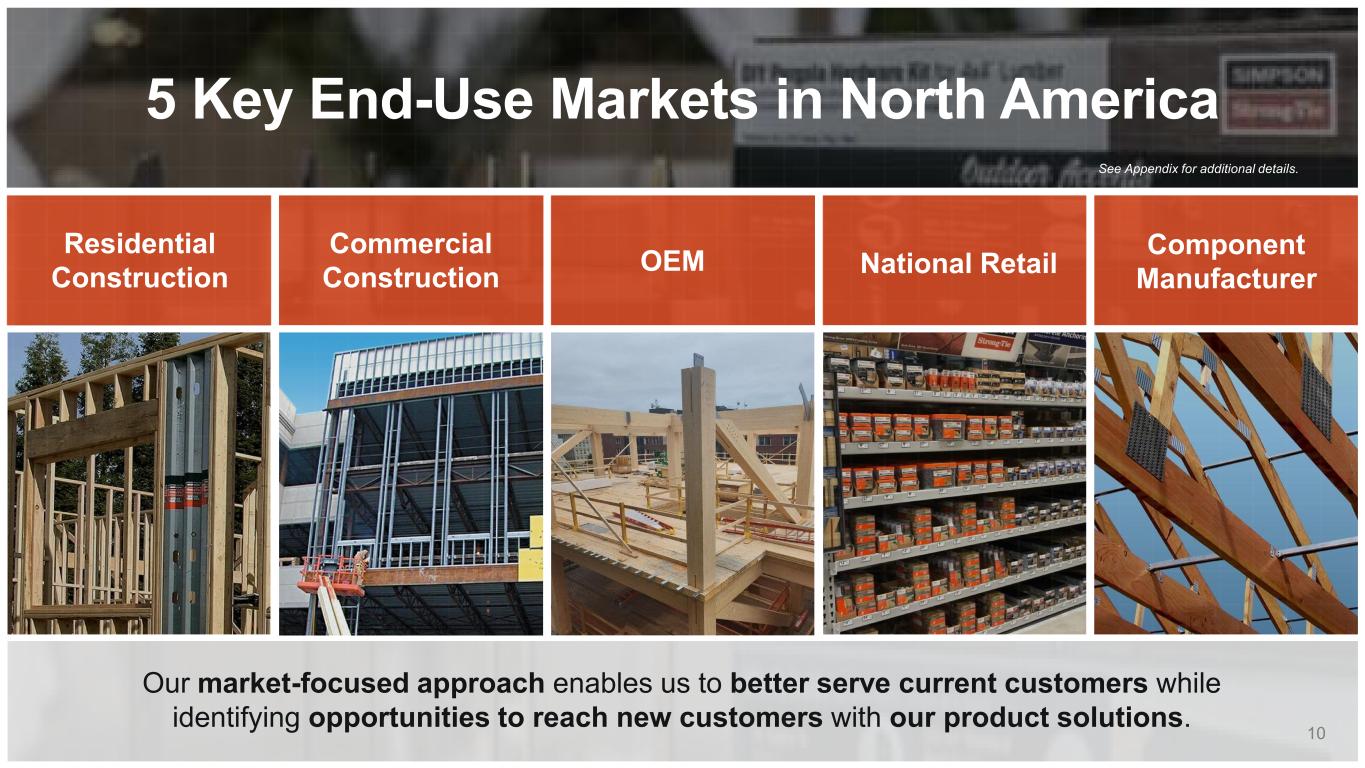
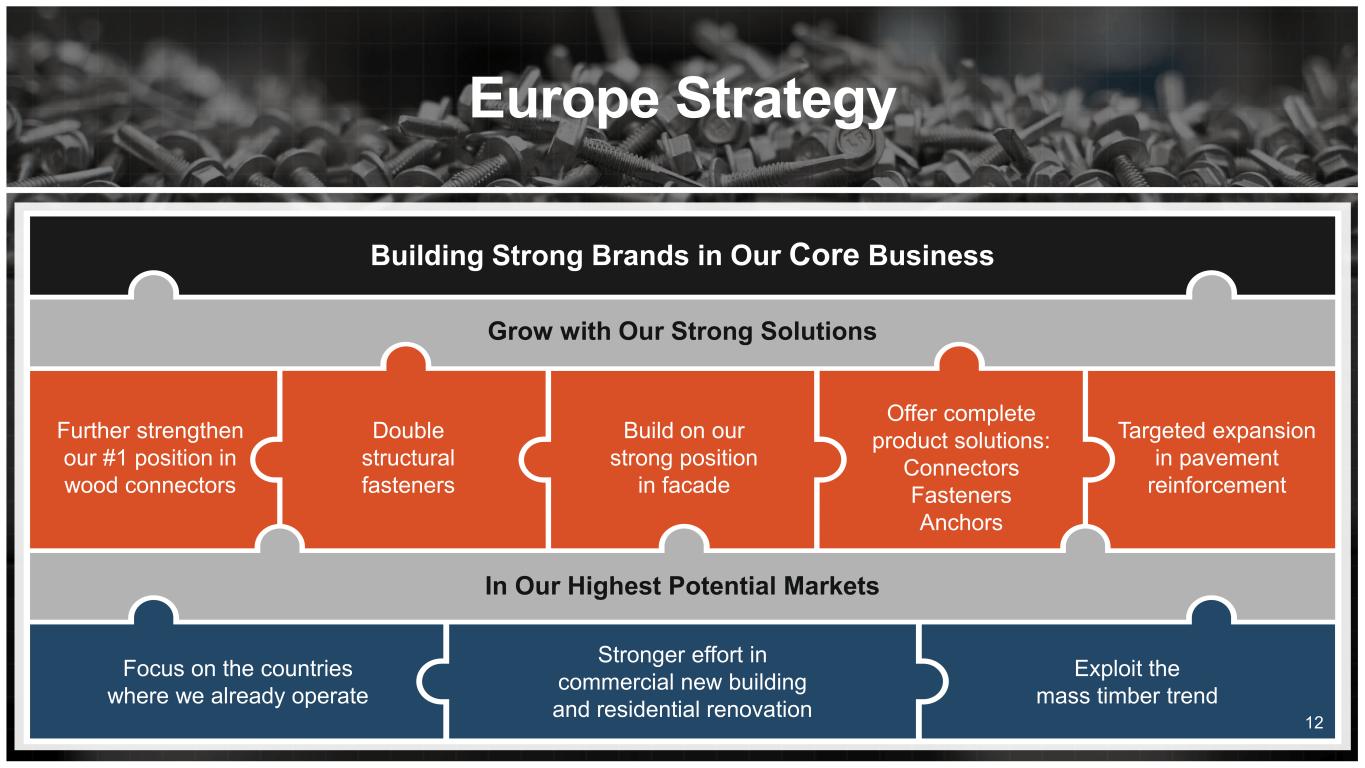
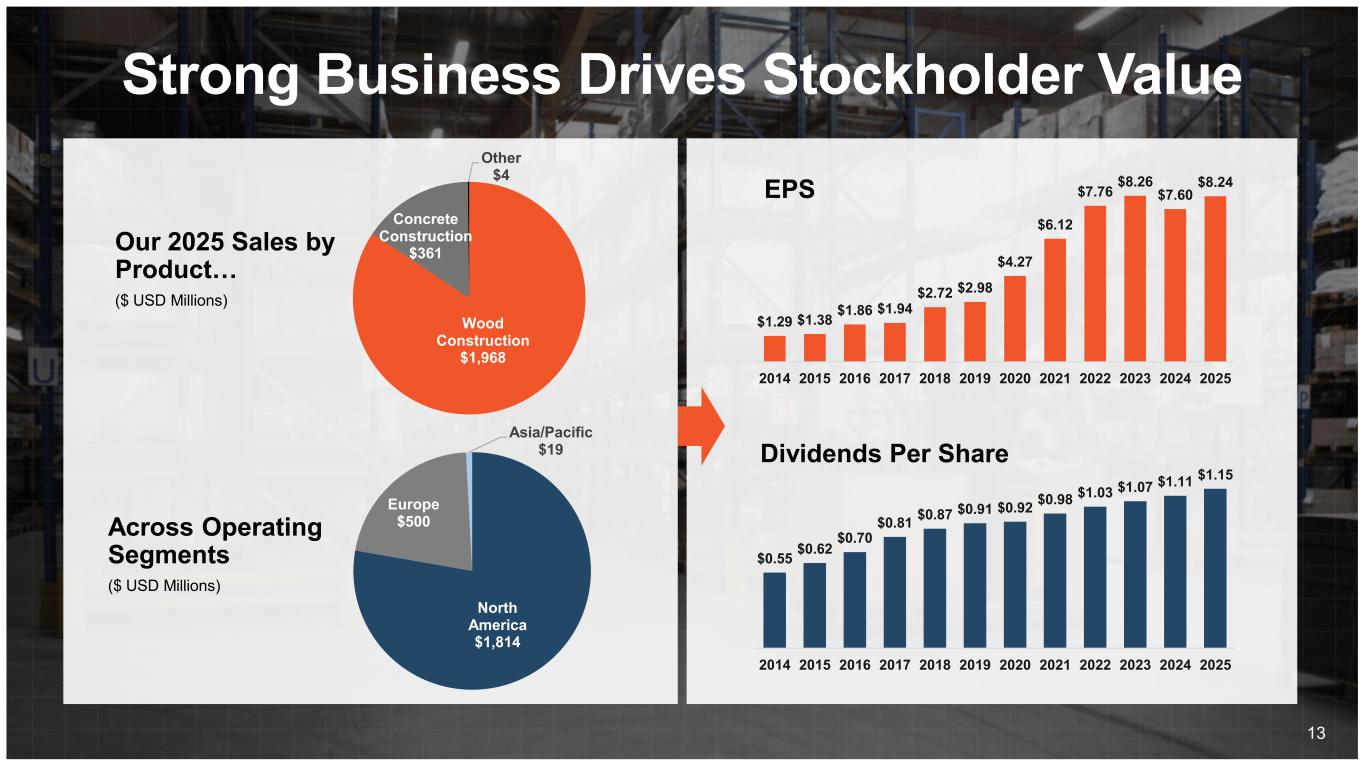
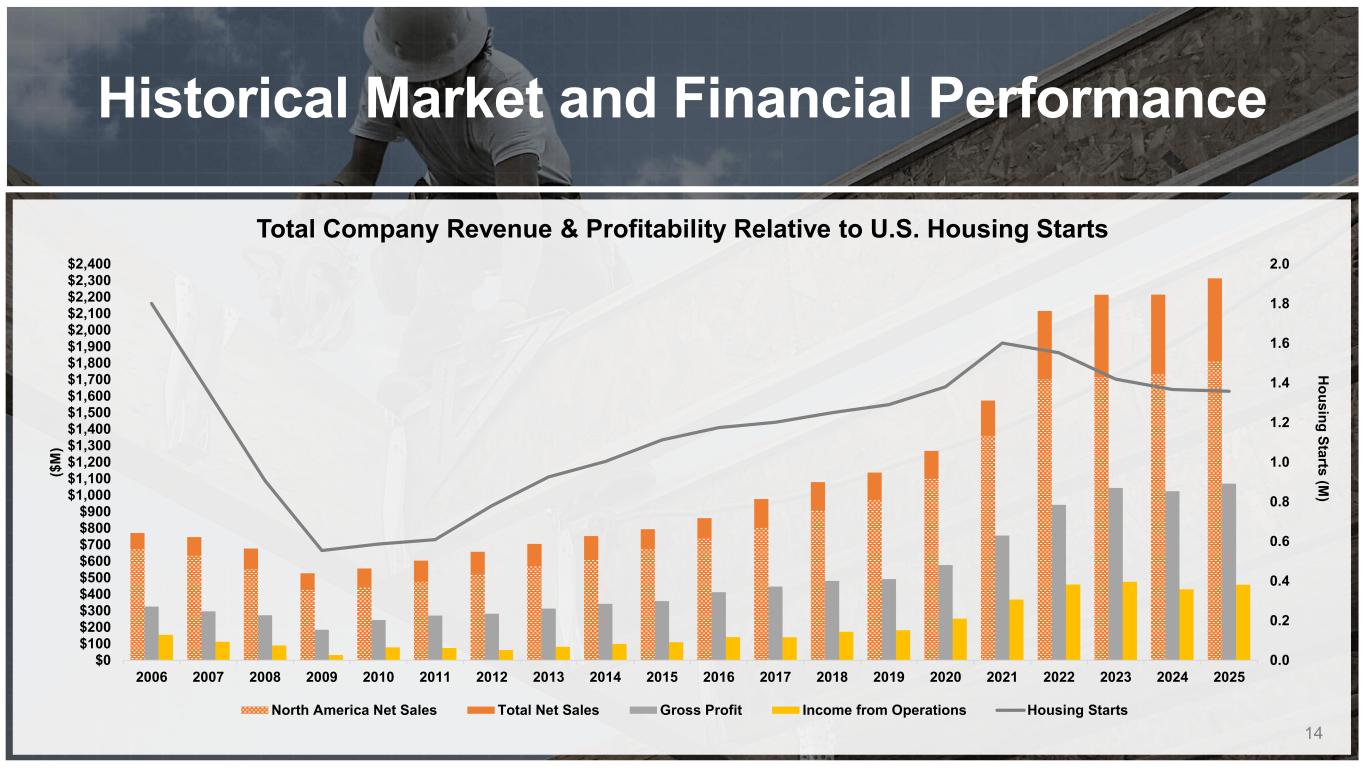
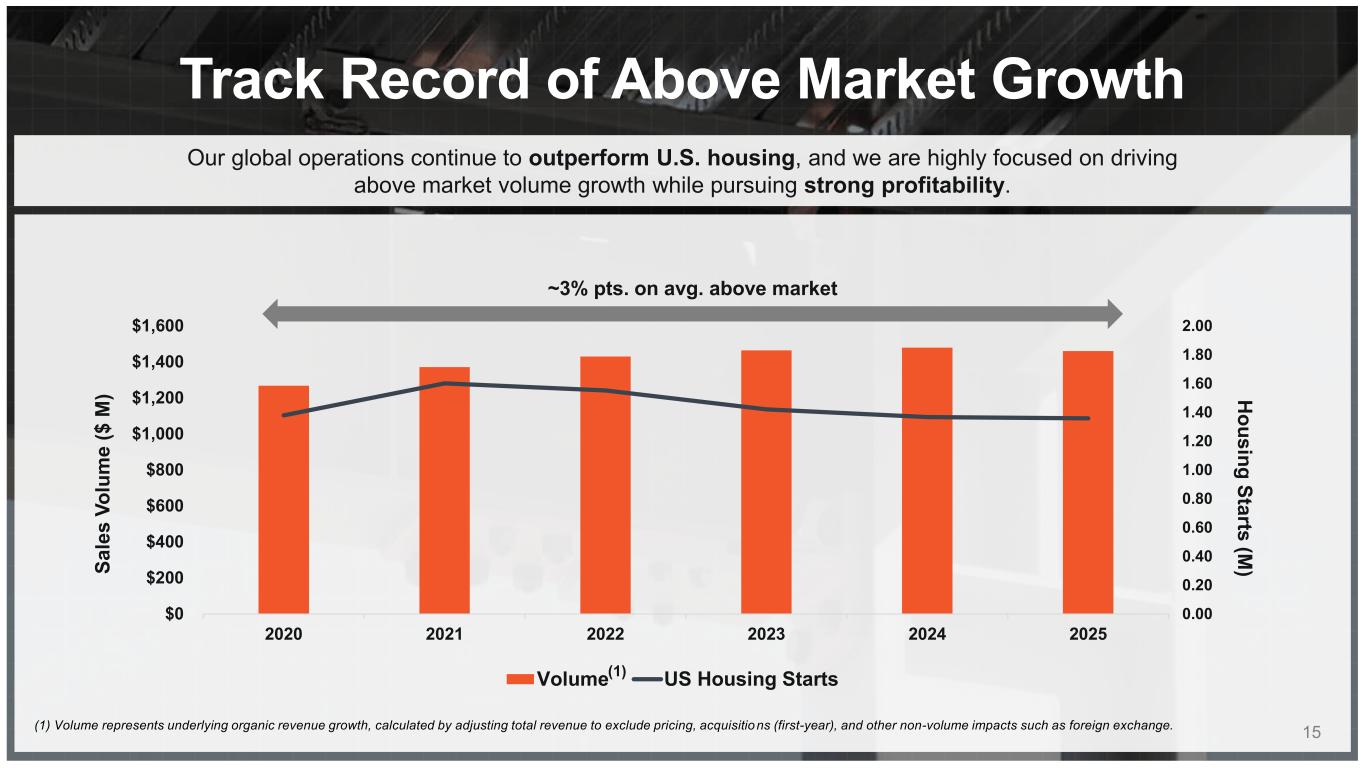
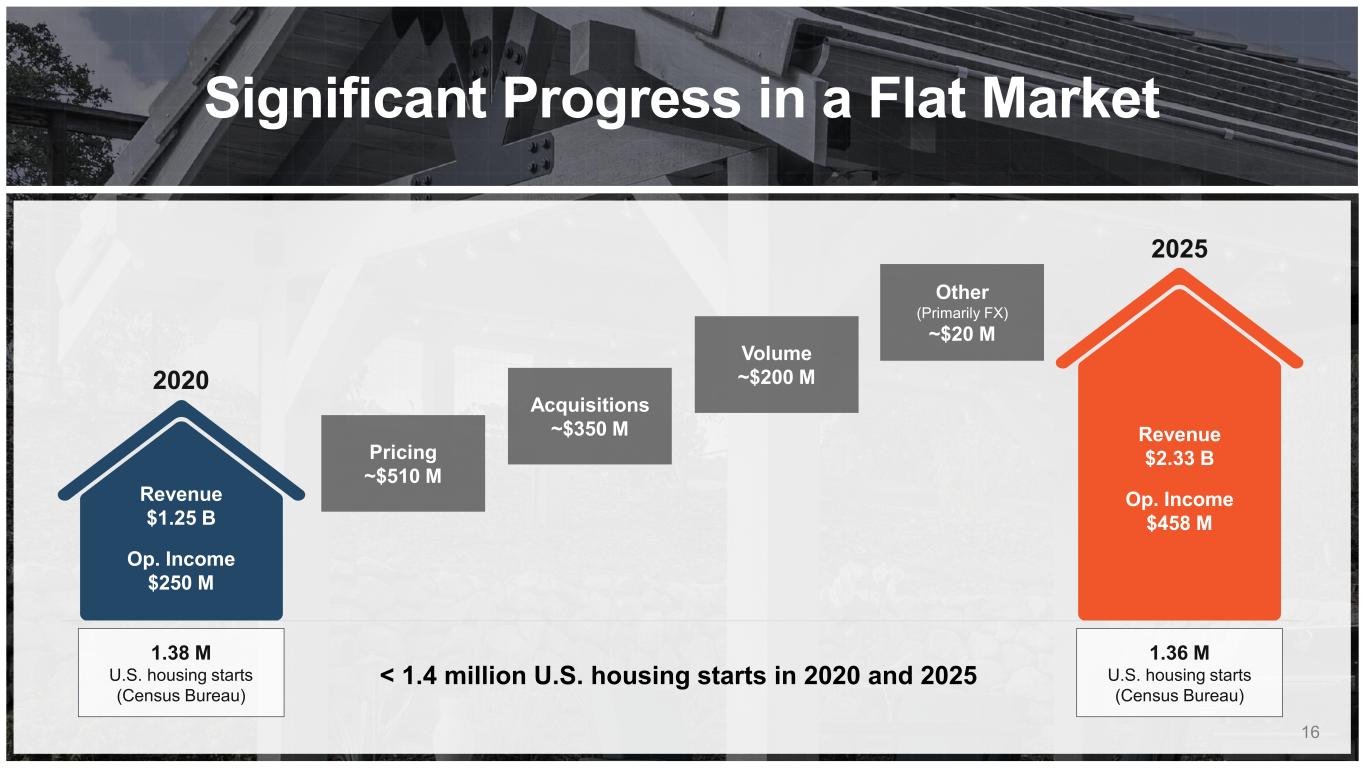
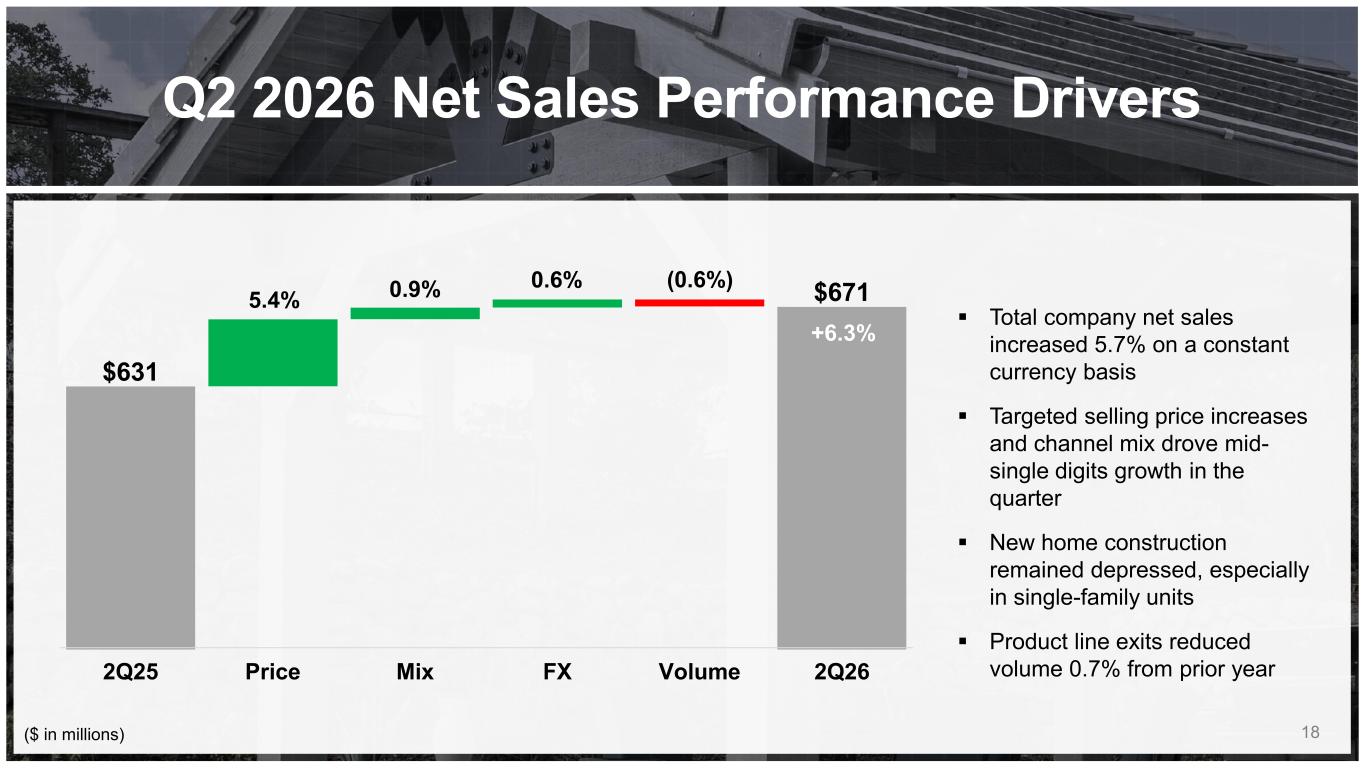
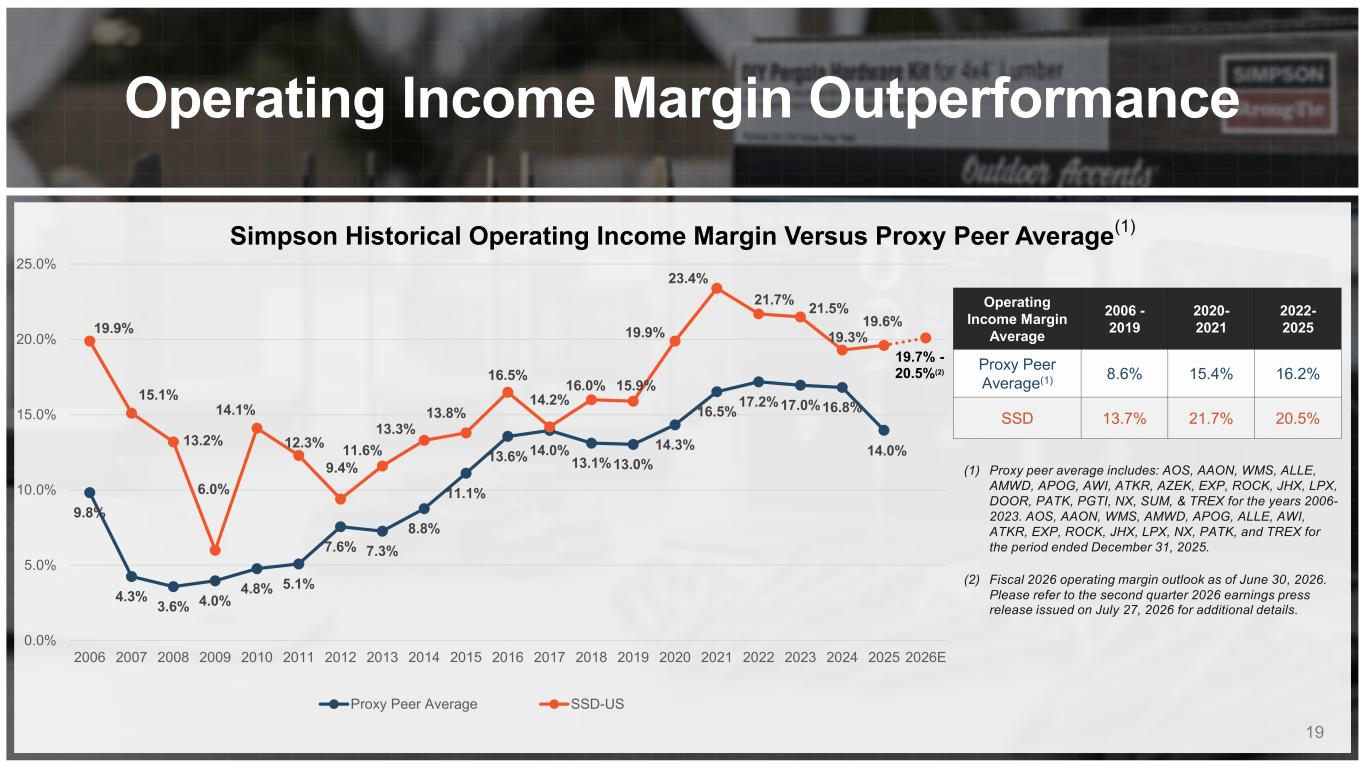
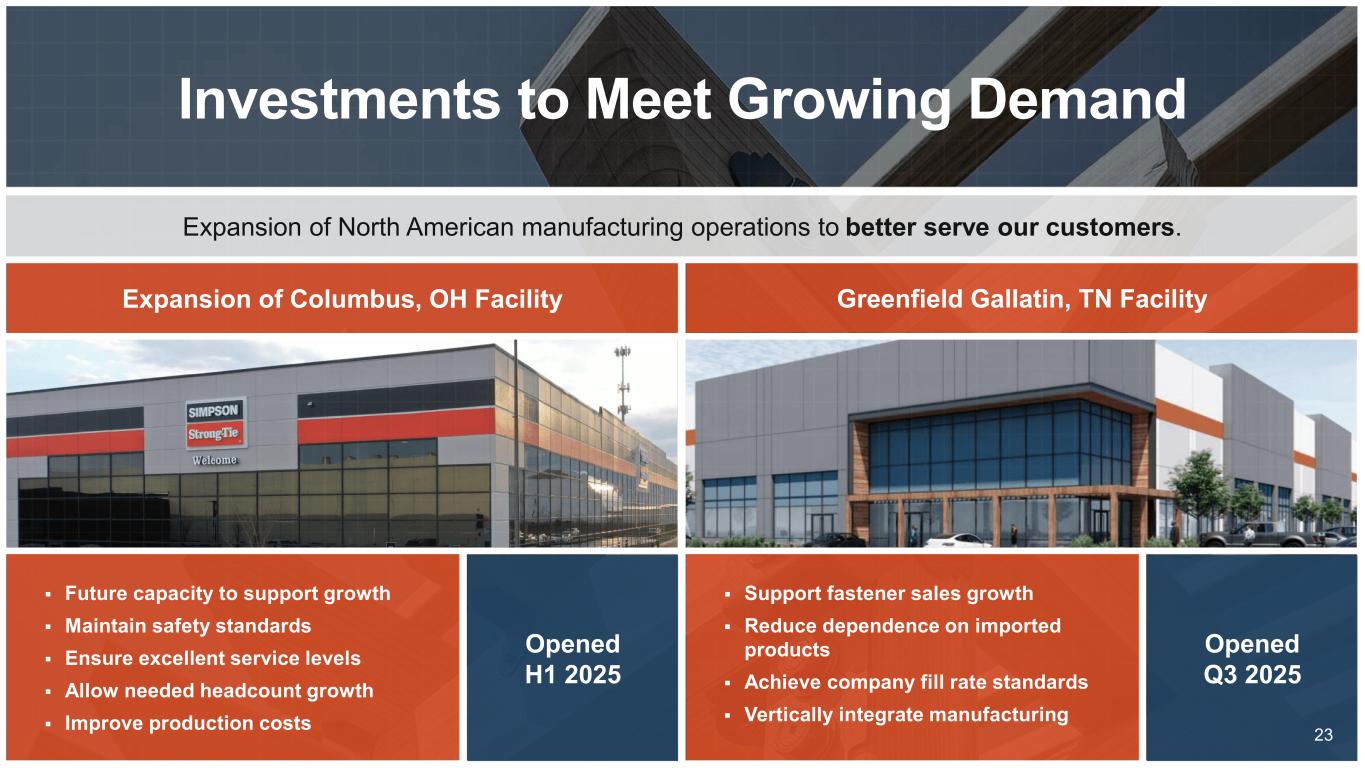
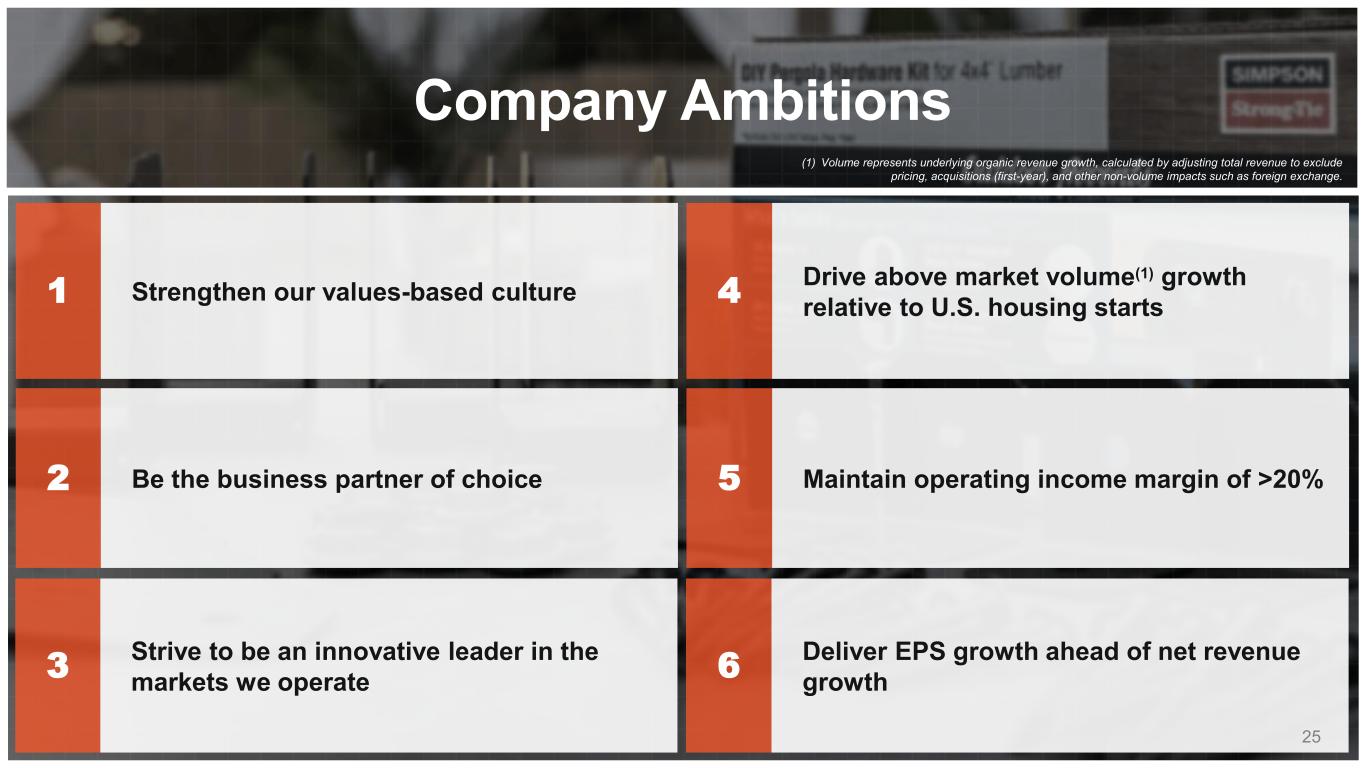
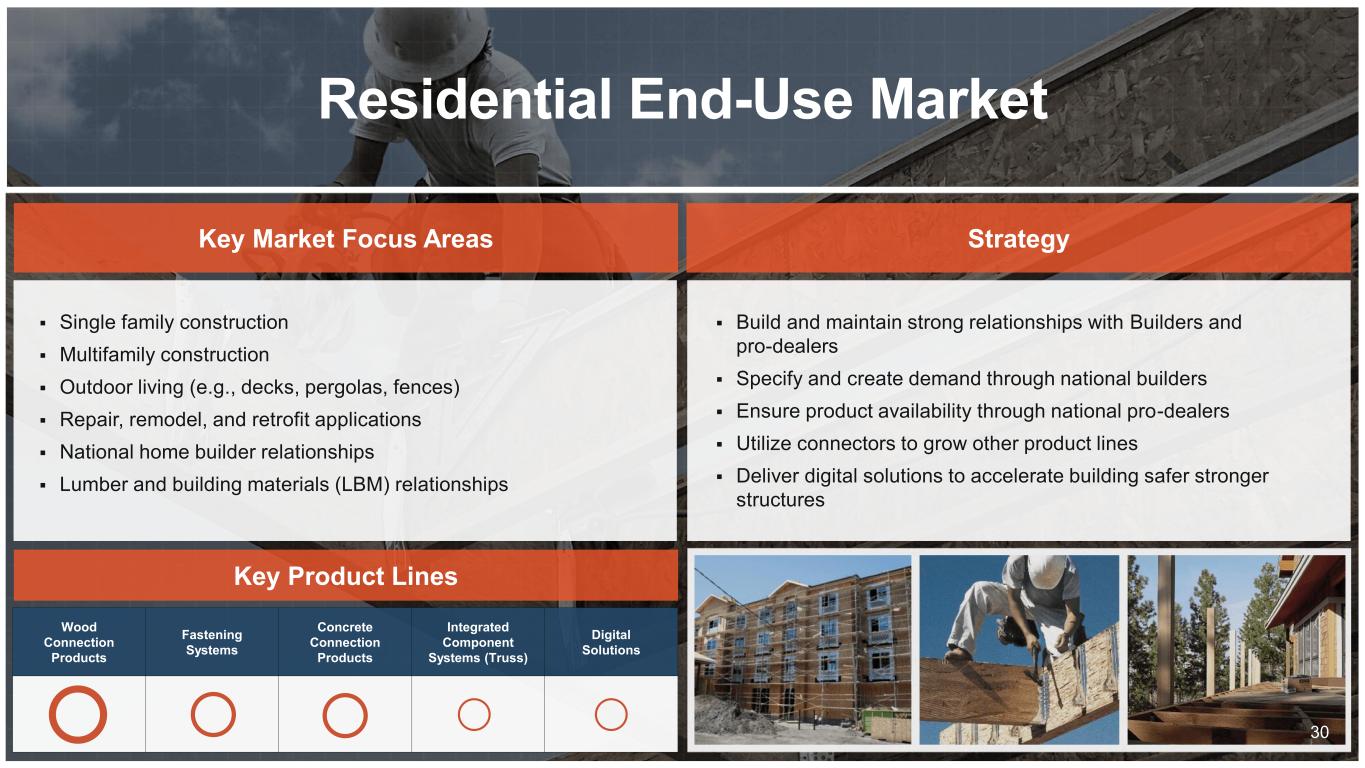
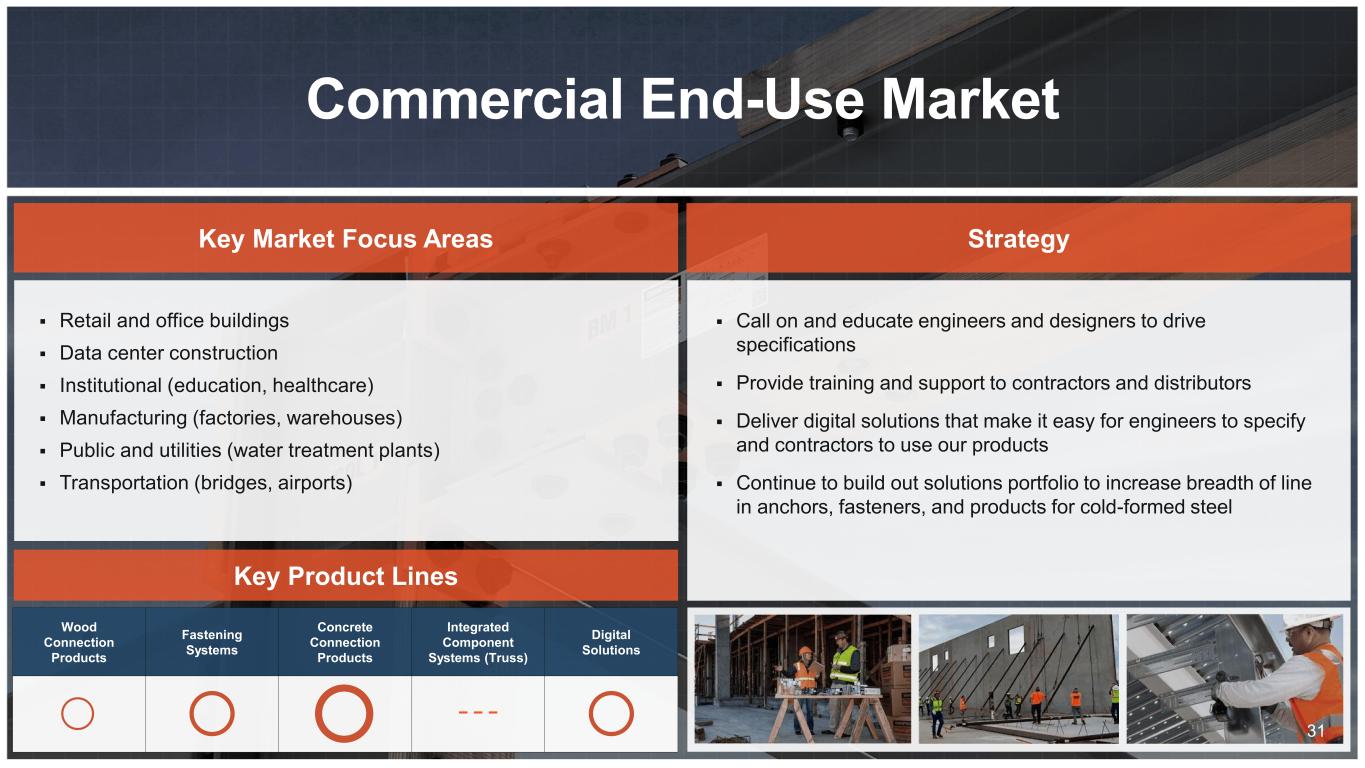
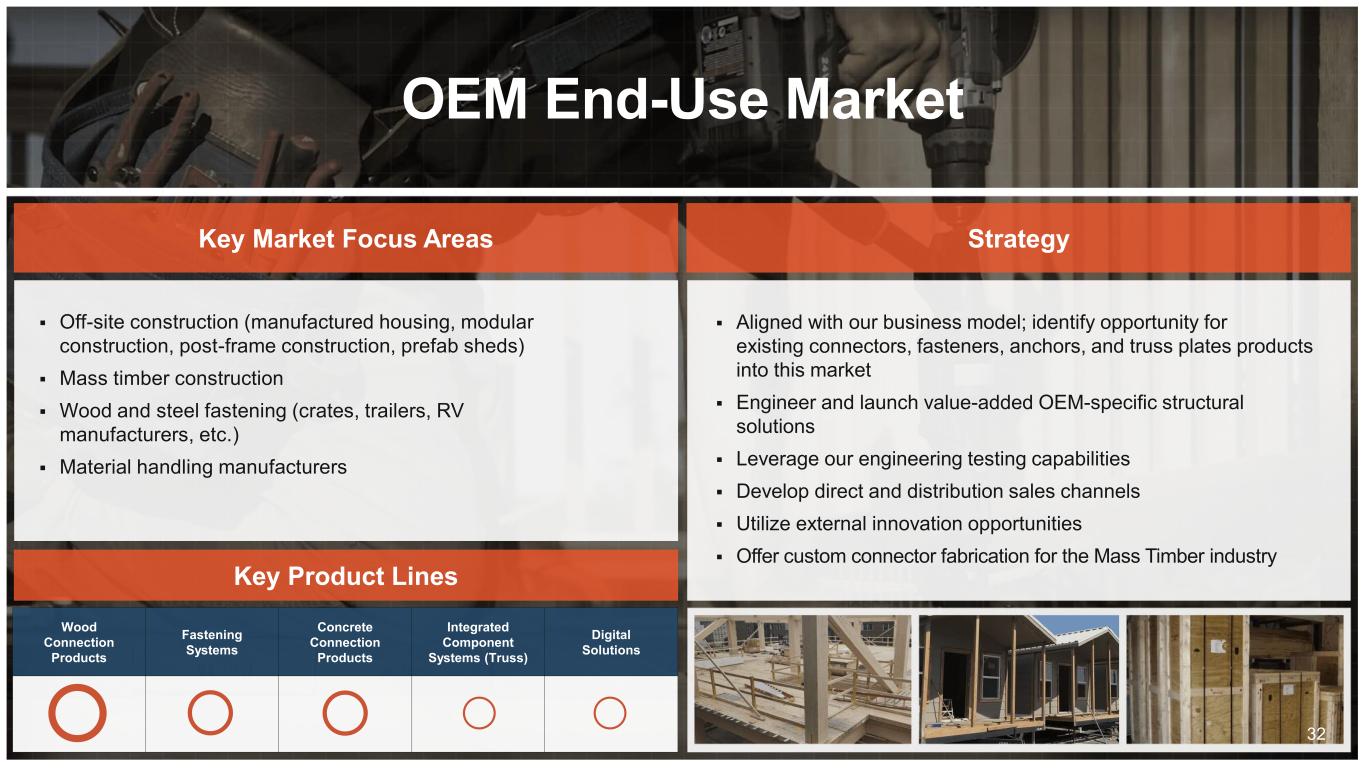
Thanks, Kim. Good afternoon, everyone, and welcome to today's call. With me is Matt Dunn, our Chief Financial Officer. Before turning to the quarter, I'd like to briefly discuss our results in the context of the strategic priorities that continue to guide our decisions and shape the way we manage the business. Across the organization, we remain focused on deepening our position as a partner of choice for our customers, driving innovations in the markets we serve, and strengthening our values-based culture, all while continuing to deliver solid financial results. Despite ongoing market challenges, we are making solid progress advancing our strategic priorities. One of the defining strengths of our culture is the experience and long-term commitment of our people. As we mark our 70th anniversary, that continuity is especially meaningful. It speaks to a company that has evolved and performed through multiple cycles while staying grounded in a consistent set of values. Throughout the year, we'll continue recognizing employees whose careers reflect that legacy. I'd like to take a moment to highlight a few of them. First is Dean Pickrell, a project manager for Southeast Operations, celebrating 40 years with Simpson. Dean began his career as a fabrication operator at our McKinney, Texas, manufacturing facility and has held a variety of roles across manufacturing operations. Today, he is a trusted subject matter expert, supporting product launches, training programs, and key operational initiatives. His deep experience and institutional knowledge continue to play an important role in ensuring consistency, quality, and execution across our business. Next, I'd like to recognize Gwen Silva, an inside sales representative for our Northwest operations, celebrating 47 years of service. Gwen began her career in 1979 mailing catalogs and has spent nearly five decades serving our customers across inside sales and customer support. Her tenure reflects not only a deep understanding of our business and customers, but also the resilience, commitment, and adaptability that have remained essential as our company has evolved over time. Finally, I'd like to recognize Bill McGahan, our regional sales manager for our national retail market segment in the Northeast. celebrating 42 years with the company. Bill was the first employee hired when our Columbus facility opened and has served in a variety of sales and sales leadership roles throughout his career. He is known not only for his passion for our customers and our people, but also for the countless employees he has encouraged, mentored, and championed along the way. As he prepares for his retirement in October, we recognize the lasting impact he has had on our growth and his steadfast commitment to the values that continue to guide our company today. These are just a few examples of the many employees whose experienced leadership and commitment continue to shape our performance, and we appreciate the contributions they make every day. Now turning to our financial results, we delivered net sales of $671.1 million, up 6.3% from the prior year quarter. As outlined in our investor presentation, net sales growth was primarily driven by our 2025 pricing actions, which contributed approximately 5% of the increase. Sales mix and foreign exchange each provided an additional 1%. These gains were partially offset by an approximate 1% decline in volume, resulting from a softer Over the last 12 months, our global volumes declined by 1.6%, 100 basis points below the 0.6% decline in U.S. housing starts. Of note, we exited some business in 2025, which negatively impacted our global year-over-year volume comparisons by 30 basis points on a trailing 12-month basis and 70 basis points in Q2-2026. In North America, net sales were $522.3 million, up 6% from the prior year quarter, including an approximate $30 million benefit from pricing actions. Results across North America varied by market segment and region, consistent with the broader construction trends. We saw encouraging results in key strategic growth areas underscoring the strength of our business model, innovative solutions, and trusted customer partnerships. The component manufacturer business delivered a solid quarter with volumes of bid single digits year over year. Growth was primarily driven by continued new customer wins and capturing a greater share of the total connector spend from existing customers. We secured meaningful conversions during the quarter with encouraging interest in new equipment. Customers continue to prioritize labor efficiency, throughput, and operational visibility, underscoring the value of our integrated platform of software, plates, equipment, and design services. While activity remains uneven in certain markets, and customers tied more closely to single-family starts remain cautious, adoption of our solutions continued to advance, further strengthening our position as a strategic partner to component manufacturers. The OEM business delivered another strong quarter with volumes up high single digits year over year. Growth was supported by continued momentum in material handling, anchoring solutions, engineered applications, and expanding customer relationships. We also continue to strengthen our mass timber opportunity pipeline through project specifications, project wins, and target investments and resources that support our long-term growth objectives. While mass timber project timing can vary, customer engagement remains high. Our ability to combine innovative products with deep engineering expertise, testing capabilities, and field support remains a key differentiator as customers pursue increasingly complex, performance-driven projects. Our residential business volumes were down modestly year-over-year, reflecting continued softness in housing activity as a result of persistent affordability pressures. Despite these conditions, we saw areas of relative strength in multifamily, fire rebuild activity, selected regional markets, and new product adoption. Our teams continue to engage customers through builder and distributor training, job site events, product campaigns, and customer conversions, while increasing cross-selling across our portfolio of connectors, fasteners, anchoring solutions, and value-added services. Builders remain focused on cost control, cycle time reduction, and inventory management, and we are supporting them with high service levels in the industry's deepest portfolio of engineered solutions. Our national retail business delivered a slight increase in volume year over year. The retail environment remains competitive and continues to reflect selective consumer spending, inventory discipline, and mixed point-of-sale trends across the home center channel. Our teams remain focused on in-store execution, merchandising excellence, training, and close collaboration with our retail partners. During the quarter, we advanced several important initiatives, including bay optimization with creative display solutions, continued outdoor accidents expansion, and a successful fastener merchandising pilot that is expected to expand later this year. While uneven demand remains a near-term headwind, our focus on service, reliability, and retail execution continues to strengthen our customer relationships and support future growth. In our commercial business, second quarter volumes were down modestly year over year, reflecting mixed construction activity across segments and geographies. We remain optimistic on our ability to capitalize on opportunities in data centers, education, retrofit work, cold-formed steel, quick frames, and anchoring applications. Through specification activity, takeoff services, project coordination, and cross-selling efforts, our teams continue to help customers manage complexity, improve productivity, and execute large projects more effectively. While the broader environment remains uneven and customers remain cautious amid inflation and project timing uncertainty, our technical expertise, code compliance solutions, and field support provide a strong foundation for future growth. In Europe, second quarter net sales totaled $143.5 million, up 7.6% year-over-year, driven by an approximate 3% year-over-year increase in volumes, price increases, and foreign currency translation. On a local currency basis, net sales were up 4.9%. Customer engagement remains healthy, and we secured several meaningful wins during the quarter, including multiple mass timber projects. Our consolidated gross margin improved 100 basis points year-over-year to 47.4%, driven by our 2025 price increases, which contributed approximately $34 million in net sales in the quarter. This was partially offset by higher factory and overhead costs as a percentage of net sales, including approximately $1.5 million, or 20 basis points, of Q2 startup costs from the ongoing ramp-up of our Gallatin facility, which we opened late last year. While startup costs associated with a Gallatin ramp-up continued to impact gross margin in the second quarter, we saw improvement versus the impact in the first quarter. Our operating margin was 25.2%, up 300 basis points year over year, which included 100 basis point benefit from a $5.5 million eminent domain settlement, partially offset by one-time cost in Q2-2026 of a half a million dollars related to our strategic cost savings initiatives. Adjusted EBITDA totaled $196.1 million, a 22.6% increase year-over-year. In summary, our second quarter results demonstrated disciplined pricing and effective cost management underpinned by solid execution and a clear commitment to supporting our customers. Our financial ambitions remain, one, driving above-market buy-in growth relative to U.S. housing starts, two, maintaining an operating income margin at or above 20%, and three, consistently driving EPS growth ahead of net sales growth. As for our outlook on the markets, we continue to expect 2026 U.S. housing starts to be down low single digits compared to 2025. In Europe, we expect flat to modest market growth in 2026. As we look ahead, we remain confident in the long-term potential of our core growth drivers and customer engagement with our value-added offerings remain strong. At the same time, mixed headwinds and rising steel costs are creating a more challenging backdrop, particularly as we move through the back half of 2026. As such, we do not expect to maintain the same rate of revenue growth and profitability in the second half of the year, as we will have fully lapped the majority of the pricing actions we implemented last year. We continue to approach pricing with discipline and a long-term perspective. Given ongoing housing affordability concerns, customer response and competitive dynamics have varied across markets and channels. The market for steel remains volatile with rising steel prices and increasing availability constraints. Maintaining dependable product supply and providing reliable service remain top priorities for Simpson. Our approach remains grounded in value-based pricing, supported by detailed product and market-level evaluations that consider input costs, value, mix, margins, and long-term customer relationships. With that, I'd like to turn the call over to Matt, who will discuss our financial results and outlook in greater detail.
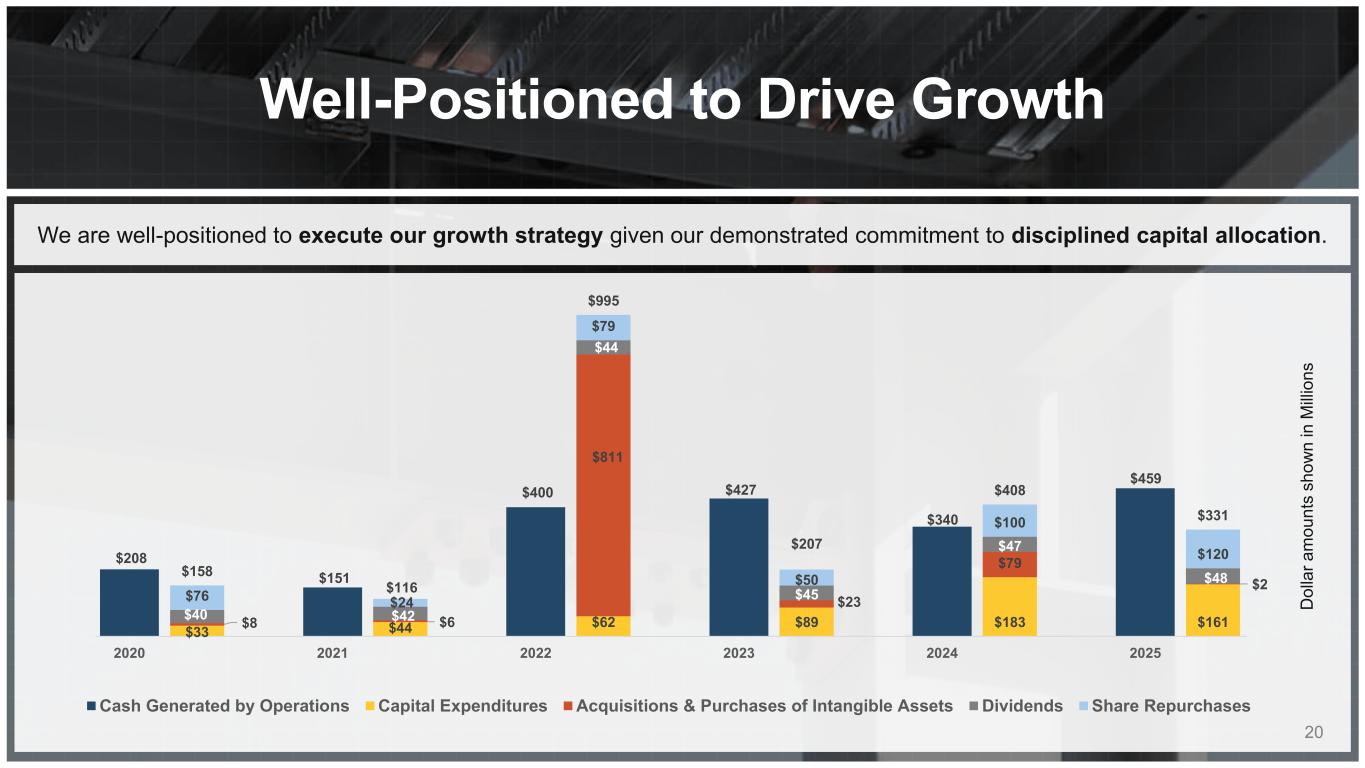
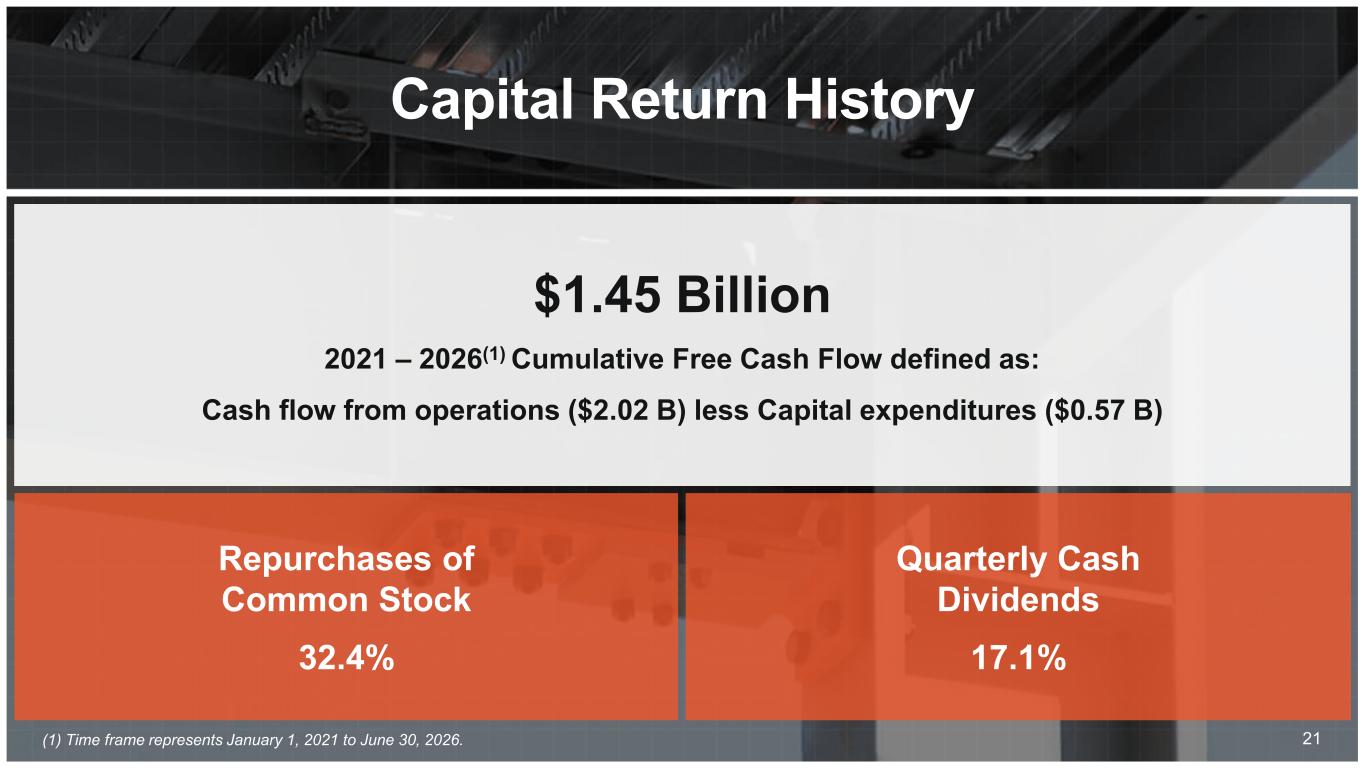
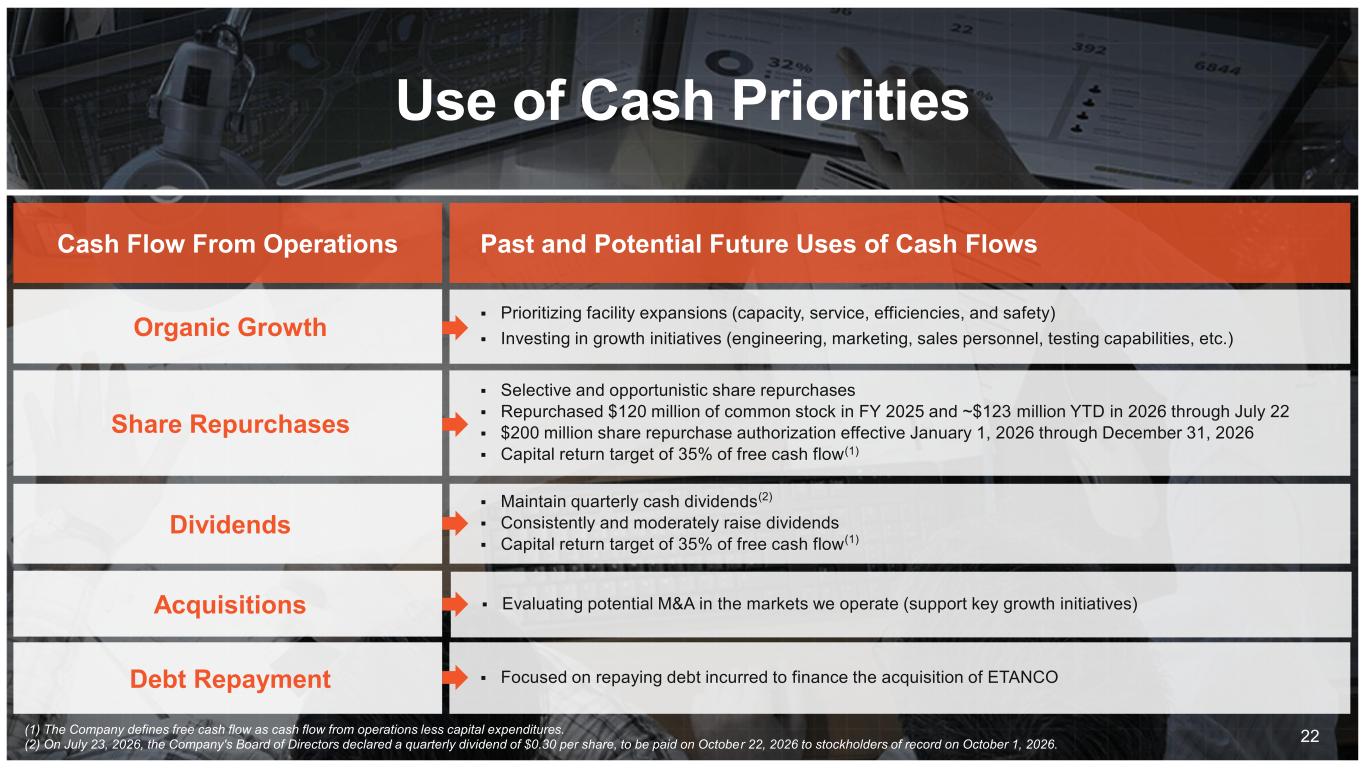
Good afternoon, everyone. Thank you for joining us on our earnings call today. Mike spoke earlier about our 70th anniversary and some of the employees who have been part of that journey. I'd like to add my thanks to them and to all of our employees for their dedication and I'd also like to mention that unless otherwise stated, all financial measures discussed in my prepared remarks refer to the second quarter of 2026, and all comparisons will be year-over-year comparisons versus the second quarter of 2025. Now turning to our results. Consolidated net sales grew 6.3% to $671.1 million. In the North America segment, net sales rose 6% to $522.3 million, driven by pricing and favorable mix, which were partially offset by lower sales volumes. Europe delivered a 7.6% increase in net sales to $143.5 million, driven by both higher volumes and price increases, as well as the positive effect of approximately $3.7 million in favorable foreign currency translation. Globally, wood construction product sales were up 6.1% and concrete construction product sales were up 7.4%. Consolidated gross profit increased 8.6% to $318.2 million, resulting in a gross margin of 47.4 percent, up 100 basis points from last year. In North America, gross margin was 50.2 percent, up from 49.5 percent reported in the prior year, reflecting the impact from our 2025 price increases and our prior year strategic cost savings effort. As a reminder, we continue to have startup costs in our Gallatin facility, which improved, but still represented an approximate 20 basis point headwind to our second quarter gross margin. We expect this will continue to moderate as we progress through the year. In Europe, gross margin increased to 38.2% from 36.2%, primarily driven by better absorption of overhead costs through volume gains, pricing, and our prior footprint optimization work as a percentage of net sales. From a product perspective, our gross margin for wood products was 47.3% compared to 47.1% a year ago. For concrete products, gross margin was 48.3% compared to 45% a year ago, reflecting lower material costs as a percentage of net sales as well as price increases. Now turning to expenses. As a percentage of net sales, second-quarter operating expenses were 23%, an improvement from 24.2% last year. SG&A headcount was down approximately 8% year-over-year, which reduced personnel-related costs. In total, operating expenses increased 1% to $154.4 million, impacted by an increase of approximately $3 million from our non-qualified deferred compensation program driven by the quarter-ending stock price. Incentive-based compensation also drove an approximate $2 million increase in operating expenses in the quarter. To further detail our SG&A, our research and development and engineering expenses decreased by 13.3%, or $2.8 million, to $18 million. Approximately $700,000 of patent filing-related costs were reclassified to G&A. The decrease was also driven by lower headcount, reduced professional fees, as well as cost reductions from optimizing our footprint initiatives. Selling expenses were down 6.4% to $52.8 million as a result of reduced travel and entertainment expenses and lower advertising expenses. On a segment basis, selling expenses in North America were down 10%, and in Europe they were up 4.2%. General and administrative expenses increased by 10.5% to $83.6 million, primarily driven by a $3 million increase in our non-qualified deferred compensation program, reflecting the impact of quarter and stock price, as well as a $2 million increase in incentive-based compensation and higher professional fees. As a result, a consolidated income from operations totaled $169.1 million, an increase of 20.6% from $140.2 million. A consolidated operating income margin was 25.2%, up from 22.2% last year. The increase was partially driven by the previously mentioned $5.5 million gain from an eminent domain settlement and leverage from roughly flat operating expenses versus the prior year. In North America, income from operations increased 15.8% to $158 million due to higher net sales on reduced operating expenses, including lower personnel costs and software licensing fees, as well as a reduction in travel and entertainment spend. Our operating income margin in North America was 30.2% compared to 27.7% last year. In Europe, income from operations increased 25.7% to $19.7 million, primarily due to higher gross profit and continued strong cost control. Our operating income margin in Europe was a record 13.7% compared to 11.7% last year, another step forward in our progress toward our 15% operating income margin goal while continuing to optimize our European footprint. Our effective tax rate was 25.7%, approximately 10 basis points below the prior year period. Accordingly, net income totaled $127 million or $3.09 per fully diluted share compared to $103.5 million or $2.47 per fully diluted share. The adjusted EBITDA was $196.1 million, an increase of 22.6%, resulting in a margin of 29.2%. Now turning to our balance sheet and liquidity. As of June 30, 2026, our debt balance was $336.7 million, down $33.8 million from March 31, 2026, with $555.8 million remaining available on our revolver. Cash and cash equivalents totaled $450.5 million, resulting in a net cash position of $113.8 million. Our inventory position as of June 30, 2026, was $513.5 million, which was down $80.7 million compared to December 31, 2025, driven by approximately $46 million in lower raw material inventory levels on hand and a $35 million reduction in finished goods, including $20 million from ongoing inventory optimization initiatives. North America inventory pounds on hand are down 27.4% since December 31st, 2025. We generated strong cash flows from operations of $250.6 million in 2026. Our capital allocation strategy remains focused on supporting growth while delivering meaningful returns to our stockholders. Year-to-date, we invested $33.7 million in capital expenditures, reinsuring $23.9 million in dividends to our stockholders. We purchased $98.7 million of our common stock and repaid $30 million towards the revolver. Subsequent to quarter end, we repurchased 127,132 shares of common stock through July 22nd for a total of $24.5 million. Additionally, on July 23rd, our Board of Directors increased our 2026 share repurchase authorization by $50 million to $200 million, leaving $76.8 million available for repurchases through year end as of July 23rd. This action reflects our confidence in the long-term prospects of the business and our continued commitment to returning capital to stockholders. next i'll turn to our 2026 financial outlook based on business trends and conditions as of today july 27 2026 our guidance for the full year ending december 31st 2026 is as follows we are narrowing our expected range for consolidated operating margin to 19.7 percent to 20.5 percent additional key assumptions include our outlook for u.s housing starts to be down in the low single digit range, a lower overall gross margin based on rising raw material costs, imposed tariffs, and increased depreciation costs, an expected $2 to $4 million of footprint optimization costs in Europe, and an expected $10 to $12 million gain on the sale of vacant land in the back half of 2026. Our effective tax rate is estimated to be in the range of 25 to 26%, including both federal and state income tax rates based on current tax laws. And finally, our capital expenditures outlook is now expected to be in the range of $80 to $90 million, which includes efforts to optimize our footprint to improve operational efficiency. In summary, we are highly focused on the elements we can control and we executed well, which allowed us to deliver a strong quarter despite ongoing pressures in the broader market. Pricing actions continue to contribute as expected, though we do not anticipate maintaining the same rate of revenue growth through the back half of 2026 as we fully lapped last year's increases and navigate mix and steel cost headwinds. Despite these dynamics, we remain focused on disciplined capital deployment and our commitment to returning at least 35% of free cash flow to shareholders. With that, I will now turn the call over to the operator to begin the Q&A session.
Operator
We will now be conducting a question and answer session. If you would like to ask a question, please press star 1 on your telephone keypad. A confirmation tone will indicate your line is in the question queue. You may press star 2 if you would like to remove your question from the queue. For participants using speaker equipment, it may be necessary to pick up your handset before pressing the star keys. One moment while we pull for questions. Our first question is from Trey Grooms with Stevens. Please proceed with your question.
Hey, Mike and Matt. This is Ethan on for Trey. Thanks for taking the question. I wanted to dive a little bit more into the margin performance in the quarter. So both gross margin and operating expenses outperformed. I know there was a settlement benefit helping some in addition to lower material costs and expenses. And, you know, that was despite some startup costs from the Gallatin facility and higher incentive comp. So, but just any more detail on what drove the better margin of performance in the quarter relative to perhaps your initial expectations would be great.
This is Matt. You know, we've been, we had some of the strategic targeted at.
No, that's all very helpful. And then if we could extrapolate that to the second half margins, I think guidance at this point implies maybe a year over year decline in the second half. And in the preparative marks, it was clear that there were some mixed headwinds in the rising steel costs having an impact and also some DNA. So just any more color here on the second half margins would be great.
Yeah, if you look at gross margin year-to-date, Ethan, we're down about 10.
That's all very clear and very helpful. So thanks so much, and I'll pass it on.
Our next question is from Tim Weiss with Baird. please proceed with your question hey guys good afternoon nice job um hey maybe just to follow up on the last question um has your gross margin guidance changed at all because that's i think you did kind of expect it to be down slightly um so i guess is it has anything changed there or i mean because steel's kind of been up all year so i'm just kind of curious if if you had baked that into the prior guidance or if there's kind of an incremental headwind yeah no gross margin when you look at the whole just kind of real quick and that good girl okay that's helpful and then I guess how would you guys kind of characterize just the kind of volume environment if you think about today versus you know you got back the last year kind of early this year I mean I think it's still pretty tough out there is there has there has anything gotten worse in in kind of the starts environment anything gotten better or is it is it kind of bumping along at the at the same pace so when we were coming into 2026 so late 2025 we were based off all the feedback we were getting from the market forecasters that we work with expecting a flattish to up flight uh up slightly market uh in 2026 and we did into speaking after the first quarter when you look at the housing okay okay and then i just want to speak one more and just just on Europe. I mean, you're, you're almost, I mean, I guess if you round up, you'd technically be at mid-teens, mid-teens kind of even margins. Is there, is, are you making, I guess maybe you could just talk about some of the improvements you've maybe made in kind of the underlying business.
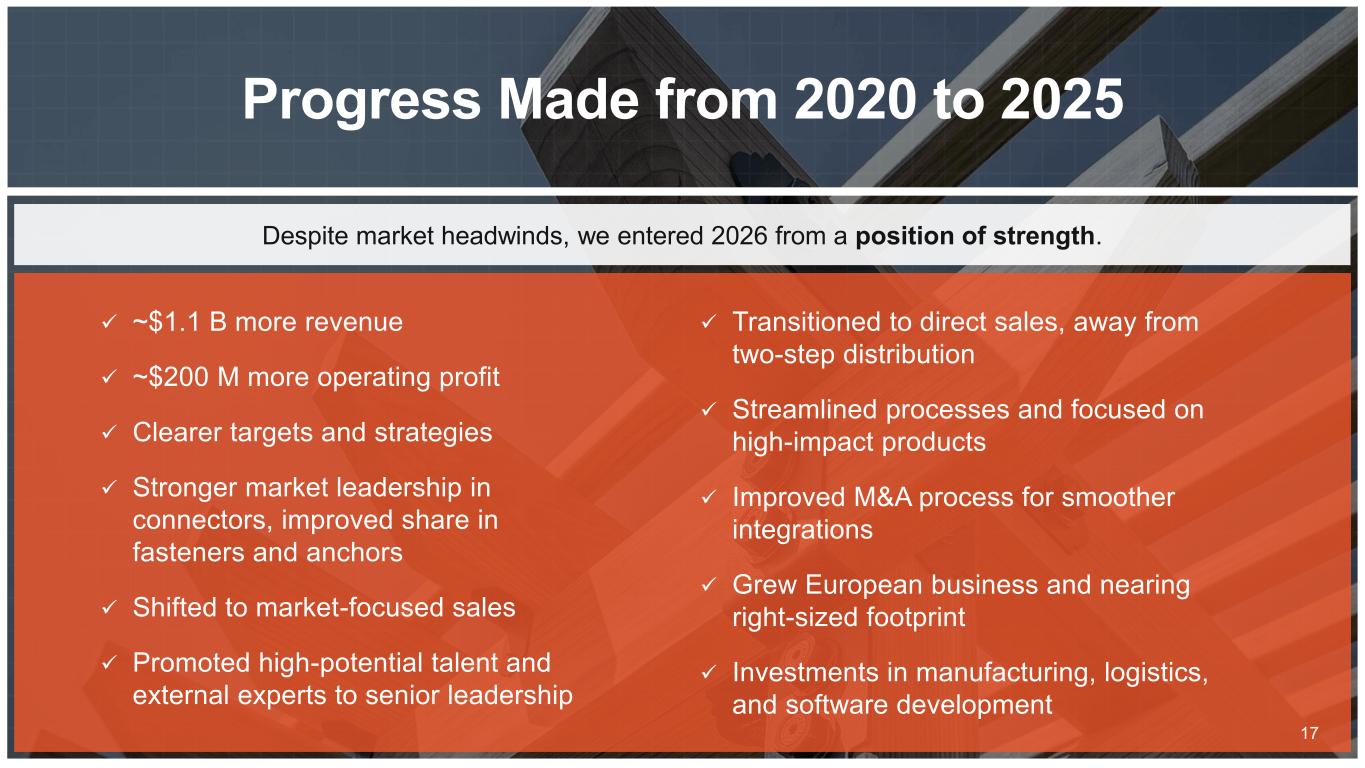
And as you think about kind of getting to that market, you know, getting to that kind of margin on a full year basis, any kind of visibility to when, when you might get there? so we're very happy with the work that our european team has done tim over the last couple of years they've worked hard to make sure they're controlling cost they've done a lot of work from a footprint optimization perspective and then while trying to maintain a good cost control they have been trying to keep some volume growth relative to the market and the fact that they had 3% volume growth in the second quarter with a record operating margin. We're pretty pleased. The target for those guys is still 15% operating margin. We still think that's a midterm goal and having a little bit of volume growth will help us get there sooner rather than later, but they've still got some work to do, but they've made a lot of progress over the last three years.
Sounds good. Thanks for the time, guys. Good luck.
Operator
Thank you. Our next question is from Kurt Yinger with D.A. Davidson. Please proceed with your question.
Great. Thanks, and good afternoon, guys. Hi, Kurt. First off, on North America, I know you had mentioned $30 million pricing benefit. By my math, I mean, that would have volumes down less than 1% in the quarter. Did mix play a role as well? In any way, we could maybe put kind of a finer point just on the volume figure yes yes i mean total company volume in the quarter today
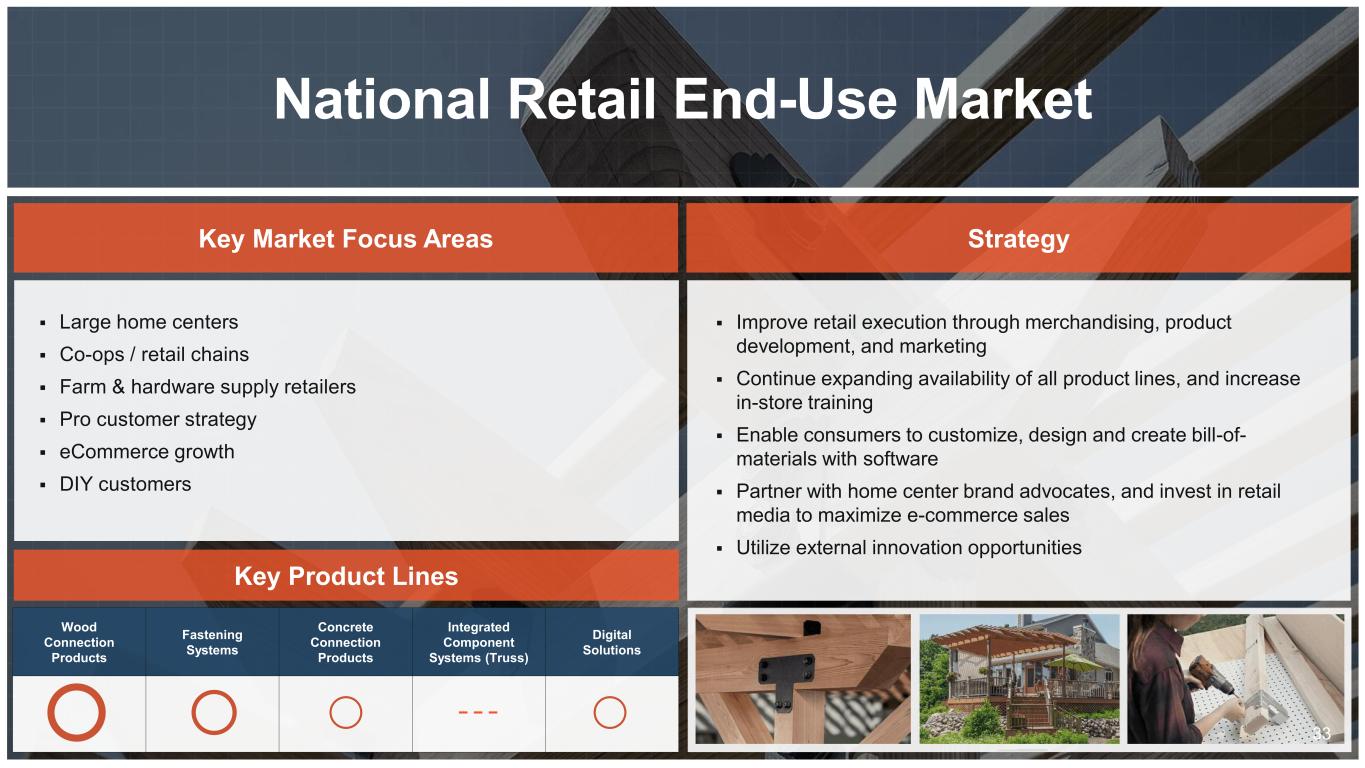
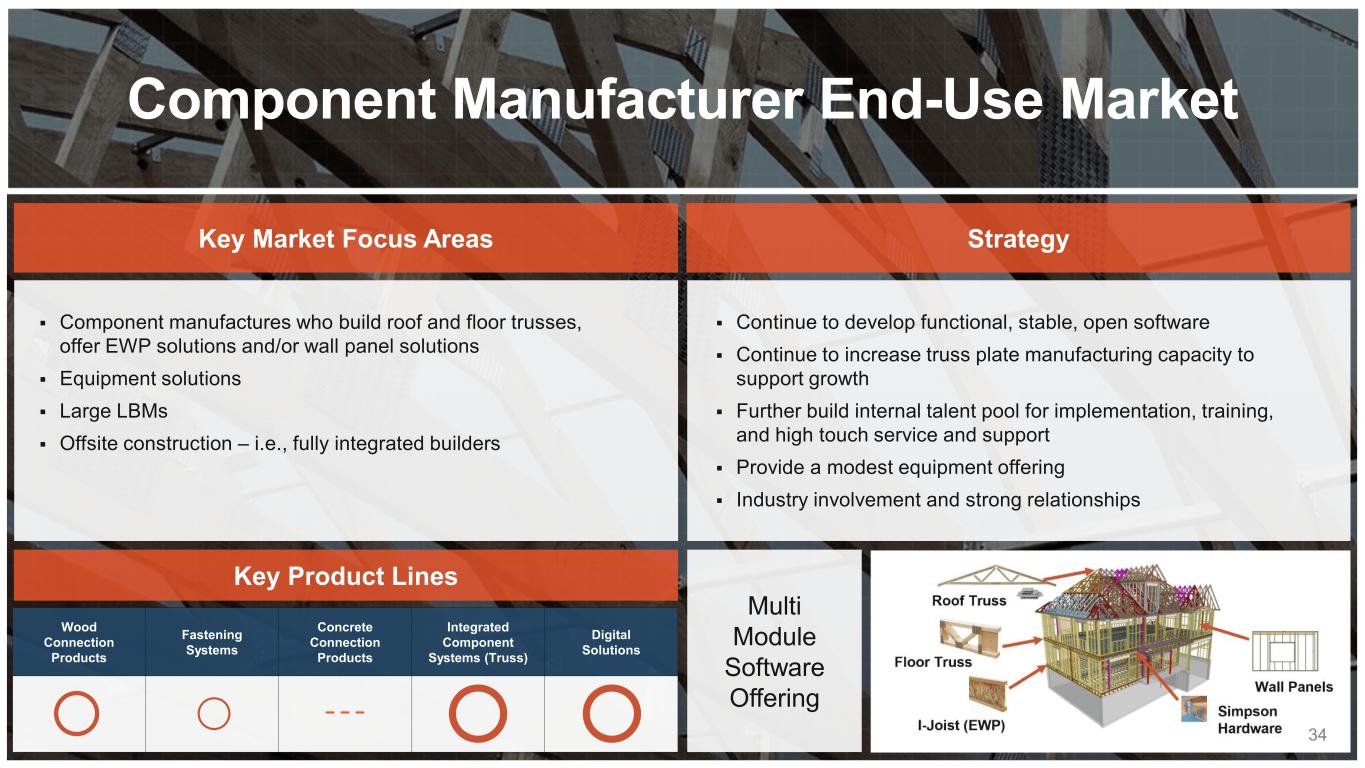
is down low single digit uh our oem business um continues to have really strong volume growth up manufacturing year today again really up high single digit national retail was positive last quarter that's super helpful and maybe sticking with um component manufacturer volume and the momentum there i guess you had alluded to um demand for equipment greater wallet share of
connectors i guess how should we think about the overall performance there um relative to maybe the the true trust plate business right and the conversions on the software side um how impactful have those two or three buckets been kind of in that performance yes component manufacturing business, you're exactly right.
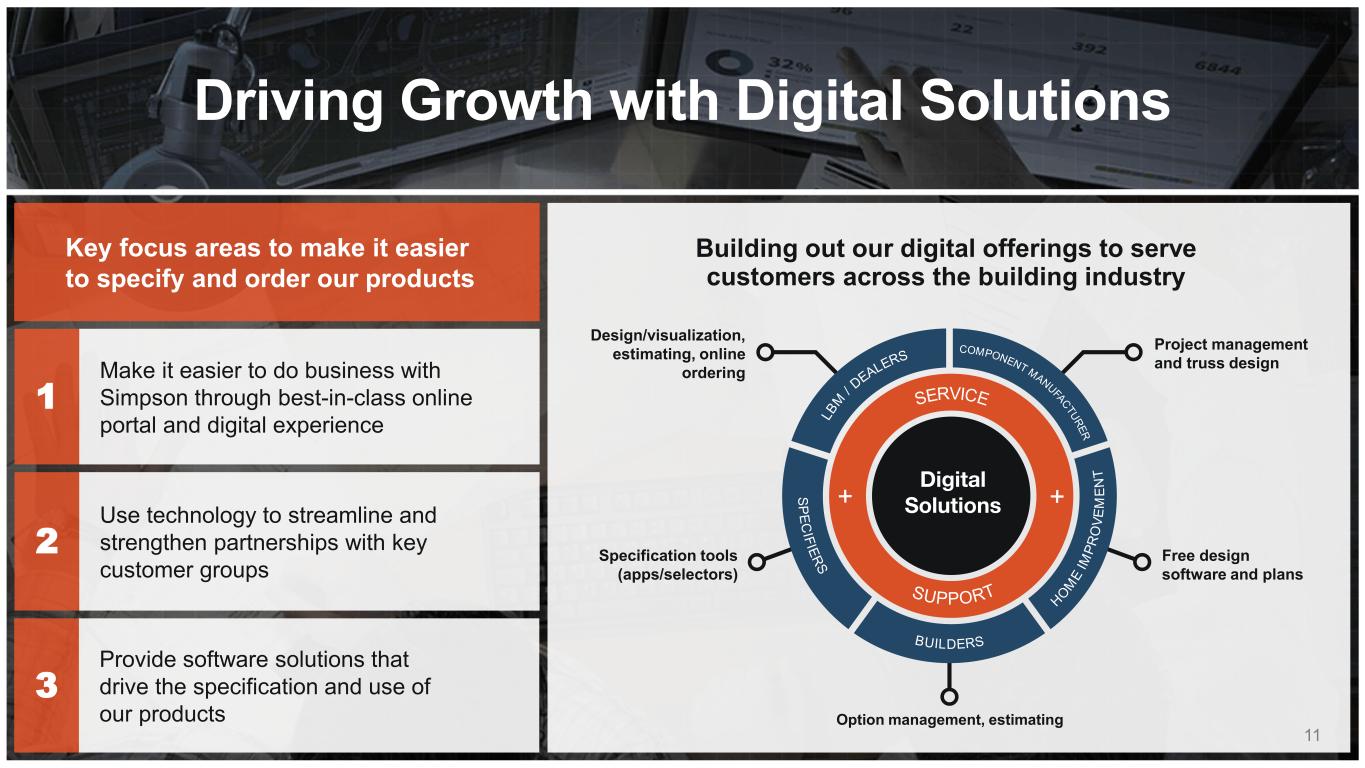
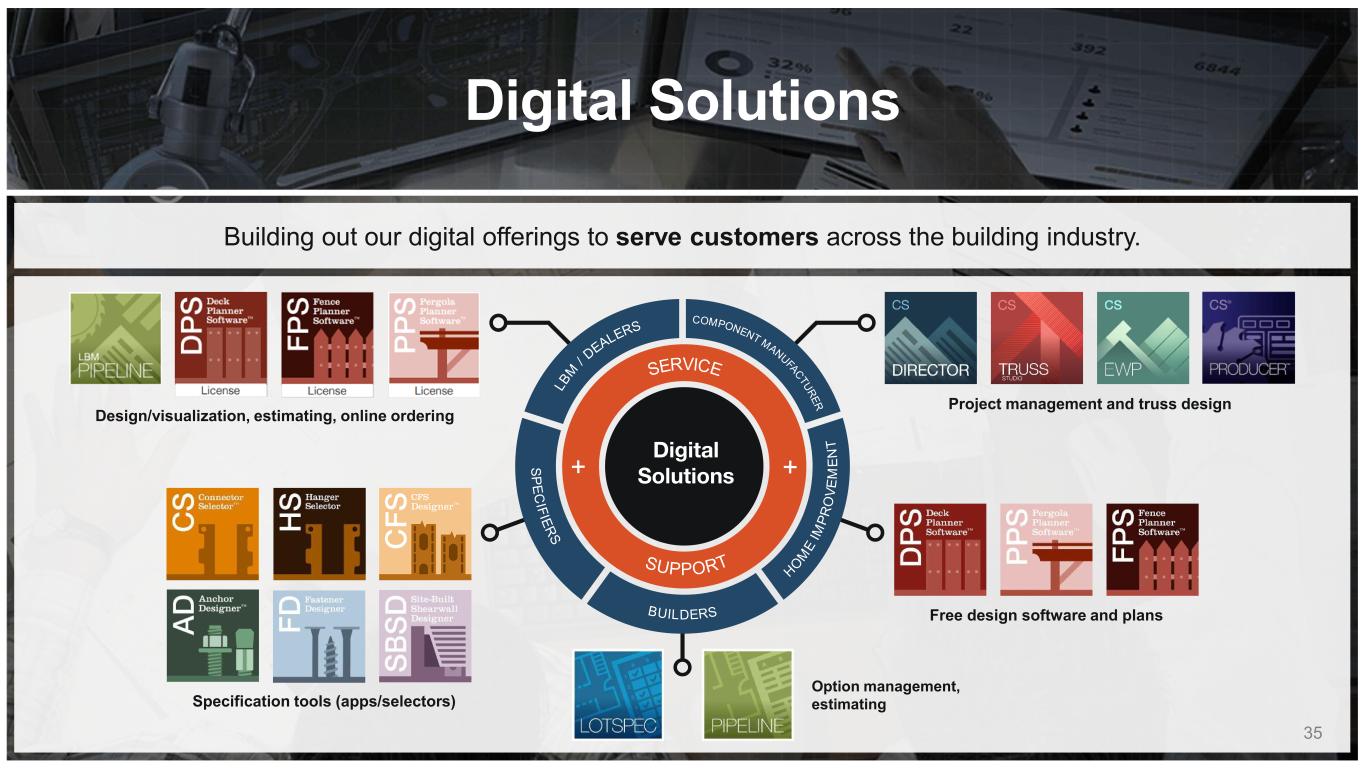
It includes equipment, it includes to the job site, and that includes trucker segment has been one of our fastest growing market segments over the last three years. We're very pleased with the development of it. If you look at the trust place in that segment, we haven't released exactly what those numbers are, but that is definitely the fastest growing component of that business. We continue to make real strong progress from a software perspective. We plan on launching our complete program at the BCMC show in the fall. We believe we're on track with that, and we continue to get good feedback when we show our customers what we're working on, and in between, we continue to pick up new customers along the way.
That's good to hear. Just going back to the gross margin sign, I mean, it seemed like it might have exceeded your expectations here in Q2. I understand kind of the full year outlook hasn't changed, but you know, you're thinking about it half versus half, given some of the inflation you talked about. I mean, is it fair to say that maybe the back half gross margin expectations have come in a little bit just with the outperformance in the first half, or is it still kind of largely what you thought at the outset of the year? That makes sense. And then just lastly, on the pricing front um you know it's kind of an evolving discussion given all the variables out there but you know what would you need to see to kind of maybe look at taking additional pricing actions going into next year what what's kind of most important in that conversation in your mind a lot of different factors we recognize they recognize that price trying to optimize our
footprint and other things that help us maintain that good gross margin we're also working on Okay.
Operator
Appreciate the color. Thank you.
Operator
Our next question comes from Daniel Moore with CJS Securities. Please proceed with your question.
Thanks very much, Mike, Matt. Appreciate all the color. You covered a lot. And certainly on your targeted growth initiatives, including component manufacturing, trusts, Just given some of that momentum, would you expect to get back to sort of outpacing the overall housing market, you know, as we get back to the balance of this year and certainly into 27?
And as you know, we've had a long history of driving above market growth, and that is definitely our ambition going forward. And we also remain very confident in our growth initiatives. that we think the portfolio of innovation projects we have we're quite pleased with. And then if you kind of go back to those market playbooks that we talked about, manufacturing and the OEM business, those have been two of our growth drivers. We also think getting national retail business back onto the growth path is important, and we have a lot of programs and new product ideas and packaging and merchandising initiatives that we think can help us do that. That index for the segments that we plan has also had a pretty tough – we have plans to continue to think we can – how do we benchmark our numbers?
That makes sense in great color. Really strong cash generation quarter. Can you continue to work on inventories, or if we hit sort of a base here, you know, at or near current levels, particularly given rising steel and input costs?
Quite a bit if you look at, you know, but even on dollars, on inventory buckets. The first would be raw material inventory and, like, how much we want. I think that's going to bounce around.
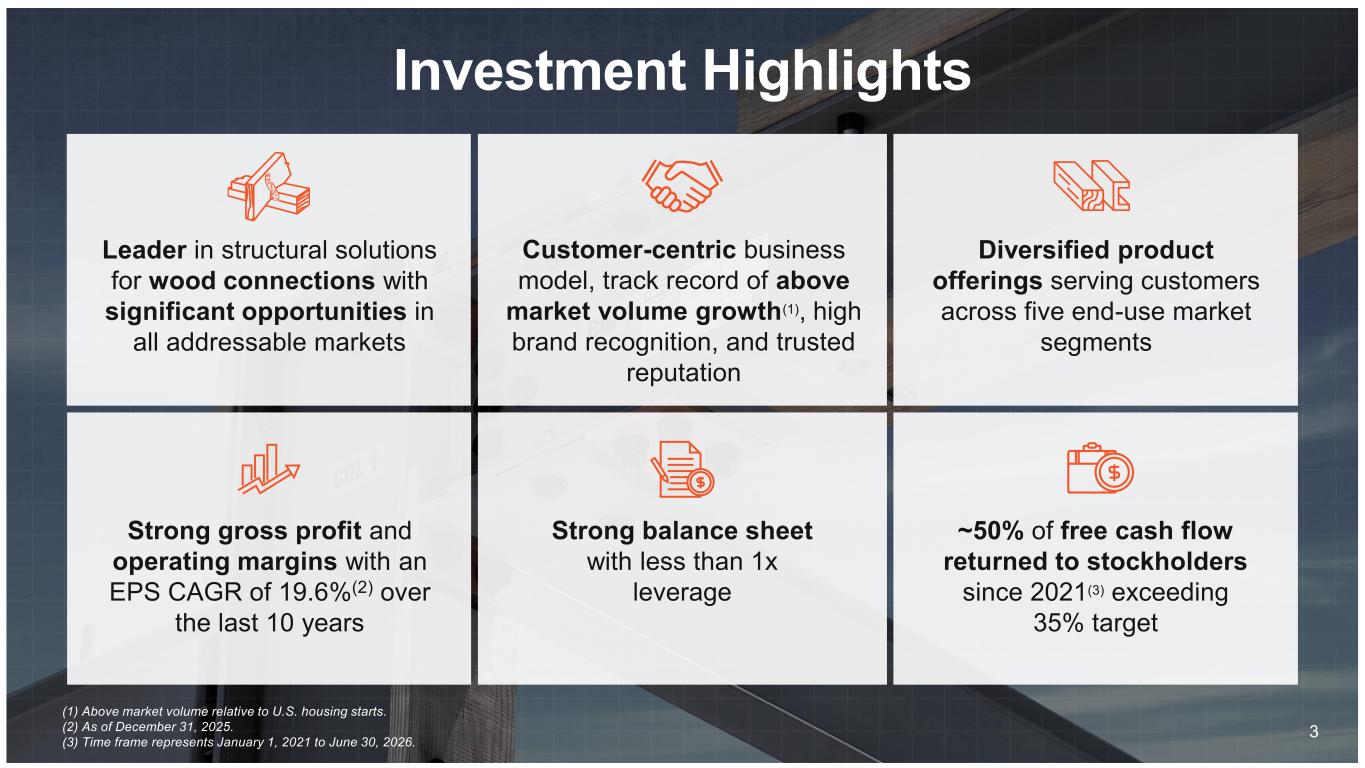
Helpful. Last for me, the tweak in the CapEx guide, is it mainly timing and inflation, or are you seeing more opportunity to put capital to work? And, you know, going forward, you've been comfortably above your 50% or your 35% goal of returning cash to shareholders. Are you seeing either M&A opportunities, or do we expect that to, barring those, comfortably exceed that target? Thanks again for all the color.
Yeah, first on your CapEx question, we did bump the expected CapEx spend up $5 million on the low and the high end to $80 to $90. We are doing a little bit of footprint work, and that's all included in that, Kai.
Operator
Our next question is from Andrew Carter with Stifle. Please proceed with your question.
Hey, thank you. Good evening. I wanted to ask, you haven't changed your housing outlook for the year, but of course what happened last year is there was that abrupt kind of cut to production by some of the big home builders on kind of inventory levels. I think as you look at the second half of the year, you have visibility and you're kind of the first one to report. Do you see risk of that this year that could be kind of a meaningful kind of correction in single-family starts for this year?
Thanks. yeah so Andrew we're we are obviously tracking that real again we basically use Zonda as our main forecasting tool because we can get a regional split which is important for the way we run the business and how the content is is based on there and if you look at their forecast for the year it's down four percent if you look at the six or seven other people that we track you average them all together, the combined forecast is down 2% for the year. If you then add that to the fact that the Census Bureau data slightly, that definitely says a softer back half of the year, and I think they are talking about it. But at the end of the day, Andrew, I mean, we're focused on the things we can control. We still think there's a lot of opportunities to launch new products. We still think there's a lot of opportunity to get more content on a home and continue to work on our merchandising efforts with our national retail customers. So, you know, we're certainly watching the market, but we're trying to figure out how we can drive volume growth following our market and product.
The second question I wanted to ask is I heard more than once a competitive market out there, and just to kind of square the loop and make sure that you're not indicating any kind of extraordinary competitive activity out there that would cause you to deviate from not getting kind of the full value of your services. Just want to make sure on that call out.
That is correct. What we have seen is in the fastener space, we've got a couple of competitors in that area where they don't have differentiated products. They don't have patented products. They aren't investing the time and effort to get all the load rating and the testing. They are leveraging price to sign the markets that they play in. And it's more to use that to stop more of a – We haven't hit on some opportunities that we thought we were going to hit on because the pricing was just a little bit more challenging than we anticipated. We do believe that we've got a good playbook in that area. We're going to continue to differentiate the product line. We're going to continue to drive cost out from a manufacturing perspective because we do believe fasteners is a big growth opportunity for us, and we'll work through this current situation.
Final question for me on the component manufacturer side. I know you don't break out like the trust plates exactly, but has that volume growth kind of been accelerating every quarter as you picked up new business wins and new customers? And then kind of what kind of step change could you see with the additional kind of software roll-ups in the second half of the year?
Operator
Thanks for passing on.
Operator
This now concludes our question and answer session. Ladies and gentlemen, thank you for your participation. This does conclude today's teleconference. Please disconnect your lines and have a wonderful day.