Operator
Good morning, and welcome to the Service Properties Trust First Quarter 2026 Earnings Conference Call. Should you need assistance, please signal a conference specialist by pressing the star key followed by zero. After today's presentation, there will be an opportunity to ask questions. To ask a question, you may press star, then 1, on your telephone keypad. To withdraw your question, please press star, then 2. Please note this event is being recorded. I would now like to turn the call over to Kevin Berry, Senior Director of Investor Relations. Please go ahead.
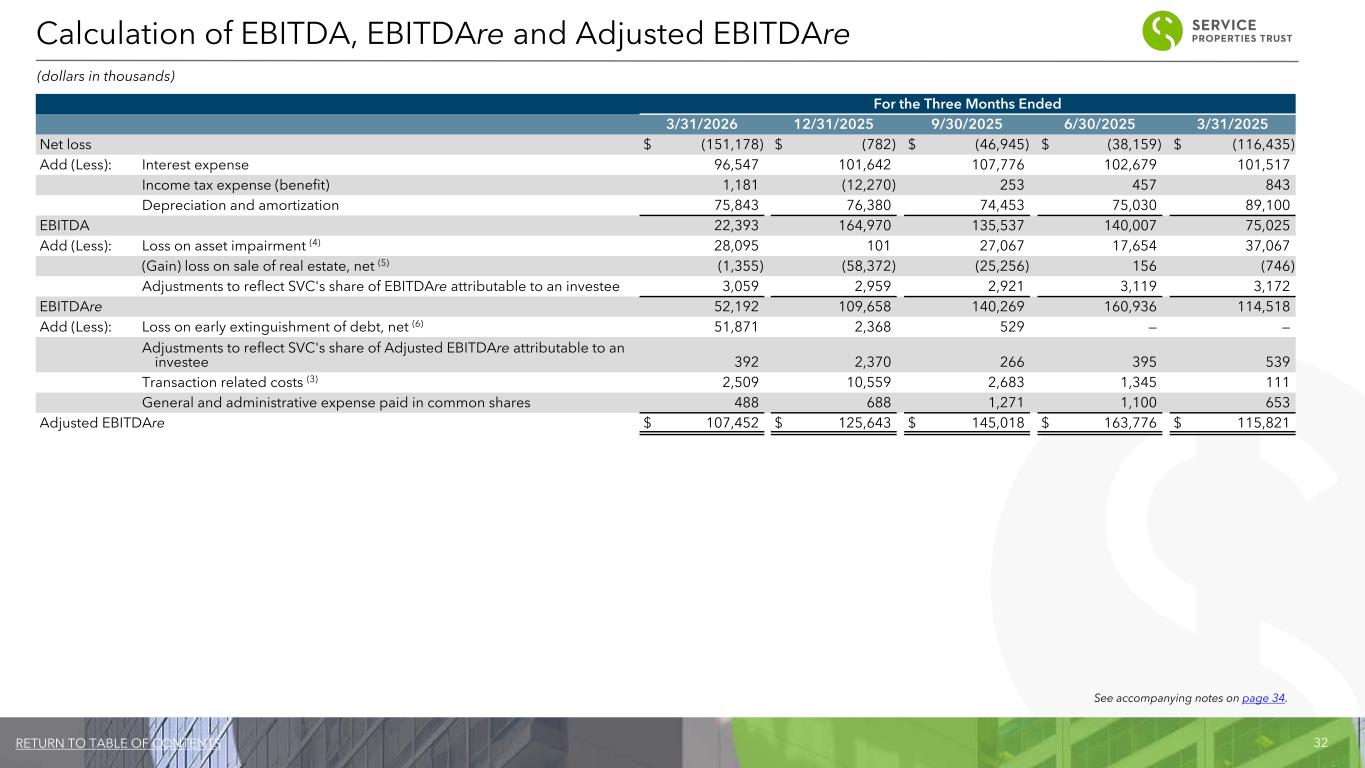
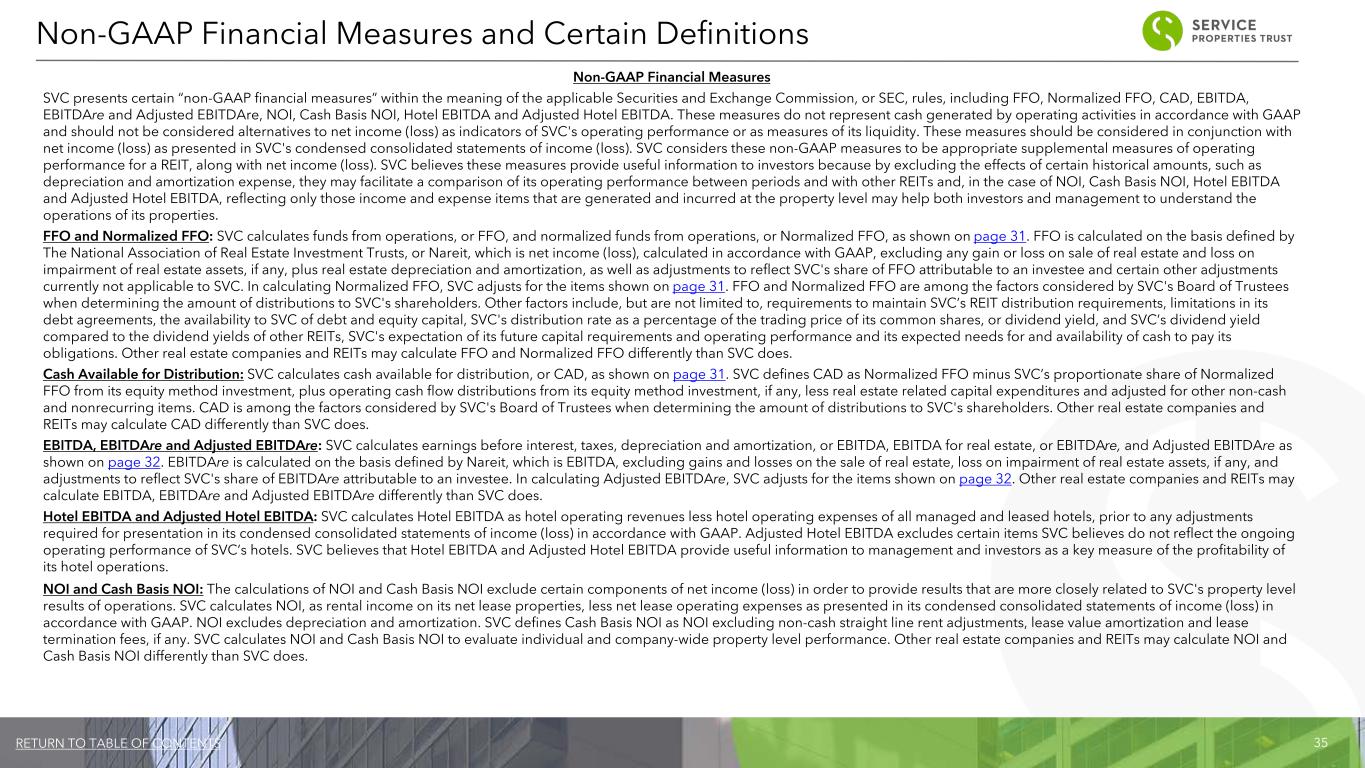
Thank you for joining us today. With me on the call are Chris Bellotto, President and Chief Executive Officer, Jesse Hebert, Vice President, and Brian Dominic, Treasurer and Chief Financial Officer. In just a moment, they will provide details about our business and our performance for the first quarter of 2026, followed by a question and answer session with sell-side analysts. I would like to note that the recording and retransmission of today's conference call is prohibited without the prior written consent of the company. Also note that today's conference call contains forward-looking statements within the meaning of the Private Securities Litigation Reform Act of 1995 and other securities laws. These forward-looking statements are based on SVC's beliefs and expectations as of today, May 7, 2026, and actual results may differ materially from those that we project. The company undertakes no obligation to revise or publicly release the results of any revision to the forward-looking statements made in today's conference call. Additional information concerning factors that could cause those differences is contained in our filings with the Securities and Exchange Commission, which can be accessed from our website at svcreate.com or the SEC's website. Investors are cautioned not to place undue reliance upon any forward-looking statements. In addition, this call may contain non-GAAP financial measures, including normalized funds from operations, or normalized FFO, and adjusted EBITDA RE. A reconciliation of these non-GAAP figures to net income is available in SVC's earnings release presentation that we issued last night, which can be found on our website. Lastly, we will be providing guidance on this call, including estimated 2026 normalized FFO, Hotel EBITDA, Net Operating Income, or NOI, and Adjusted EBITDA RE. We are not providing reconciliation of these non-GAAP measures as part of our guidance because certain information required for such reconciliation is not available with unreasonable efforts or at all. I will now turn the call over to Chris.
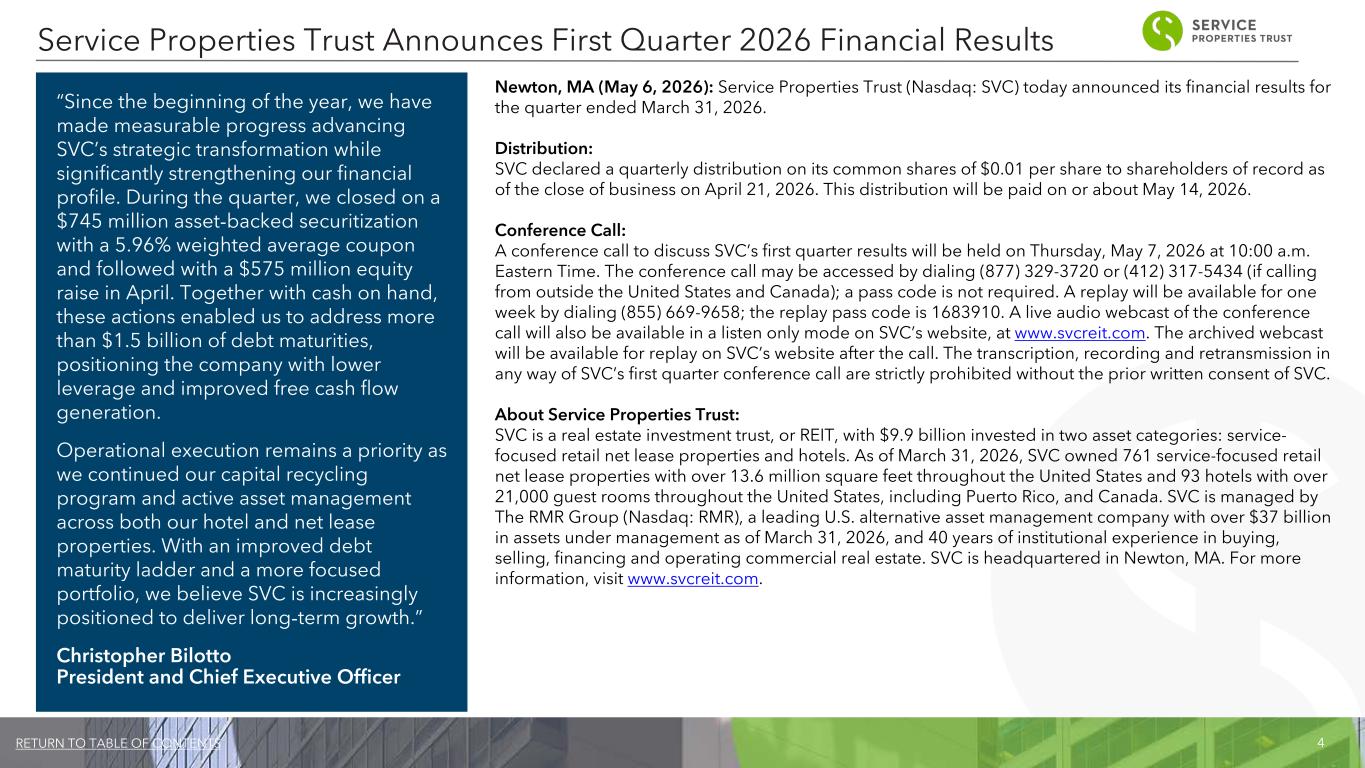
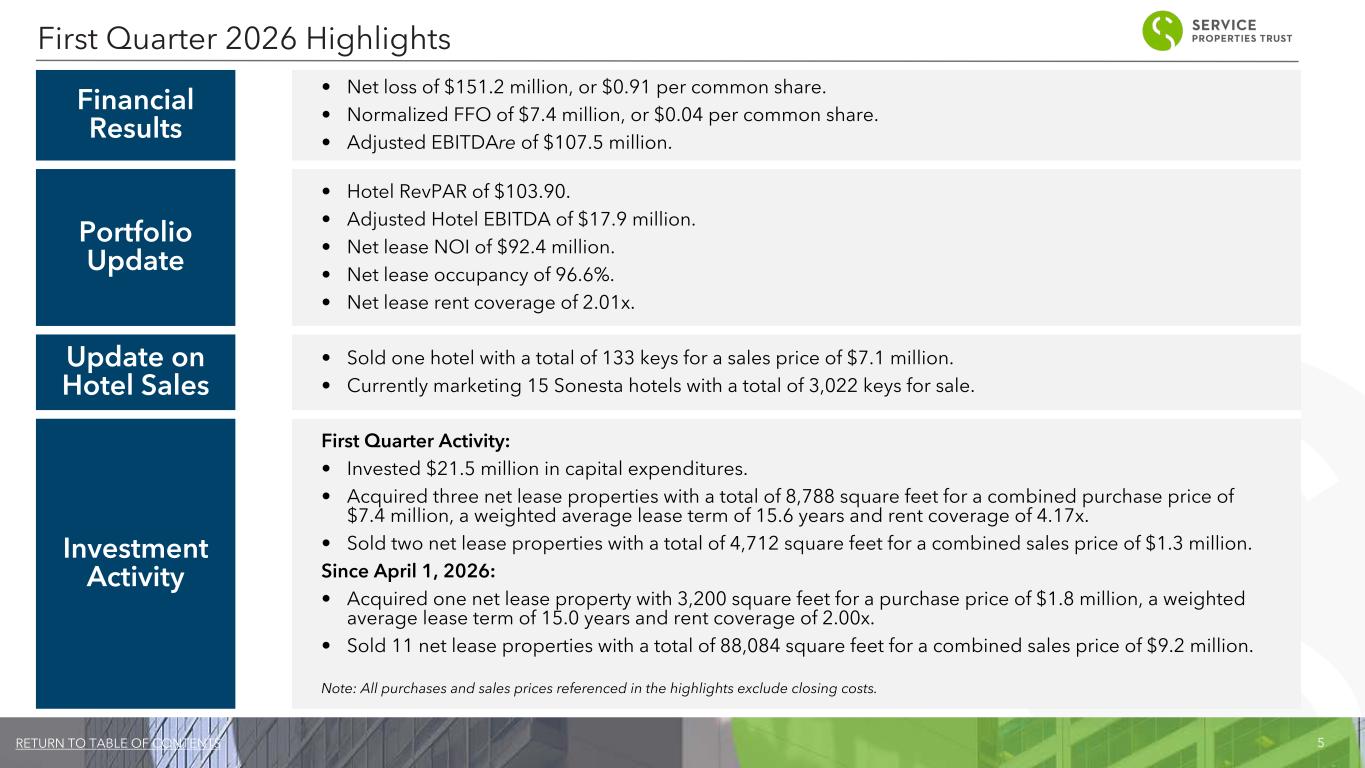
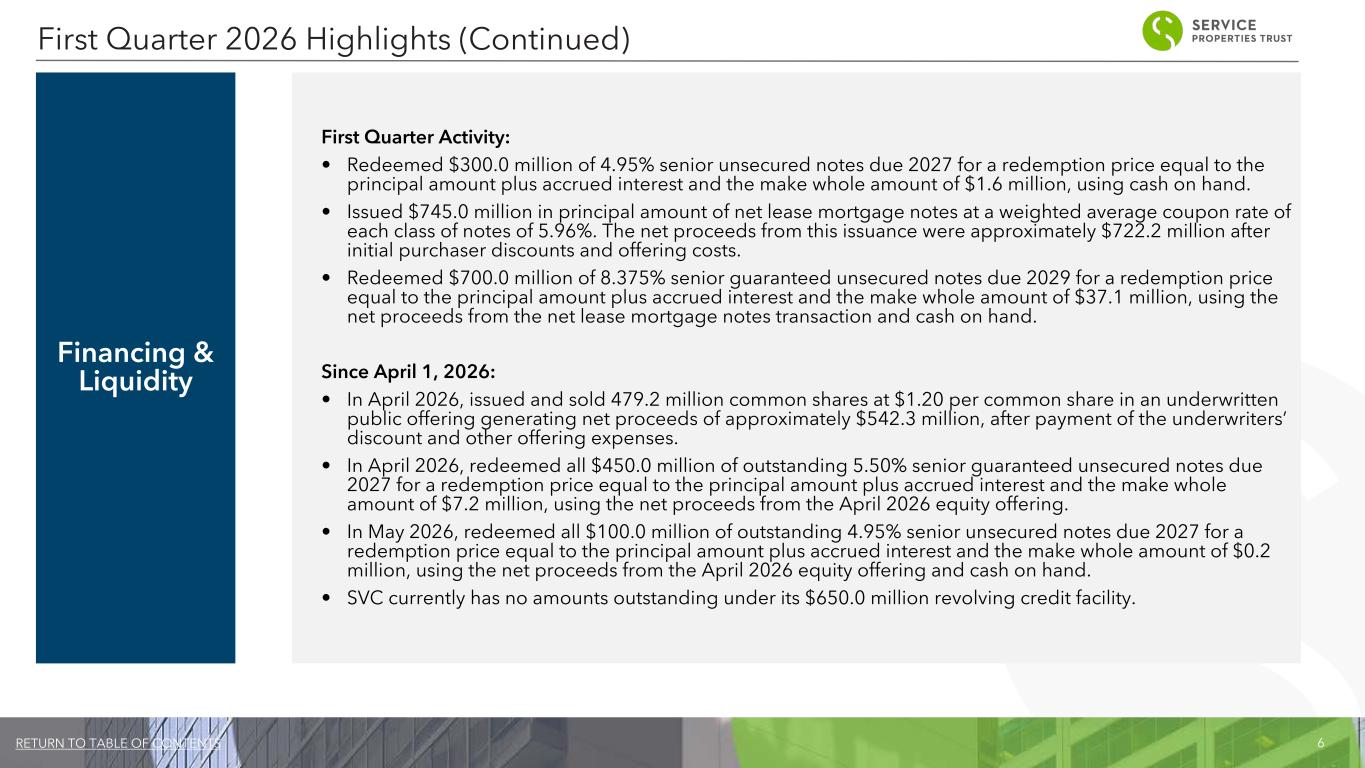
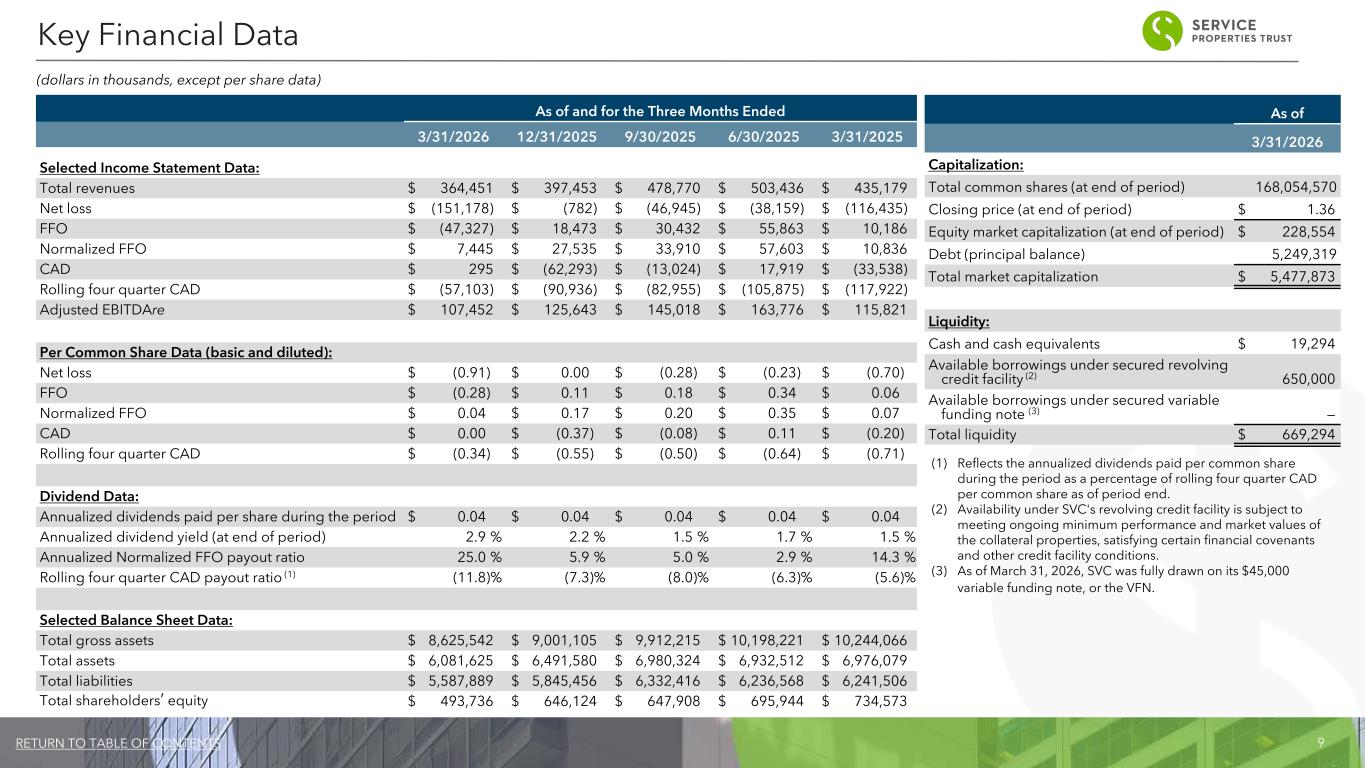
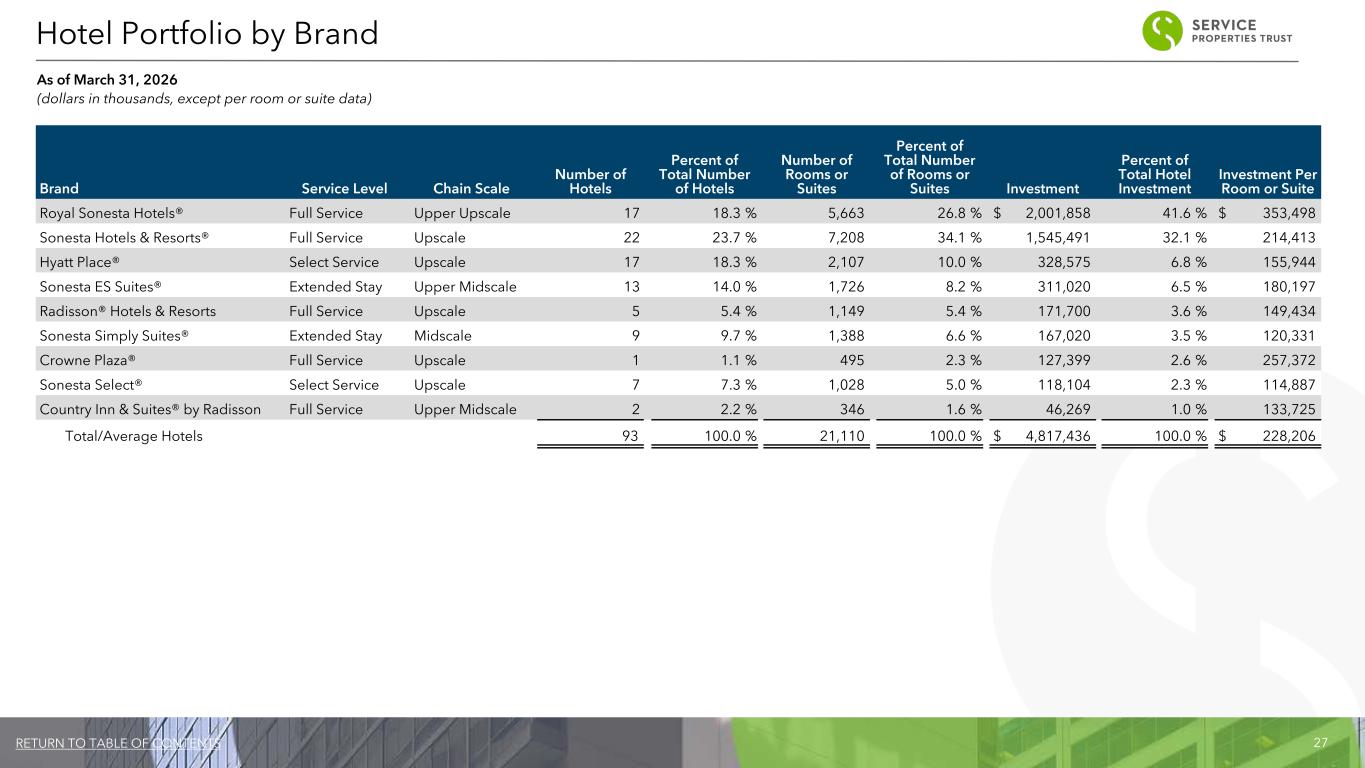
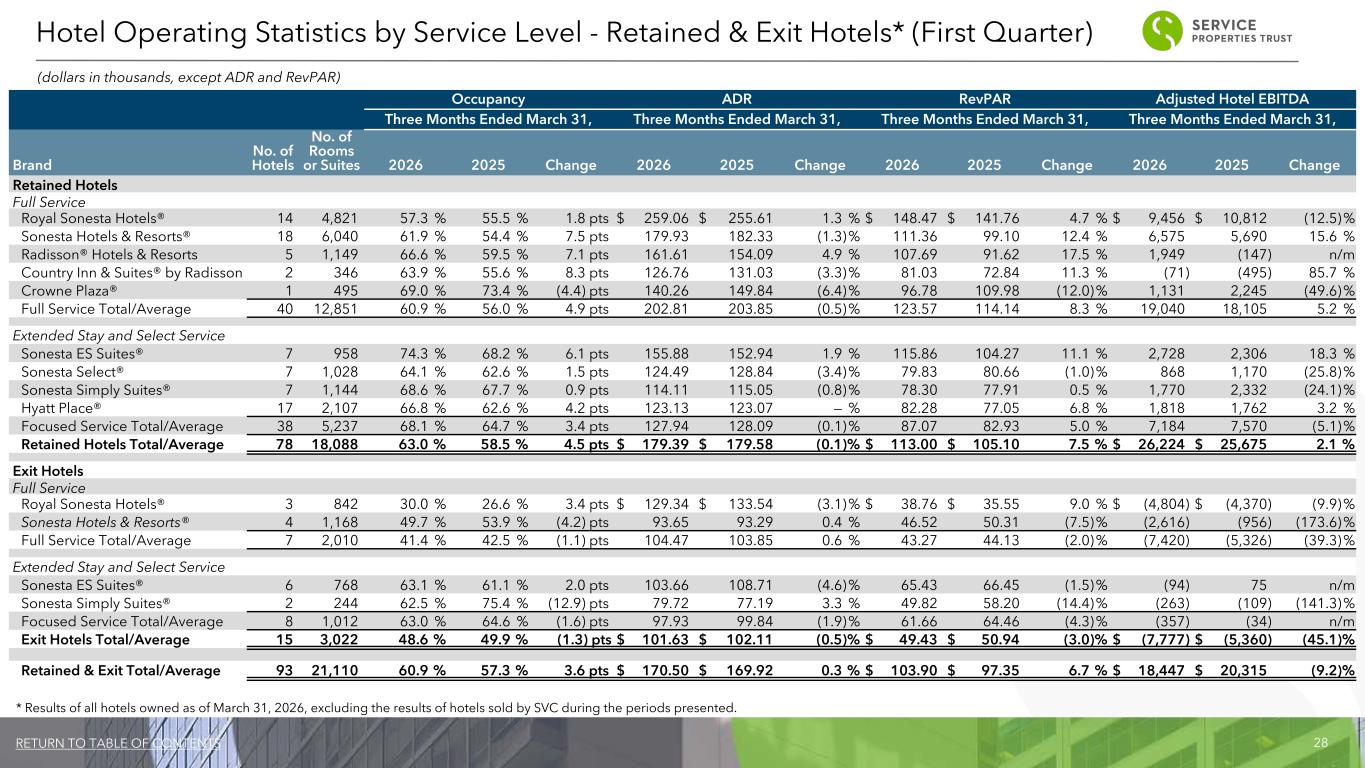
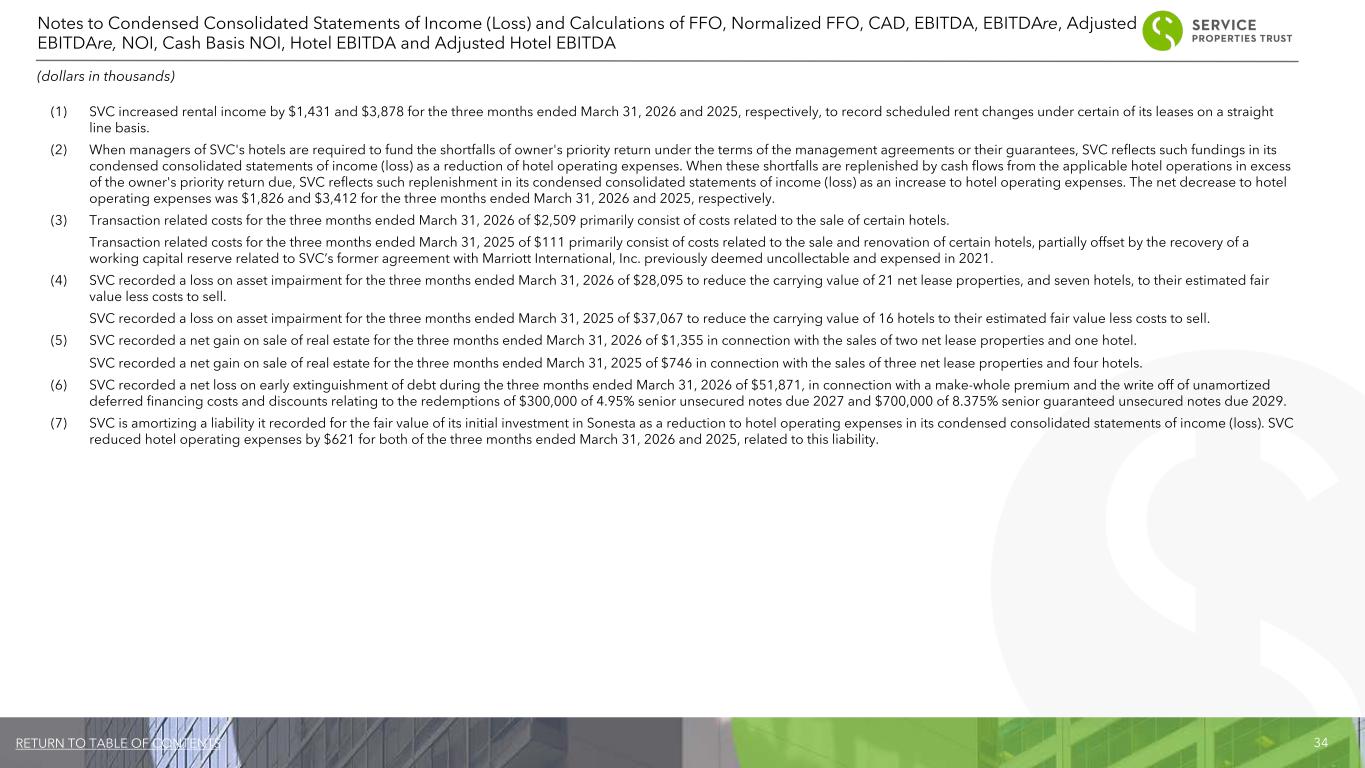
Thank you, Kevin. Good morning, everyone, and thank you for joining the call today. Last night, we reported first quarter 2026 results, which reflect measurable progress advancing SBC's strategic initiatives. We materially strengthened our financial position with roughly $1.5 billion in capital markets activity, enhancing our overall leverage profile and debt maturity schedule. We continue to advance our capital recycling program and remain focused on active asset management across both our hotel and net lease properties. These initiatives serve as a catalyst toward driving performance for the company and improving cash flow. I will begin today's call with an update on our strategic priorities, followed by highlights from our hotel portfolio performance during the first quarter. Jesse will then discuss our net lease business, and Brian will conclude with a review of our financial results, balance sheet, and financial outlook, starting with our strategic priorities. Since the start of the year, we executed a capital plan that significantly strengthened our balance sheet and strategic positioning. In March, we closed $745 million of accretive ABS financing secured in part by 34 of our travel centers leased to TA, reinforcing the attractiveness of these assets. In April, we completed a $575 million underwritten equity offering that was intentionally sized to deliver and improve our credit metrics. Importantly, RMR Group, our manager, invested $50 million alongside shareholders, underscoring strong alignment and confidence in our strategy. Taken together, along with cash on hand, we retired $1.6 billion in debt, resulting in annualized cash interest savings of $59 million. We entered the remainder of 2026 with a stronger financial foundation and greater flexibility to execute our repositioning strategy and operational plans within our hotel portfolio focused on driving EBITDA improvement and value creation. Turning to hotel performance. During the first quarter, Rev Park across our 93 hotels increased 6.7% year-over-year, primarily driven by broad-based occupancy gains across all service levels, with notable strength in the full service segment. Hotel EBITDA across the portfolio decreased 9.2% year-over-year to $18.4 million, though this reduction was partially impacted by a $2.4 million decrease tied to the 15 properties currently being marketed for sale. As a reminder, our full-year guidance contemplates the expected losses related to these marketed hotels. More importantly, the underlying performance of our 78 hotel retained portfolio was even stronger. Excluding the assets marketed for sale, RevPar grew 7.5% year-over-year. Hotel EBITDA increased 2.1% to $26.2 million, and this was achieved despite the known revenue displacement from our ongoing redevelopment of the Nautilus in South Beach. This outperformance is driven by our strategic concentration and higher STR chain scales, our footprint in premier resort destinations including Kauai, San Juan, and Hilton Head, and the uplift we are seeing from completed renovations. Our focus remains squarely on capturing the margin flow we believe this portfolio is capable of generating as it ramps up over the next few years. Following several years of significant capital investment to reposition these assets, SPC is well-positioned to drive revenue uplift in outside the EBITDA growth. Over the last four years, approximately half of our retained hotels completed or are currently undergoing major renovations. To ensure we capture the performance improvements and margin flow through anticipated over the coming years, our asset managers are actively engaging with our operators to refine operational synergies and streamline property-level execution. While we acknowledge the broader macro headwinds, including geopolitical uncertainty, elevated fuel costs, and lagging international and government travel, we remain confident that this active asset management approach will uncover varying opportunities to improve efficiencies and deliver stronger results. Turning to hotel dispositions, during the quarter, we advanced our capital recycling initiatives, selling a 133-key focused service hotel for $7.1 million and progressed the marketing of 15 Senespa-managed hotels, totaling approximately 3,000 keys. We removed one Senespa-select property from the process to reassess its positioning, however, retain an active and engaged roster of buyers for the remaining properties. Across the broader marketed hotels, pricing has come in softer than our initial outlook. This dynamic only reinforces our strategic commitment to exit these hotels and reallocate capital. Buyer demand for the eight focused service properties was strong, resulting in nearly 30 bids from more than a dozen unique buyers. Pricing was generally consistent with the average per key valuation we've achieved on focused service hotels over the past year. Specific to these eight hotels, we have signed letters of intent with four buyers for total proceeds of approximately $61.2 million, which we intend to use to repay debt. For the seven full-service hotels, bids for this operationally challenged subportfolio have fallen below initial targets. Despite this, we are prioritizing the exit of these properties with six of the seven hotels awarded to buyers for expected proceeds of $55.3 million. We anticipate an update on the final property in the coming quarter, which will increase our total proceeds. From a strategic standpoint, all these assets is not aligned with our long-term goals. Together, these marketed hotels represented a $7.8 million of losses in the first quarter while carrying material future capital requirements. Exiting them now, regardless of the softer pricing environment, eliminates a significant drag on our earnings and preserves capital. More importantly, it allows us to pivot our full attention and resources toward our retained core portfolio, driving growth in markets and properties where we have the greatest opportunity for margin expansion. In summary, SVC's portfolio transformation is well underway. Supported by our recently improved capital structure and the operational upside within our hotel assets, we are focused on our initiative supporting SVC's continued shift towards an increasingly net lease-oriented portfolio. Ultimately, we believe this combination of selling assets and operational improvement will drive durable cash flow and create attractive long-term value for our shareholders. I will now turn it over to Jesse.
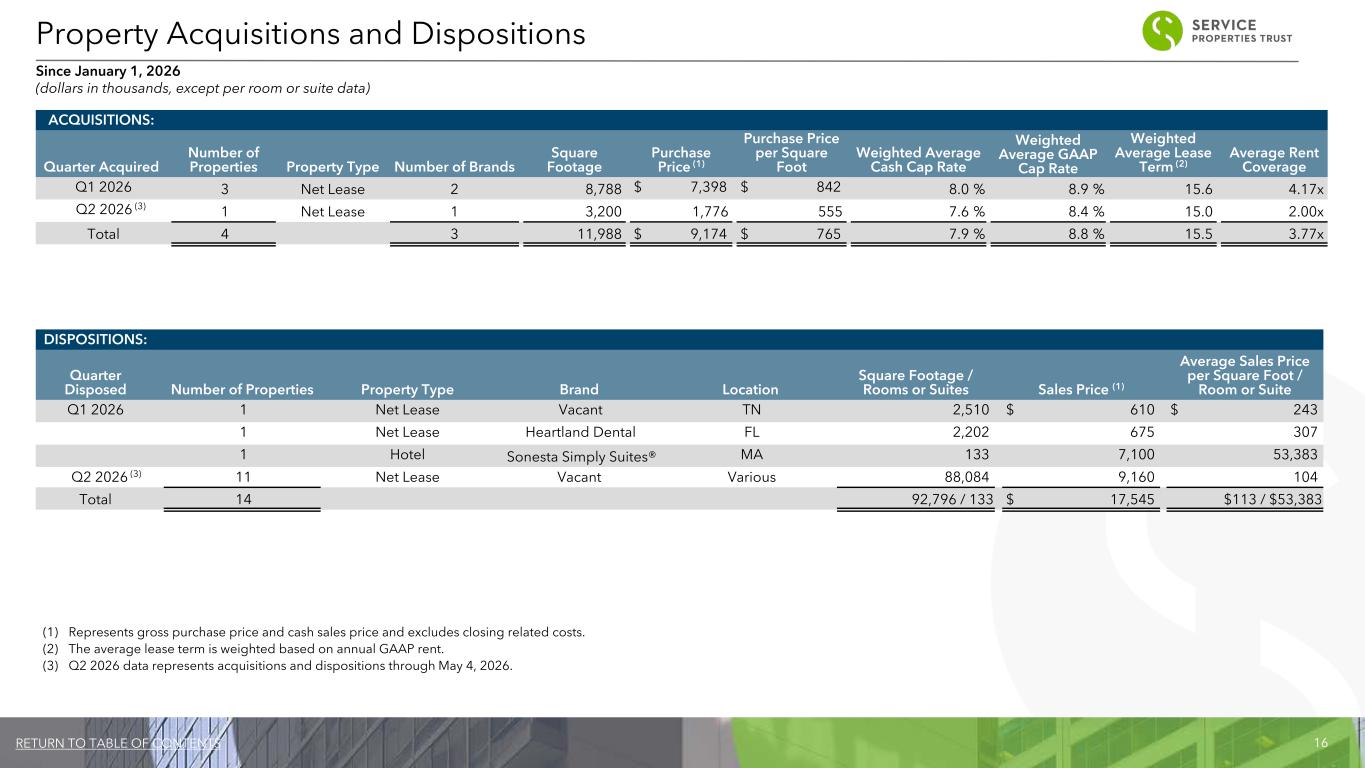
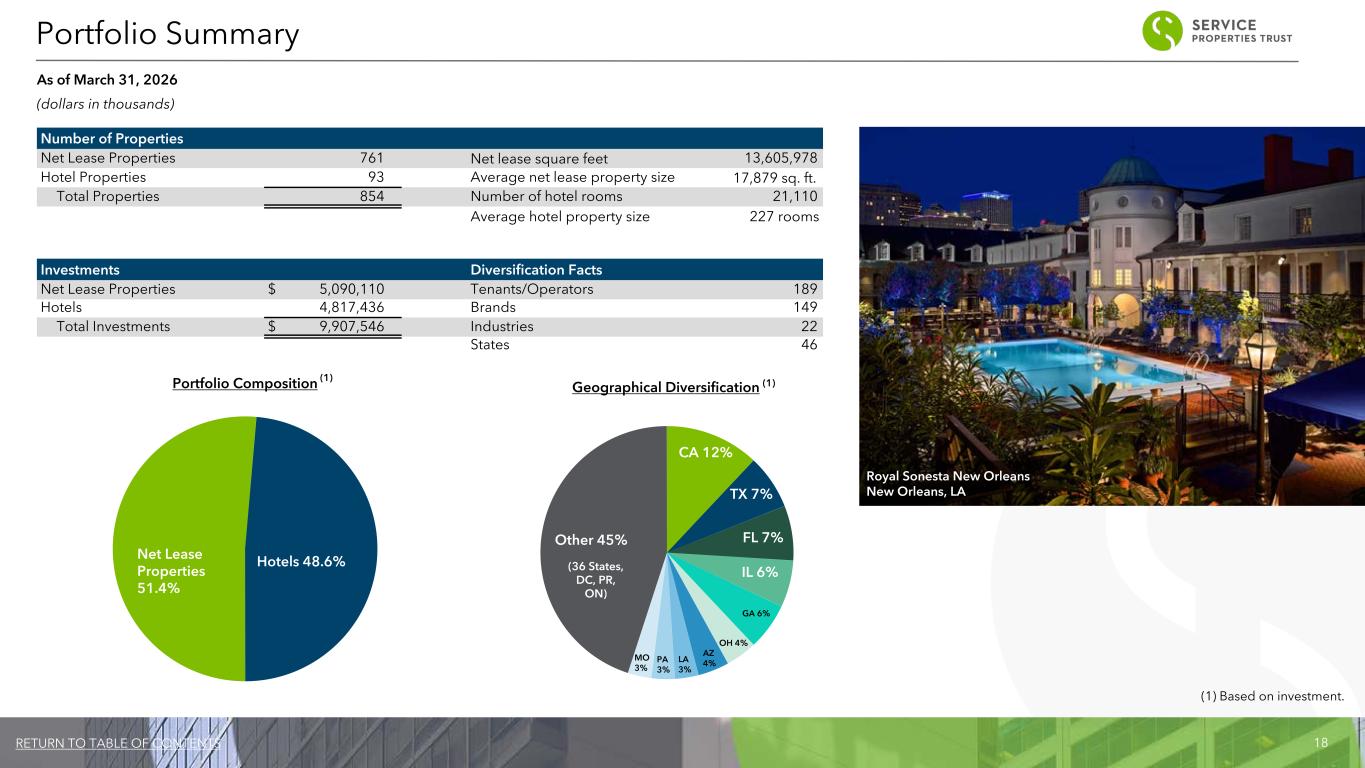
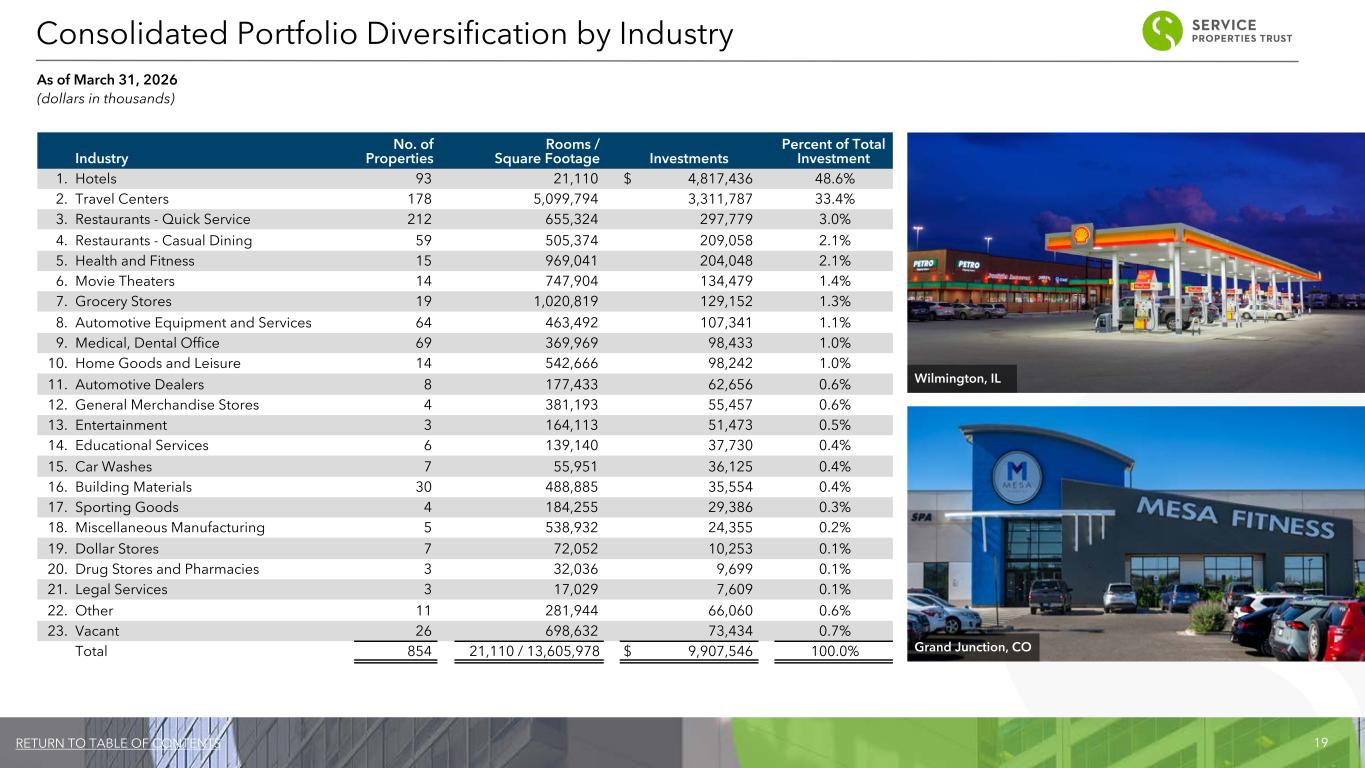
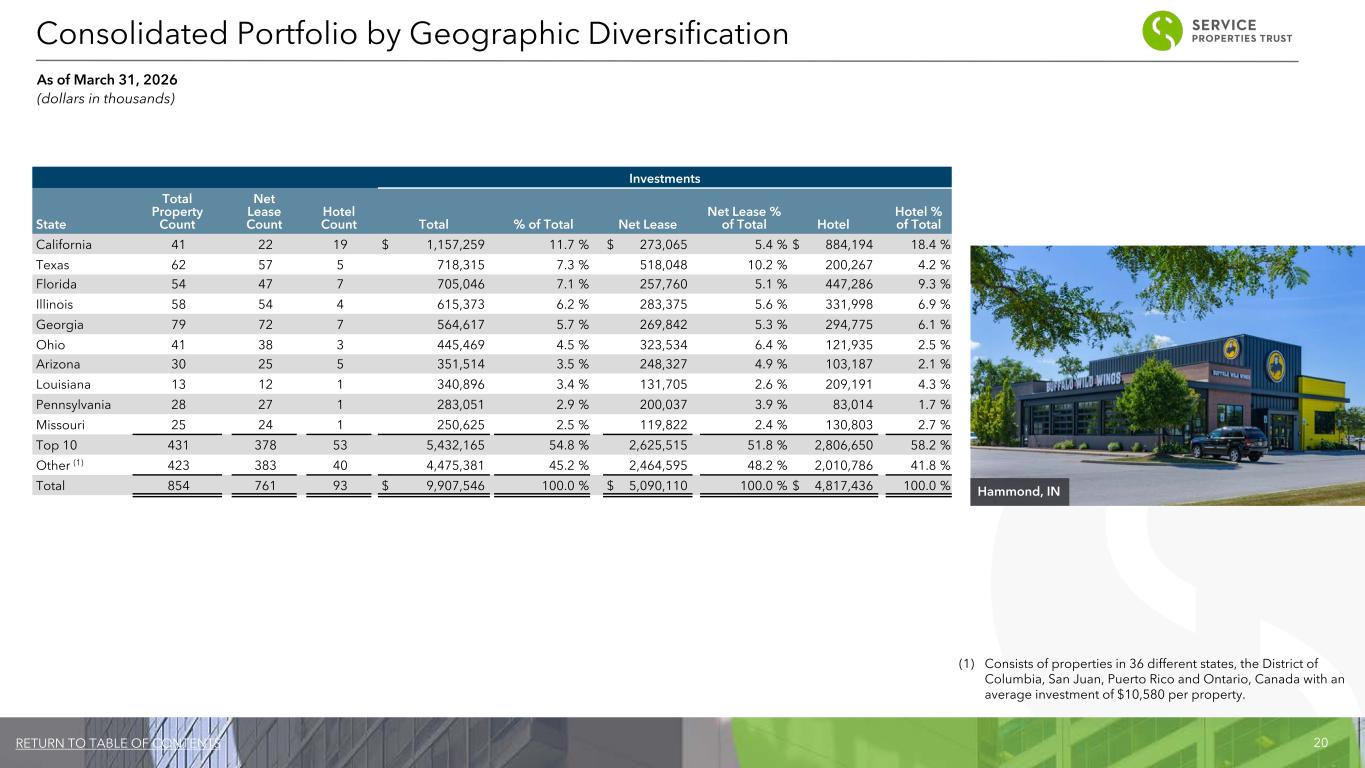
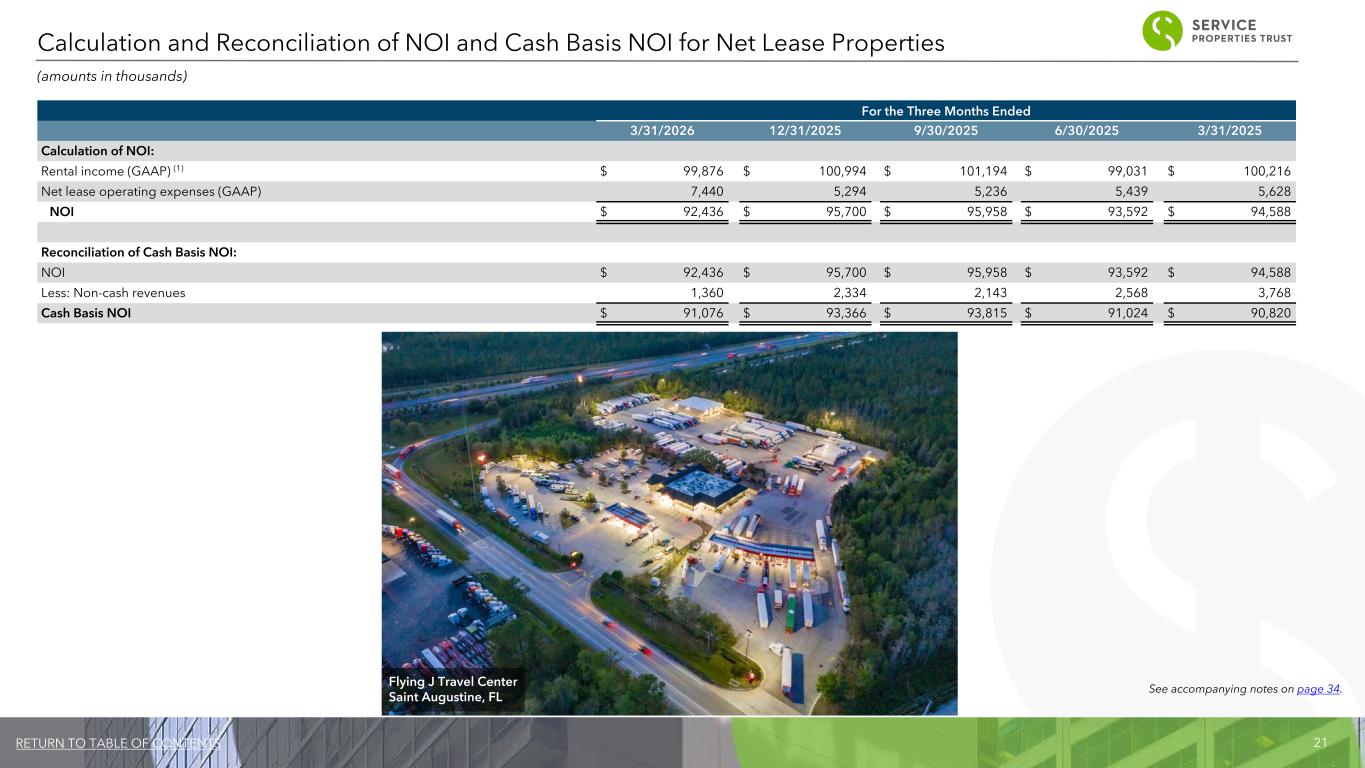
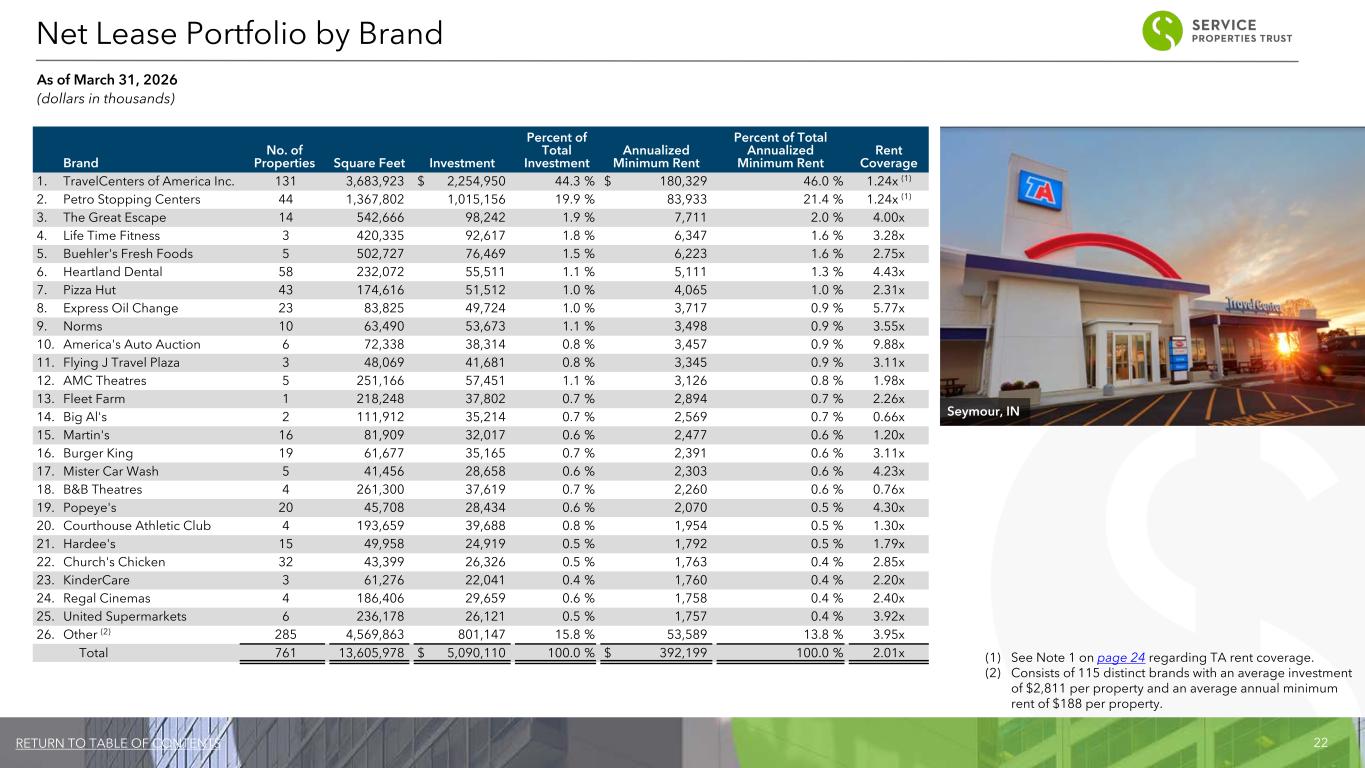
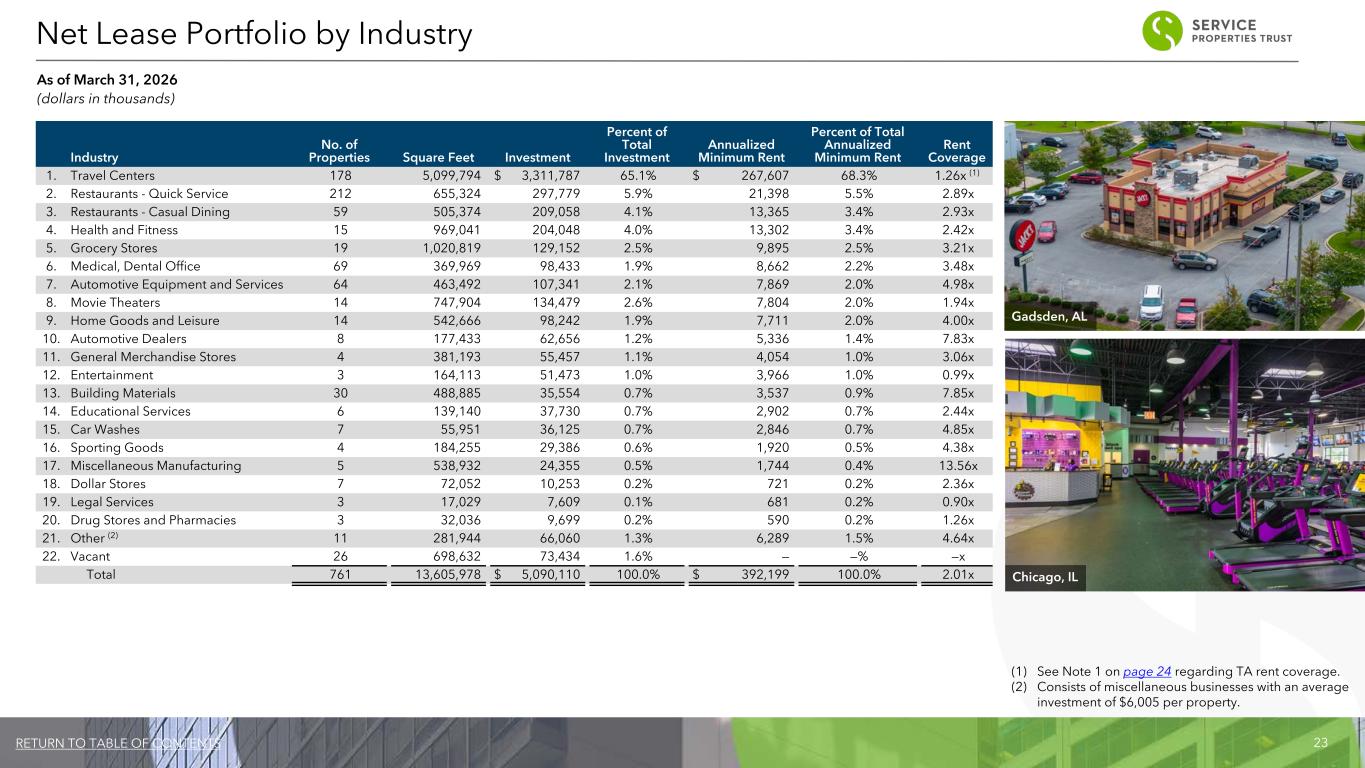
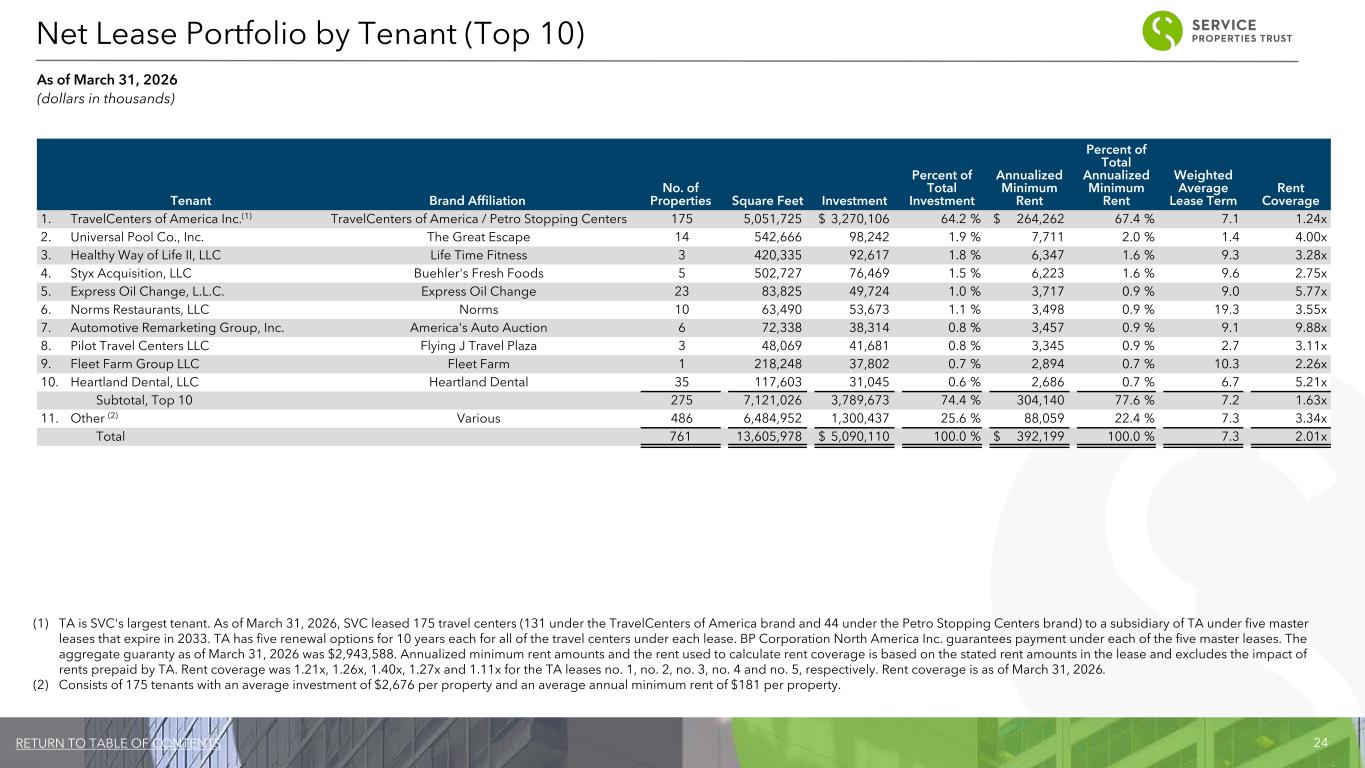
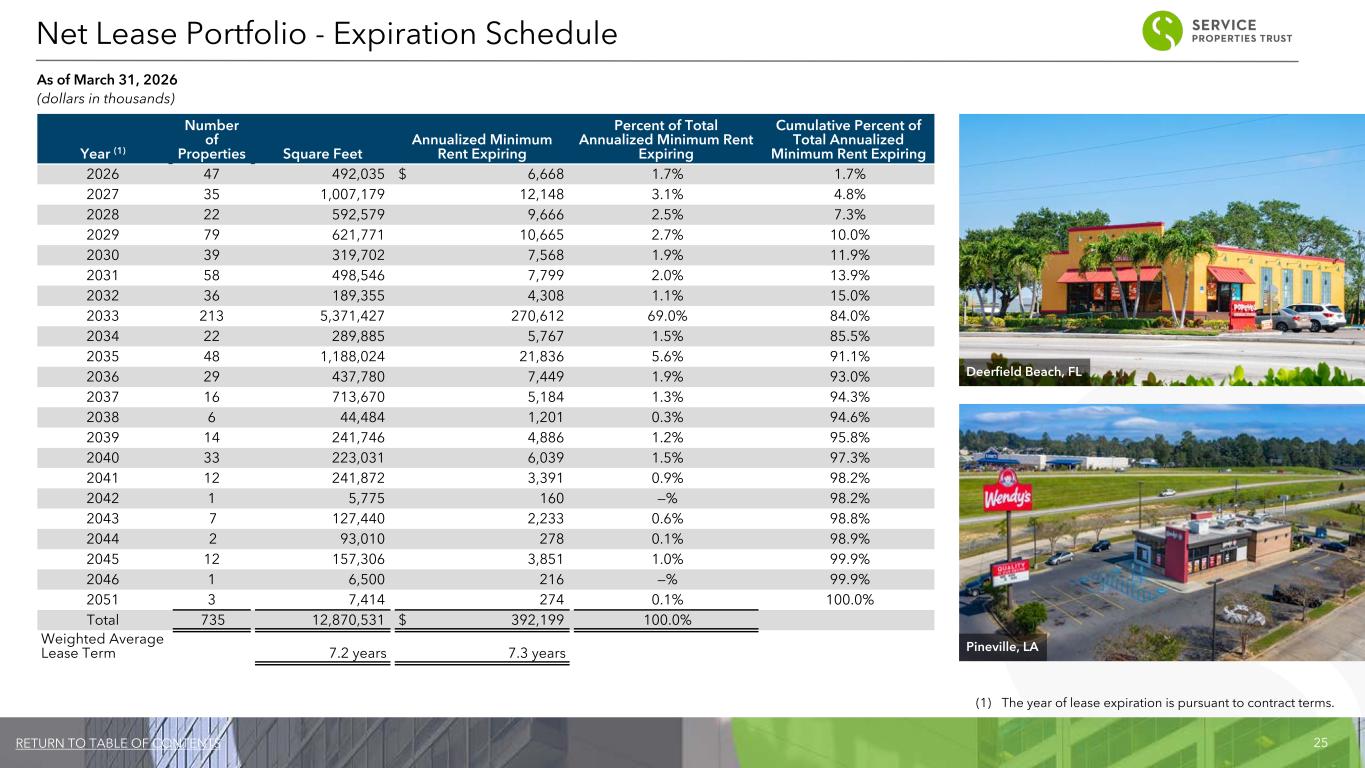
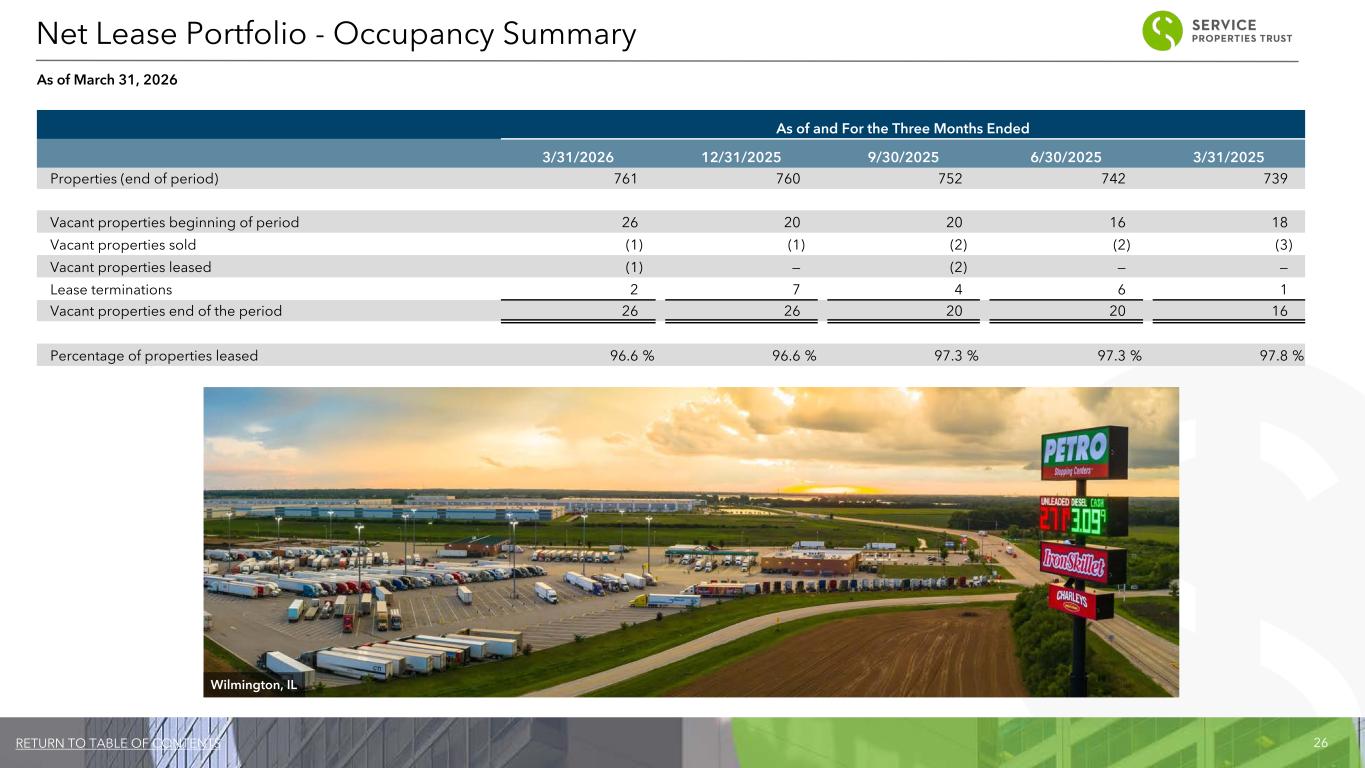
Thanks, Chris, and good morning. At quarter end, SVC's net lease portfolio contained 761 properties across 42 states with annual base rents of $392 million. The portfolio was approximately 97% leased with a weighted average lease term of 7.3 years. We have 185 tenants operating under 140 brands across 21 distinct industries. The aggregate coverage of our net lease portfolio's minimum rents was 2.01 times on a trailing 12-month basis as of March 31st, 2026, up slightly from last quarter. The improvement was driven in part by our TA travel centers, which reported coverage of 1.24 times, up from 1.2 times in Q4. During the quarter, our asset management team executed 20 leases, totaling 219,000 square feet, averaging over six years of term and a cash rent roll-up of 8.5%. Looking ahead, portfolio lease expirations remained well-laddered, with less than 5% of annualized rents expiring through the end of 2027. NOI from our net lease portfolio declined $2.2 million year over year, primarily driven by credit loss reserves recorded for certain leases and related operational expenditures, which was partially offset by a $2 million positive impact from our acquisition activity. As we entered 2026, we shifted to a more measured pace of net lease acquisitions, targeting approximately $25 million of annual volume funded through capital recycling. Since the beginning of the year, we've invested in four properties totaling $9 million, which were primarily funded with the proceeds from 13 net lease dispositions. Consistent with our investment focus on resilient, necessity-based brands with limited e-commerce exposure, our acquisitions this quarter included quick service restaurants and an automotive services retailer. The transactions had a weighted average lease term of over 15 years, average rent coverage of 3.8 times, and an average going-in cash cap rate of 7.9 percent of 8.8 percent. As we move through the year, we will continue to actively look for ways to recycle capital by leveraging our new and established brand relationships while pursuing growth opportunities in the form of sale leasebacks and off-market deals. Proactive asset management efforts and disciplined capital recycling strategy should allow the And that leads portfolio to continue to function as a stable foundation for SBC as it implements its broader transformation. And with that, I'll turn the call over to Brian to discuss.
Speaker 5
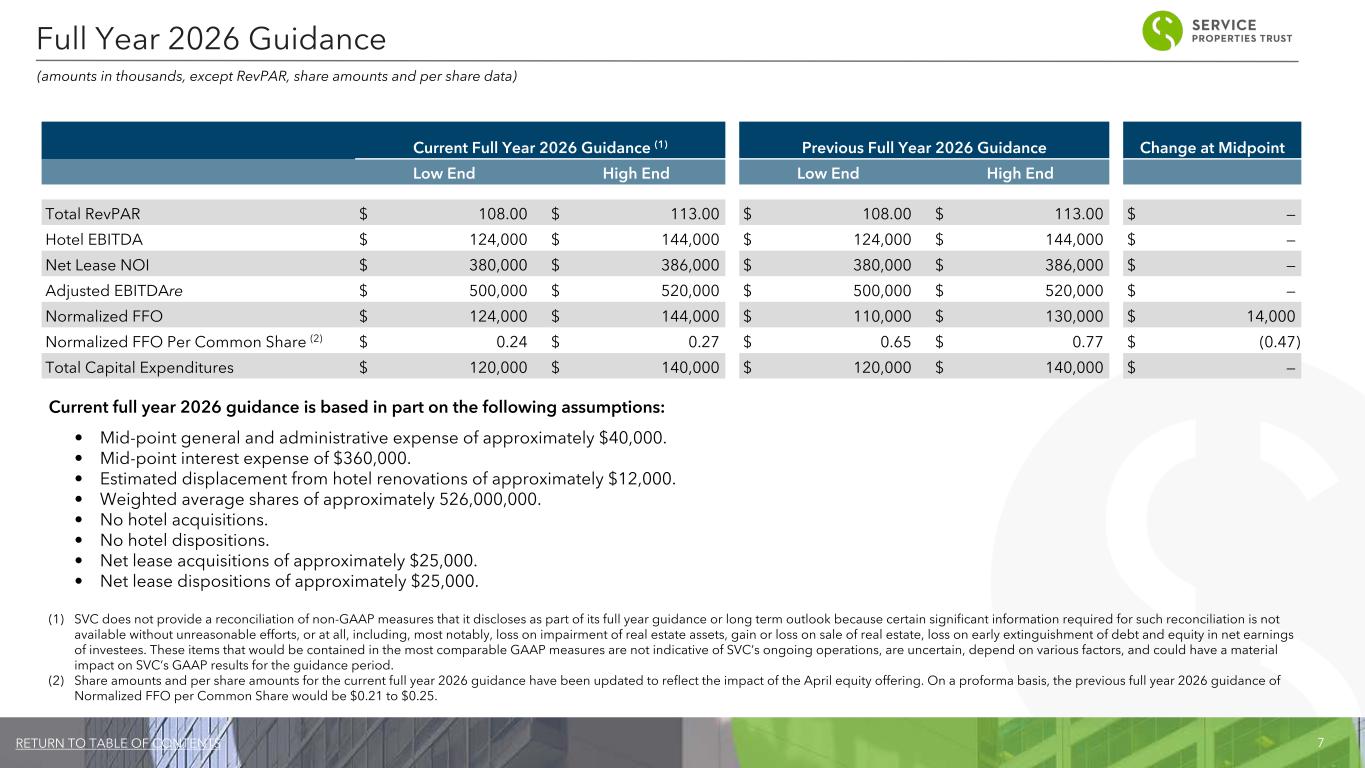
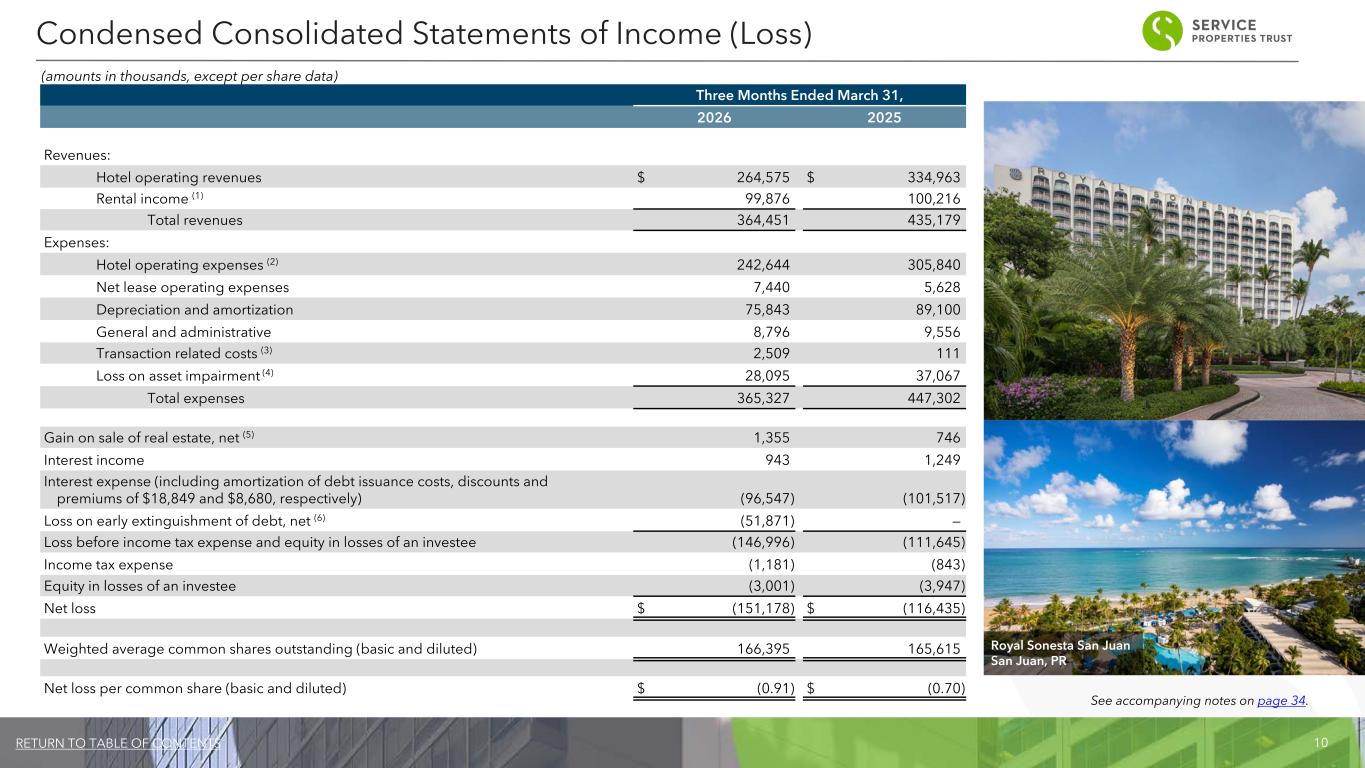
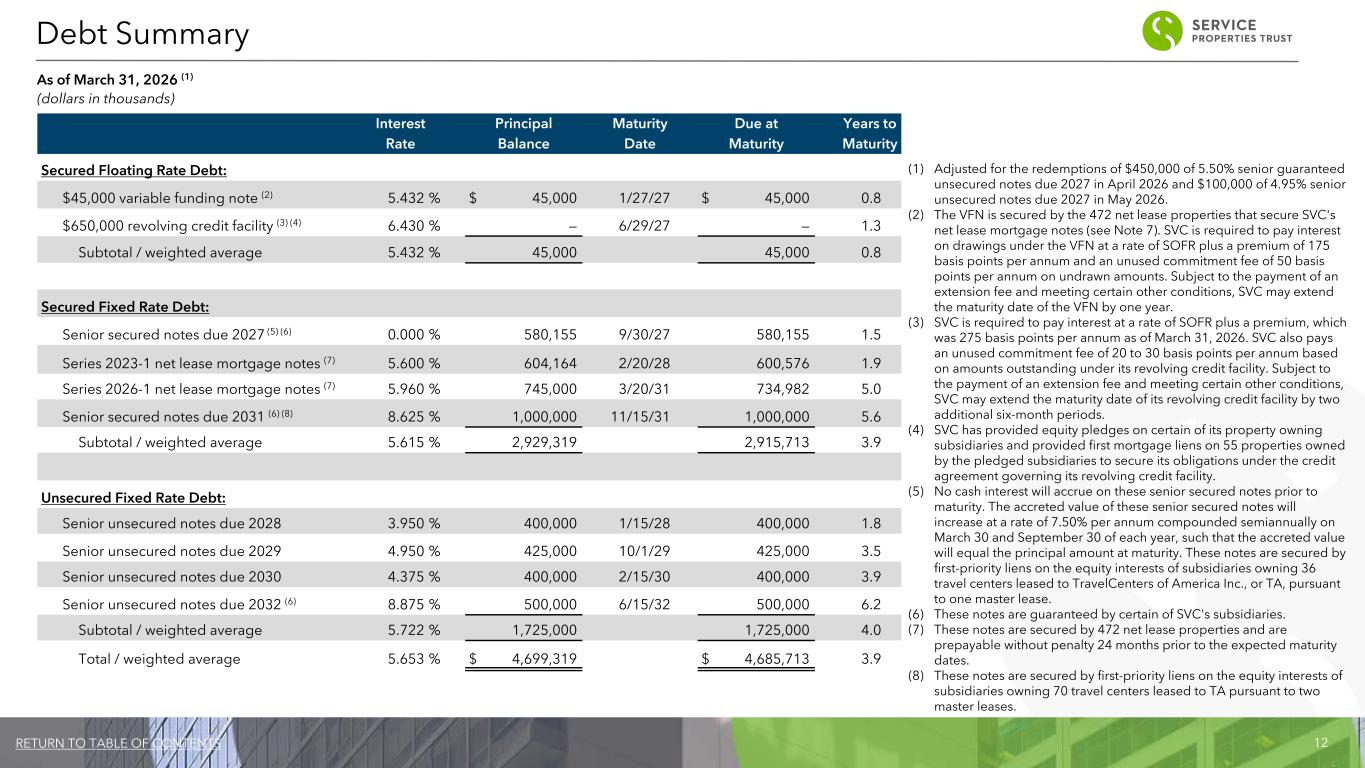
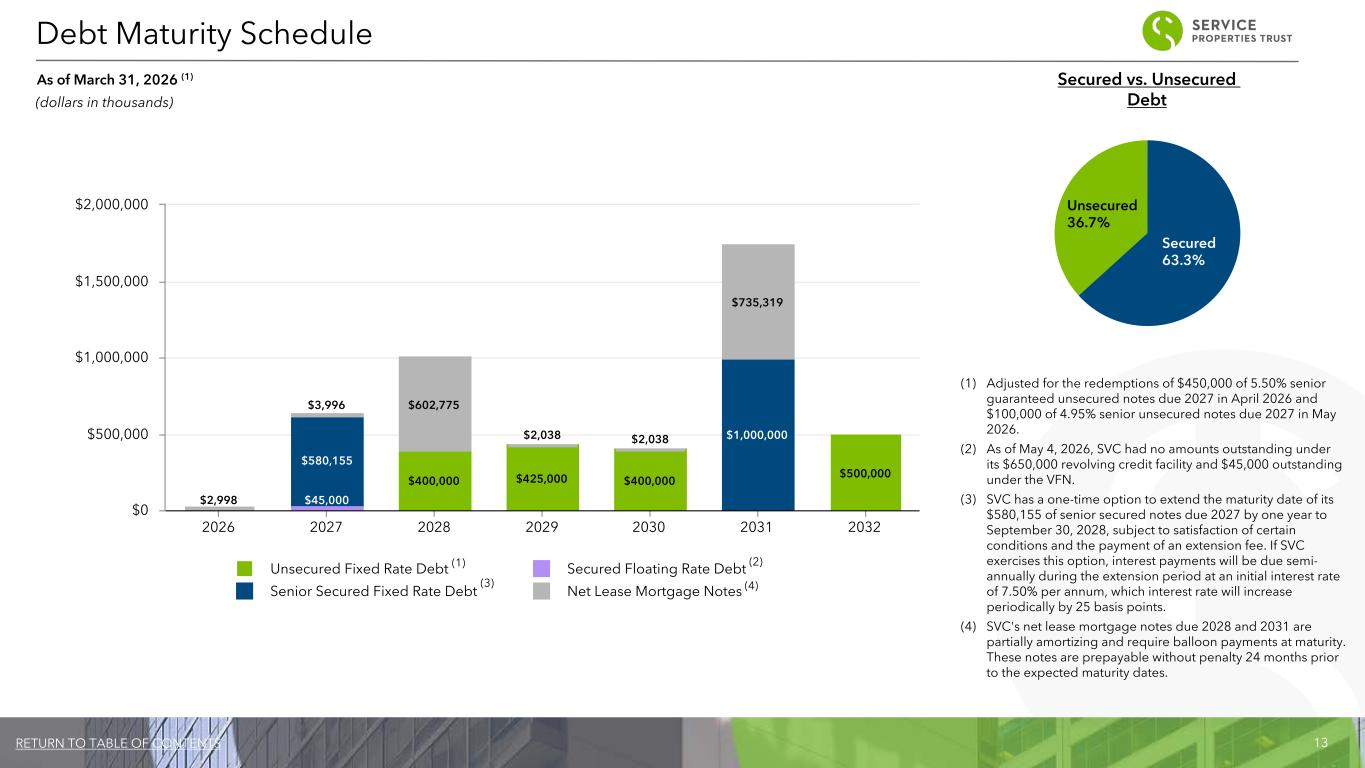
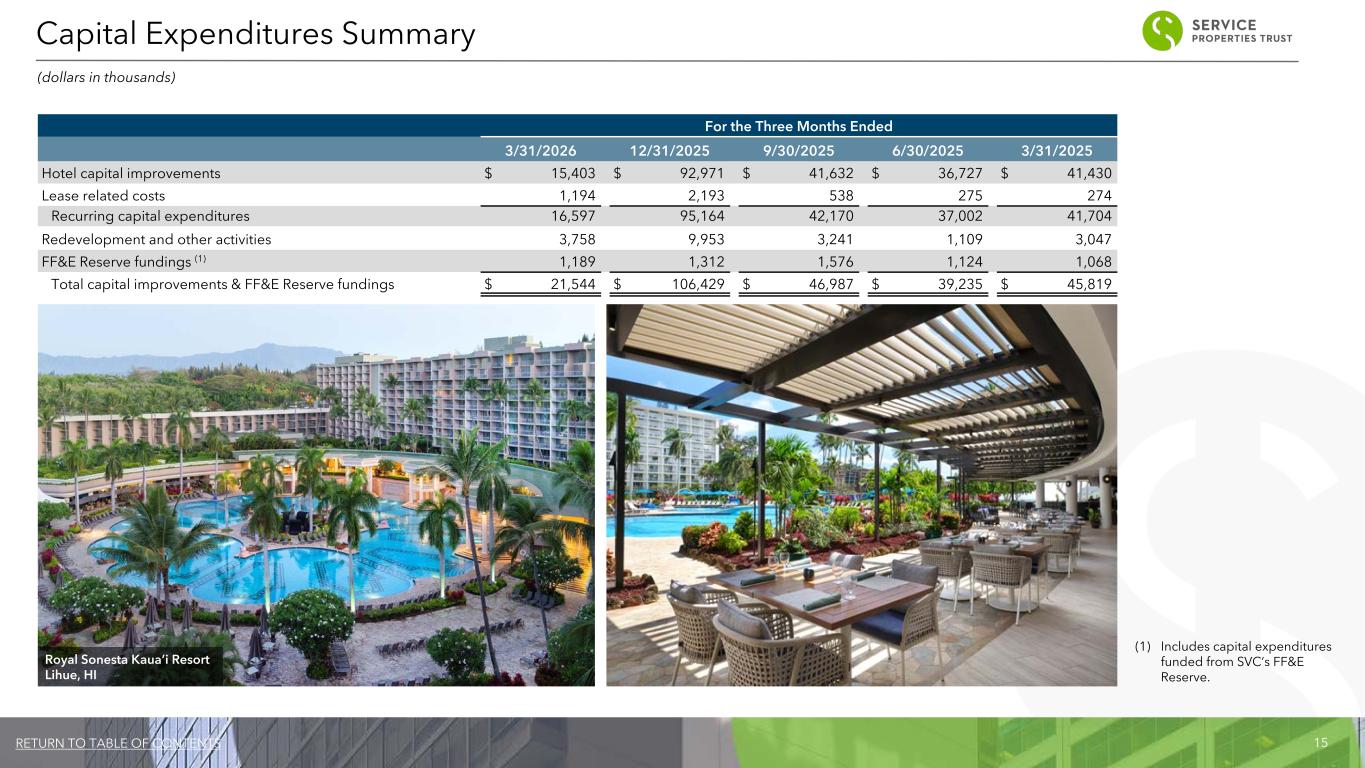
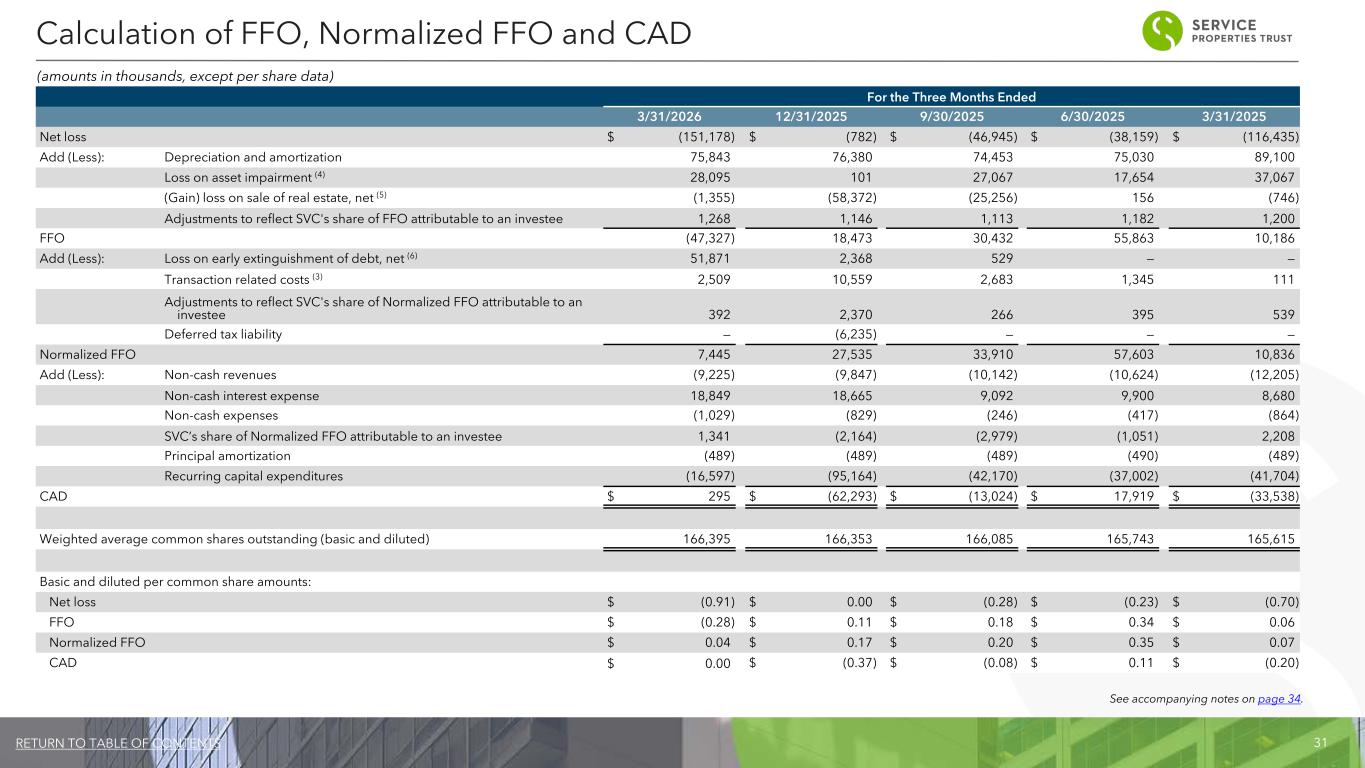
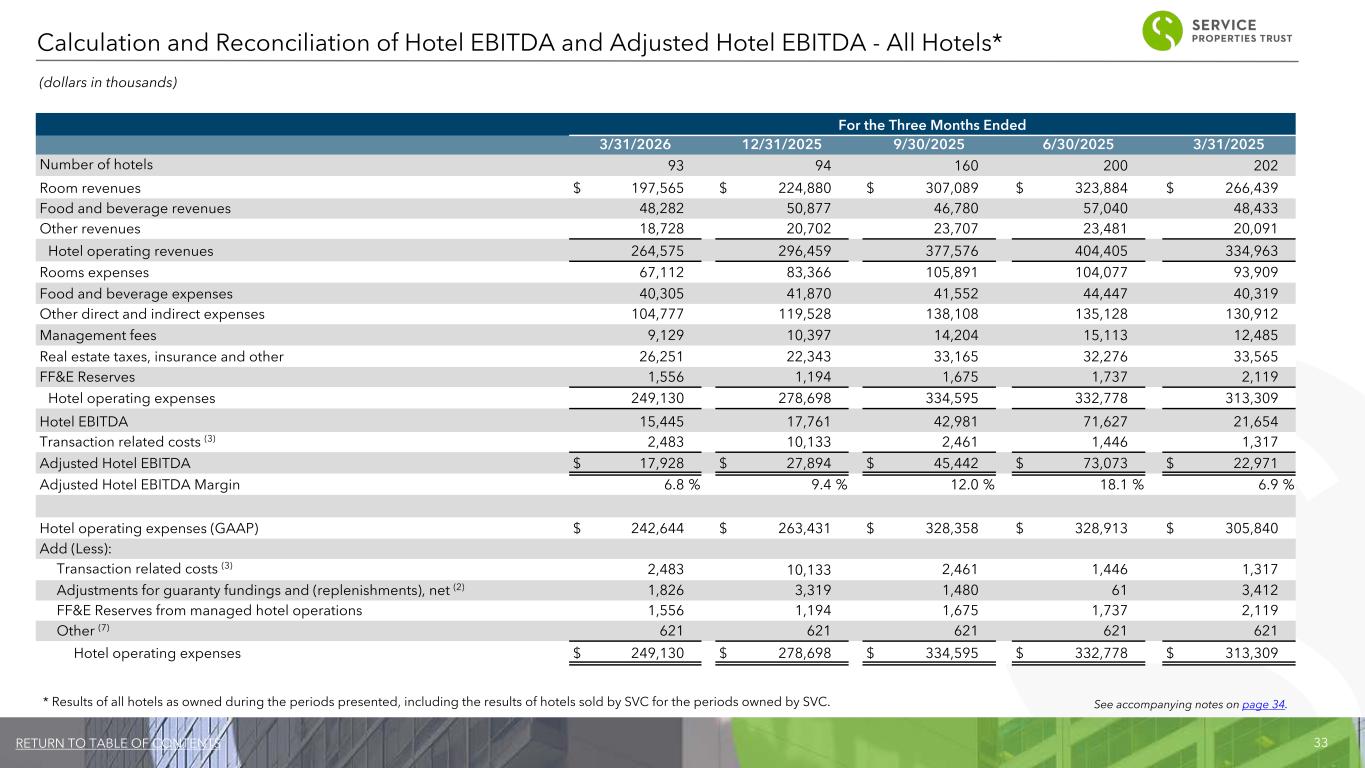
Thank you, Jesse. Good morning. Starting with our consolidated financial results for the first quarter of 2026, normalized FFO was $7.4 million or 4 cents per share, down 3 cents per share compared to the prior quarter. Normalized FFO this quarter as compared to the prior quarter was primarily impacted by a $7.2 million or $0.04 per share decline in hotel results. Our hotel disposition activity accounted for $5.3 million of the decline, and $1.9 million was a result of the performance of the 15 hotels we are selling, partially offset by earnings growth in our 78 retained hotels as of quarter end. And a wide from our net lease portfolio declined $2.2 million or $0.01 per share over the prior year on credit losses recorded during the quarter. Interest expense declined by $5 million, or $0.03 per share, during the period as a result of our capital markets activity. Turning to our hotel portfolio performance, for our 93 comparable hotels this quarter, REVPAR increased by 6.7%, and gross operating profit margin percentage declined by 70 basis points to 20.4%. Below the GOP line costs at our comparable hotels increased by $5.4 million from the prior year, driven by higher insurance expenses. Our comparable hotel portfolio generated adjusted hotel EBITDA of $18.4 million during the quarter, a decline of $1.9 million, or 9% from the prior year. The 15 Sonesta exit hotels we're currently marketing for sale generated a rev par of $49, a decline of 3%, and produced losses of $7.8 million for the quarter, a decline of $2.4 million dollars year-over-year. The 78 hotels in our retained portfolio generate a rev-par of $113, an increase of 750 basis points year-over-year, and adjusted hotel EBITDA of $26.2 million during the quarter, an increase of 2% year-over-year. Hotel EBITDA declined $3.8 million for the seven hotels under renovation, including our South Beach Hotel. The 86 hotels not under renovation improved Kotel EBITDA by $1.5 million or 8% over the prior year. Turning to the balance sheet, we've been active in the capital markets and took steps to further strengthen our balance sheet, improve our debt maturity ladder, and our cash flows. During the first quarter, we repaid $300 million over February 2027, 4.95% on secured senior notes with cash raised from asset sales. We completed our second ABS offering for $743 $35 million at a blended interest rate of 5.96% and a maturity of March 2031. We securitized 158 net lease assets, including 34 travel centers, demonstrating the value of these assets and their attractiveness to investors. We used the proceeds from this offering to fully redeem all $700 million of our 838 Senior Unsecured Guaranteed Notes due June 2029, resulting in an annual cash interest savings of approximately $14 million. We also raised net proceeds of $542.3 million from our recent equity offering and redeemed all $450 million of our outstanding 5.5% senior guaranteed unsecured notes due 2027 and the remaining $100 million of outstanding 4.95% senior unsecured notes due in February of 2027, resulting in additional annual cash savings of $29.7 million. Following these capital market transactions, we currently have $4.7 billion of debt outstanding with a weighted average interest rate of 5.65%. We have no unsecured debt maturities until 2028, and our 2027 and 2028 secured debt maturities have substantial refinance of optionality supported by strong net lease collateral. Further, SVC was recognized last week by Moody's, which upgraded its SVC corporate family rating, underscoring the clear progress we are making in strengthening our financial profile. Turning to our capital expenditure activity, during the first quarter, we invested $21.5 million in capital improvements. First quarter activity was largely driven by the renovation of the Nautilus in Miami, as well as projects at the Royal Sinestas in Boston, Washington, D.C., and Austin, Texas. Turning to our annual guidance, we are reaffirming our full-year outlook for hotel EBITDA, net lease NOI, and consolidated adjusted EBITDA. First quarter and normalized FFO results were in line with our expectations and reflect the anticipated seasonality of our hotel portfolio and the planned renovation displacement embedded in our initial guidance. We are increasing our normalized FFO range as a result of our debt repayments to $124 million to $144 million, or $0.24 to $0.27 per share. The per share amounts assumed a weighted average share count of 526 million shares. This full-year guidance assumes midpoint interest expense of $360 million and G&A expense of $40 million. This guidance does not reflect the impact of completing any of the 15 Sonesta hotel dispositions and continues to assume $25 million of capital recycling in our net lease portfolio. We continue to expect total capbacks for the year of $120 to $140 million. To conclude, our first quarter results demonstrate continued momentum, repositioning SVC and strengthening the company's cash flows, supported by our strategic capital market transactions. As we move forward, we remain focused on growing EBITDA and further optimizing SVC's portfolio to drive sustained value for our shareholders. That concludes our prepared remarks. We are ready to open the line for questions.
Operator
We will now begin the question and answer session. To ask a question, you may press star then 1 on your telephone keypad. If you are using a speakerphone, please pick up your handset before pressing the keys. If at any time your question has been addressed and you would like to withdraw your question, please press star then 2. At this time, we will pause momentarily to assemble our roster. And the first question today comes from Jack Armstrong with Wells Fargo. Please go ahead.
Hey, good morning. Thanks for taking the question. First one for me on the net lease operating expenses, you know, up roughly $2 million both sequentially and year over year, which by our math throw the majority of the myths versus our estimates. Can you talk a little bit about the moving pieces there and how we should be thinking about the run rate for the rest of the year?
Sure, Jack. This is Jesse. I'll take it. Right. So, as I mentioned, we booked about $2 million in credit losses. A portion of that was expenditures related to those assets, and the bulk of that was property taxes. And what happened there, really, is we had two franchisees that filed for bankruptcy. So, we're essentially covering the property taxes in the meantime. On a go-forward rate, this, in our opinion, is a one-time hit. And with respect to all these assets, they're all really good performers for us. The expectation would be ultimately that they would come out of bankruptcy and get transitioned either to new franchisees or back to corporate and get back to kind of a rent and opex paying state.
Okay. And then just on rent coverage in the rest of the portfolio, can you talk a little bit about what drove the expansion and coverage for the TA portfolio? How do you expect that to develop over the remainder of the year, and then also walk us through any changes on your tenant watch list. We noticed you've got a couple that are well below one-times coverage with both down significantly from Q4.
Yeah, so with respect to TA, our perception of that is kind of twofold. On the one hand, TA has historically benefited from kind of a pricing volatility, which certainly we're seeing as a function of the geopolitical situation in the Middle East. You know, typically there's kind of a lag between wholesale and retail pricing, and TTA has been able to take advantage of that. And that, coupled with what we saw from our freight operators nationally, which was actually an increase in freight demand, a function of some regulatory changes that removed some excess capacity off the roads, which helped freight pricing. And then industrial demand was up, I think, largely a function of data center construction and related activities. So, on the TA side, I think the expectation would be some of that is likely transitory, you know, related to the Middle East situation. Some of that from the freight demand side is hopefully going to be more persistent. And in either event, you know, there's an opportunity there for that to provide something of a bridge for us as TA themselves, the new leadership, kind of enacts their business improvement plan and hopefully can put in some more structural changes to kind of drive a bit of growth going forward. On a tenant watch list, I mean, I would say that, you know, there are things – we have a small exposure to drugstores and movie theaters. You know, we're watching those, and then the bulk of it would be with respect to those two franchisees that I mentioned earlier. The NAT has been pretty consistent performance across the portfolio.
Okay, and then jumping over to the hospitality side of things, you know, pretty strong rev par in the quarter and even stronger in the routine portfolio, but margins are still down 10 basis points. Can you talk about what happened there on the expense side and any expectations you may have for improvement over the course of the year?
Speaker 5
Sure, Jack, good morning. This is Brian. One of the big impacts we had this quarter was rising insurance costs. We had some premium increases on the liability side that hurt margins. We had some deductibles that reported for different incidents across the portfolio, which is more, you know, some of those recur here and there, But the premiums were the bigger driver. You know, labor wasn't really an outsized impact. I think overall labor costs were up 3% year over year. It's still something we're trying to, you know, monitor closely and work with our operators on the staffing models of the hotels. You know, so I think as we move forward, I mean, you know, Q1 is typically seasonally weaker. You know, Q2, as we go into, you know, the stronger summer season, you know, we'll hopefully drive more margin through the portfolio and, you know, expense management and labor modeling is on the forefront to try to mitigate and improve our flow through.
Okay. And then kind of with that in mind, you know, what's giving you confidence in the unchanged Hotel EBITDA annual guidance there with, you know, booking trends into the rest of Q2?
Speaker 5
Yeah, a lot of the things we talked about what impacted Q1, you know, we had factored in our guidance range, you know, there's still more to play out in the broader economy, you know, impacts from, you know, citywide events, including World Cup and things of that nature that, you know, Scott, we don't want to, I don't think anybody has clear visibility of what the total impact is going to be. um yeah but we you know we feel like there's um you know pretty good trends continuing into the spring and early summer you know uh our red bar growth into april was comparable to what we saw on q1 so i think you know those patterns have continued so we haven't seen any signs of sort of slowdown and you know there's still some things to play out as the summer rolls through across our portfolio and you know we're going to continue to see uplift from hotels that we completed last year. We're still building back group business and contract business from those hotels that were displaced last year and there's still more opportunities hopefully ahead.
And last one for me, just at the corporate level, could you maybe provide an update on the change you're planning to make to the board as well as the new leadership at Sinesta and how you expect both of those to impact your strategy as we go to the back half of the year and then also if you're considering waiving your bylaw limiting individual holders to five percent yeah i guess i'll take in a couple parts so with respect to the the question on the board i think as communicated um in kind of some of our public announcements you know we will be working towards bringing on a new board member uh you know more specifically uh with lodging experience and kind of that process will continue to play out so uh nothing to report you know with respect to that today but something that continues to kind of advance and so we think that'll be generally constructive and kind of a positive for kind of the company and governance accordingly. I think more specifically yeah on the Sonesta piece with respect to the new management team as we talked about historically you had a new management team that came on board effective in April, I mean, we're, you know, just over 30 days into that now and the team is, you know, off to a strong start really kind of trying to identify and unpack changes at WholeCo and then ultimately kind of how that will inform the hotel performance. But look, I think generally speaking, I mean, we feel pretty optimistic about, you know, a lot of the things that we're collectively talking about, you know, between our company and theirs and some of the changes they're making. I mean, some of it is not new. You know, we've continued to target kind of revenue mix being a top priority and how we drive additional business through group and contracts. Some of that's going to be changes that they make on their end, and some of that's going to be deployment of new tools across all the operators, such as utilizing AI for better lead generation or better competitive set insight. So there's just a mix of fundamentals that we would expect to occur on that side of the business. But then I think more specifically for Synesta, as we think about the expense load and margins, you know, we're having a lot of dialogue about re-evaluating the offerings across the properties and kind of how that impacts the overall labor component, including contract labor, which we anticipate to see continued reductions. You know, one of the other things is, you know, with respect to kind of the global sales teams, So there's an effort to expand that group to kind of provide more benefits for a lot of the work we've been doing on the renovations and kind of having being better positions in the markets. And we think that will ultimately continue to drive group and contract business. And then, you know, naturally, I think the last thing with respect to Synesta is continuing to kind of give credence and time to the loyalty program and expanding that business. You know, certainly with all of these operators, you know, the benefit of the loyalty programs are kind of direct business through brand.com and other initiatives, you know, kind of reducing kind of more expensive acquisitions costs tied to the OTA.
Speaker 5
And your last question on the 5% for ownership stake in the shares, you know, I think, you know, if you look closely at the, the offering, the equity offering we did in April, we did provide waivers to certain groups that own more than 5%. You know, it's not something we're going to change formally, because it's, it's put in place to protect certain tax attributes of the company as a REIT, but it's something that, you know, we, you know, we consider here on one-off cases.
Really helpful all around.
Operator
Again, if you have a question, please press star, then one. Your next question comes from Tyler Patori with Oppenheimer. Please go ahead.
Hey, good morning. Thanks for taking my questions. A couple for me here, and first, I wanted to follow up on the asset sales on the hotel side of things and that process, the 15 you have in the market right now. Any help on the timeline for those? And then the seven full-service hotels, can you give us some more, maybe some guideposts on potential pricing for those assets? And then I'm also just curious why the performance at those properties has been so challenged.
Yeah, I think on the first question, look, given where we are, you know, other than one hotel, you know, We've kind of identified or have signed term sheets with buyers in support of that, and kind of there's a range. Some are groups we've worked with historically, and others are kind of new kind of relationships. And the process varies. I would say more than half the portfolio deposits will go hard with no real diligence. And then there's kind of on the low end, a 90-day period to close. And then kind of the balance is more traditional, you know, process whereby there's a diligence piece and then a period for close. And we've talked about, you know, these sales transacting in the back half of the year. And I think that's still kind of the right bogey. And I think hopefully over time, maybe we'll take down incremental pieces of them, you know, over the course of Q3 and Q4 versus necessarily being all backloaded at the end of the year. And so that's how I would think about it from a respect to timing. And then I think for performance on the hotels, I mean, look, we're selling these hotels, you know, just because, you know, around conviction in the markets and the capital that is needed. And I think that the performance decrease is just a byproduct of where those sit in certain markets. And our performance is not inconsistent with the broader trends that are occurring in those markets. And then you're also going to have some level of disruption as you go through a sale process. So, again, all the reasons why we have more conviction on wanting to exit these and kind of reduce cash track for the company.
Okay. Appreciate that. And then post-equity raise, where are you in terms of your covenants? And just talk about some of the additional flexibility that you have post-doing that equity transaction.
Speaker 5
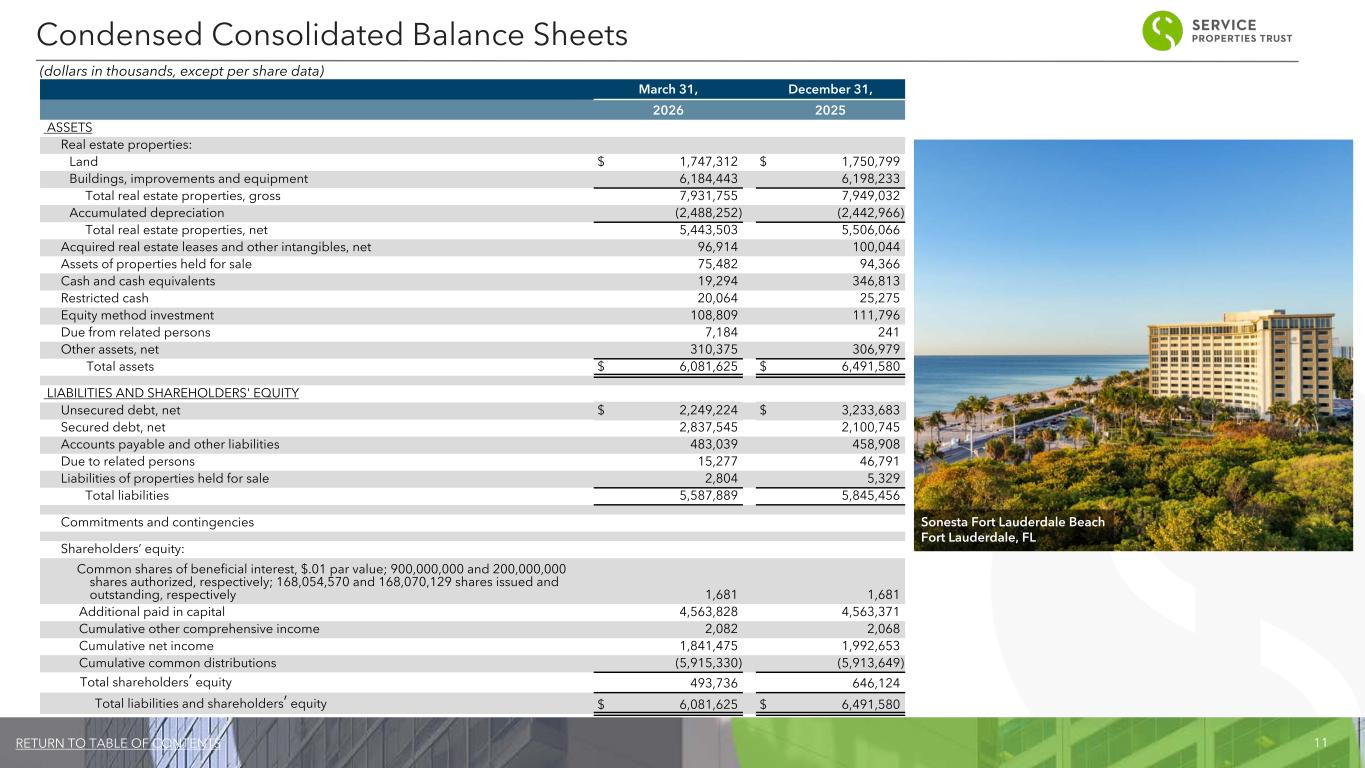
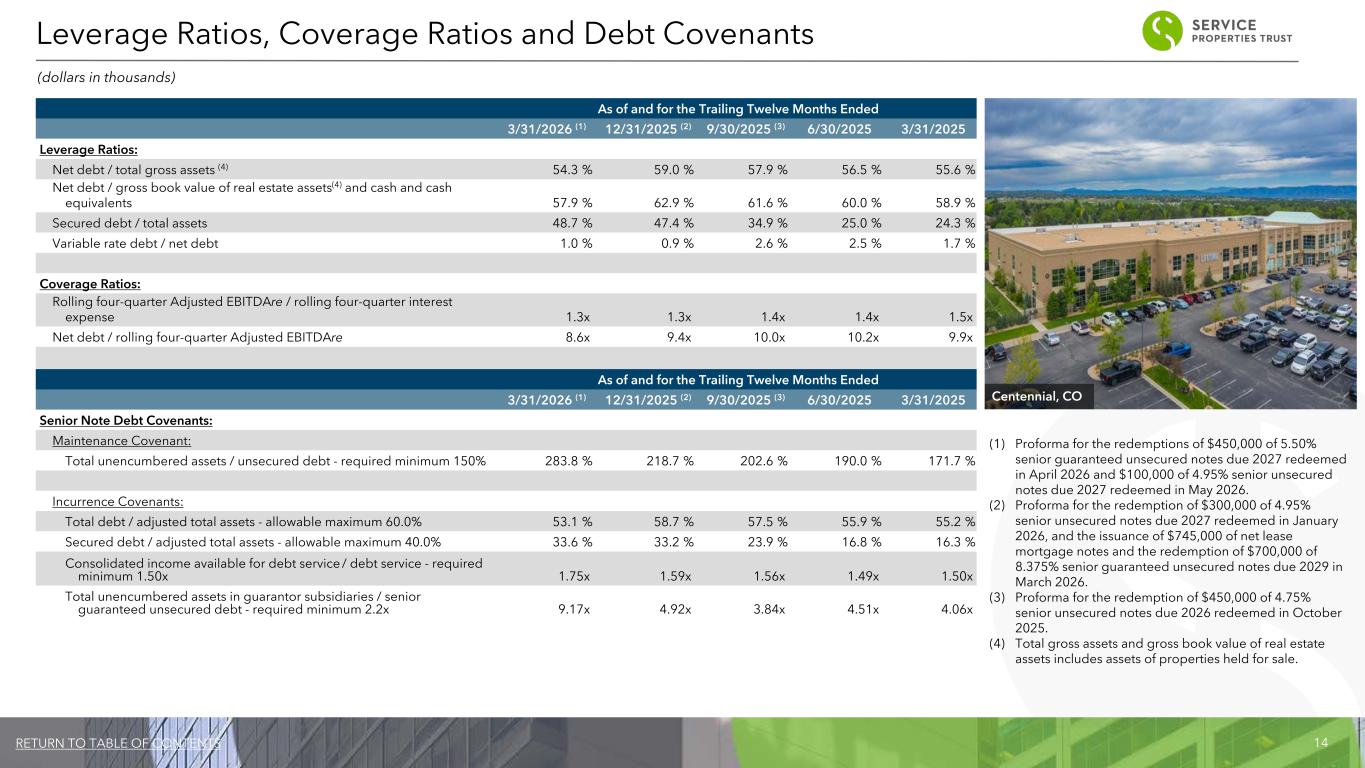
Sure. As of Q1, Tyler, you know, we were able to pay down the debt with the equity offering, the 550 million uh of 27 notes which which gave us significant cushion uh on our both our leverage ratio and our interest coverage you know so we took down uh you know debt to assets you know the 60 test from 59 down to 53 percent uh and then the interest coverage you know was at 1.75 times so there's a good amount of cushion there you know we we were we were very strategic as far the sizing of that equity offering to get us, you know, through the maturities, but also make sure we have enough operating flexibility within these covenants to refinance future debt maturities. The way we're looking at the next debt maturity, which is the zero coupons, you know, we'll have different options. You know, we'll potentially pay down some of the balance with asset proceeds that, you know, Chris has talked about. And then those notes are also backed by one of the travel center lease has given us, you know, increased flexibility as far as what we might do with those, but the covenant shouldn't necessarily be an issue going forward in the near future.
Okay. And then last question for me, maybe a little bit of a clarification too. In terms of the debt that you have upcoming, the 2027 senior secured notes, obviously there's an extension option there.
Speaker 5
Just talk about the conditions that allow you to extend that and sounds like the base case um we should just assume that that's just going to get pushed to 2028 yeah that's to be determined i mean we do have a one-year option it becomes a cash pay uh instrument at that point if we do and it has a um increasing scale of coupon uh the longer those notes are up for that extension period so i think the more likely scenarios we'll refi those out in some fashion uh it's just a little early to talk about it um you know given given when you know september of 27. okay um that's all for me.
Operator
Thank you. And your next question comes from John Masocha with B. Riley Securities. Please go ahead.
Good morning. Maybe sticking with Tyler's line of questioning, if you think about the proceeds from upcoming hotel sales, would those have to be used towards paying down the zero coupon? Or is that, you know, when you talk about using asset sale proceeds to pay down the zero coupon, would it be assets that are currently collateralizing that piece of debt?
Speaker 5
Yeah, I mean, I think, you know, we're going to be thoughtful around that. You know, the way those zero coupons work, we took discounted proceeds and essentially, you know, we're paying the interest over advertising over time. So, if we pay them off early, you know, we're extinguishing that early. We're taking a hit on the discounted value. You know, we have some options. You know, we have a small variable funding note of $45 million. dollars we could also pay out that matures in early 27 and then you know we could sit on the cash and wait for um you know closer to maturities and figure out where we're at from a strategic standpoint and uh what we do in the refinancing market um you know so there's some uh pieces to be determined as we move through these asset sales and what we do with the cash yes it's not required so we have that flexibility okay um and then i guess of the kind of pool of full service assets you're looking to sell this year, how much of kind of the original estimate you put out was in the one asset that you pulled out of the selling bucket?
You know, just kind of curious, right? You're going from $90 to $110 million estimated at the end of last year to 55. And I'm just wondering how much of that is the removal of that one asset and how much of that is just a decline in what you're seeing in the market for the remaining assets?
Yeah. I think the combined awarded bids that we talked about was about $116 million. The removal of the one asset was give or take $5 million. And then we have another property where it's still in the market and we're expecting pricing kind of in Q2 in the near term, which will be another catalyst to increase overall proceeds.
Okay, so there's still one additional asset that is not in that $55 million bucket. Correct. There's one large full service asset that's not in those numbers. Okay. And then in terms of the extended stay and kind of select service assets you're selling, are those under contract right now? I guess what is timing for those dispositions in your mind today?
Yeah, everything has been awarded or under LOI, and so most of those, you know, I think the earliest they get close would be over a 90-day period. So, you know, I think kind of a good bogey is, you know, kind of mid-2, mid-2, 3. It's kind of a fair timeline on the early end, and then we'll just kind of see how it plays out, you know, between now and then.
And just to clarify, is pricing on those kind of going as expected?
Yeah, we know pricing came in line on those as well, but I think generally speaking, consistent with where we saw kind of the per-key valuations for last year.
So, you know, that's kind of where it stands. And then switching over to the net lease portfolio, I guess how should we think about the near-term impact of the tenant credit issues on the financials like the next couple quarters as the bankruptcy process plays out? I mean, was there anything in one queue that was particularly one time in nature, either for accounting reasons or something else, and could kind of bounce back immediately? Or when we talk about this, you know, not being typical run rate, is that more – that'll play out as the – as you get those assets kind of retenanted and back to fully paying rent?
Yeah, so these are two franchisees that we've been kind of in talks with and in front of for a while. So we knew this was going to hit. It just so happened that the bankruptcy filings happened this quarter, and so we don't think this is thematic in any real sense. But I think the way we anticipate this playing out is they'll go through the process, they'll negotiate some kind of outcome. Like I said, these are all strong assets for us, so these assets themselves got wrapped up into much broader portfolio bankruptcies. So we expect that at the end of the day, we'll probably emerge with a better credit profile, either with respect to the new franchisee or going back to corporate. We'll get back to a rent-paying status, and there's even the potential for some recovery of back rent and back OPEX. But, you know, that remains to be seen. But, again, the point here is it's a timing function. We don't think this is anything that will be persistent on a go-forward basis. And certainly nothing thematic in terms of the portfolio. I mean, these are both just so happen to be in our QSR space, which actually otherwise is performing really well for us.
And I guess just given the nature of bankruptcy declaration, I mean, would you expect some of the metrics either on the operating expense side or the top-line rent side to bounce back as soon as 2Q, or is that something that needs to bounce back once the bankruptcy process or a retenanting process kind of plays out?
Yeah, I think it's just going to depend on the vagaries of those bankruptcy proceedings, which are a little bit – can be inconsistent from a timing standpoint. You know, it could be Q2, it could be Q3, but somewhere within that timeframe.
All right, and just maybe one last one. You know, it seems like there was, you know, from the – in guidance from the equity raise, there was about $17 million of interest expense savings, but only $14 million of kind of additional uplift on normalized FFL. So, just curious what was kind of driving the delta there.
Speaker 5
Yeah, it really comes down to the net lease credit losses we just talked about. Jack, that's really the delta. You know, I'm not going to try to say we're going to pick back up on that net lease piece, you know, so we're turning towards, you know, the lower end on the net lease guidance, which offsets some of that interest expense. But, you know, that's really the driver. Okay. That makes sense.
That's it for me. Thank you very much.
Operator
This concludes our question and answer session. I would like to turn the conference back over to Chris Bellotto, President and Chief Executive Officer, for any closing remarks.
Thank you for joining our call today. We look forward to meeting and seeing many of you at the upcoming industry conferences, including NAIRED in June.
Operator
The conference has now concluded. Thank you for attending today's presentation. You may now disconnect.