Operator
Hello, everyone, and thank you for joining the Texas Capital Bank Share, Inc. full year and Q4 2025 earnings call. My name is Claire, and I will be coordinating your call today. During the presentation, you can register a question by pressing star followed by one on your telephone keypad. If you change your mind, please press star followed by two on your telephone keypad. I will now hand over to Jocelyn Koukouka from Texas Capital Bank to begin. Please go ahead.
Good morning, and thank you for joining us for TCBI's fourth quarter 2025 earnings conference call. I'm Jocelyn Kokolka, head of Investor Relations. Before we begin, please be aware this call will include forward-looking statements that are based on our current expectations of future results or events. Forward-looking statements are subject to both known and unknown risks and uncertainties that could cause actual results to differ materially from these statements. Our forward-looking statements are as of the date of this call, and we do not assume any obligation to update or revise them. Today's presentation will include certain non-GAAP measures, including but not limited to, adjusted operating metrics, adjusted earnings per share, and return on capital. For reconciliation of these and other non-GAAP measures to the corresponding GAAP measures, please refer to the earnings press release and our website. Statements made on this call should be considered together with the cautionary statements and other information contained in today's earnings release, our most recent annual report on Form 10-K, and subsequent filings with the SEC. We will refer to slides during today's presentation, which can be found along with the press release in the Investor Relations section of our website at TexasCapital.com. Our speakers for the call today are Rob Holmes, Chairman, President, and CEO, and Matt Scurlock, CFO. At the conclusion of our prepared remarks, the operator will open up the call for Q&A. I'll now turn the call over to Rob for opening remarks.
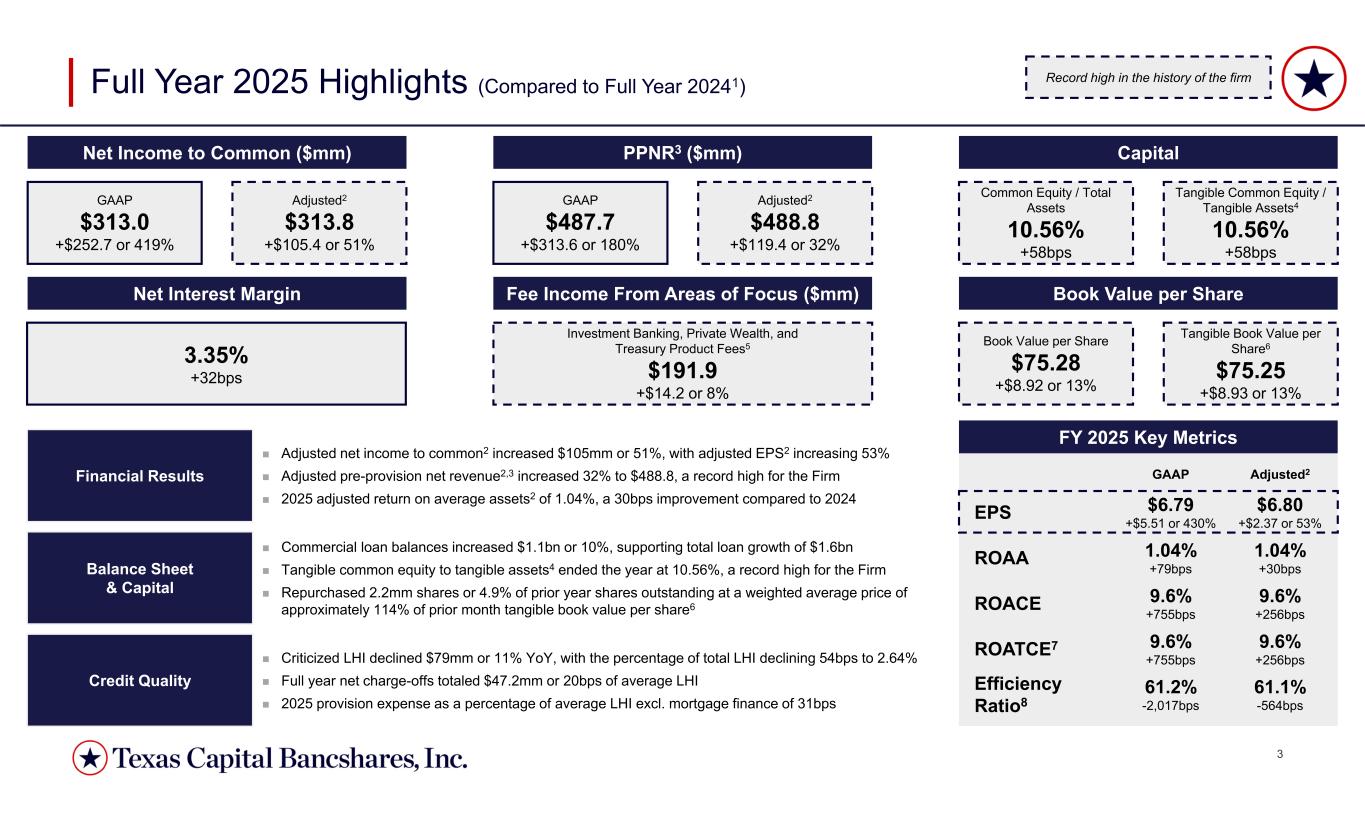
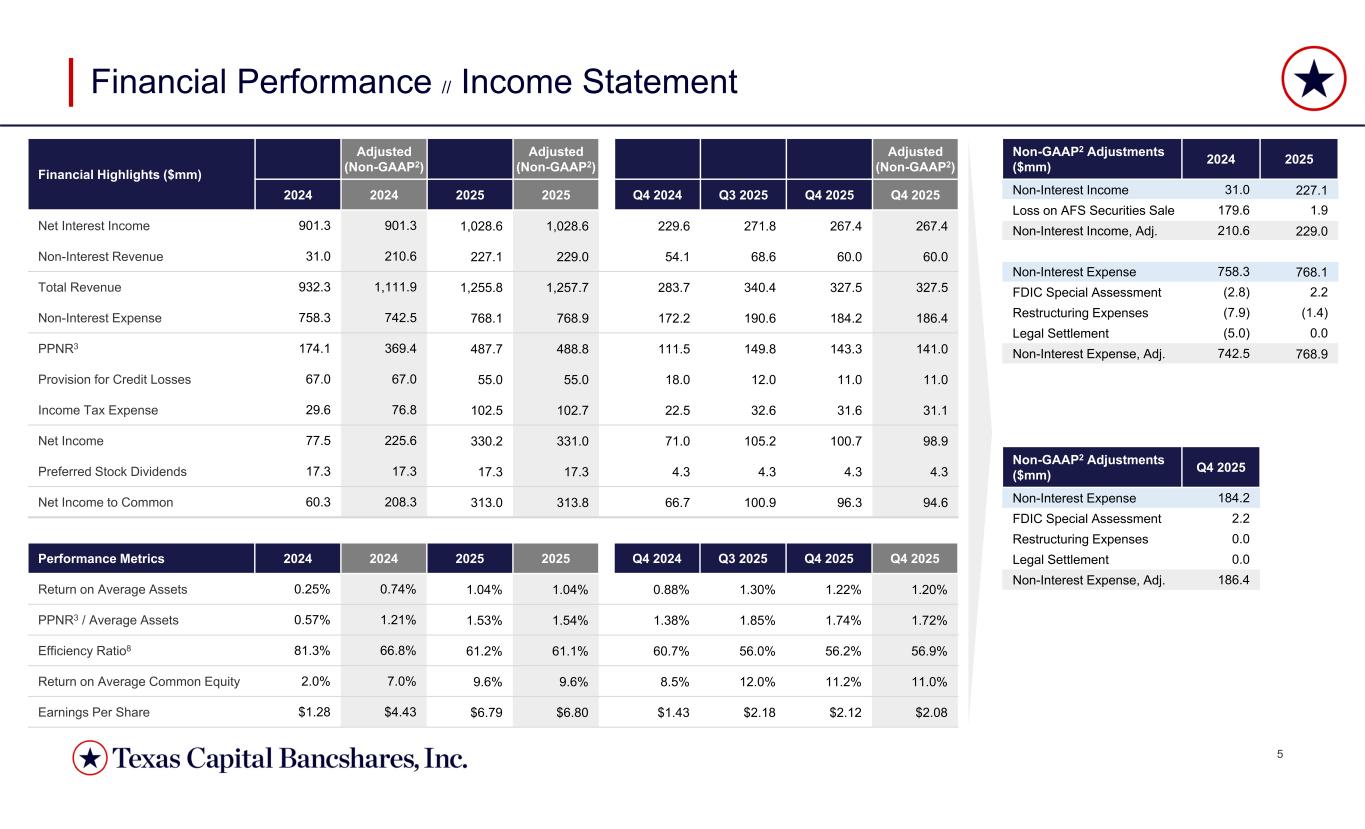
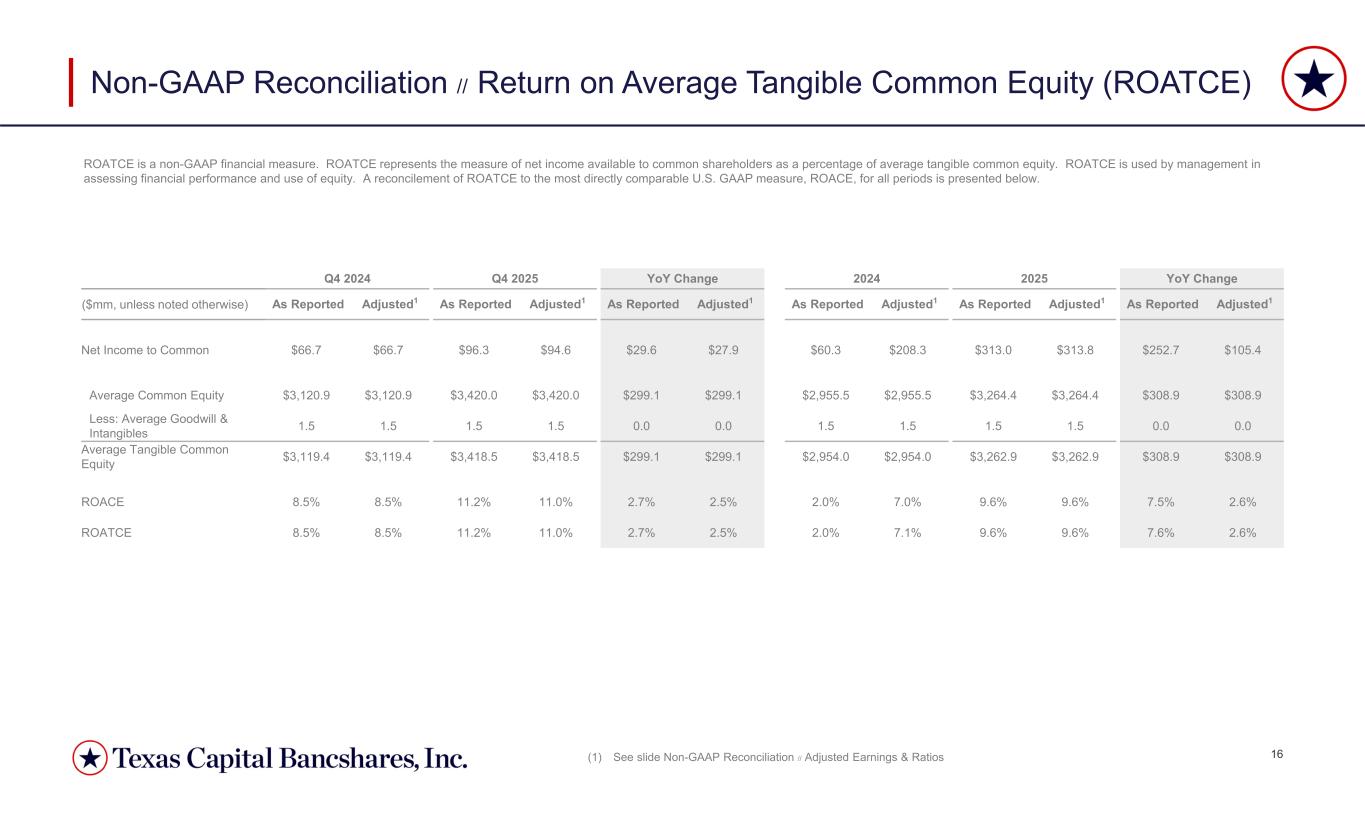
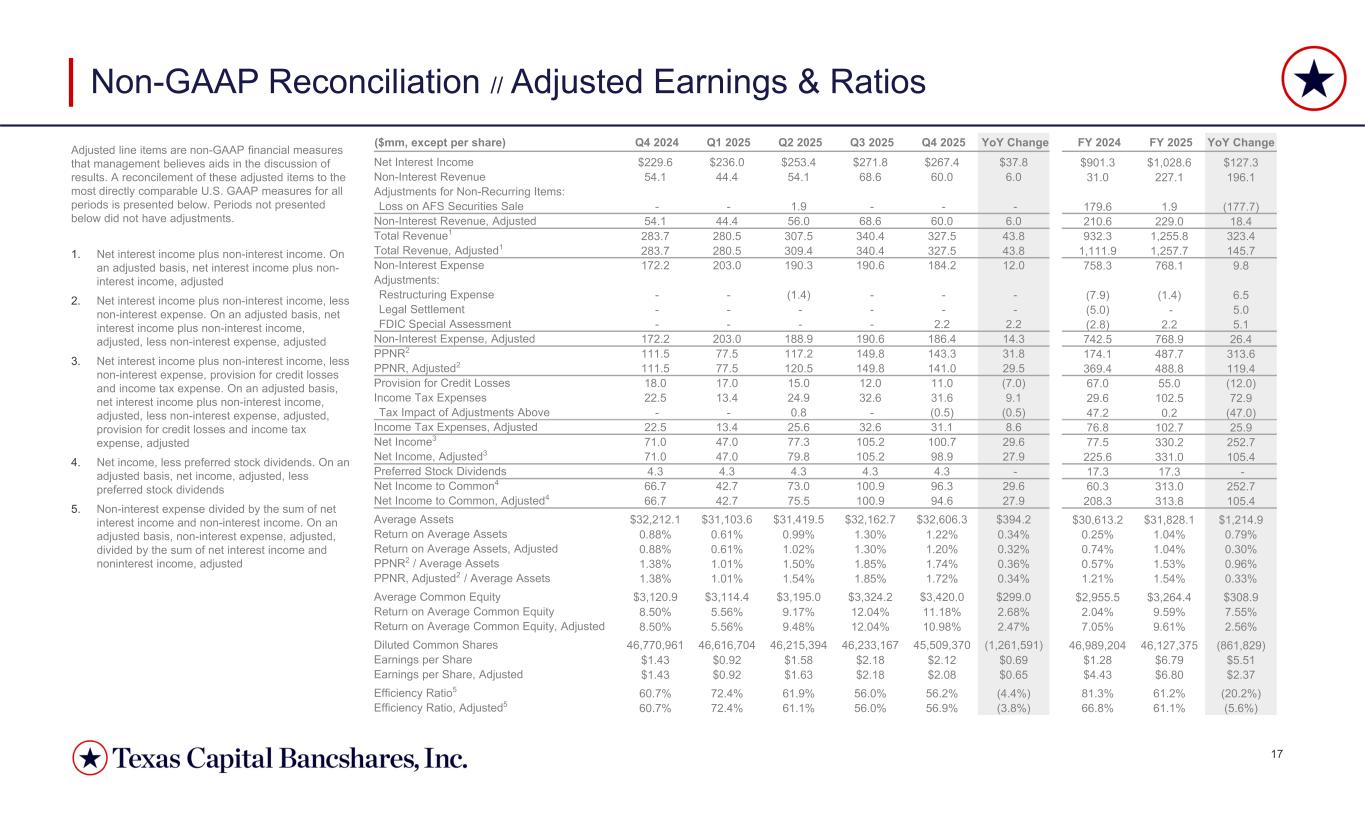
Thank you for joining us today. 2025 was a defining year in this firm's history. In the third quarter, we achieve our stated financial targets, marking completion of our transformation and delivering the largest organic profitability improvement of any commercial bank exceeding $20 billion in assets over the past two decades we reinforce this achievement in the fourth quarter with a 1.2% ROAA demonstrating that our third quarter performance was not an anomaly but instead reflects firm-wide client obsession unwavering commitment to operational excellence in a balance sheet and business model increasingly centered on the high value client segments that we are uniquely positioned to serve. Full year adjusted ROAA of 1.04% represents a 30 basis point improvement versus 2024 and signals a fundamental improvement of our earnings power. The result of discipline execution, strategic investments, conservative portfolio management, and sustained operational leverage. Our comprehensive 2025 results validate this trajectory. Record adjusted total revenue of $1.3 billion. Record adjusted net income to common stockholders of $314 million. Record adjusted earnings per share of $6.86. Record adjusted pre-provision net revenue of $489 million. dollars record fee income from strategic areas of focus of a hundred and ninety two million dollars equally important we achieved record tangible common equity to tangible assets of ten point five six percent and record tangible book value per share of seventy five dollars and twenty five cents metrics that underscore both the quality of our earnings and the prudence of our capital allocation strategy. Our disciplined capital allocation process remains focused solely on driving long-term shareholder value. We continue to bias capital toward franchise or creative client segments, evidenced by commercial loan growth of $1.1 billion or 10%, and interest-bearing deposits, excluding brokered and indexed, that increase $1.7 billion or 10% year-over-year. During periods of market dislocation in 2025, we opportunistically repurchased 2.2 million shares, or 4.9% of prior year's shares outstanding, at approximately 114% of prior month tangible book value per share. Since 2020, we have purchased 14.6% of our starting shares outstanding at a weighted average price of $64.33 cents per share, while adding 340 basis points to our peer-leading tangible common equity to tangible assets ratio. These achievements demonstrate a fundamentally stronger business model, one position to deliver consistent industry-leading returns and sustainable value creation for shareholders. Having established this strong foundation, our strategic focus now shifts to consistent execution and realizing the full potential of our investments. Our infrastructure, talent, and platforms are designed for scale, enabling us to handle significantly higher volumes and revenue while maintaining discipline expense management. A defining driver of our improved profitability is the diversification and growth of our fee income streams. Fee income areas of focus generated 192 million dollars in 2025 with substantial growth opportunity ahead. These businesses are differentiated in the market, capital efficient, and provide revenue stability across economic cycles. Focus investment in product capabilities, technology platforms, and talent will drive the income as a percentage of total revenue higher, further enhancing our return profile and reducing earnings volatility. The transformation over the past several years has fundamentally repositioned Texas Capital as a scalable, high-performing franchise. This positions us in a new phase, consistent execution and compounding returns. The combination of balance sheet growth, operating leverage, and fee income expansion creates multiple paths to enhance profitability and sustainable shareholder value creation. Our focus is clear, execute with discipline, scale with intention, and deliver consistent, superior returns. Our strategy, platform, talent, and momentum position us to achieve these objectives. Thank you for your continued interest in and support of Texas Capital. I'll turn it over to Matt for details on the financial results.
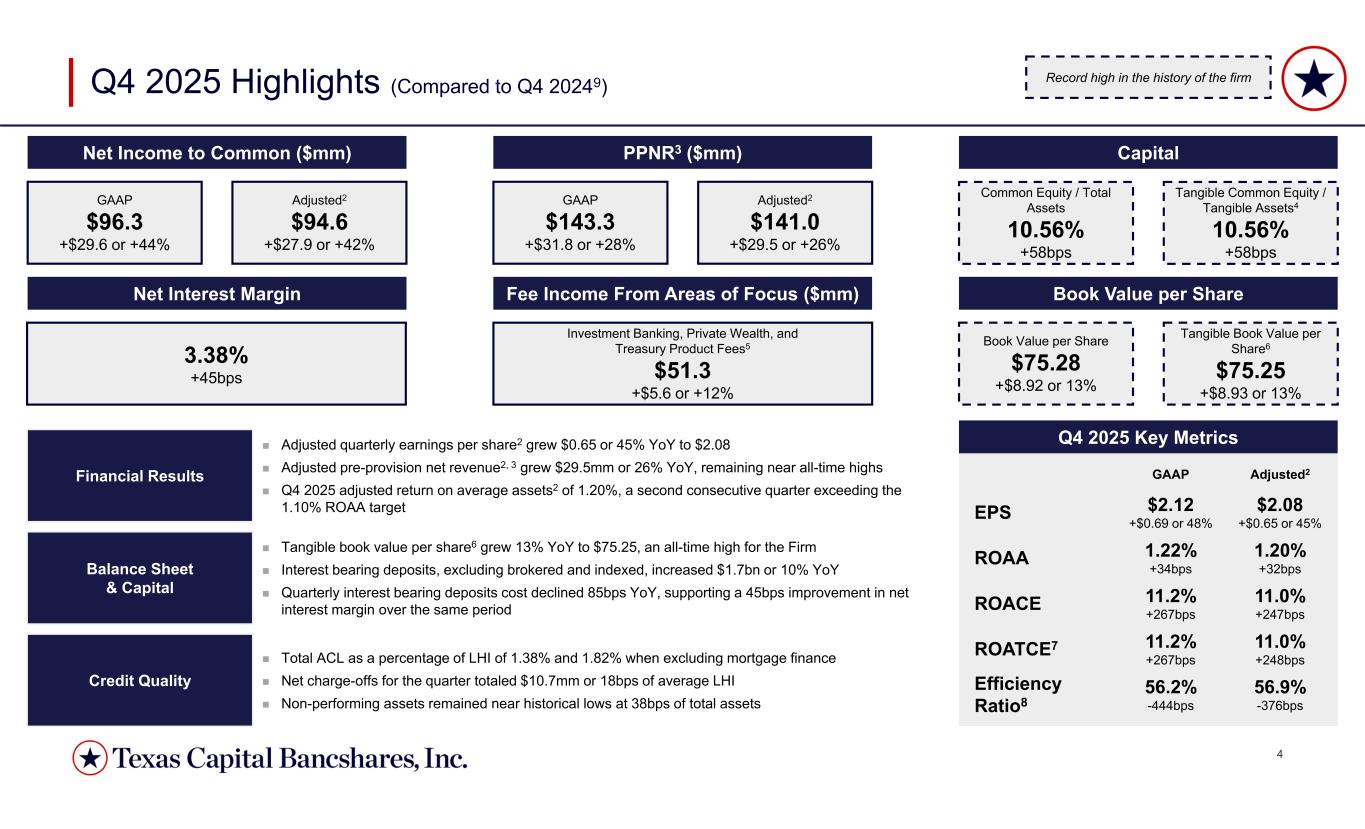
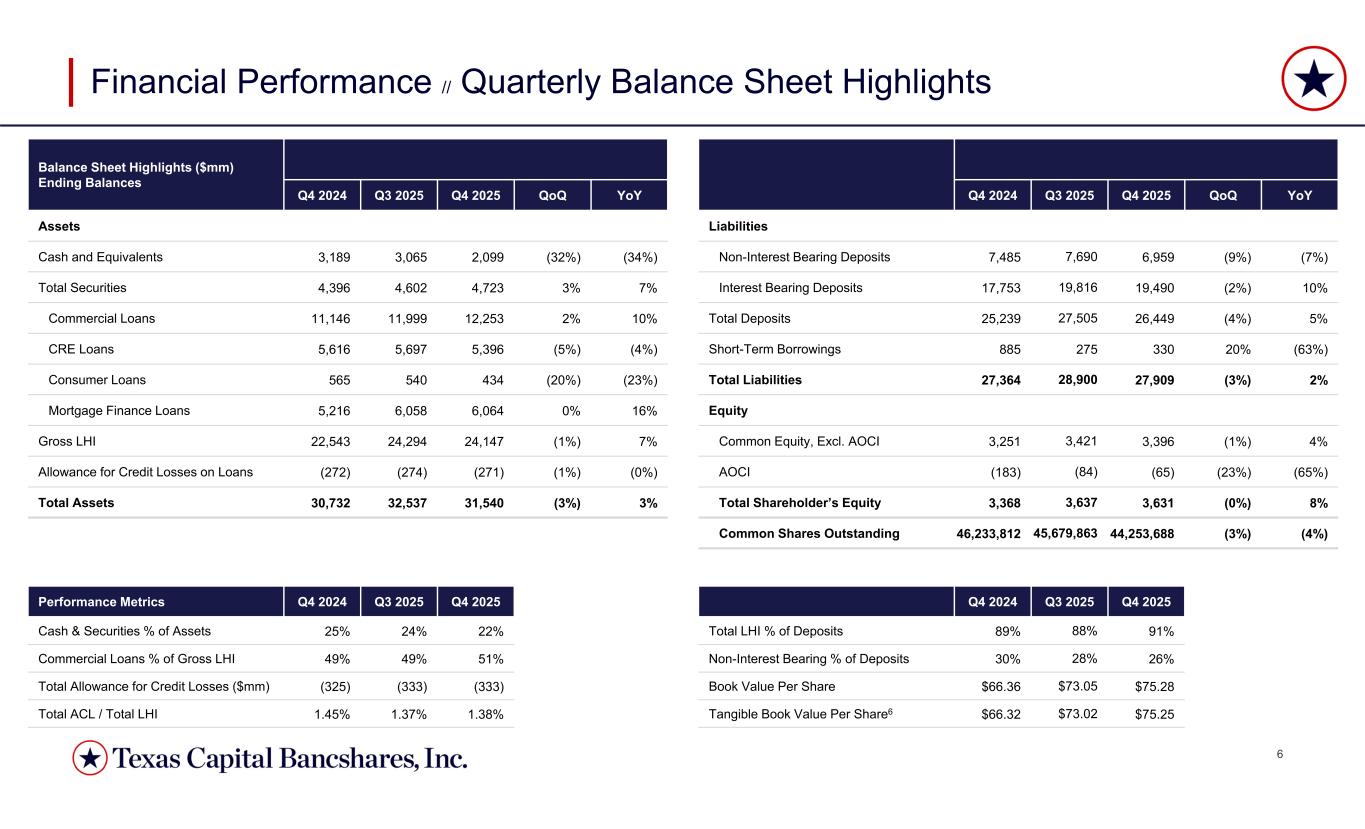
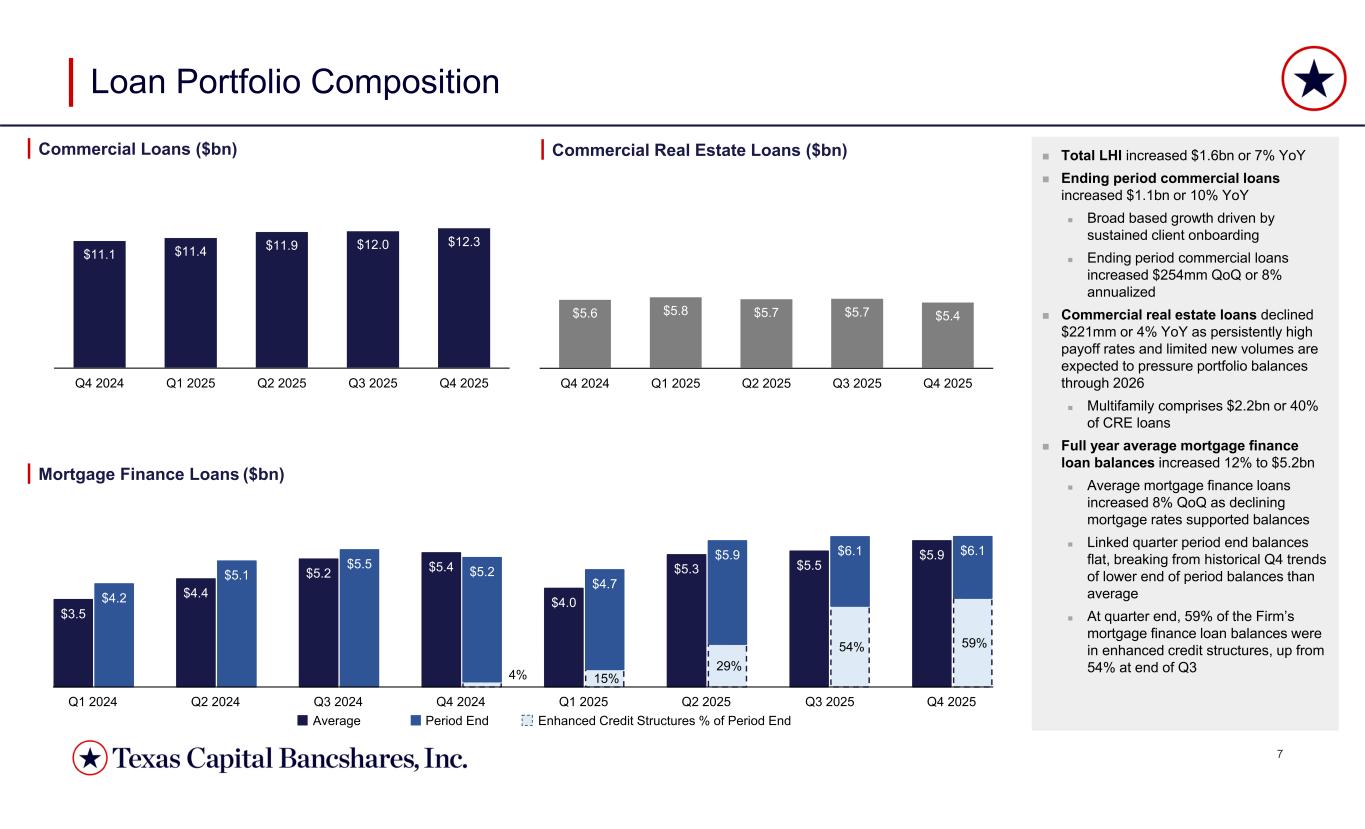
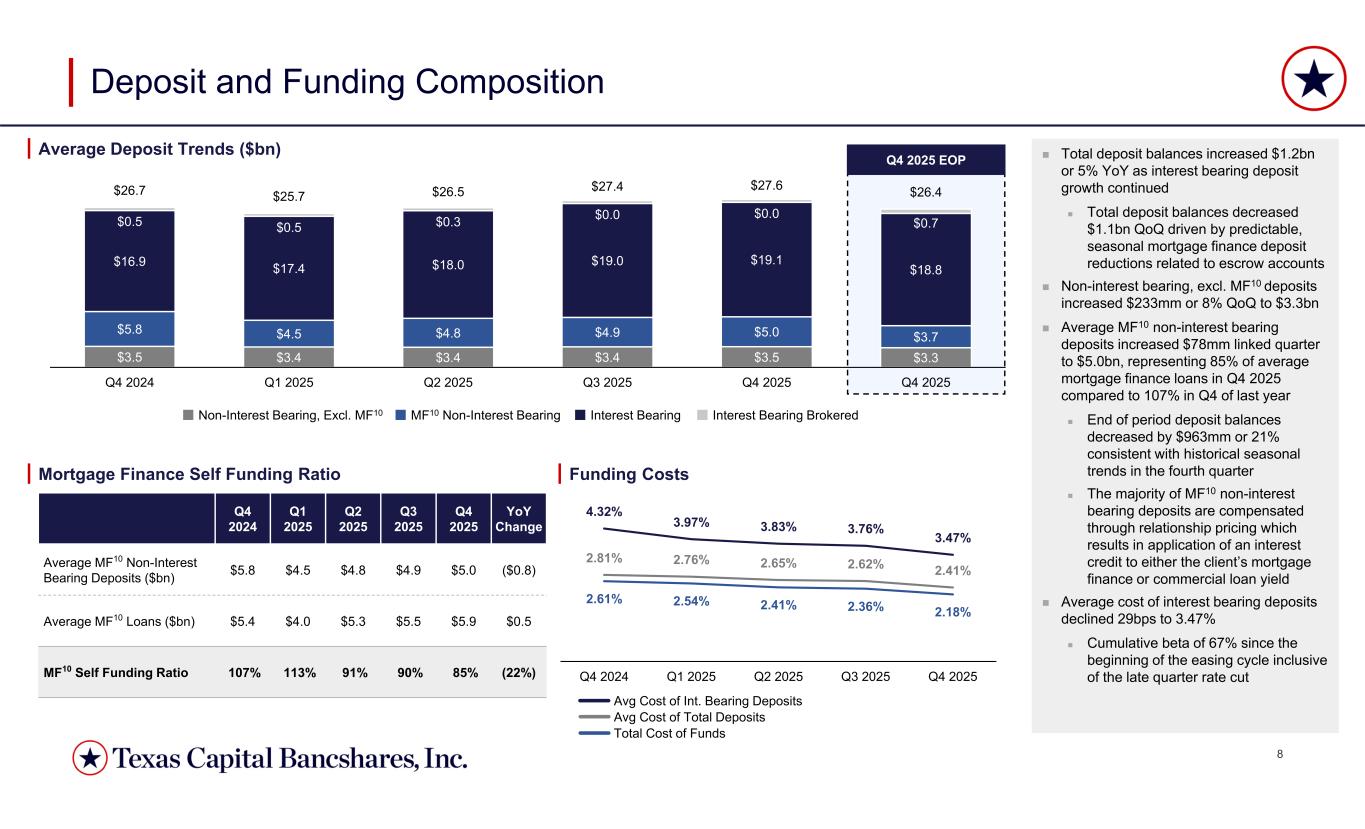
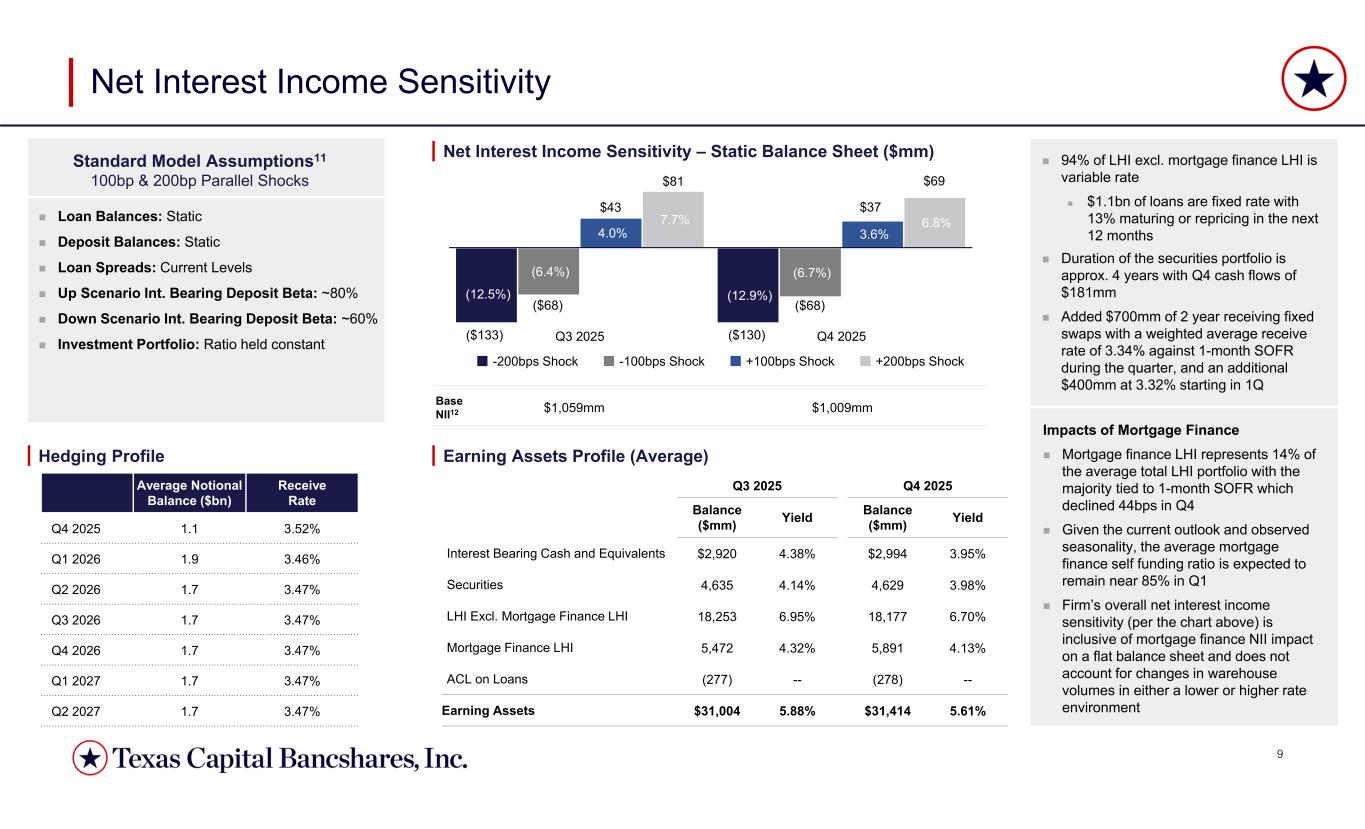
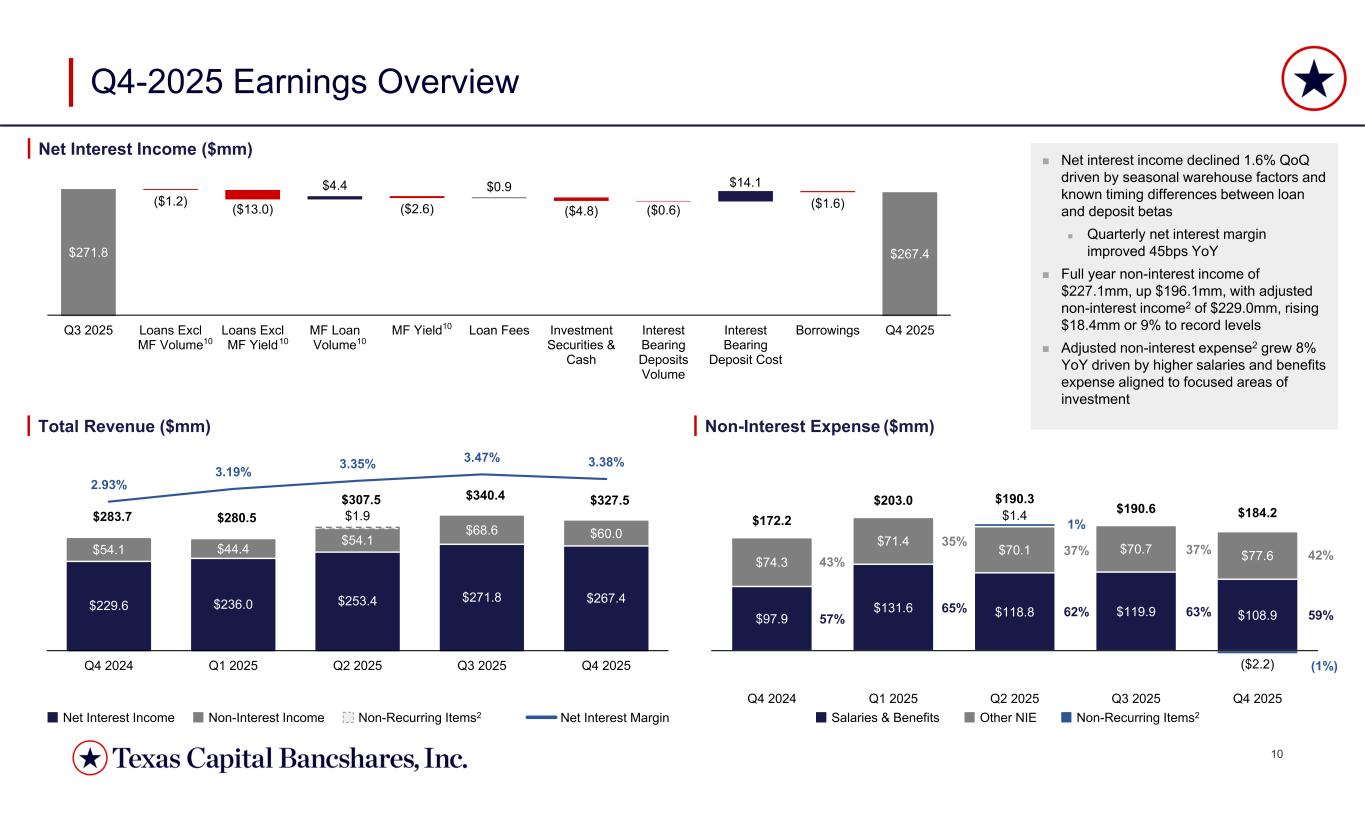
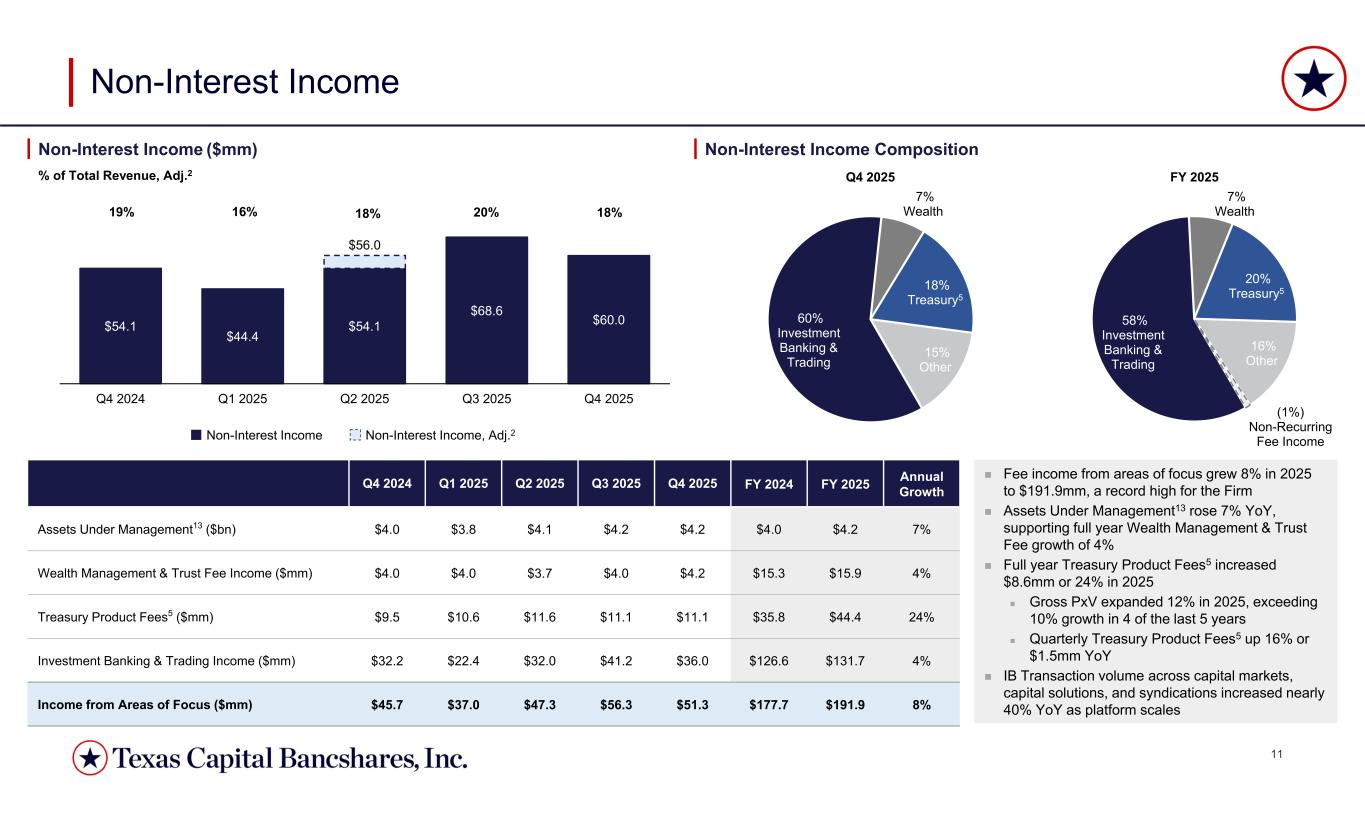
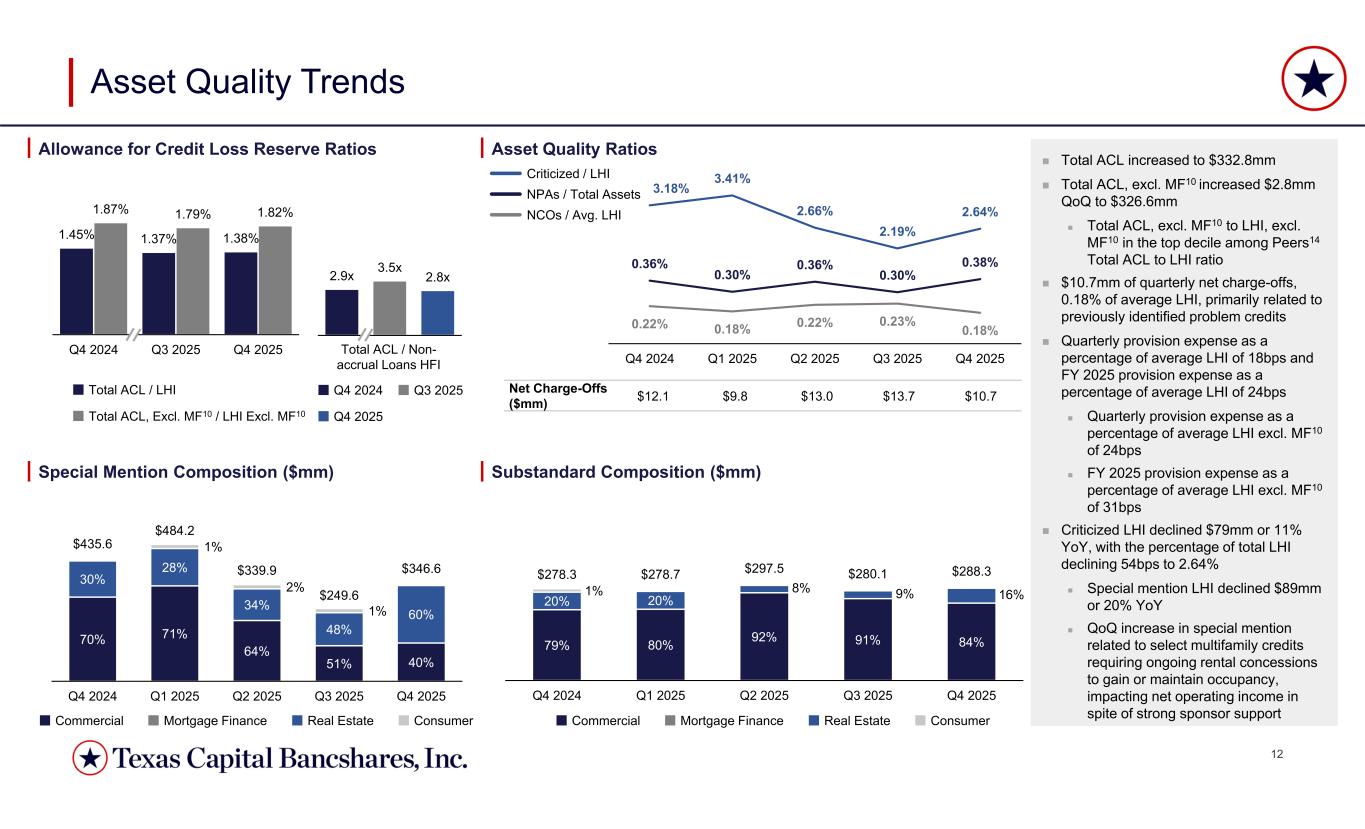
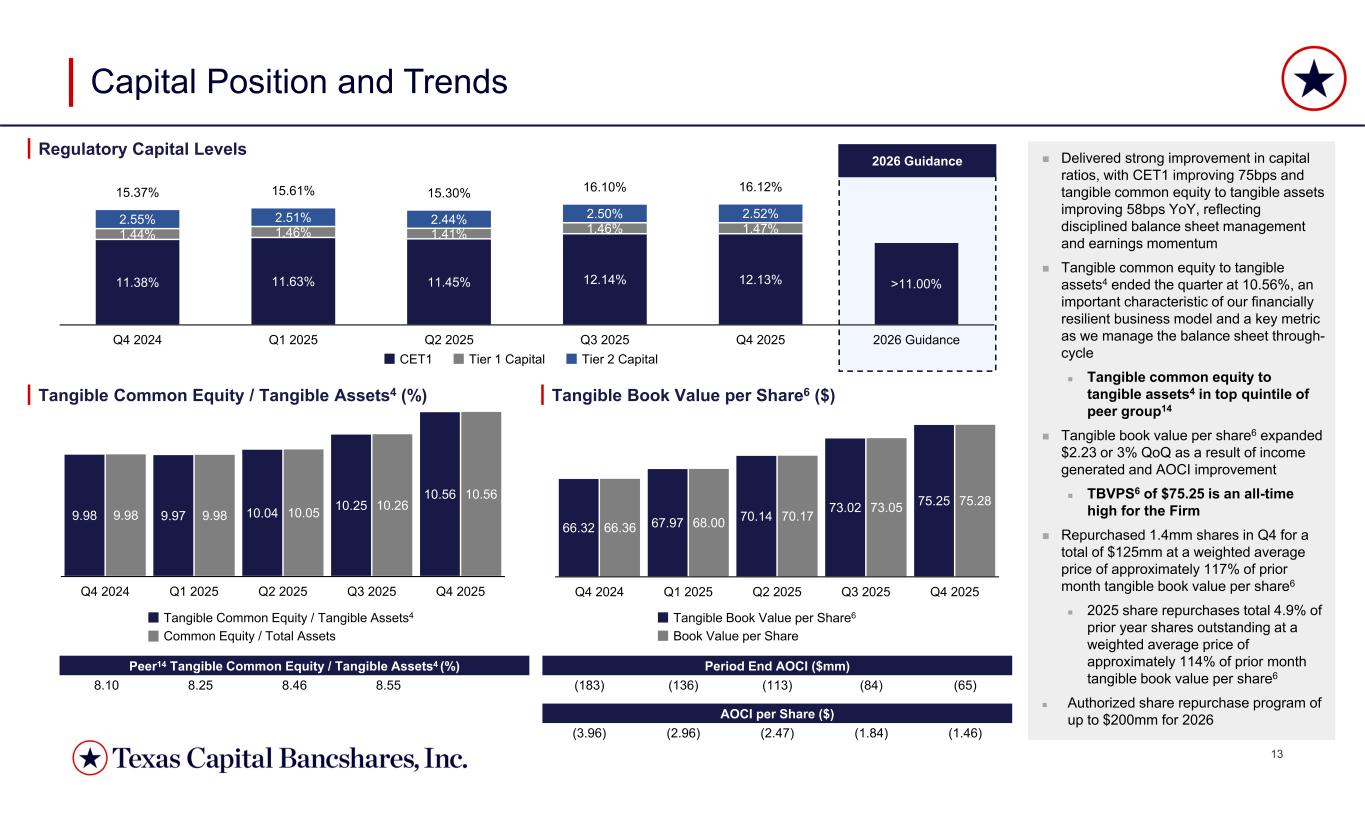
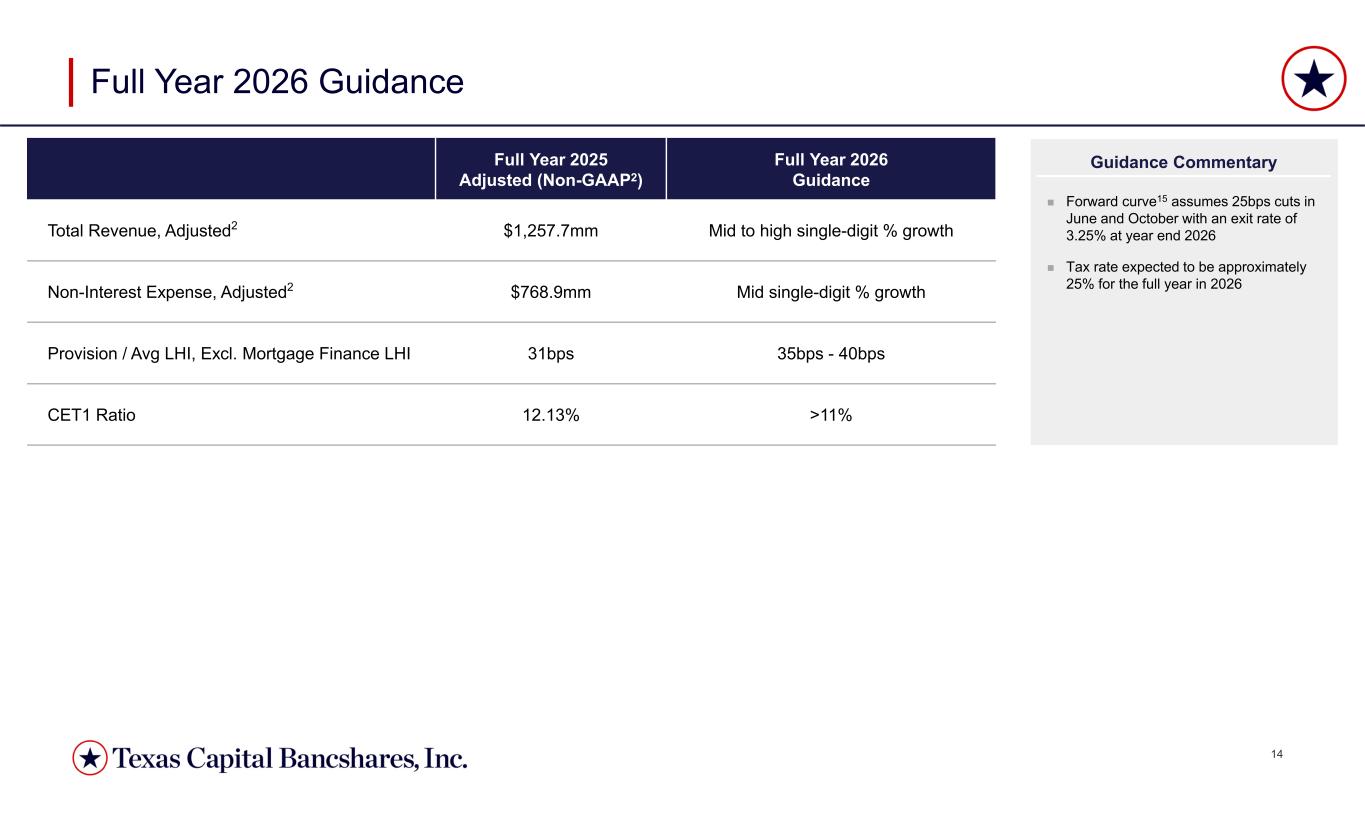
Thanks, Rob, and good morning. Starting on slide five, fourth quarter results cap a record year with broad-based improvements across all key metrics. Our increasingly durable business model, uniquely positioned to deliver high-quality client outcomes, is translating into sustainably strong financial performance that we knew was possible when this transformation began. For the second consecutive quarter, adjusted return on average assets exceeded our legacy 1.1% target, reaching 1.2% in Q4. The second half of 2025 delivered 1.25% return on average assets, while full-year adjusted ROAA of 1.04% represents a 30 basis point improvement versus 2024, a testament to the strategic repositioning we've executed since September of 2021. Year-over-year quarterly revenue increased 15% to $327.5 million, as a resilient net interest margins, strong fee generation, and improved expense productivity supported the second consecutive quarter of pre-provisioned net revenue at or near all-time highs. Full-year adjusted total revenue reached $1.26 billion, the highest in firm history, up 13% year-over-year. This reflects 14% growth in net interest income to $1.03 billion and 9% growth in adjusted fee-based revenue to $229 million, marking the third consecutive year of record fee income and underscoring the durability, diversification, and scale potential embedded in our current platform. Full-year adjusted non-interest expense increased modestly by 4% to $768.9 million, consistent with our full-year guidance, demonstrating our proven ability to effectively support investment and growth capabilities while delivering continued operating model improvements. Quarterly adjusted non-interest expense decreased 2% or $4.2 million to $186.4 million, benefiting from continued expense realignment and regular accrual adjustments that resulted in outperformance relative to the guide. Getting together, full-year adjusted PPNR increased 119 million, or 32%, to 489 million, a record high for the firm. This quarter's provision expense of 11 million resulted from 10.7 million of net charge-offs on a relatively flat late quarter total loan balance. With our continued view of the uncertain macroeconomic environment, which remains decidedly more conservative than consensus expectations. Full-year provision expense as a percentage of average LHI excluding mortgage finance came in at 31 basis points, the low end of our prior 2025 full-year guidance, supported by year-over-year improvements in portfolio quality metrics. Adjusted at income to comment of $94.6 million for the quarter, or $2.08 per share, increased 45% year-over-year, while full-year adjusted net income to comment of $313.8 million, or $6.80 per share, improved 53% over adjusted 2024 levels. This financial progress continues to be supported by a disciplined capital management program, which contributed to 13.4% year-over-year growth and tangible book value per share to $75.25, an all-time high for the firm. Our balance sheet metrics continue to reflect both operational strength and financial resilience, with ending period cash balances of 7% of total assets and cash and securities of 22%, in line with year-end targeted ratios. Focus routines on target client acquisition are delivering risk-appropriate and return-accreted loan portfolio expansion. The commercial loan balance is expanding $254 million, or 8% annualized during the quarter. Total gross LHI increased $1.6 billion, or 7% year-over-year, to $24.1 billion, with growth driven predominantly by commercial loan balances, which increased $1.1 billion, or 10% year-over-year, to $12.3 billion. As expected, real estate loans declined $301 million quarter over quarter as payoffs and paydowns outpaced construction fundings and new term originations in the fourth quarter. The full-year average commercial real estate loan balances did increase modestly year over year. Our expectation is for commercial real estate payoffs to continue into 2026, with full-year average balances down approximately 10% year over year. Our portfolio composition remains weighted to conservatively leverage multifamily, further characterized by strong sponsorship and high-quality markets. Average mortgage financial loans increased 8% in the quarter to $5.9 billion, driven by strong industry demand, our clients' preference for our offerings, and what is an increasing holistic relationship, and modestly increasing dwell times. Average mortgage financial loans grew 12% for the full year, slightly outpacing guidance. Given unpredictability and rate expectations, we remain cautious on our outlook for average mortgage finance balances going into 2026. Estimates from professional forecasters suggest total market originations to increase by 16% to 2.3 trillion in 2026 compared to our internal estimates of approximately 15% increase in four-year average balances should the rate outlook remain intact. As we contemplate potentially higher volumes in the mortgage finance business, it is important to note the material changes in this offering over the previous few years. In addition to the significant credit risk and capital benefits of the approximately 59% of existing balances now in the well-discussed enhanced credit structures, over 75% of current mortgage warehouse clients are now open with our broker-dealer, and nearly all maintain treasury relationships with the firm, which collectively drives significantly improved risk-adjusted returns should the industry realize anticipated 2026 growth. Full-year deposit growth at $1.2 billion, or 5%, was driven predominantly by our continued ability to effectively leverage growth and core relationships to serve the entirety of our clients' cash management needs, partially offset by our continued programmatic reduction of mortgage finance deposits. These trends are evidenced in part by our sustained ability to effectively grow client interest-bearing deposits, which, when excluding multi-year contraction and index deposits, are up $1.7 billion, or 10% year-over-year, while also effectively managing deposit datas, which are 67% cycle-to-date, inclusive of the mid-December cut. During the quarter, ending non-interest-bearing deposits excluding mortgage finance increased 8% at $233 million, with average non-interest-bearing deposits excluding mortgage finance remaining flat at 13% of total deposits a linked quarter. Period in mortgage finance non-interest-bearing deposit balances decreased $963 million in a quarter, as escrow balances related to tax payments begin remittance in late November and run through January before beginning to predictably rebuild over the course of the year. For the quarter, average mortgage finance deposits were 85% of average mortgage finance loans, down from 90% the prior quarter and 107% in Q4 of last year. We expect the mortgage finance self-funding ratio to remain near these levels in the first quarter, with potential for further improvement expected during the seasonally strong spring and summer months. The cost of interest-bearing deposits declined 29 basis points linked quarter to 3.47%, and 85 basis points from Q4 of 2024. Accounting for a realized beta on the December cut, we expect cumulative beta to be in the low 70s by the end of the first quarter, assuming no Fed actions during Q1. Our modeled earnings at risk increased modestly this quarter, with current and prospective balance sheet positioning continuing to reflect a business model that is intentionally more resilient to changes in market rates. Despite short-term rates declining approximately 100 basis points during 2025, we delivered 14% full-year net interest income growth, 13% total revenue growth, and a 45 basis point year-over-year increase in net interest margin. This resilience is in part the result of discipline duration management and acknowledge of our improved ability to deliver returns through cycle. During Q4, $250 million in swaps matured at a 3.4% receive rate. Replace this with a billion dollars in receive fixed SOFR swaps executed at 3.41%, becoming effective in Q4. An additional $400 million in swaps at a 3.32% receive rate became effective in early Q1. Looking ahead, we will continue discipline use of our securities and swap book to appropriately augment rates following generation embedded in our current business model. Quarterly net interest margin declined nine basis points and net interest income decreased 4.3 million. Reflecting timing differences related to lower interest rates on our sober-weighted loan portfolio relative to Fed Fund-driven deposit cost reductions realized in the quarter. The benefit of reduced deposit costs will be more fully reflected in January's financials. Year-over-year quarterly net interest margin expanded 45 basis points, driven primarily by favorable deposit betas and structural improvements in portfolio efficiency, including a reduction in our mortgage finance self-funding ratio from 107% to 85%. Fourth quarter adjusted non-interest expense increased 8% relative to the same quarter last year, primarily driven by higher salaries and benefits expense aligned with investment in our areas of focus. As a reminder, first quarter non-interest expense is expected to be elevated due to annual accrual resets and seasonal payroll and compensation expense. Full-year adjusted non-interest income grew 8% to $229 million, a record for the firm. The income from our areas of focus continues to differentiate our client positioning and strengthen our revenue profile. Treasury product fees again delivered industry-leading growth, increasing 24% for the full year. This growth reflects robust client acquisition and 12% gross P times V expansion, both significantly outpacing industry benchmarks and demonstrating our competitive advantage in gaining the primary operating relationship with our target clients. Investment banking achieved substantial scale expansion, with transaction volumes across capital markets, capital solutions, and syndications climbing nearly 40% year-over-year. While average capital markets deal size is contracted relative to 2024, this material increase in volume underscores our deepening market penetration and the expanding nature of relationships across the target client universe. Total notional bank capital arranged increased 20% this year, positioning us as the number two ranked arranger for traditional middle market loan syndications nationwide. This ranking reflects our market leadership and a core client segment, while highlighting our ability to provide client financing solutions that best fit both their balance sheet and ours. Texas Capital Securities delivered noteworthy traction as well, with 2025 volume increasing 45% year over year. Together, these results validate our focus on building diversified, scalable revenue streams while deepening our primary operating relationships with middle market and corporate clients. The total allowance for credit loss, including off-balance sheet reserves of $333 million, remains near our all-time high, which, when excluding the impact of mortgage finance allowance and related loan balances, was relatively flat in a quarter at 1.82% of total LHI and the top decile among the peer group. Net charge-offs for the quarter were 10.7 million, or 18 basis points, of LHI, related to several previously identified credits in the commercial portfolio. Positive grade migration trends over the first three quarters of the year resulted in an 11% reduction year-over-year in criticized loans. During the fourth quarter, select commercial real estate multifamily credits migrated from past to special mention, as projects and lease-up continue to require ongoing rental concessions to gain or maintain occupancy, impacting net operating income in spite of material project-specific equity and sponsor support. Capital levels remain at or near of the top of the industry. CET1 finished the quarter at 12.1% with full-year improvements of 75 basis points, reflecting strong running generation and disciplined capital management. Tangible common equity to tangible assets increased 58 basis points for the full year. A significant driver of capital strength is our mortgage finance enhanced credit structures. By quarter end, approximately 59% of the mortgage finance loan portfolio had migrated into these structures, bringing the blended risk weighting to 57%. This improvement is equivalent to generating over $275 million of regulatory capital. The client dialogue suggesting an additional 5% to 10% of funded balances could migrate over the next two quarters, further enhancing both credit positioning and return on allocated capital. During the quarter, we purchased approximately 1.4 million shares for $125 million at a weighted average price of $86.76 per share, representing 117% of prior month tangible book value. Full-year share repurchases totaled 2.25 million shares or 184 million, equivalent to 4.9% of prior year share outstanding. Finally, Tangible Common Equity Tangible Assets finished at 10.6%, ranked first amongst the largest banks in the country, while tangible book value per share increased 13.44% year-over-year to $75.25, the fifth consecutive record quarter for the firm. Looking ahead to 2026, our outlook reflects continued real-life scale from multi-year platform investments. We anticipate total revenue growth in the mid to high single-digit range, driven by industry-leading client adoption and continued growth in our fee income areas of focus, with full-year non-interest revenue expected to reach $265 to $290 million. Anticipated non-interest expense growth in the mid-single digits reflects increased compensation expense tied to improved performance, targeted expansion and defined client coverage areas, and platform investments meant to expand upon best-in-class client execution, further enhancing our operating resilience and supporting future enhancements to structural profitability. Given continued economic uncertainty and our commitment to operating from a position of financial resilience, we are moderating our full-year provision outlook to 35 to 40 basis points of average LHI excluding mortgage finance. Taken together, this outlook reflects another year of positive operating leverage and meaningful earnings growth. Operator, we'd like to now open up a call for questions. Thank you.
Operator
Thank you. To ask your question, please press star followed by one on your telephone keypad now. If you change your mind, please press star followed by two. When preparing to ask your question, please ensure your device is unmuted locally. Our first question comes from Woody Lay from KBW. Woody, your line is now open. Please go ahead.
Hey, good morning, guys. I wanted to start on the investment banking and trading outlook and specifically the investment banking pipeline. I believe in 2025, you know, deals kind of got pushed to year end, just given some of the tarot volatility over the first half of the year. So how does the pipeline look entering 2026, and how do you think about pacing of investment banking fees relative to the back half of the year?
Hey, Woody, let me just give you a little stats on the investment bank performance in 2025. We arranged about $30 billion of debt across term loan B, high yield, and private placement. And then on top of that, about $19 billion in lead-less syndications in the bank market. So we ranged about $49 billion of debt for our clients, which is very impressive. Broad, new client penetration and leadership in the segment. IV transaction volume was up about 40%. The fees were much more granular. So, people like you and others would suggest that's a healthy, better earning stream equities. We participated in more transactions than we had forecasted, even though some got pushed. And sales and trading has passed $330 billion of notional trades since the opening of the business. That's up about 45% since last year. So there's broad growth. We're starting to see repeat refinancings. Remember, we just really got into this business and earned us like three years ago. And so now you're starting to see the repeat of a client that came onto the platform three years ago, which will add to the earnings going forward. I would say that what you are really focused on in terms of things that got pushed was more in the M&A space and equity space, and we are seeing, and we do expect to see that pull through, and pipelines remain very healthy, but it's very broad now. Public finance, the best we can tell, our public finance desk has grown for a de novo public finance desk faster than any public finance desk that we can find. and the synergies in the investment bank across commercial banking and corporate banking has proved to be very, very strong. Like just the example, stay on public finance. We have a government nonprofit segment in corporate. Well, before we had public finance, all we could really do is lend to them short term and do the treasury. And now we can lend to them short term. We can do the treasury. We can do financing for them as well in the public markets. So it's working as anticipated, and we remain very, very optimistic and proud of the business.
What did the fee income from Treasury Wealth and Investment Banking top $50 million for which when you compare that to the $47.4 million of total fees for the full year 2020 from those three categories? So it's just how much progress we've made since announcing the transformation. Full-year guide for non-interest income is to increase 15% to 25% to $265 to $290 million, which is underpinned by investment banking fees of $160 to $175 million. And if you just think about Q1, outlook is for stable link quarter performance, so total non-interest income, $60 to $65 million, investment banking, $35 to $40 million, which to Rod's comment, expectation of continued platform maturity and integration of all the hires and capabilities that we've built over the last 12 to 18 months, driving positive trajectory both in fee income and investment banking as we move through the year.
And I would just add one more first. It didn't happen in the fourth quarter. It happened this quarter, Woody, but we did lead our first soil managed lead left equity deal, which we think is a first for a Texas-based firm. for any period that we went back and found. So I'm really excited about the business.
That's great to hear. That's really a great color. I appreciate that all. Next, I just wanted to hit on capital and a little bit of a two-part question. First, you were pretty active on the buybacks run in the fourth quarter. Was that a reflection of, you know, the elevated CRE paydowns, free dust and capital? And then the second question is, you know, you reiterated the CET1 guide of over 11%. You know, you've been price sensitive on the buyback. Historically, it's now trading well above where you bought in the fourth quarter.
How do you think about additional buybacks from here?
Yeah, we're pushing CET1 up 75 basis points to 12.13% while growing loans, $1.6 billion or $14 billion, playing tangible book value for 4%. We're obviously pretty pleased with how we utilize shareholders' capital for their benefit in 2025. We're highly focused on doing it again in 26, and to your point, I think we have a lot of options at our disposal. The published strategic objective of being financially resilient to market and rate cycles for us is of course paramount, and while we think we have significant capital in excess of internally observers profile, Rob said repeatedly that caring sector leading tangible common to tangible assets is a real material contributor to our ability to attract the right type of clients. That's going to benefit the shareholder over time and is a advantage that we're currently unwilling to give up. I would say as the profitability continues to improve, the resources available, the support items on the capital menu also expands. So if you're trading at 1.3 times tangible, take the 2026 and 2027 consensus estimates for ROE. Buying back today suggests that you're purchasing at book value in two and a half years, which could certainly make sense for us given our internal view of forward earnings trajectory and then the ability to generate both book equity and regulatory capital.
I think also we continue to really focus – well, I think, humbly, we prove to be pretty good allocators of capital over the past several years that Matt just outlined. But we also continue to drive structural improvements in the platform. So if you remember we talked about the SBE structure in mortgage finance, we have the majority of our mortgage finance sector clients in that structure now 77% or over 70% of those clients are open with the dealer we do treasury with basically 100% of those clients but when you move those clients the sophisticated best-to-cast clients to the SBE structure you go from the risk weighting of 100% down to sub-30% now on average, which clearly is a better model and releases capital, and we'll forever try to drive efficiencies both in cost but also capital in the businesses that we have at the firm.
All right. That's all for me. Thanks for taking my questions.
Operator
Thank you. Our next question comes from Michael Rose from Raymond James. Michael, your line is now open. Please go ahead.
Hey, good morning, guys. Thanks for taking my questions. Maybe just on the expense outlook, you know, I think you mentioned, obviously, some wage inflation, you know, clearly and some hiring efforts. Can you just talk about some of the areas where you're looking to kind of incrementally add? Is it on the lender front? Is it continuing to build out the capital markets platform? Is it all of the above? Just trying to get a better breakdown of how we should think about that mid-single-digit expense kind as we move forward.
You bet, Michael. We are highly focused on leveraging the previous material investments that we've made by expanding capabilities with the 2026 expense guide, continue to heavily feature growth in technology. We now have, we think, a multi-year pattern of effectively improving the productivity of the expense base through the deployment of technology solutions, which we anticipate paid is only going to accelerate as we more fully adopt AI across the franchise I would call out this expected seasonality in the expense base which will increase at a higher percentage this year just given the larger portion of total salaries and benefits that's currently tied to stock so that the current guy does anticipate he went on interest expense between 210 and 215 million dollars with about 18 of seasonal comp and benefits expense and and then another $10 million from the combination of incentive comp reset, late-quarter merit increases, and full-quarter impact of late-year hires. As you exit Q1, we think about salaries and benefits around $125 million a quarter, and then other non-interest expense in that $75 million or so a quarter range. And then, importantly, the mid-single-digit expense guide is sufficient to cover the current revenue expectations and the composition, inclusive of the fee growth.
So I guess the last thing I would say as we change the mix of investment to a higher mixed front office in terms of expense mix with salaries and benefits, that's been a long journey. We continue to do that. But the revenue synergy today that we get from the incremental front office hire is dramatically more. So remember, you know, Matt talked about this a lot. Michael, we talked about it with you a lot.
But when we're building these businesses, we had to build the back and middle and front office.
The back and middle are substantially complete, as we discussed a lot. So when you add somebody to the front line, the return on that hire is much greater, which is reflected in everything that Matt said.
Great. I appreciate the caller. Maybe just as my follow-up, can you just talk about the opportunities that I know you're not want to talk about loan growth figures per se, but, you know, high single digit, you know, commercial loan growth, CRE down a little bit. There's obviously been some market, some mergers in and around your markets. Can you just talk about, and then you obviously have hired a lot of lenders, right, as you've kind of upgraded the staff. Is there any reason to think that the loan growth LHI momentum, again, I'm not asking for a target, but that wouldn't continue against kind of a more, in theory, favorable backdrop, some of the momentum that you have just on the hiring front that you've made already, and then just a more conducive loan market. Thanks.
Mike, I think a lot of the trends that you've seen in the second half of 2025 should really continue into 26 with strong CNI and mortgage finance growth offsetting, contracting commercial real estate balances. So we noted in the preparation market, which sits on top of a 6.3% 30-year fixed-rate mortgage, which for us would drive about a 15% increase in full-year average mortgage finance balances. As Rob just noted, it's obviously a completely different mortgage finance offering than the legacy warehouse. We've had 59% of these loans are in the enhanced credit structure, which have the average risk rating of 28%. 80% of these clients are both a dealer, and then nearly all of them take advantage of our treasury price, which suggests that any realized pickup and one-to-four family originations is going to generate significantly higher and more diversified per-unit risk-adjusted returns for us this year. We also think we'll have another record year of client acquisition and the C&I-focused offerings, which should be enough to offset continued balance reductions in CRE, which in our view should be pretty expected given multi-year pullback and originations really across all property types. I think all those things together, Michael, would support another year of mid- to high-single-digit growth and gross LHI.
Yeah, and Michael, the reason I said, you know, when we first started and I said loan growth doesn't matter is because we knew loan growth would come if we had the right clients left in. And we also knew that, I mean, like we just talked about, we arranged, you know, $30 billion of term loan B, high yield and private placement debt for clients that wasn't bank debt, which helped the client and was a great risk management tool for us. And then also, as we mentioned, we're number two in the country in middle market lead left bank syndication leads. Well, there's a lot of banks out there that would just kept that exposure, which we don't think is the right decision for the client, but it's certainly not the right decision for us from a risk management perspective. So we're not trying to maximize loan growth. We're trying to provide the clients with the right solutions and keep really good credit discipline and have great client outcomes. So that's why we said what we said before. Loan growth does matter, but it's going to come in spite of our prudent risk management because of our client acquisition and client selection.
Another way just to think about that client acquisition, Michael, is that, I mean, commitments for us in the CNI space, link quarter, we're up over 25%. We continue to drive low double-digit growth and CNI balances. And our last quarter, I think we grew commitments 18% year over year. And, again, those are up to 25%. A lot of client activities showing up on the platform.
Okay. So a lot of momentum to continue. Thanks for all the color, guys. Appreciate it.
Operator
Thank you. Our next question is from Casey Hare from Autonomous Research. Your line is now open. Please go ahead.
Hi. Good morning. This is Jackson Singleton on for Casey Hare. I was wondering if you could just provide some more color into recent credit trends and maybe help us kind of understand what factors drove the increase in the provision guide year over year.
Yeah, we did experience modest link order increase in special mention loans, which, as we noted in the comments, was tied exclusively to a handful of multifamily properties that are experiencing net operating income pressure, just given required rental concessions to maintain target occupancy levels. These are extremely high-quality sponsors that are in historically strong Texas markets, which we think over time are going to benefit from the limited new supply and increased level of absorption. And I would say, importantly, the ratio of criticized loans to LHI as we exited the year marked the best level since 2021 with really strong credit metrics generally across all categories. We've had a 35 to 40 basis point guide two years ago, moved it to 30 to 35 basis points this year, came in obviously at the low end of the guide, and we're certainly a group that wants to operate from a position of financial resilience, so felt it prudent to move to 35 to 40, again, consistent with things we've done in the recent past.
Thank you for that. And then just for my follow-up, just a NIMH question, can you help us think about the drivers for 1Q and then maybe any sort of range you could help for our modeling?
I think 250 to 255 for 1Q on NII, flattish margin, so somewhere in the mid-threes. That's with one-month average SOFR down about 27 basis points. If you think about the mortgage finance business in Q1, stay at the 85% self-funding ratio on $4.8 billion, again, with 27 basis point reduction and average one month so for quarter over quarter, that should push the yield on the mortgage finance business down to 385 or 390 or so. So those are probably the factors that I would incorporate. The other comment that I'd make is we're at 67% through cycle beta inclusive of the December cut. Once all those pricing actions are passed through the deposit base, you're somewhere in the low 70s, probably by the end of January. For the full-year outlook, we've been pretty consistent in noting our expectation that interest-sparing deposit data is we're going to moderate. So, any incremental cuts in 26, the guide would incorporate a 60% interest-sparing deposit data, which is obviously also what we now have in our earnings at risk down 100 scenarios.
Got it. Thanks for taking my questions.
Operator
Thank you. Our next question is from Anthony Eileen from J.P. Morgan. Your line is now open. Please go ahead.
Hey, Matt. On mortgage finance, I'm curious what specifically drove the sequential increase in 4Q average balances. Was there any pickup and refi activity in that business?
Rates were lower than we had incorporated in the outlook, which it did drive refi than and you had slightly longer dwell times as well, Tony, which supported.
Okay, and then my follow-up on credit. Can you give us more color on what drove the increase in special mention? I know you called out the multifamily credits, but why did this surface now, and when do you expect some sort of resolution on those credits? Thank you.
Yeah, you bet. So it's $100 million. So we have $250 million, excuse me, of special mission commercial real estate on a $5.5 billion portfolio. I want to say five million dollars of charge-offs on in the last 36 months so we would like to be proactive in communicating with you guys any potential downgrades or realized downgrade handful of Central Texas based multi-family properties where you had significant new products come online that the market is working to absorb many of these properties offer rental concessions to bring folks into the apartment complex and they had to sustain those for an another year longer than they originally anticipated. We grade based on cash flow, Tony, not appraised value, which is why we sometimes have more sensitivity and downgrades than Pierce. So that rental concession is pressuring their net operating income and resulted in us moving into special mention. So we feel very well reserved against these properties. They're clients that we do a lot of business with, well-structured with significant equity. There's no, in our view, pending wave.
So if you look further upstream in the credit scale or the credit grades watch list was essentially flat so there's nothing sitting behind this other than these properties we've identified I would say this is a I think that three years ago was ahead of all the bank peers pointing out that we were going to have a small wave of provision increase of commercial real estate for a number of factors but we didn't we did not anticipate any real credit problems and we'd work through them and that's exactly what happened and I think this is very akin to that just to add what Matt said I mean we're in the top decile of firms since we started in in reserves added and we're at an all-time high of reserves in the history of the firm at 1.82% excluding mortgage finance so it's just I think the percentages are high because the numbers are so small great thank you thank you next question comes from Janet Lee from TD Cohen your line is now working Jenna please go ahead good morning for to clarify on them so the 330 range for first quarter of 26 if I
were to think about the direction of travel for NIM beyond that point can you sustain flattish NIM from there given I mean despite rates coming down given a potential improvement in self-mortgage self-funding ratio. I guess that would – it looks like, you know, considering your $265 to $290 million fee income range for 26, your NII could be, you know, very low single-digit growth to almost single-digit growth there, depending on where that lands and wanted to get some color.
Yeah, I think given pretty good detail on expectations for deposit repricing, self-funding, the only component of the liability base we haven't described is expectations for commercial non-interest bearing, which we continue to experience and anticipate record new client acquisition with a lot of those economics showing up in treasury product fees, which we've grown over 20% for multiple quarters now and delivered north to 10% growth in P times V for the last five years. We think about their contribution to overall deposit balance portfolio mix to stay around that 13% level gen. So, obviously, deposits are going to grow. Commercial NAB will grow, but their percentage stay relatively static, given some good and hopefully some good insights into how we think about the loan portfolio. We'll continue to invest cash flows from the securities book. We added about $1.1 billion of securities last year at 5.5%, sold almost $300 million at 3%. It's a nice sequential picture of 80 base points of improvement, and the securities portfolio yields a nice consequential impact to margin there. The hedge book today should cost us about $10 million pre-taxed NII. In 2026, we are a little higher than we traditionally wanted to operate on earnings at risk in a down 100. You will see us selectively add to the swap book moving through 2026. We're much more active. The spread obviously changes depending on the curve, but we're much more active today. And we see the negative spread between two-year and one-month so far inside of 30 basis points, which as of yesterday we were sitting there, so you'll see us add some swaps. I think all that together should give you a pretty good sense for how we're thinking about margin moving into 2026. And then just to reiterate, perhaps counterintuitively, all the work that we've done as a firm to reduce our reliance on Morrigin and II as a sole contributor to earnings is perhaps, again, counterintuitively actually really supporting NII and Morrigin because we're relevant to these clients across a wide range of products and services that are generally less price sensitive. And then just the final comment there, Janet, I mean, we've shown an increasing net interest income revenue in PPNR in a wide range of interest rate environments, including delivering 14% increase in NII, 13% increase in revenue, and 32% increase in PPNR, with rates on average down 100 basis points this year relative to...
The only thing I'd like to reiterate is what Matt said at the end, because I think it's I just want to make sure everybody got it I think it's it's a key component to the strategy the clients are less price sensitive on rate when you're adding value in a lot of different ways and you're relevant to your client with quality client coverage and proactive ideas and execution on other fronts you become much less price oriented on deposit so I just want to make sure like I think all the lines of business are contributing to that improvement in them.
Got it. And just one follow-up for me, appreciate the comments around commercial real estate payoffs and balances coming down 10% year-over-year. That commentary seems somewhat different from most of the banks that are beginning to see our rebalances inflecting or stabilizing. Is this just a function of your appetite to not grow CRE, originate CRE loans as much, or your CRE is more tilted towards construction? What is the underlying factor there?
Honestly, Jan, we're somewhat perplexed by that industry trend. I mean, volumes have been at multiple years. There's a lot of capital in the space, and by the space meaning financial services, where folks are looking to deploy into loan growth by burnings. Our view is that it's just going to take a couple of years for the market to chew through the supply that's coming online and ultimately to correct and see new originations maybe in 27, 28. We do not anticipate growth in commercial real estate this year. Again, not a byproduct of us devoting less focus, intensity, or resource into the space, but mostly just because of the market dynamic where there's just...
I also think it's an indicator of a very healthy commercial real estate portfolio with regularly scheduled payoffs.
Operator
Thank you. Our next question comes from Matt Olney from Stevens. Matt, your line is now open. Please go ahead.
Hey, thanks. Good morning. Question for Rob. Since you achieved and exceeded those legacy ROAA targets the back half of 2025, I heard you mention the focus now becomes recognizing the full potential of the recent investment. So we'd love to appreciate what this full potential at full scale looks like as far as the operating metrics at the bank longer term.
Hey, Matt, great question. Obviously, we're not going to give both of your guidance. I'll tell you that the platform is – the synergy of the platform, the talent we've been able to recruit, the talent we've been able to maintain, the pipelines and the platforms even working in a better coordinated synergistic way than even I could have hoped for, supported by a really good investment in historical technology, improved operating efficiency, improved operating risk and controls, which I – and we talked about the credit portfolio and the discernment there. I feel really, really good about the future and we're very optimistic. Look, we've got a lot to do. What I would say is the theme of this year is execute and scale. We just got to execute. We've got all the products and services we need. We've got the majority of the banker roles filled that we need, we just need to execute. There is so much investment that hasn't reached scale in the platform that if we could be at these profitability levels with that investment already in the platform, which is proven will work with record client acquisition every year, we just got to execute and scale. That's it, which really de-risks, totally de-risk the investment thesis.
Okay. Appreciate the color, Rob. And then as a follow-up, going back to the capital discussion, we've already talked about the buyback and the enhanced credit structure. It does look like on capital you have a few instruments that either mature or becomes callable here pretty quickly. So, we'd love to get your, you know, pulmonary thoughts around these instruments and any plans you may have as far as some of these debt instruments.
Thanks, Matt. We've got a capital base and we'll look to behave accordingly in Q1 when some of these instruments become callable.
Appreciate it. Thanks, Matt.
Operator
Thank you. Our next question comes from John Ostrom from RBC. Your line is now open, John. Please go ahead.
Thanks. Good morning. Good morning, John. Hey, Rob, just to follow up on Olney's question, you used the term sub-scale on some of your What are the top few areas where you feel like you're the most sub-scale, where you've already made the investments? Where are the opportunities?
Sales and trading, equity, public finance, treasury. I don't think any of our businesses are at scale yet, like not one. I mean, business banking is not at scale. So, you know, this is just the preface of what this firm can do. Matt's going to get mad at me when you hang up because he does say I was too optimistic, but there's literally not a business approaching scale. You know, we've done our first lead-left equity deal. We have one of the best equity teams on this platform if you look at their historical body of work. Our public finance team, I'm super proud of. Our sales and trading, like, I'm going to get in trouble also, I didn't name everybody. I don't know of a sub-business on the platform that's at scale, which I think is great. And then we've proven to be – we're really improving our operating risk, and we're really improving our ability to syndicate risk, you know, being number two in the country. We're not – we don't need to – we're in the risk business, but we don't need to take risks in history terms like a lot of pure banks need to do.
Okay, to turn the heat up on that a little bit. That's okay. The other thing I wanted to ask about, it's kind of related, but you guys have this relationship management return hurdle exercise, and I know it's been around for a while, but as the business has evolved, and we just said things were immature, but as the business has matured, How has that evolved and how has that allowed you to maybe keep clients around with less of an ask than maybe you did two or three years ago?
Thank you, John. I think it's evolved to being from an exercise to being part of our culture. So when we commit capital for a client, it's the relationship management exercise you talk about balance sheet committee the heads of LOBs are on that the head of risk are on that Matt attends it a lot remember everybody every LOB is fighting for the same amount of finite capital and so if they're going to vote to deploy that capital it's been it's good for the firm and we have the right ROE for loan only but also for the relationship as a whole both in a downgrade scenario over the credit and and when you do that you have other lines of business signing up to support that client so over 90% of the loans we've done since we started have other lines of other business tied to it when we onboarded Treasury is probably the most about 90% but you have private wealth signing up through business with them or private banking and then when you have a if you have a bank or leave or something which every bank does people retire what have you you have like four or five touch points with that client so the clients been institutionalized it's not a banker relationship it's an institutional relationship so which I think is makes the client much more valuable in the current state and a go-forward state to the firm and we're bringing more value to the client so it's a win-win thank you thank you we currently have no further questions and I would like to hand back to Rob Holmes for any closing remarks I just want to thank all the employees of Texas Capital for another very solid core I look forward to a great 26 thanks everyone thank you this now concludes today's call thank you all for joining you may now disconnect your