Operator
Hello, everyone, and thank you for joining us today for the TCBI First Quarter 2026 Earnings Conference Call. My name is Sammy, and I'll be coordinating your call today. During the presentation, you can register a question by pressing star followed by one on your telephone keypad. If you change your mind, please press star followed by two on your telephone keypad to remove yourself from the question queue. I'll now hand over to your host, Jocelyn Koukouka, Head of Investor Relations to begin. Please go ahead, Jocelyn.
Good morning, and thank you for joining us for TCBI's first quarter 2026 earnings conference call. I'm Jocelyn Kokolka, head of investor relations. Before we begin, please be aware this call will include forward-looking statements that are based on our current expectations of future results or events. Forward-looking statements are subject to both known and unknown risks and uncertainties that could cause actual results to differ materially from these statements. Our forward-looking statements are as of the date of this call and we do not assume any obligation to update or revise them. Today's presentation will include certain non-GAAP measures including but not limited to adjusted operating metrics, adjusted earnings per share, and return on capital. For reconciliation of these and other non-GAAP measures to the corresponding GAAP measures, please refer to the earnings press release and our website. Statements made on this call should be considered together with the cautionary statements and other information contained in today's earnings release, our most recent annual report on Form 10-K, and subsequent filings with the SEC. We will refer to slides during today's presentation, which can be found along with the press release in the Investor Relations section of our website at texascapital.com. Our speakers for the call today are Rob Holmes, Chairman, President, and CEO, and Matt Skrlock, CFO. At the conclusion of our prepared remarks, the operator will open up the call for Q&A. I'll now turn the call over to Rob for opening remarks.
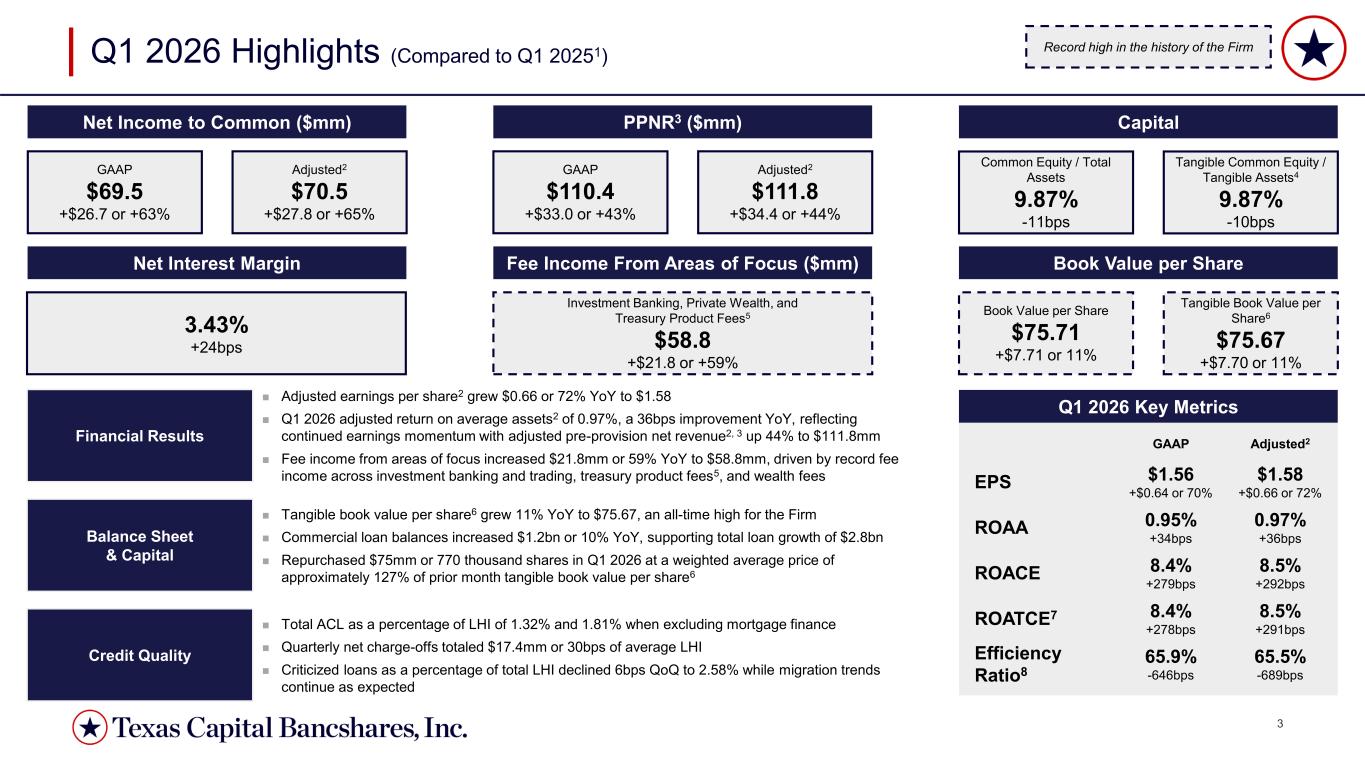
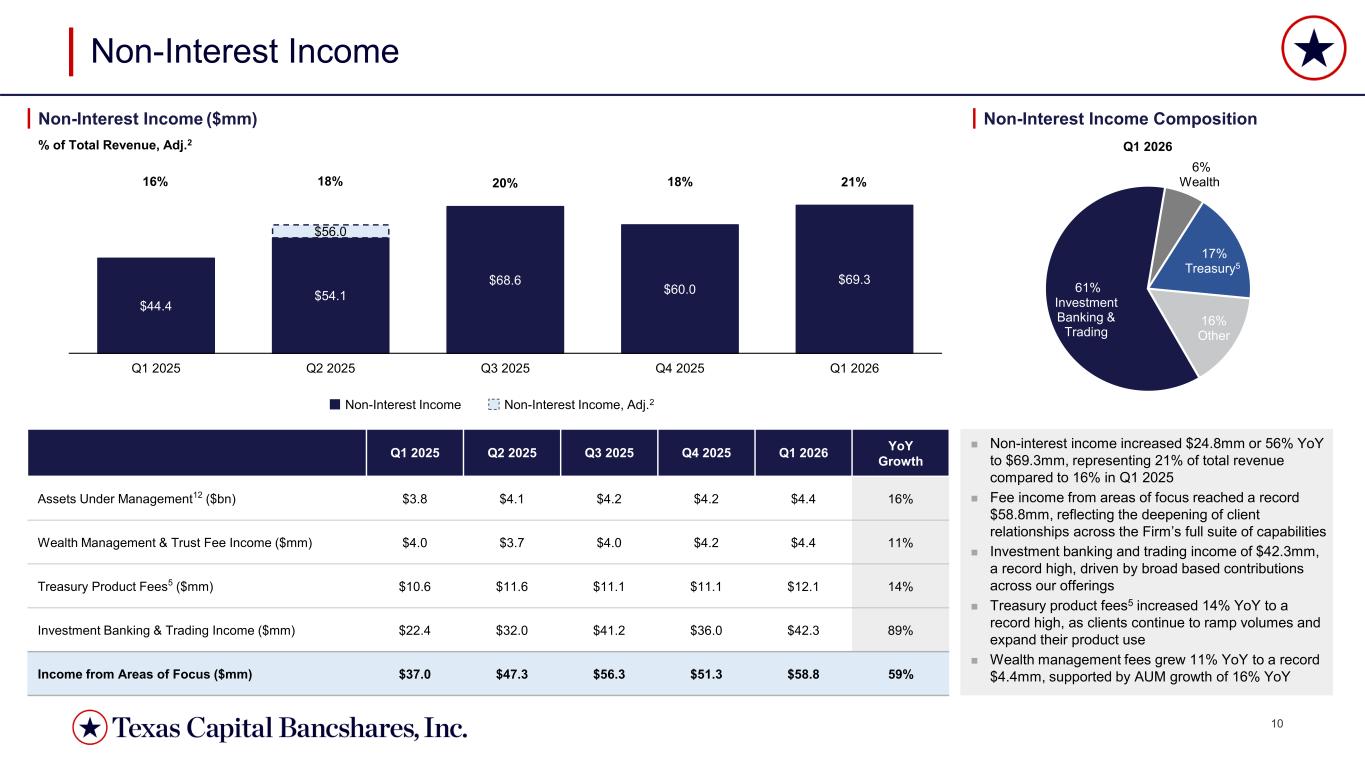
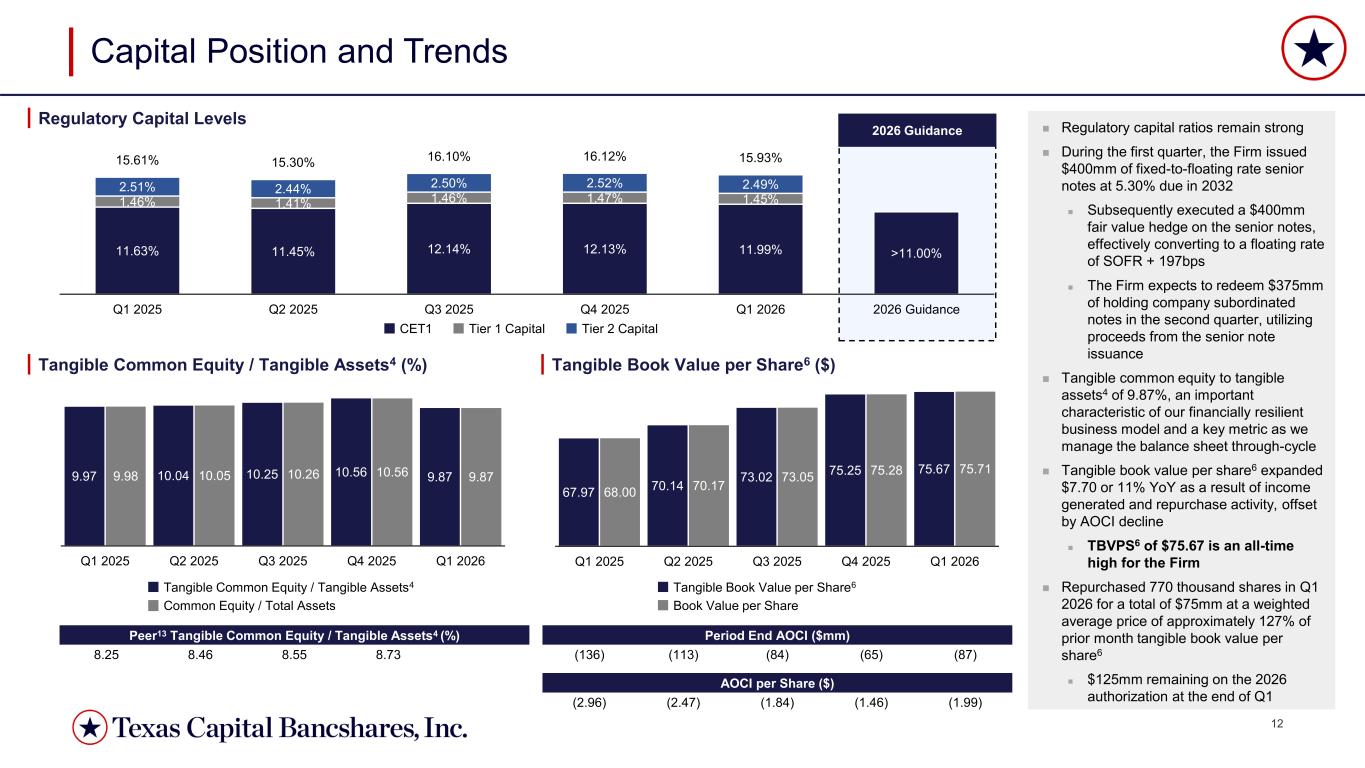
Good morning. We enter this quarter with clear conviction in our strategy and the discipline execution required to continue unlocking substantial value for our shareholders and clients. First quarter outcomes reflect our shift in strategic focus to consistent execution and realizing the full potential of our investments. This quarter, we took decisive steps to align our organizational structure with that imperative. I am pleased to announce strategic executive leadership appointments that further enhance our positioning for growth. Jay Klingman will transition to head of private bank and family office following five successful years building and scaling our middle market and business banking franchises. Dustin Cosper assumes the role of Head of Commercial Banking, overseeing real estate banking, middle market banking, and business banking. This shift positions the firm to drive enhanced client outcomes across private banking and commercial banking through more comprehensive and integrated solutions. John Cummings has been named Chief Operating Officer, charged with driving sustained operational excellence and further positioning our platform for scale. Matt Scurlock, Texas Capital's Chief Financial Officer, will assume the role of President of Texas Capital Bank, further aligning financial, operational, and business leadership across the organization. We have also appointed Jeff Hood as Chief Human Resources Officer to ensure our talent strategy and culture align with our operational and commercial ambitions. He will be joining the firm in early May. Turning to the quarterly results, contributions across the firm enabled another quarter of strong financial progress as adjusted quarterly earnings per share increased 72% versus the prior year period to $1.58 per share as total revenue increased 16% year over year to $324 million dollars driven by eight percent growth in net interest income and 56 growth in non-interest revenue fee income from our areas of focus increased 59 year-over-year reaching 58.8 million dollars in the quarter a record for the firm notably all three focus areas delivered record quarterly fee income demonstrating the platform's continued maturity and enhanced cross-functional strength this is not a single driver story it reflects embedded momentum across advisory capital markets wealth and treasury services all facilitated by excellent client banking coverage across the platform new client acquisition remains a fundamental driver to platform value each quarter the firm on boards clients who generate revenue across multiple service lines a structural advantage that indeed compounds over time. Investment banking fees of $42.3 million grew 89% year-over-year with broad contributions across syndications, capital markets, and sales and trading, reflecting our unique ability to deliver high-quality client outcomes across a range of product solutions. Treasury product fees of $12.1 million increased 14% as existing clients continue to leverage our differentiated payment capabilities and new clients onboard at an accelerated pace. Wealth management fees also increased for the third straight quarter, reflecting building momentum that we expect to continue through the year. In total, fee income comprised 21% of total revenue versus 16% a year ago, demonstrating the success of our multi-year shift toward a more diversified capital efficient and resilient revenue base this trajectory directly reflects discipline client selection and our ability to deepen relationships over time our first quarter capital position highlights both the strength of our platform and the discipline of our capital management approach tangible book value per share of $75.67 increased 11% year-over-year, marking an eighth consecutive quarterly record for this important metric. During the quarter, we repurchased approximately $75 million of common shares at a weighted average price of $96.82 per share, demonstrating our confidence in the franchise and our conviction that earnings momentum will continue. Tangible common equity tangible assets of 9.87% exceeds peer levels, and CET1 of 11.99% remains well above our stated target of 11% and internally assessed risk profile. As previously discussed, we do not manage the firm to an expected economic scenario. We instead regularly evaluate potential macroeconomic impacts on both credit quality and earnings capacity. Detailed reviews over the past few quarters include topics such as private credit, disruption from artificial intelligence, and exposure to data center supply chains, all of which confirm our adherence to disciplined client selection and diligent concentration management. Leading up to the recent conflict in the Middle East, we assessed the impact of rising commodities pricing on a series of client segments, including commercial clients that rely on commodity inputs such as helium, urea, and aluminum, as well as clients whose customers are potentially impacted by rising prices. While our assessment across these topical areas suggests impacts on specific clients are at this point tangential, we nonetheless continue to assume a credit posture in the reserve calculation that is increasingly reliant on a downside scenario waiting. We maintain a balance sheet that is intentionally positioned, carry capital and reserves that provide meaningful flexibility, and deliver a breadth of products and services that keep the firm relevant to our clients in any environment. That posture is a choice, one we have made consistently, and is the reason we approach periods of uncertainty from a position of strength and are front-footed in the market. Our earnings trajectory is sustainable, our balance sheet is strong, and our platform is positioned for durable growth. Today, we are pleased to announce the initiation of a quarterly common stock cash dividend, a tangible expression of our confidence in earnings momentum and our commitment to returning capital to shareholders while funding continued organic growth. This dividend reflects a mature platform, the strength of our capital position, and management's conviction in a long-term trajectory of the firm. Thank you for your continued interest in and support of Texas Capital. I'll turn it over to Matt for details on the financial results for the quarter.
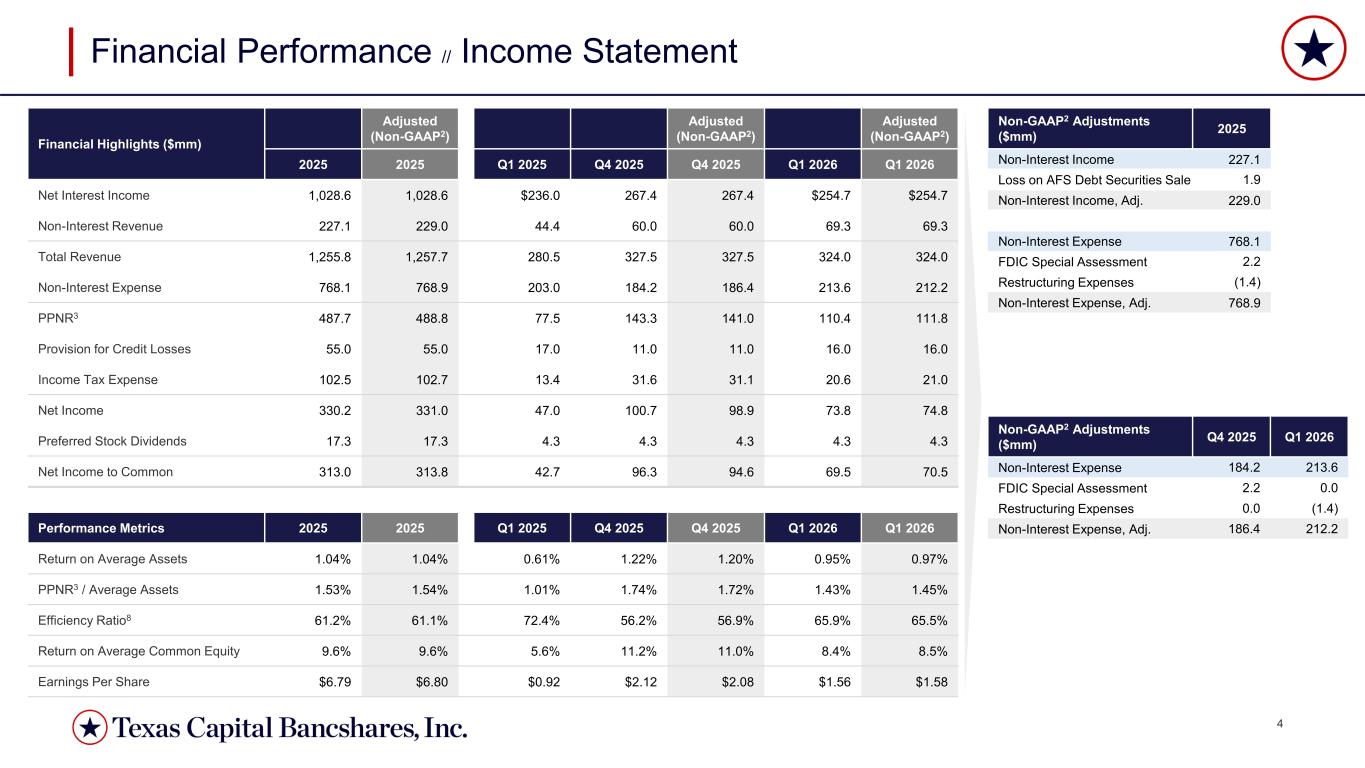
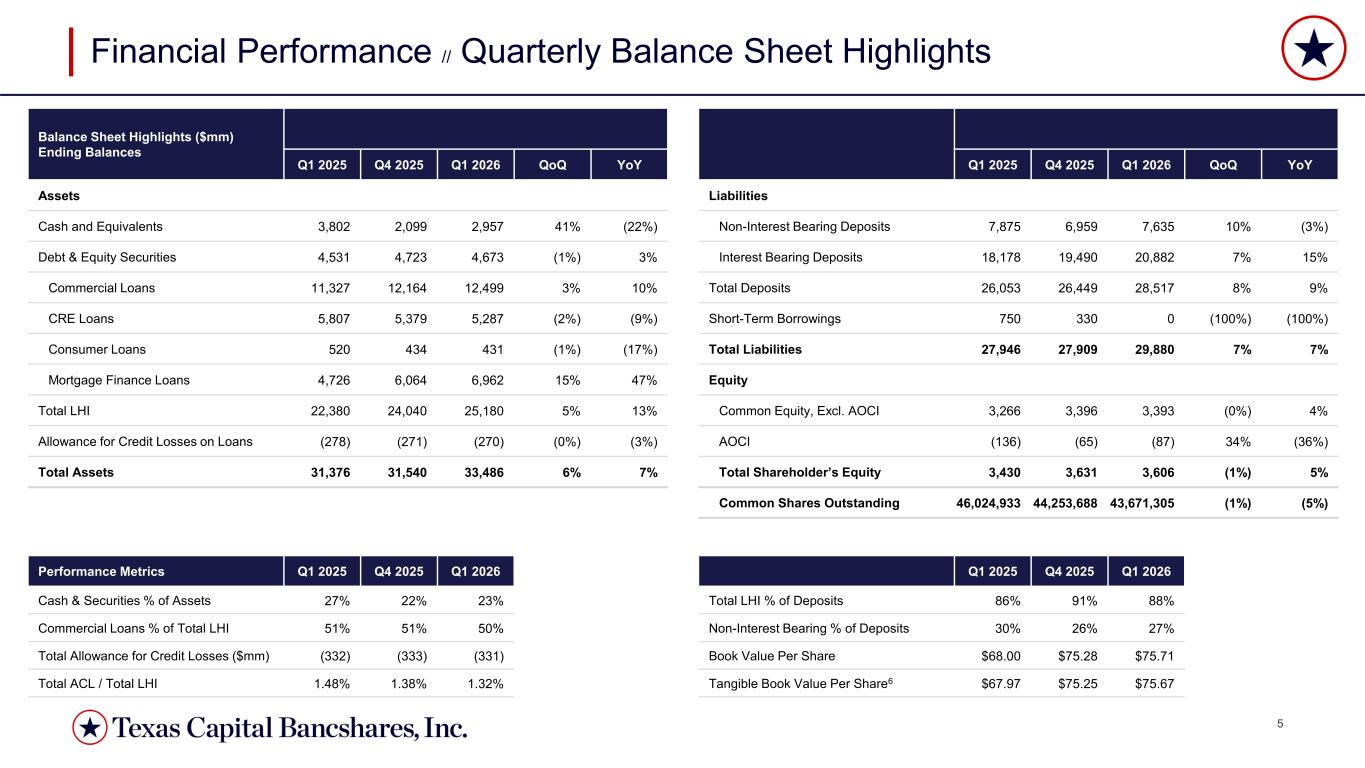
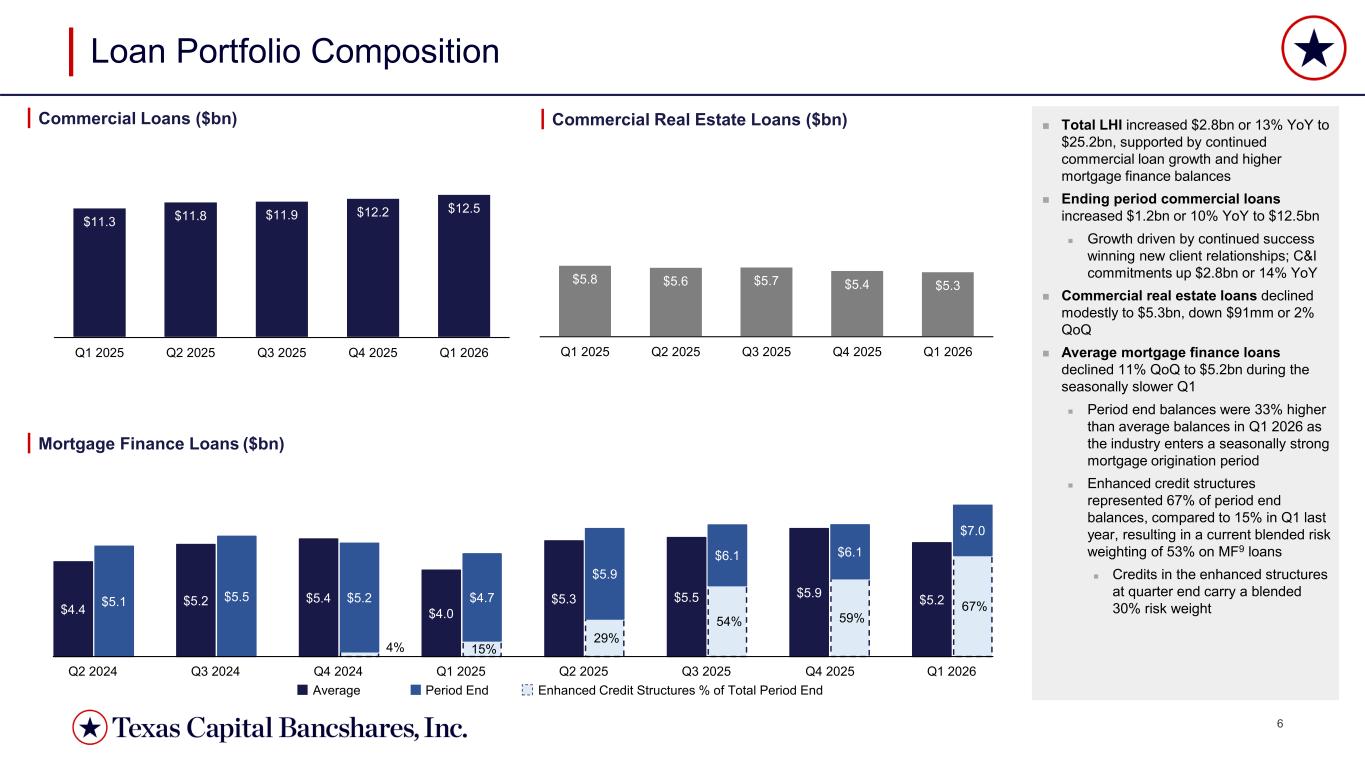
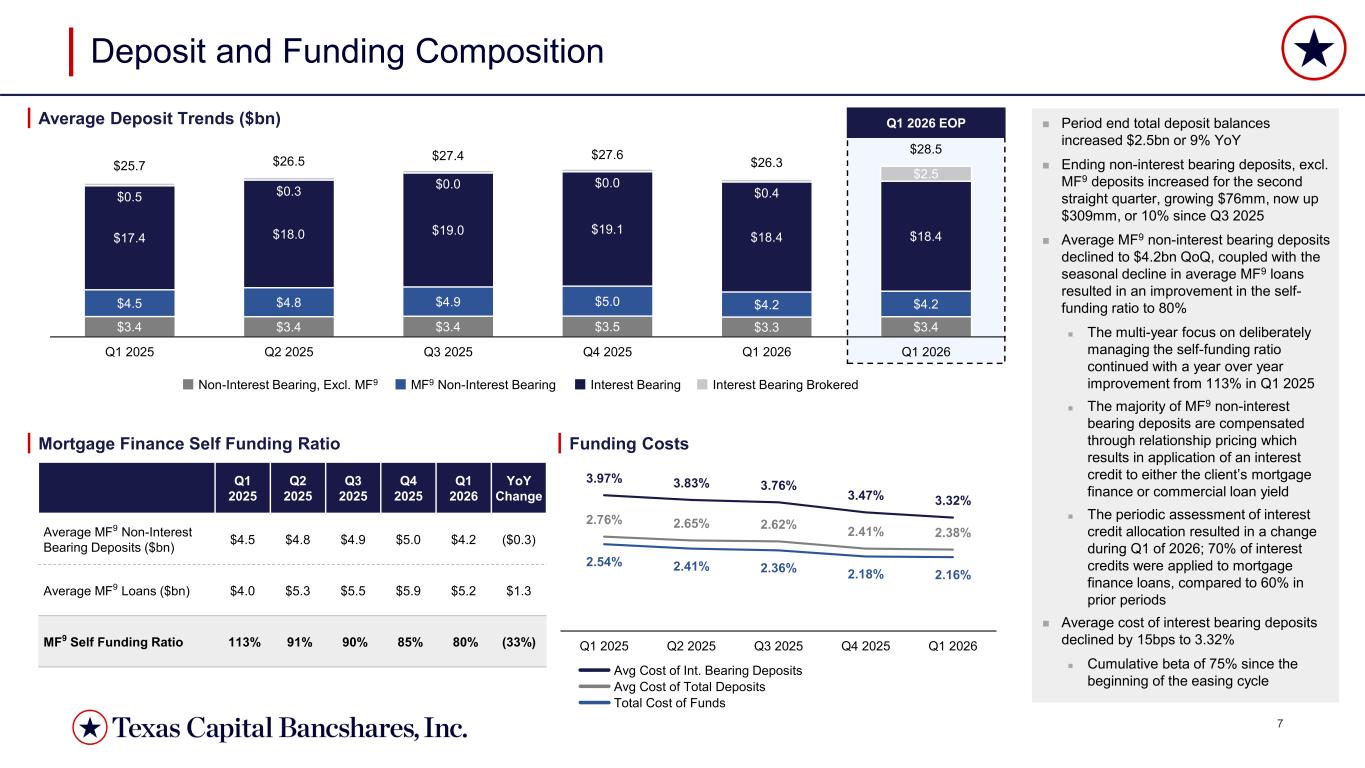
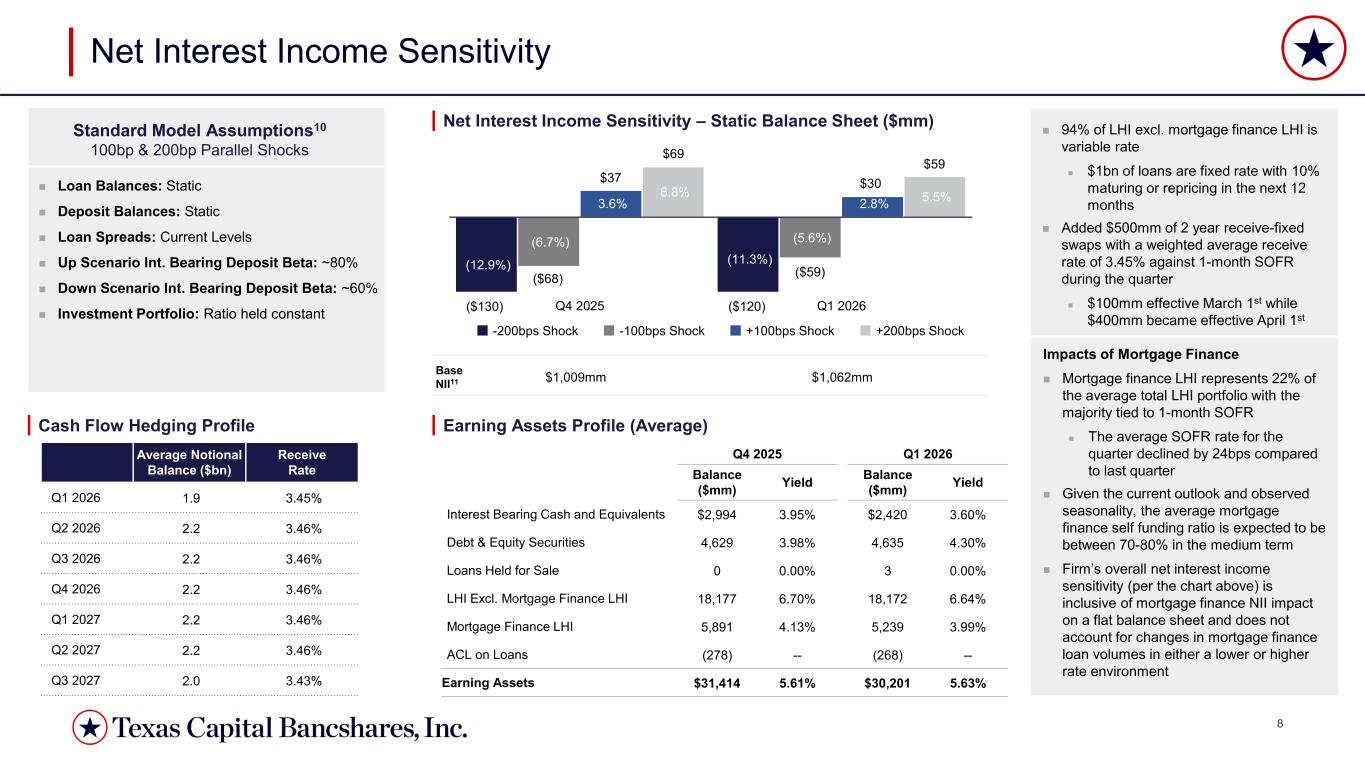
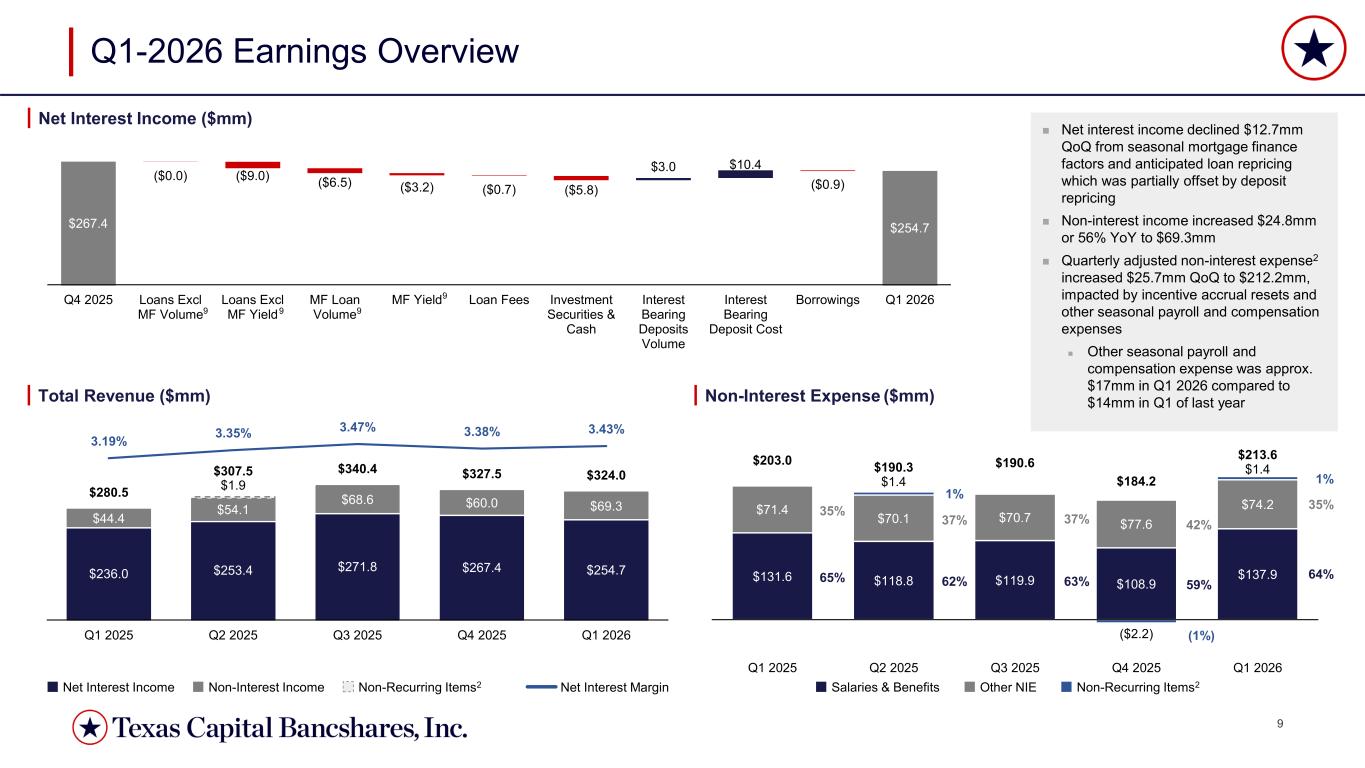
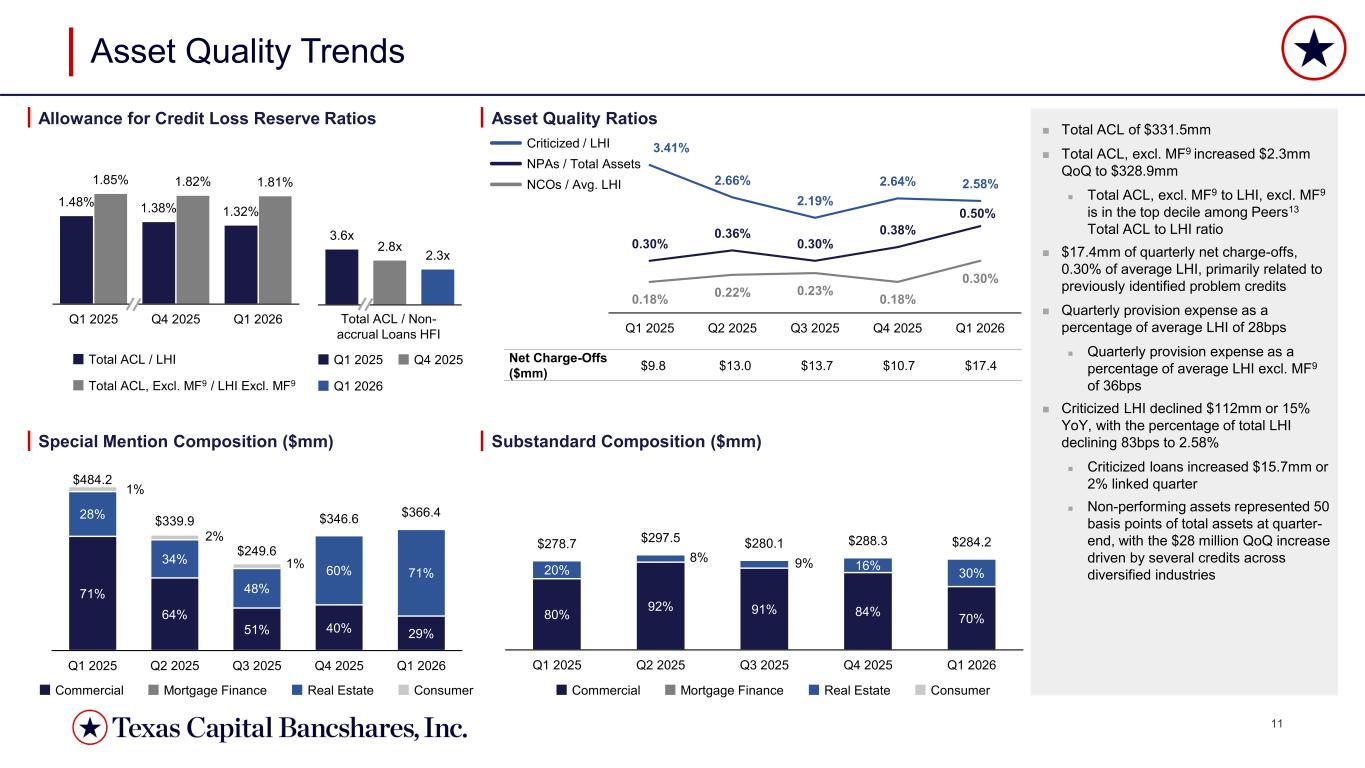
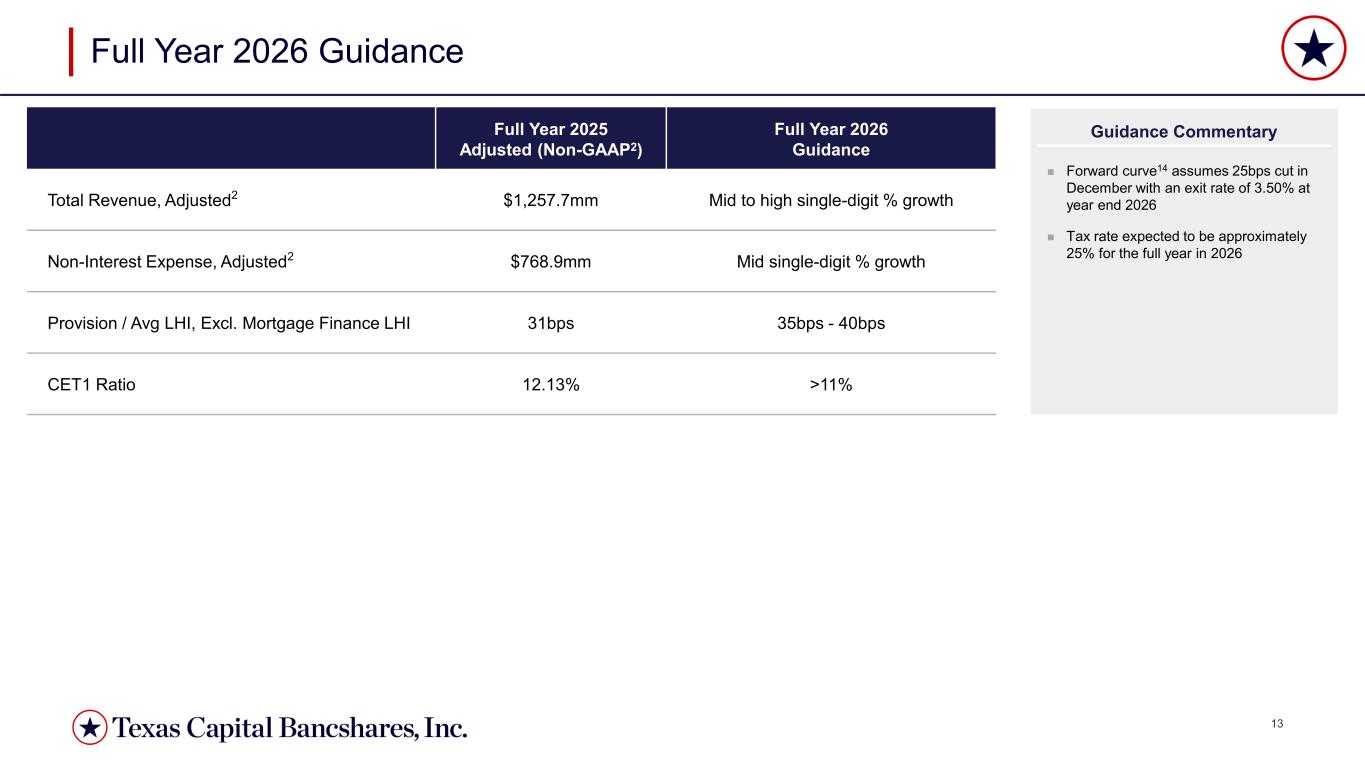
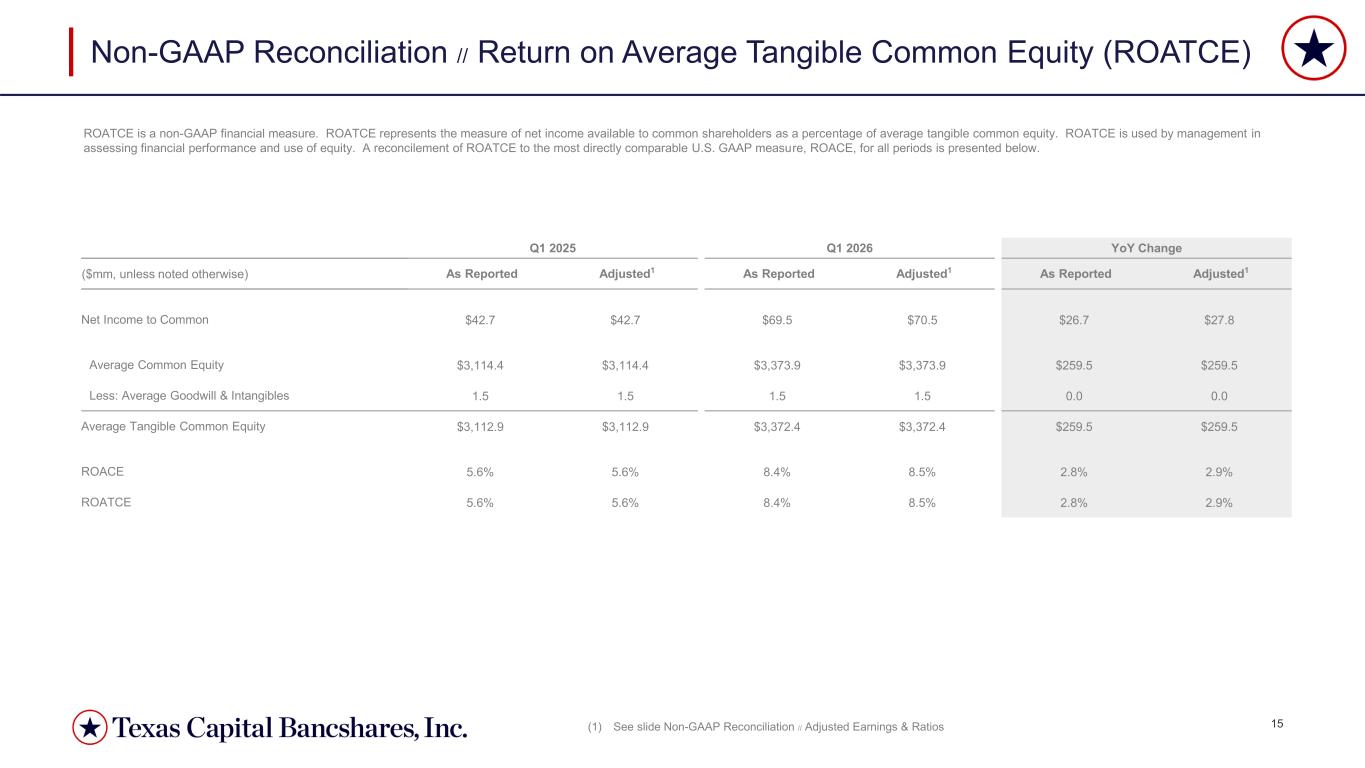
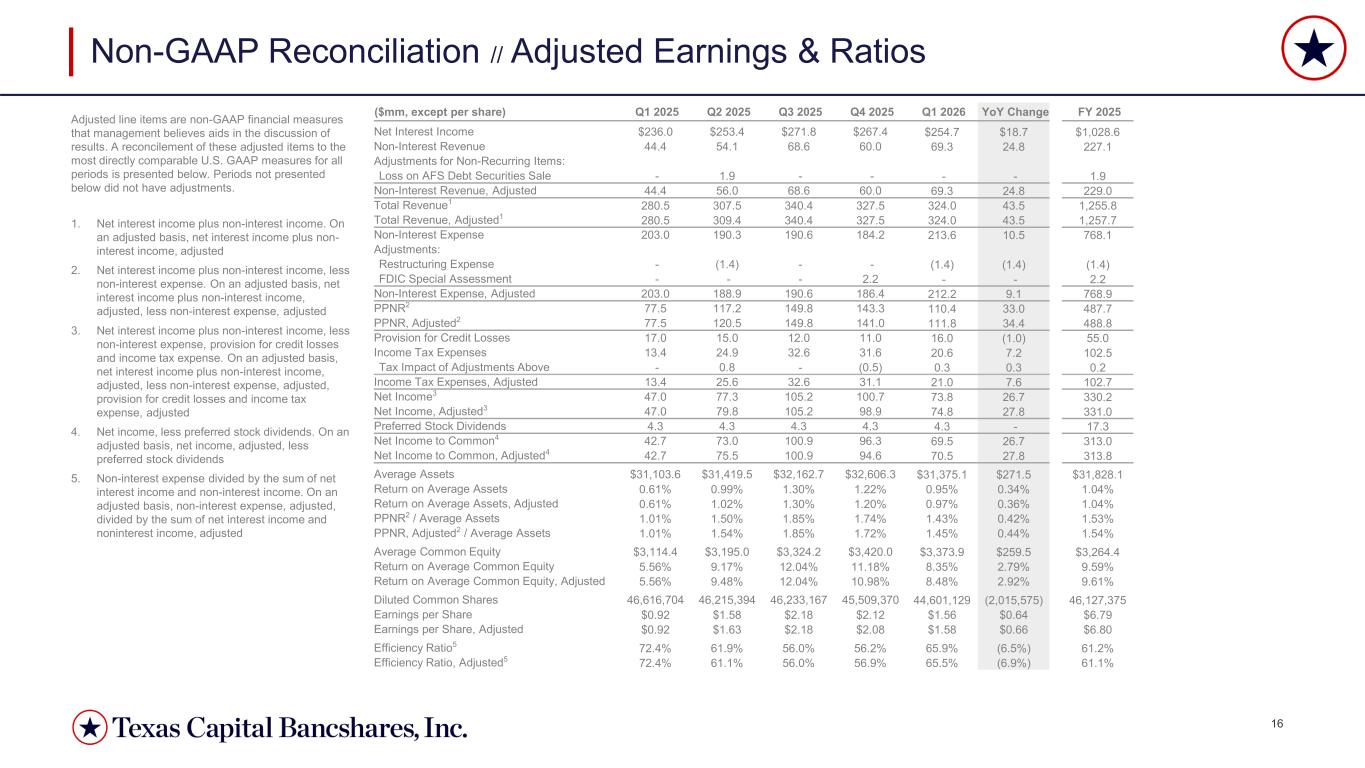
Thanks, Rob, and good morning. Starting on slide four, first quarter total revenue increased $43.5 million, or 16% year year-over-year, driven by 8% growth in net interest income and a 56% increase in non-interest revenue. Net interest income increased $18.7 million year-over-year to $254.7 million, in line with our January guidance of $250 to $255 million, which anticipated modest link quarter decline of $12.7 million, consistent with typical first quarter seasonality. Net interest margin expanded 24 basis points year-over-year to 3.43%. The sixth consecutive quarter of year-over-year expansion and improved five basis points relative to the prior quarter. Non-interest expense increased five percent year-over-year to $213.6 million. On an adjusted basis, non-interest expense was $212.2 million, an increase of $9.1 million relative to the first quarter of last year. As expense-based productivity continues to deliver anticipated revenue growth and incremental new investments align directly with defined areas of capability build. Taken together, pre-provision net revenue increased 33 million or 43 percent year-over-year to 110.4 million. Adjusted PPNR reached 111.8 million of 34.4 million or 44 percent, marking the fifth consecutive quarter of year-over-year expansion. Provision for credit losses of 16 million was stable year-over-year, reflective of anticipated quarterly credit trends and management's continued assumption of economic scenarios materially more severe than consensus estimates. Net income to common was 69.5 million, up $26.7 million, or 63% year-over-year, and adjusted net income increased 65% to $70.5 million. Strong financial performance, coupled with a disciplined multi-year share repurchase program, is consistently driving meaningful EPS growth for our shareholders. First quarter earnings per share reached $1.56, which is up 70% year-over-year, with adjusted earnings per share of $1.58, up 72% year-over-year. Book value per share of $75.71 and tangible book value per share of $75.67, both increased 11% year-over-year, representing the eighth consecutive quarter-end record high for the firm, while the allowance for credit losses held relatively steady at $331 million or 1.32% of total LHI and 1.81% of total LHI excluding mortgage finance. Total LHI of $25.2 billion increased 13% year-over-year and 5% link quarter, with contributions across both the commercial and mortgage finance portfolios. Period in commercial loans of $12.5 billion increased $1.2 billion, or 10% year-over-year, driven by now consistent contributions across industries and geographies, and sustained quarterly increases in target client acquisition. Link quarter commercial loans increased $336 million, or 3%, representing the ninth consecutive quarter of commercial loan growth and continuing the trajectory of risk-appropriate and return accretive portfolio expansion facilitated by our bankers across business banking, middle market, and corporate banking. Commercial real estate loans of $5.3 billion decreased 9% year-over-year and 2% linked quarter, as payoff rates continue to outpace client appetite for capital deployment, with expectations previously provided for full-year average CRE balances to decline approximately 10 remaining intact despite the expected seasonal link quarter pullback average mortgage finance loans increased 32 percent year-over-year to 5.2 billion with period imbalances increasing to 7 billion 33 percent above average for the quarter and consistent with the annual pattern of origination volumes building at the end of q1 heading into the spring and summer home buying season enhanced credit structures now represent 67 percent of period and mortgage finance balances, up from 59% at Q4 2025, further improving the blended risk-weighting of the portfolio to 53%. We anticipate that an incremental 5% could migrate to the enhanced structures over the next several quarters, at which point we should read the maximum near-term potential for the portfolio. Total deposits of $28.5 billion at quarter-end increased 9% year-over-year and 8% linked quarter, with reductions in interest-bearing deposits associated with seasonal tax payments supplemented by modest levels of broker deposits to support the temporary and predictable late Q1 growth in mortgage finance volumes. Ending period commercial non-interest-bearing deposits increased 76 million or 2 percent and are now at 309 million since Q3 2025, with average commercial non-interest-bearing deposits remaining at 13 percent of total deposits for the quarter. Average non-interest-bearing mortgage finance deposits of 4.2 billion decreased 288 million any over year, bringing the self-funding ratio down to 80% for the quarter, as eight quarters of focus reduction clearly improved both the balance sheet resilience and earnings generation. We have now established a more balanced deposit base with a complete treasury offering increasingly embedded across our clients' platforms and would expect the mortgage finance self-funding ratio to settle between 70% to 80% in the near to medium term. The majority of mortgage finance on interest-sparing deposits are compensated through relationship pricing, which results in application of an interest credit to either the client's mortgage finance or commercial loan yield. The compensation and attribution is evaluated on a periodic basis and determined that the 60% mortgage finance and 40% commercial split be updated to reflect the evolution of the mortgage finance business, resulting in a 70% mortgage finance and 30% commercial distribution beginning on the 1st of this year. Average cost of interest-sparing deposits declines 15 basis points quarter and 65 basis points year-over-year to 3.32% as we continue to add value to banking relationships beyond simply price. This is in part evidenced by the 75% cumulative interest-bearing deposit data realized since the beginning of this easing cycle. During the quarter, we completed a $400 million fixed-to-floating senior notes offering due in 2032, priced at a coupon of 5.301%. Proceeds from the issuance will be used in part to redeem the holding company's $375 million fixed to floating rate subordinated notes in May, leveraging improved risk-weighting asset positioning associated with the enhanced credit structures to fulfill holding company cash objectives with a lower-cost instrument. Current and prospective balance sheet positioning continues to reflect a balance sheet and business model that is intentionally more resilient to changes in market rates. Our modeled earnings at risk improved as expected this quarter, as market rates move consistent with our previously communicated preferences for adding duration through the swap book. During Q1, $350 million in swaps matured with a 3.31% receive rate. These were replaced with $500 million in received fixed over swaps executed at 3.45%, with $100 million becoming effective March 1st, and their remainder becoming effective on April 1st. Looking ahead, we'll continue to exercise discipline in appropriately augmenting rate fall earnings generation embedded in our business model, but at this point are comfortable with our near-term positioning across a range of forward interest rate paths. Net interest income of $254.7 million declined $12.7 million in the quarter, primarily related to seasonal mortgage finance dynamics in fewer days in the quarter, which were partially offset by quarter-over-quarter improvements in deposit costs. LHI excluding mortgage finance yields compressed modestly, consistent with expected SOFR-linked loan repricing. Adjusted on interest expense of $212 million increased 5% from Q1 2025, reflecting continued investment of frontline talent across fee income areas of focus and increasing tech-enabled capabilities meant to both improve the client experience while positioning the firm for continued scale. Q1 adjusted salaries and benefits increased $29 million to $137.9 million due to $17 million of seasonal compensation, annual incentive reset, new frontline talent, and annual merit-based salary increases. For the remainder of 2026, we continue to anticipate approximately $125 million of salaries and benefits and $75 million of all other non-interest expense, both on a quarterly basis. As Rob described, non-interest income increased 56% year over year and 15% late quarter, setting several records for the firm. Non-interest income as a percentage of total revenue reached 21% in the quarter, up from 16% in Q1 2025. Consistent with our strategic priority to increased non-interest income to revenue through expanded products and services delivered across our platform. Investment banking and trading income of $42.3 million increased 89% year-over-year, supported by broad-based contributions across the platform. Wealth management and trust-free income of $4.4 million also represented a record high, increasing 11% year-over-year, supported by assets under management of $4.4 billion, which increased 16% year-over-year from organic net inflows and favorable market conditions. Charging product fees of $12.1 million, which is a record high as well, increased 14% year-over-year, driven by continued client adoption and the expansion of payment and cash management capabilities have driven north of 10% growth in gross payment volume in four of the last five years. Total non-interest income is expected to be $65 to $70 million per Q2, with revenue attributed to investment banking and sales trading, contributing approximately $40 to $45 million. The total allowance for credit loss, including off-balance sheet reserves of $331 million, remains near our all-time high. When excluding the impact of mortgage finance allowance and related loan balance, the allowance was relatively flat in the quarter at 1.81% of total LHI, which is in the top decile among the peer group. Net charge-offs for the quarter were 17.4 million or 30 basis points of lhi and tied to previously identified credits in the commercial portfolio during the quarter previously discussed commercial real estate multi-family credits were further downgrade as projects and lease up continue to require ongoing rental concessions to gain or maintain occupancy despite these net operating income influence grade adjustments material project specific equity and sponsor support give us confidence in the fundamental portfolio quality moving through the year. Capital ratios remain strong and well in excess of our internally assessed risk profile, with tangible common equity to tangible assets of 9.87% and a CET1 ratio of 11.99%. During the quarter, the firm repurchased approximately 770,000 shares for $74.6 million at a weighted average price of 96.82 per share, representing 127% of prior month's tangible book value per share. We remain committed to prudent capital deployment that balances organic growth and tangible book value accretion through share repurchases at levels that we view as attractive relative to the firm's intrinsic value. Additionally, against the backdrop of more durable and structurally higher levels of earnings generation across the platform, the Board of Directors has approved the initiation at a quarterly common stock dividend 20 cents per share, providing another tool to effectively manage capital on behalf of our shareholders for full year 2026 our overall outlook remains unchanged from guidance given in january as we continue to realize scale from multi-year platform investments guidance accounts for one additional rate cut in december with a fed funds rate of 3.5 a year end we anticipate total revenue growth in the mid to high single digit range driven by industry leading client adoption and continued growth in our fee income areas of focus with full year non-interest revenue expected to reach $265 to $290 million. Anticipated non-interest expense growth in mid-single digits reflects increased year-over-year compensation expenses tied to improved performance, targeted expansion and defined client coverage areas, and sustained platform investments. Given continued economic uncertainty and our commitment to operating from a position of financial resilience, we reiterate the full-year provision outlook of 35 to 40 basis points of average LHI, excluding mortgage finance. This outlook reflects another year of positive operating leverage and sustainable earnings generation. Operator, we'd now like to open up the call for questions. Thank you.
Operator
Thank you very much. To ask a question, please press star followed by one on your telephone keypad now. If you change your mind, please press star followed by two.
When preparing to ask your question, please ensure your device is unmuted locally our first question comes from woody lay from keith barrett and woods your line is open woody please go ahead hey good morning guys um so the earth the earth is momentum is it's really great to see uh you you mentioned um some of the uncertainty in the middle east and feel good about your clients as it pertains to the investment banking pipeline i i know last year with some of the tariff noise. We saw some timing pushed out to the back half of the year. Do you expect a similar dynamic to happen here if this uncertainty lasts longer in the quarter? I'd start by saying that we're really pleased with our track, whether that's bank debt or non-bank debt. So we were the number one arranger, along with arranging over $11 billion of debt outside the bank markets for our clients. And then we raised over a billion dollars on still new equities platform. So when you think about how we use the investment bank as a differentiator in the market, I think the coverage bankers are really doing a great job of leveraging the product. I think that's evidenced in part by over half of the investment and banking fees outside of sales and trading that we've generated in the last six months coming alongside new client acquisition and banking. So these record fee quarters continue to be underpinned by much more granular deal volumes. So these are not a couple of large transactions. These are really durable, consistent approach to delivering service in the market. And we still feel really good about the $40-$45 million for the quarter and $160 to $175.
I'll just add one thing, Woody, clearly articulated what I think is very good stats. So remember, we're not doing investment banking with a different set of clients. We're doing it We're delivering the best investment products to our middle market and corporate clients because of the great relationships our middle market and corporate bankers have with those clients, which gives credibility to the investment bank and bankers when they come into the room, which I think is a differentiated part of this platform.
Got it. That's a helpful caller. um maybe just shifting over to the mortgage finance business the the period and loan balances were uh well above where they have been historically i know that can be kind of volatile with timing but just any any expectation for average balances uh as we as we head into the second quarter yeah there was quite a bit of volatility in q1 on 30-year fixed rate mortgages We got as low as about $5.98 in the last quarter, high point in the last week of March at about $6.64. If you'll recall, the full-year guide, about 15%, it's predicated on $2.3 trillion origination market. And there could be some volatility along the way. We still think that's the right number for the full year. That gets you to about a $6 billion full-year average warehouse balance. So we think that's actually the number for Q2 as well, Woody, that you'll have about $6 billion of average mortgage finance volumes. you should end $1 billion, and that comes with about $4.5 billion, which would help the yield move from around $399, I think is where we were this quarter, to somewhere around $405 in Q2. And then the last thing I'd note on that, we've clearly compared a significant amount of capital in that for the loans that are in the structure, it's a weighted average risk winning at 30%, 53% for the entire portfolio, and then 78% of those clients do things with us and the dealer, and 100% of them are on our treasury platform. So incremental volume in the mortgage finance business is significantly more profitable for us now than it's really ever been.
I would just suggest that that new credit enhanced structure fundamentally changed the firm. It took a business that by definition was a subpar loan-only business and moved it in concert with a new products and service platform where we're doing many, many things with those clients and we're lending to them through an improved, dramatically less risk structure that allows for there to be a higher return and release capital. So it fundamentally changed the way we look at that business, and it's more of an industry vertical than a mortgage warehouse.
And just to put a couple more numbers around that, Woody, I mean, over the last 12 months, we've grown loans by $2.8 billion. or 13%. And we've also bought back 6% of the company, $228 million for inside of $87 a share while actually growing CET1 by 36 basis points. So this has been a critical factor, not just in structurally enhancing profitability, but enabling us to deploy capital in a variety of different ways. Yeah. All right. Well, that's all for me. Thanks for taking my questions. thanks buddy our next question comes from casey hair from autonomous research your line is open casey please go ahead hi good morning this is jackson singleton on for casey hair uh matt just wanted to start on nim uh any colors you can give us on the drivers uh heading into 2q uh yeah jack happy happy to walk through that so we're really pleased with the ability to generate a range of interest rate environments and as we've talked about in previous calls that's really predicated on improved deposit repricing, which for us is a result of being more relevant for clients, and just a deliberate move away from historically higher cost funding sources. That said, we have been pretty vocal on previous calls. We think the cost of funding for the industry is going to go higher over time, and our strategy and prospective resource allocation tries to contemplate the mix of businesses and services that we're going to need to earn an acceptable return against that reality. So, we have no additional reduction in deposit costs incorporated in the full year guide. And for Q2, we do anticipate slightly higher interest sparing deposit volumes, which will be in place, I'm sorry, interest sparing deposit costs to support volumes necessary to fund the seasonal, predictable, and temporary increase in mortgage finance, which we just walked through anticipated growth there. So, as you see mortgage finance grow in the second quarter, that's obviously a lower yielding asset. So the yield's moving from $399 to $405, where the yield on all other loans outside the mortgage finance business is there around $665. So that blends the overall loan yield down from $604 to call it mid to high $590s, which should push the margin down to $335, $340, while seeing NII actually increase on the larger balance sheet to $260, $265.
Got it. Okay. Super helpful. And then just one follow-up for me. How should we think about buybacks going forward, given CET1 is still well above 11%, but your TCE is now around 10%, which is around the soft target. And then you just announced the dividend, obviously. So just any color you can give into how management is thinking about buybacks for the rest of the year?
Yeah, we've got $125 million of remaining authorization, we've shown propensity to buyback inside of 1.3 times tangible, which is essentially two to three year out tangible book value for us to be constructive around those prices. And then the decisions around buyback or the recently announced dividend, which Rob can talk to, were not influenced by potential changes in the regulatory capital treatment. But just for you, Jack, I mean, that's roughly 100 basis points, but we're confident our current levels of earnings generation, our capital position, our reserve level of liquidity, and for police to have another tool at our disposal to effectively allocate capital?
Yeah, I would just say I think we've proved to be pretty good stewards of allocating capital, and distribution policy is something that's important to shareholders and us, and the dividend shows great confidence in the platform and our bankers and our earnings and prospects going forward as well as our capital and our risk posture so we're really really excited about just having another quiver uh and ability to uh add to distribution policy as we go forward great thanks for all the help um i'll set that as a reminder to ask a question please
Operator
press star followed by one on your telephone keypad our next question comes from anthony your line from J.P. Morgan. Your line is open. Please go ahead.
This is Mike Petrini on for Tony. So I guess I'll start. I'm curious if you guys could provide any color on what drove the quarter-over-quarter increase in MPAs, any industry in particular that stood out, anything you'd provide on that would be great.
Yeah, those are a few previously identified credits that we've been reserving for now for multiple quarters. They're continuing to go through work out in a way that we think is going to be maximally beneficial for the firm. So there's no industry concentration. There's one multifam, a couple of corporate with our guy.
Okay, great. And then just one on expense. How are you guys sort of thinking of the split between comp expense and non-comp expense?
Yeah, when you strip out all the seasonal comp and benefit expense from Q1, it's about $17 million. Then you add back in annual incentive comp accruals, impact of new hires primarily in the fee income area as a focus, and then just a few weeks of next we continue to expect around 75. We focused on expenses associated with putting new capabilities in the market, so growth and occupancy, marketing, and technology expense, which is an expense in support of revenue. So we like $200 million in Q2, and I think that's probably a pretty good number for Q3 and Q4 as well. And just as a reminder, that's enough to cover the high end of the revenue guide. So if you see revenue, particularly fees, come in inside the high end of the guide, you would have some offsets.
Operator
Great. Thank you. Our next question comes from Jared Shaw from Barclays. Your line is open, Jared. Please go ahead. Jared, your line is open. Please go ahead with your question.
Hi. Sorry about that. Good morning. You know, with the self-funding ratio guiding lower now, what does that mean for total end-to-period and average GDA balances as we look at next quarter?
The self-funding ratio, we think at this point, almost all of those client relationships. So, Jared, I wouldn't anticipate the self-funding ratio really moving much lower. I think somewhere between 70% and 80% is probably the right way to think about it over the rest of this year.
Okay. All right. Thanks. And I think you went through the NII guide or Outlook for a second quarter. Was that 260 to 265? Did I catch that right?
You got it. You got it right. 260, 265, margin 235.
Operator
Our next question comes from David Schibarini from Jefferies. Your eyes open, David.
Please go ahead. Hey, guys. How are you doing? Max on for David. Just a quick question around CNI and their pipelines. I know you attributed a lot of the growth to actual new client growth rather than just high utilization. So I was kind of hoping you'd talk around new client growth versus high utilization lines for fiscal year 2026.
Yeah, utilization is up 1% link quarter. It's down 2% year over year. We continue to sit around that 45% level. The majority of the growth continues to come from new client acquisition. commitments are up 2.8 billion dollars almost 15 percent year over year and i think an important thing is that when we're acquiring these clients do the banking verticals or doing other things with them they're generating investment banking fees quite often at the 90 percent of them are doing treasury business with us which is why you're seeing continued pickup and year-over-year treasury product fees so the the incremental profitability associated with new client acquisition and c and i is and the math point earlier when you arrange 11 billion of debt for
clients that's not bank debt, but term loan B and high yield and private credit and close to a billion dollars of equity, new clients aren't showing up through loan growth. They're showing up in other ways at the firm.
Got it. Thank you very much for that, Kelly. I appreciate it. Just a quick follow-up, going to CRE loans, paydowns decreased again this quarter. Any color you can add to that? Any specifics that you expect for CRE declines for the rest of the year?
And we still think average balances are down at least 10%. $5.7 billion average last year. You could see $100 million come off in each of the next three quarters. Credit availability in that space, we are fairly focused on multifamily and industrial, the lowest levels in 10 years. So the reduction of those balances is nothing other than a reflecting less and us having plenty of opportunities to deploy capital elsewhere, so not chasing lower yields on the marginal client.
Operator
Thank you very much. Our next question comes from Matt Olney from Stevens. Your eyes open, Matt. Please go ahead.
Yeah. Yeah. Thanks. Good morning. Most of my questions have been addressed. Just want to go back to capital. And I appreciate the commentary around the common dividend and the buyback. I'm just curious on the, as far as M&A, where does M&A rank as far as the capital priority list this year? Thanks.
Nothing's changed there. It's part of the menu on the strategy continuum. We continue to look at opportunistic alternatives in M&A, whether it's whole bank or otherwise, and we will continue to do that. So the great news, you know, you're going to get tired of hearing me say it. The great news is we don't have to do anything. You know, our M&A transaction was a transformation, and we still have a ton of synergies. both cost and revenue that we can exploit and that will benefit the shareholders for a long period to come. So we're really, really excited about being in the position that we're in and not having to do something strategically to achieve our goals.
Okay. Thanks. That's all from me.
Operator
As another reminder, to ask a question, please press star followed by one in the telephone Thank you, Pat. Our next question comes from John Hofstrom from RBC. Your line is open, John. Please go ahead.
Thanks. Good morning, everyone. Hey, John. A few follow-ups. A few follow-ups. Matt, you like technology spending as one of the drivers you're focused on. Can you just talk a little bit about where you're spending in terms of tech and, you know, what some of the projects are that you have going there.
Yeah, I mean, John, we hope at this point we've got a testing and a technology platform that yields either target clients' efficiencies. We continue to look aggressively at ways to automate, digitize, eliminate process, improve the employee experience, and decrease. So if we think about the year-over-year increase in tech spend, some of that's just capitalized project portfolio that should have the outcome of reducing expense or showing increase in revenue elsewhere on the platform. And then we are quite focused on figuring out ways internally to leverage AI's expenses as well.
So, John, yeah, John, I'll tell you, like, I grew a little frustrated a short period back about our progress with AI. And then we realized, you know, to do AI really, really well, you've got to have a great data platform. We've luckily been building that for the past five years. It's called Big Sky. You've heard us talk about it. we're in the cloud. It's a modern tech infrastructure. We have over 250 internal APIs that you need for AI. So we have all the things that we need. And then in the past short period of time, we've made up a lot of ground. We have our own secure multi-LLM AI platform called Ranger. It's available to most of our employees. It was built by our tech team. About 80% of employees have access to that and used it in the last four weeks, so it's widely used and widely adopted. And then we have kind of a three-pronged strategy on the AI. Number one, we have firm-wide agents. Right now they're in production for loan ops and fraud. We'll have credit agents to do portfolio reviews, et cetera, here pretty soon in the next quarter. Great adoption by the credit team there. And we have over 170 processes that we're mapping for firm-wide agents as well. And what I mean by that is every company has process mapping, but they're done vertically, not horizontally. So they're done risk, tech, ops, frontline, product, service, but they're not done as a continuum like you onboard alone across the entirety of the platform of origination, approval, onboard, monitoring, et cetera. So we've got about 170 plus processes that will look at either digitizing or improving or applying AI on top of that process mapping. We also have Agent Builder, where we have about 64 employees on that who have created 280 agents that they want to use. We're tracking those agents. So if there's eight employees that have all created the same agent, well, we'll create a better agent, retire the seven, and leave the single one and use it across the firm for adoption. And then lastly, we're selectively deploying third-party solutions, so an AI solution for certain things that we'll use as well. So we think that's the right way to move forward, and we're really, really excited about it, and we have the right embedded governance and risk management to do every stage of development and deployment, which I think is important.
Yep. Okay. Good. That's very, very helpful. One question on the promotions, and congrats, Matt, on that. Um, but the private banking and family office title, um, it says, you know, leading wealth capabilities as well. Is that the first time I've seen private banking and family office, uh, named in any of your, um, you know, kind of titles or documents, what's the plan there? And does that include wealth management kind of, you know, where do you think you are in terms of, you know, the timeline for growing that business?
So that business was a legacy business here. However, like most things, we found the infrastructure in it was really, really poor. So we had to go to a new custody. We had to improve the digital journey of clients. We had to restructure a service. We had to change a lot of different things. Now that's in really, really good shape. We have one of the highest-rated high-yield savings digital accounts in America, so we know how to digitally improve client journeys. Now our client journey on our private bank platform is as good as a money center bank. I suggest you go try it. We can onboard you, John, if you want. Our custody works right now. Our portfolios have always done really, really well competitively, I mean, or better than competition. for like-like risk portfolio, but now with the right infrastructure and the right client journey, we think we can really put weight behind that business and grow it. Just like, remember, our bankers are already calling on all these clients, these managers of these companies, and the brands already won their trust and confidence. So just like a middle market banker, that's the point of the spear for investment banking, now they can do the same thing for wealth and with much more confidence. Jay's run a wealth business before here in Texas, and so it's something he's familiar with and knows well, and he knows our clients, and he can partner really, really well with Dustin, who used to report to Jay at running commercial real estate, and they can really partner with growing that business across the platform. So it's something we're really, really excited about. The family office We're just excited about that is new as of six months ago, maybe six months ago. We hired someone from a money center bank who ran that business on the West Coast to come here. There's more family offices in Texas than any other state in the country and more in Dallas than any other city in Texas. And so we think that's a real key component in differentiating both for the private bank as well as investment banking and treasury.
And then just one last one for me on the dividend. I like that decision, but I'm just kind of curious, how heavily debated was that at the board level? Or do you think that was just a relatively easy decision and rational in terms of the life cycle of the company?
Thanks. Well, the good news, John, is the board has complete confidence in this management team and the people that work here. We've created a lot of credibility at the board level, just like I hope we have in the investor level. We certainly have with the regulators by doing exactly what we said we'd do over a long period of time, both in the short and long run. And the employees here in our bankers, middle and back office, have delivered exactly what we said. And so when you have these conversations, it's on the backdrop of a lot of confidence and a lot of proven performance that gives them the confidence to fully support the dividend. And I would say that it was an important decision, but it was not labored.
Okay. Thank you. Appreciate it.
Operator
We currently have no further questions, so I'd like to hand back to Chairman and CEO, Rob, for some closing remarks.
Just want to say thank you to everybody for dialing in and look forward to next quarter.
Operator
This concludes today's call. We thank everyone for joining. You may now disconnect your lines.