Operator
Welcome to U.S. Bancorp's first quarter 2026 earnings conference call. Following a review of the results, there will be a formal question and answer session. If you would like to ask a question, please press star then 1 on your phone. If you wish to withdraw your question, please press star then 1 again. This call will be recorded and available for replay beginning today at approximately 10 o'clock a.m. Central Time. I will now turn the conference call over to Jen Thompson.
Thank you, Regina, and good morning, everyone. In our boardroom today, I'm joined by Chief Executive Officer Gunjan Kedia and Vice Chair and CFO John Stern. In a moment, Gunjan and John will be referencing a slide presentation together with their prepared remarks. A copy of the presentation, our press release, and supplemental analyst schedules can be found on our website at ir.usbank.com. Please note that any forward-looking statements made during today's call are subject to risk and uncertainty. Factors that could materially change our current forward- looking assumptions are described on page two of today's earnings presentation, our press release, and in reports on file with the SEC. Following our prepared remarks, Gunjan and John will be happy to take questions that you have. I will now turn the call over to Gunjan.
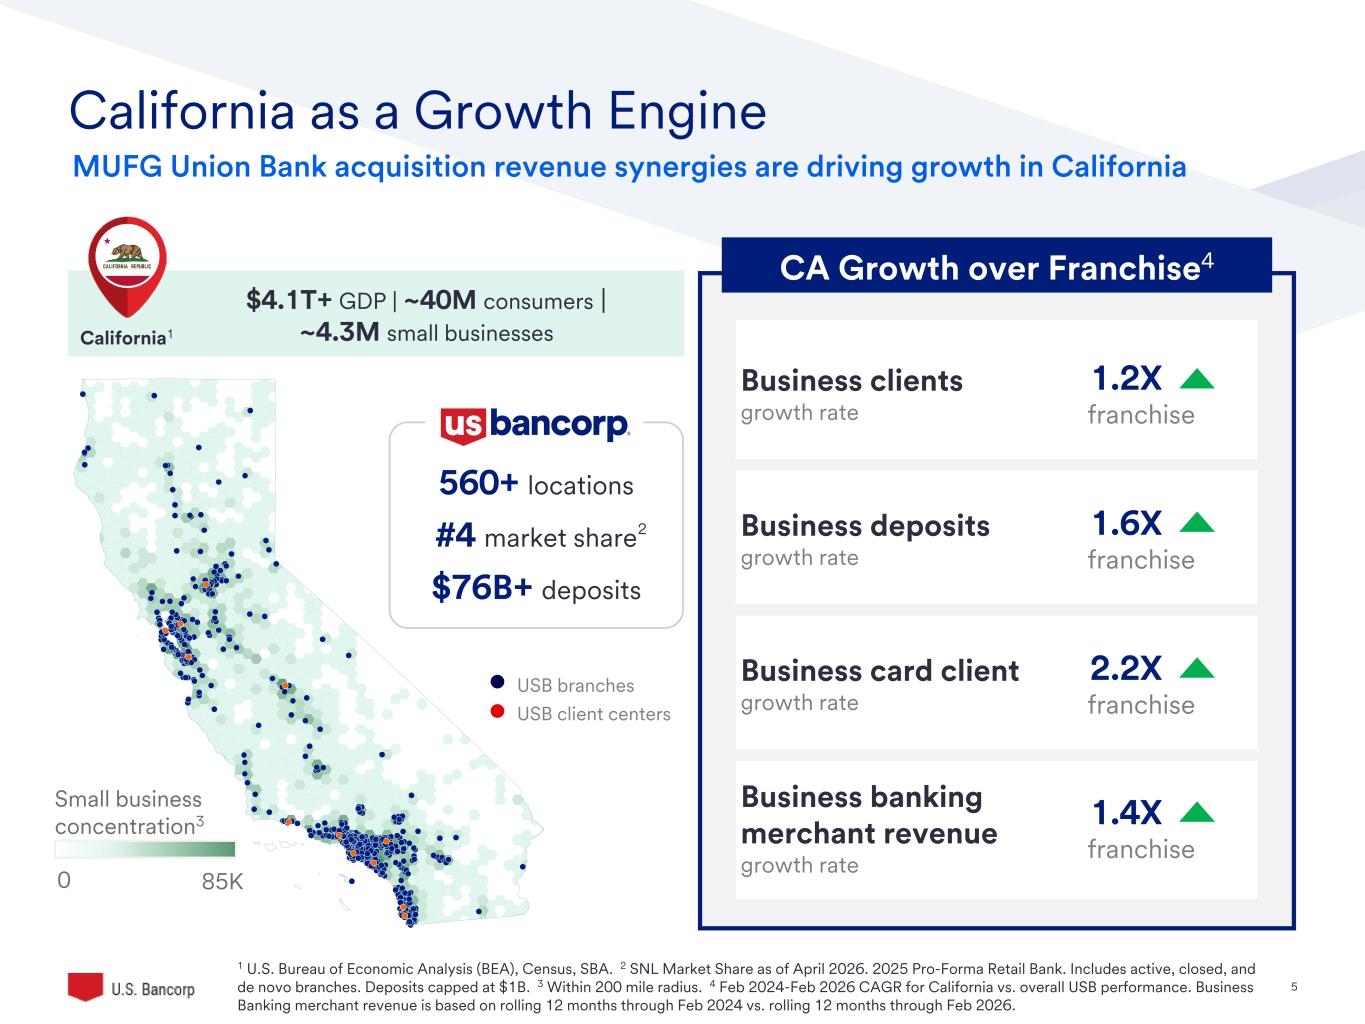
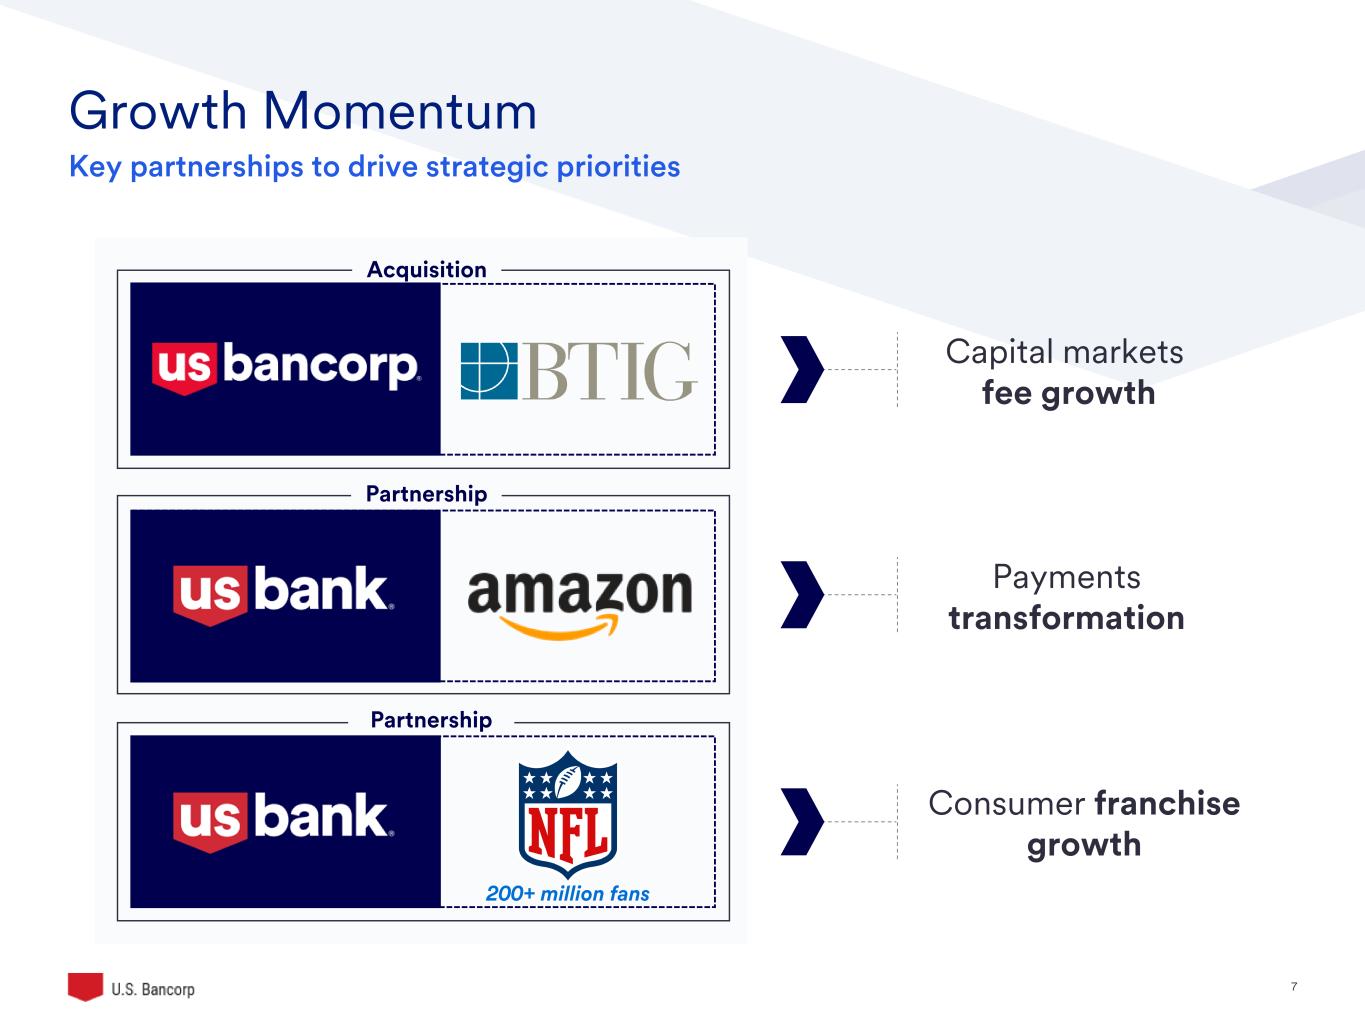
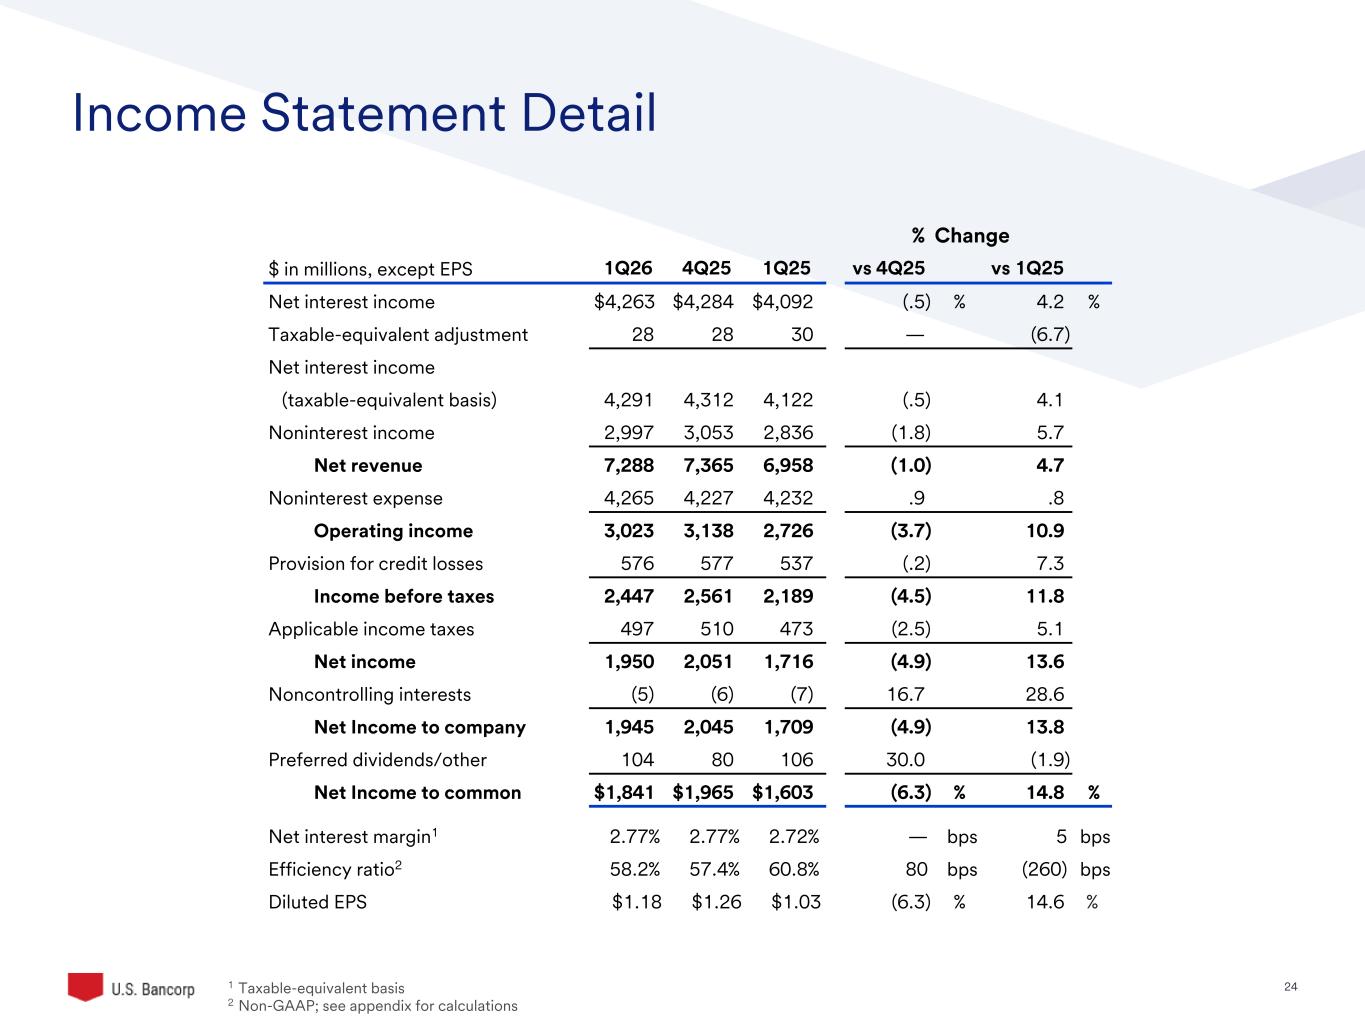
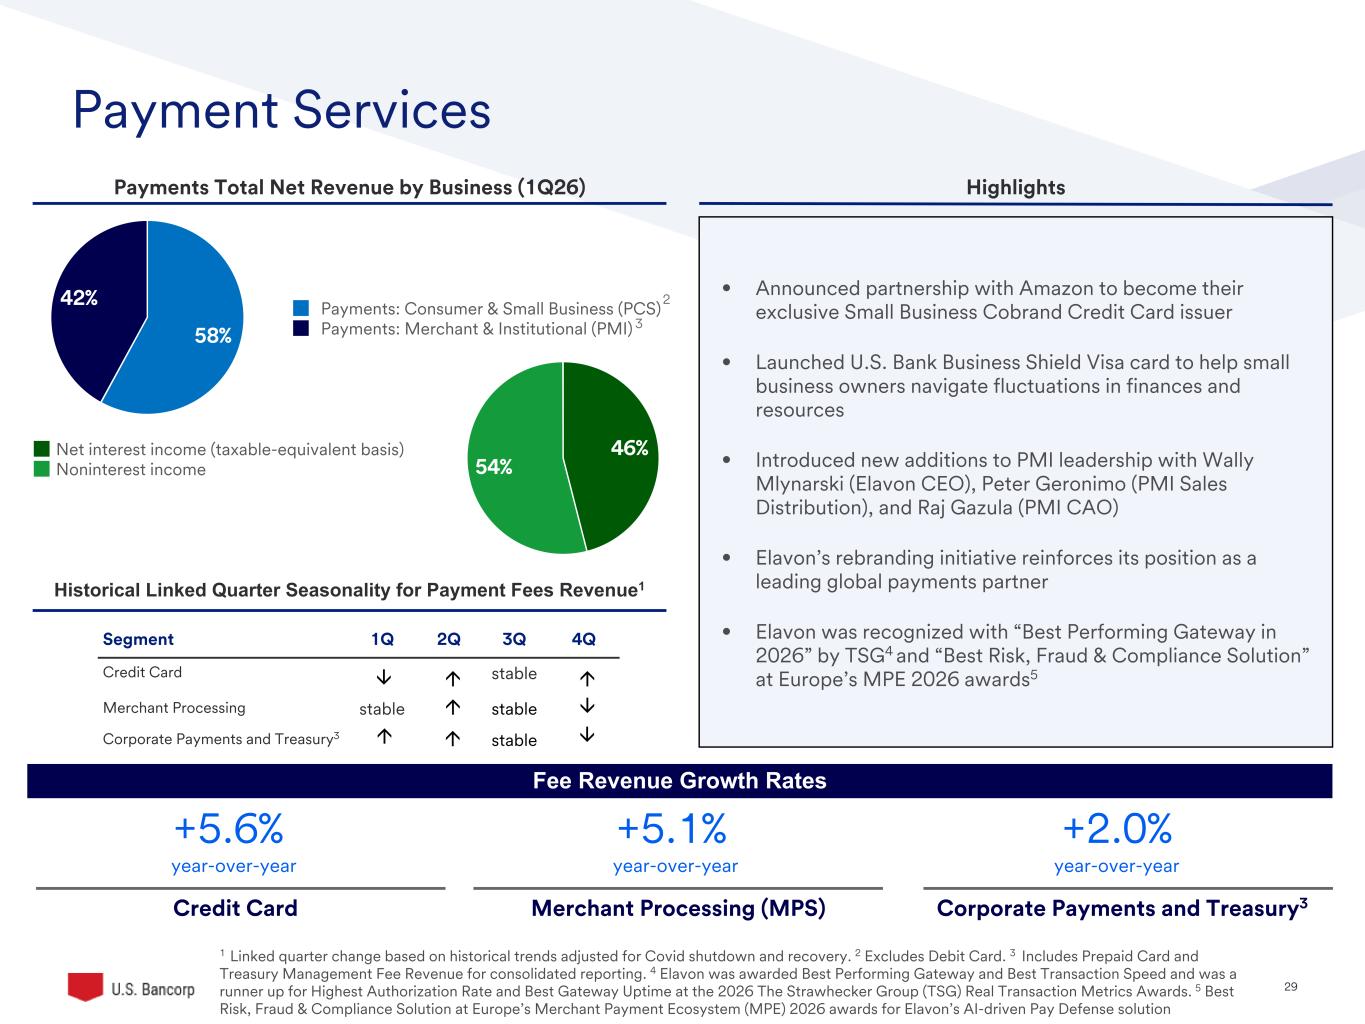
Thank you Jen and good morning everyone. I will begin on slide three. This quarter we delivered earnings per share of $1.18, a year-over-year increase of approximately 15 percent. Total net revenue of $7.3 billion increased 4.7 percent year-over-year with broad-based growth across each of our three major business lines. Net interest income on a taxable equivalent basis increased 4.1 percent year over year supported by robust core loan growth in commercial and credit cards and a second consecutive quarter of record consumer deposits. Fee income grew 6.9% year-over-year, reflecting improved payments performance and momentum across capital markets and investment services businesses. Capital markets performance was particularly strong as new product penetration with longstanding clients and favorable market volatility combined to drive strong revenue growth. We delivered positive operating leverage of 440 basis points in the quarter. Strong revenue growth and continued expense discipline improved our efficiency ratio by 260 basis points year over year. John will provide more details on our financial performance in his opening remarks. On slide four, we are spotlighting our business banking franchise. This segment contributes approximately 9% of our revenues and represents a compelling long-term opportunity for us. We have been building out new products and operational capabilities for this segment. We have also expanded our client teams to build deep multi-serve relationships that are served in branches with direct bankers and exceptional digital experiences. That approach has driven high single-digit compound annual growth in both clients and fees over the past two years. Looking ahead, we are investing in integrated solutions, collectively branded business essentials. These solutions offer banking, card, spend management, and merchant solutions that support small businesses at every stage of their life cycle. Our recently announced partnership with Amazon is significant in size and will meaningfully expand our small business reach. This partnership is unique from traditional co-brand card arrangements in anticipating a clear pathway to broader banking relationships over time. On slide five, we highlight strong momentum in California, where we increased our scale and density with our union bank acquisition at the end of 2022. As previously reported, we realized merger-related expense savings of approximately $1 billion and are now focused on capturing the considerable revenue synergies offered by this acquisition. The map on the left illustrates our strong positioning in markets with a high concentration of small businesses. California is a powerful growth engine for us and is outperforming the broader franchise across multiple key dimensions. Moving to slide 6, within payments, we continue to see fee revenue growth consistently strengthening across all segments. In our credit card business, new products aimed at affluent transactors, along with significant increases in marketing, have resulted in double-digit growth in account acquisitions over the past four quarters and a strong start to the year. Merchant processing fee growth remains steady in the mid-single digits, reflecting disciplined execution across three core strategies. Software-led products focus on five verticals and expanding direct distribution. And in corporate payments and prepaid, we are beginning to see growth rebound as spend levels normalize and installations of last year's strong business wins start to show through in results. I'll close on slide seven. In capital markets, our organic product expansion, as well as our pending BTIG acquisition, are expected to drive sustained revenue growth. In payments, the Amazon partnership will meaningfully accelerate credit card revenue growth by the end of the year and expand our banking opportunity with the small business segments in the future. And in our consumer franchise, we look forward to building Financial Edge, a program to better serve the needs of NFL athletes and their families and to build our brand nationally, both in partnership with the NFL. Let me now turn the call over to John.
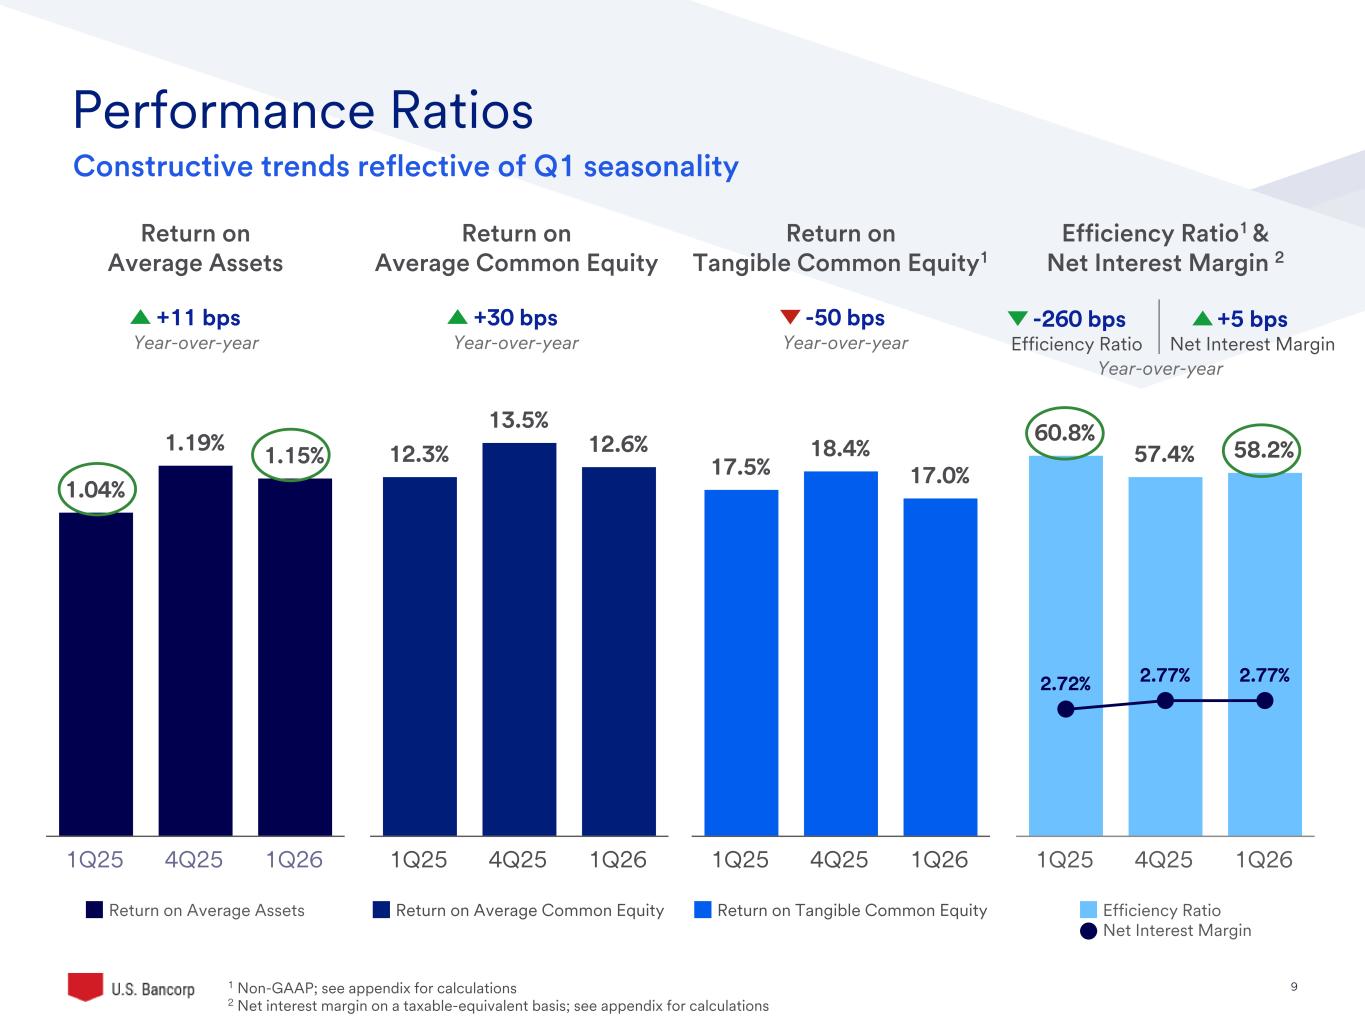
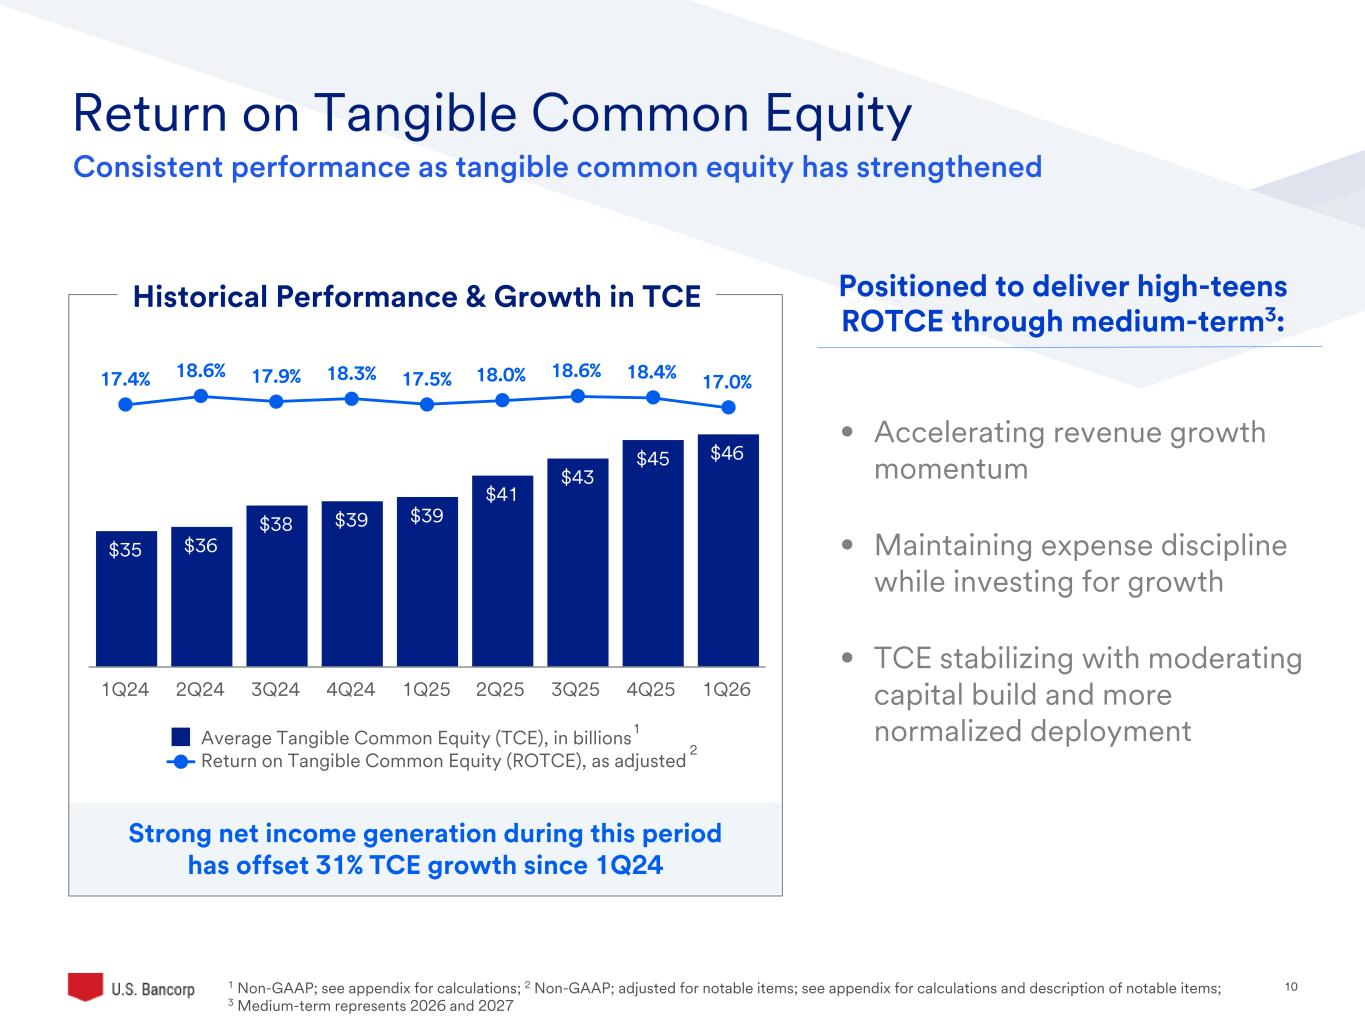
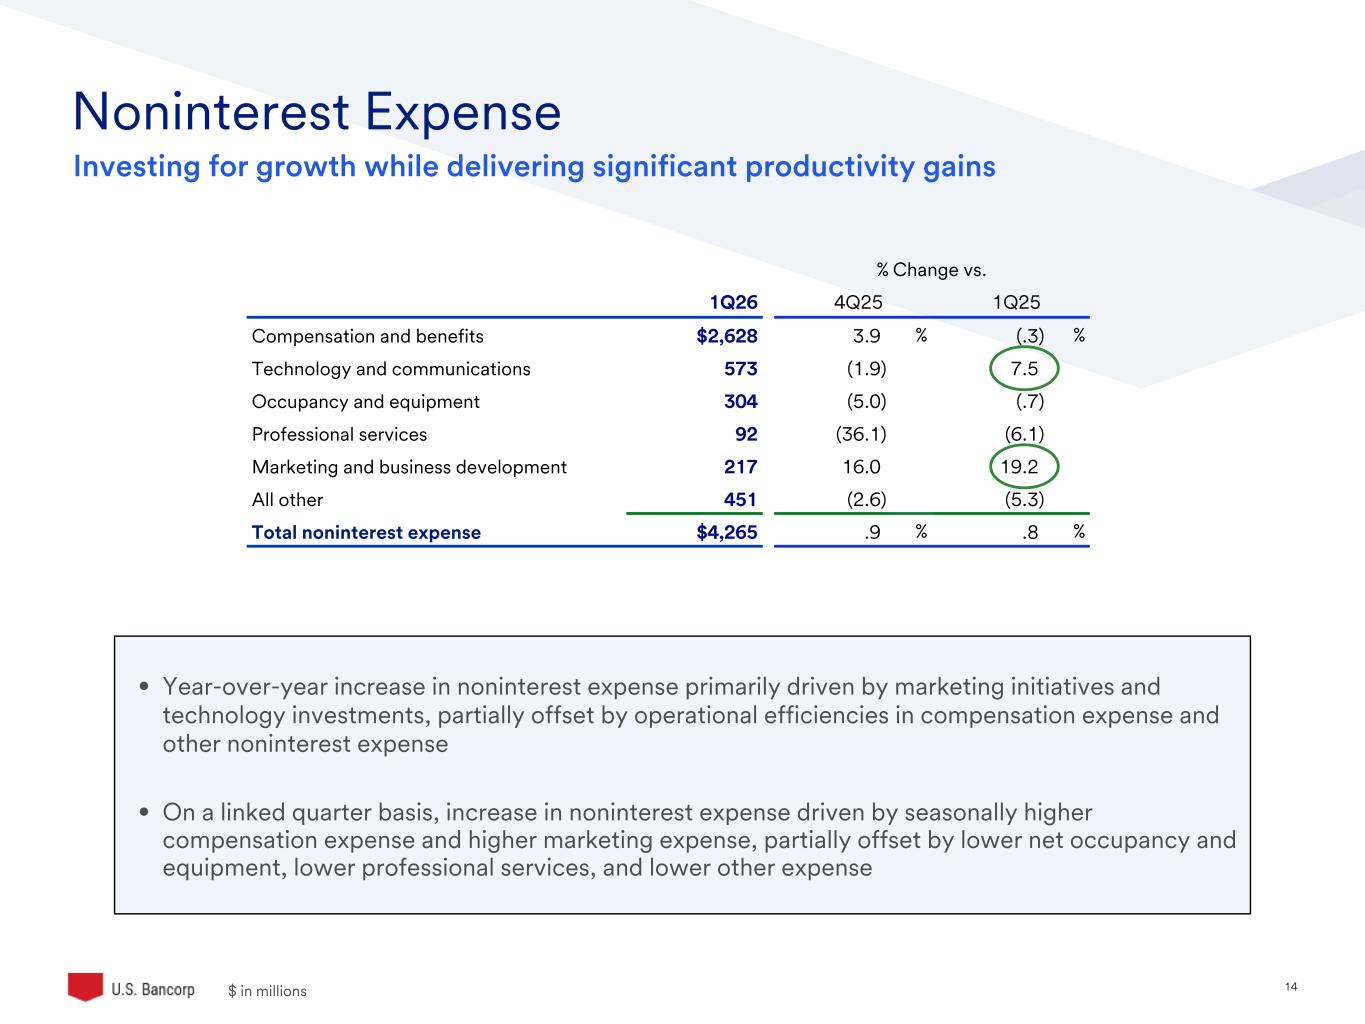
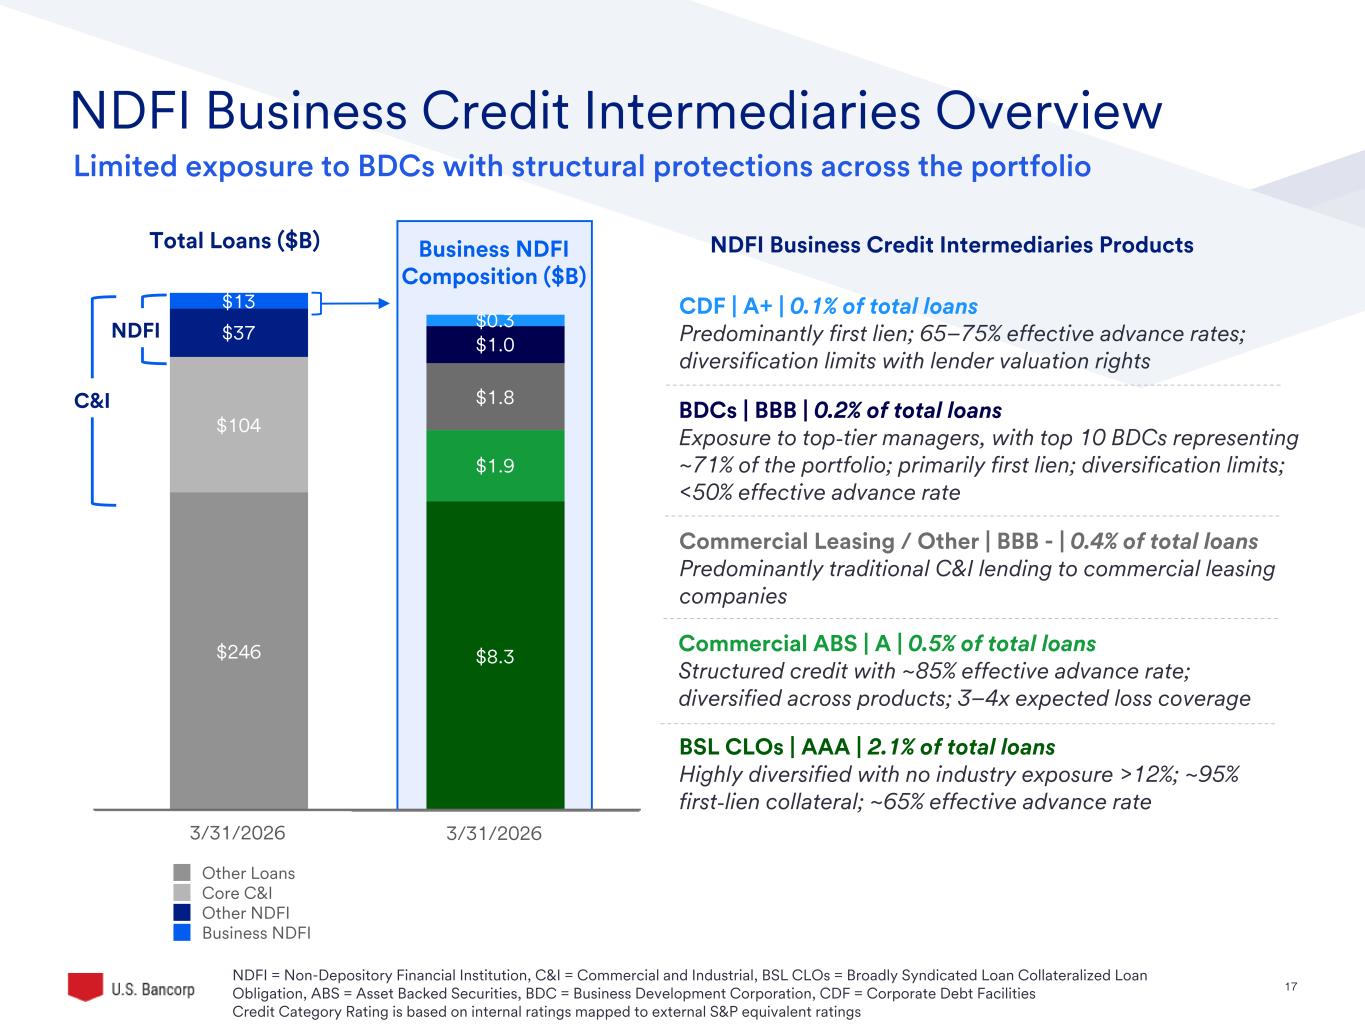
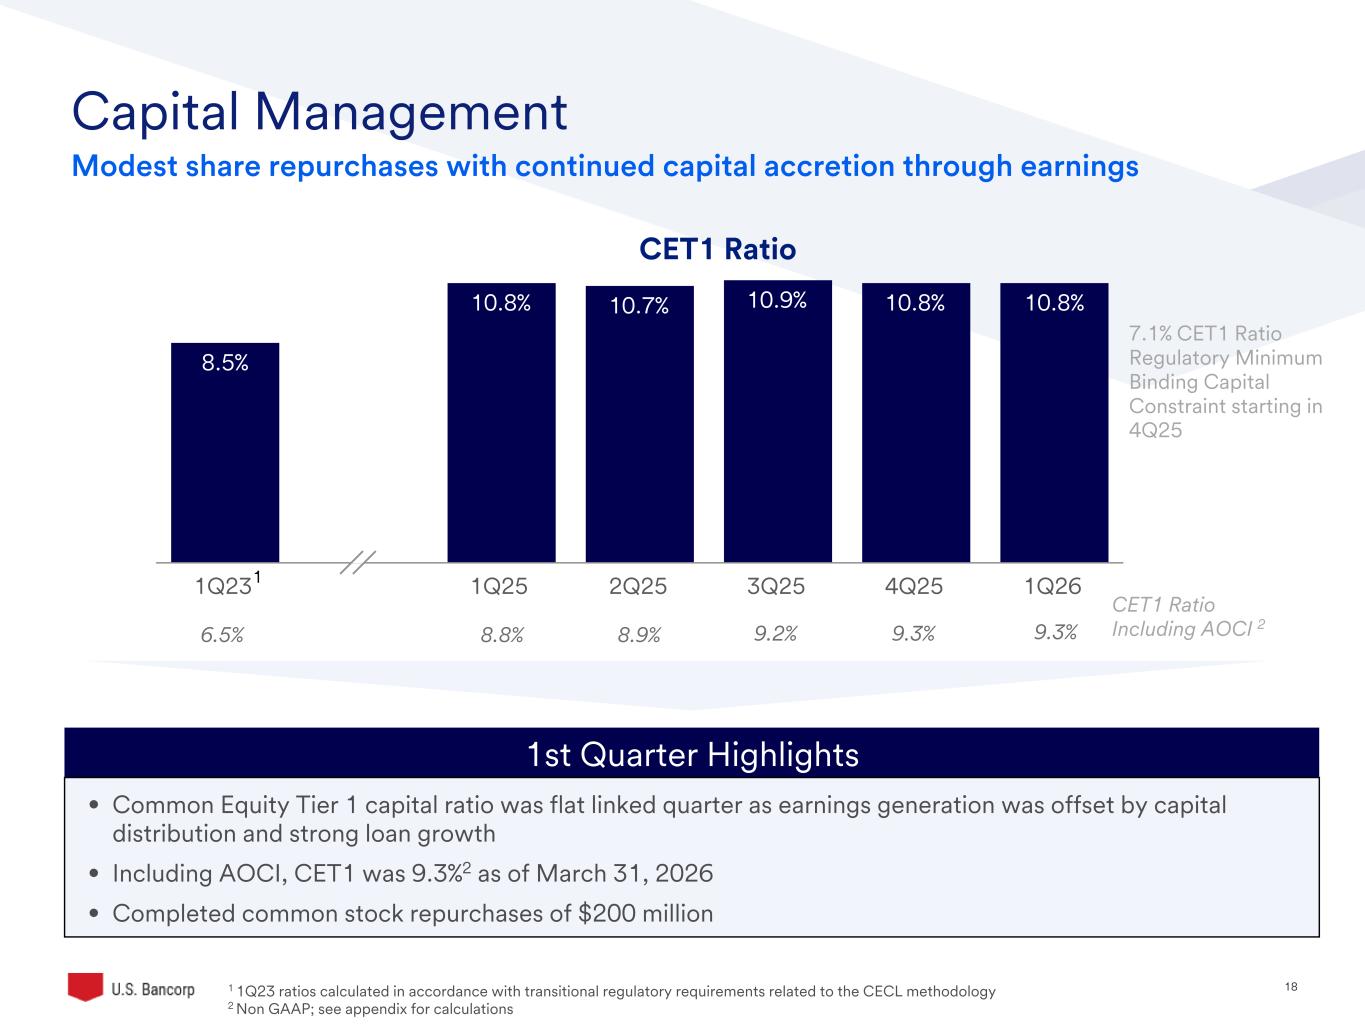
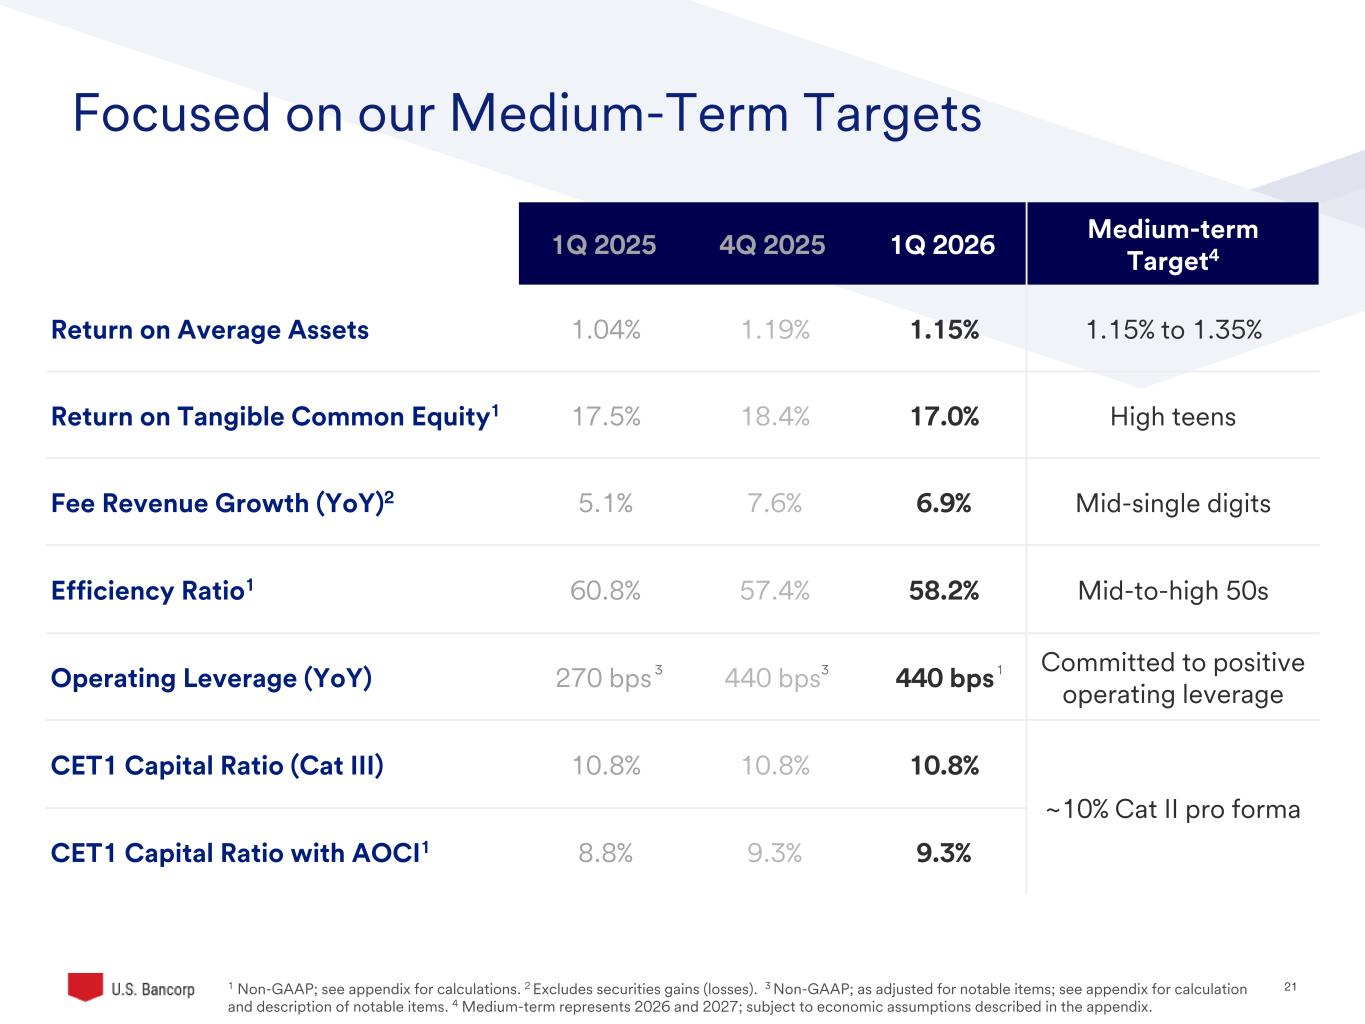
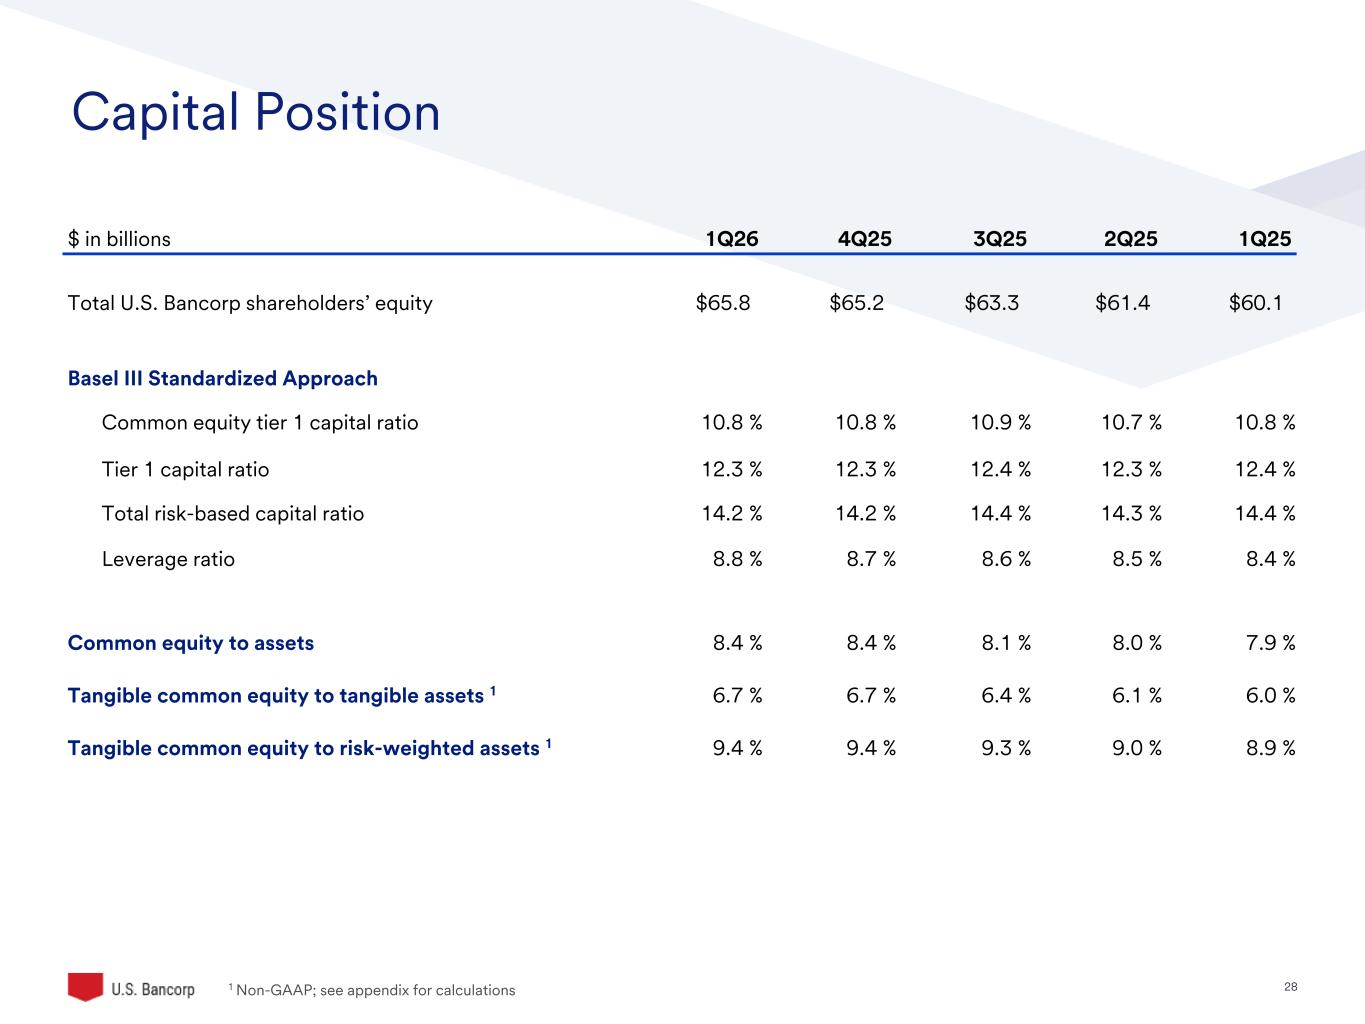
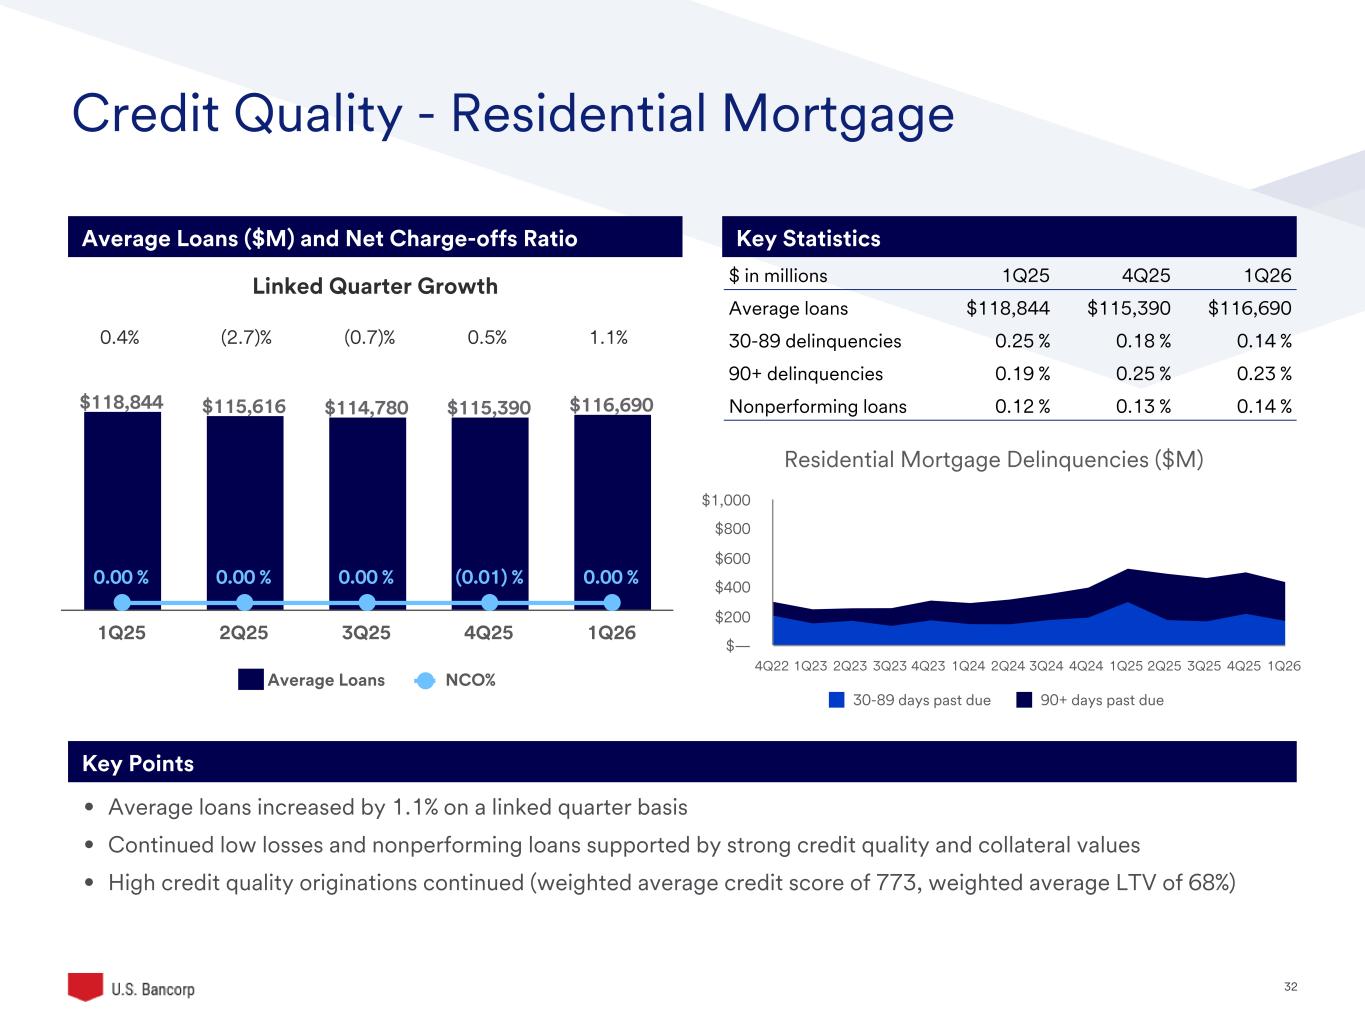
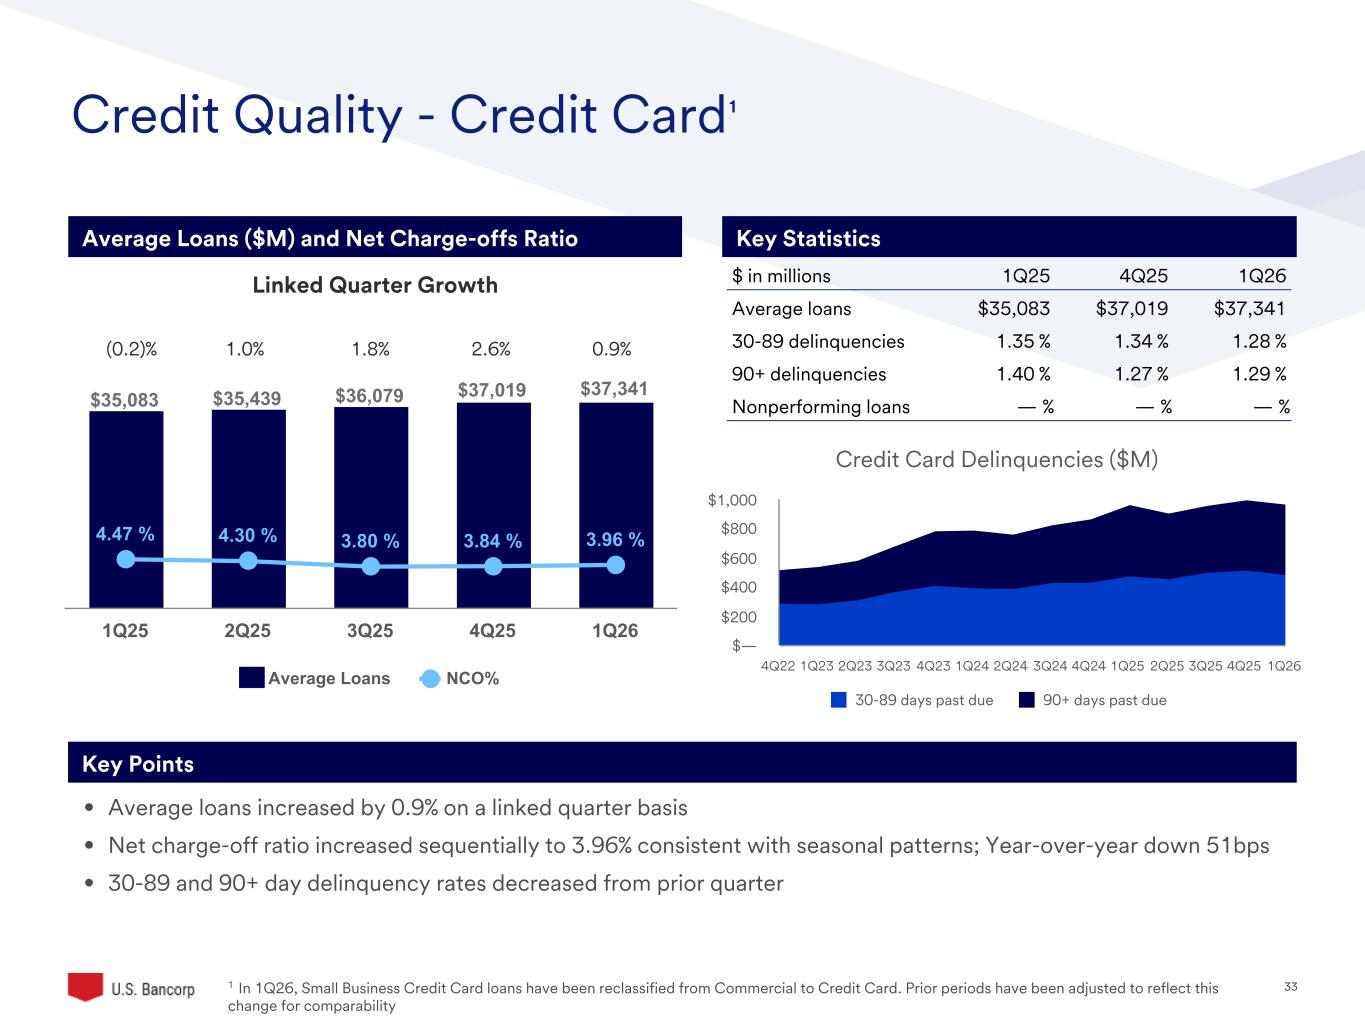
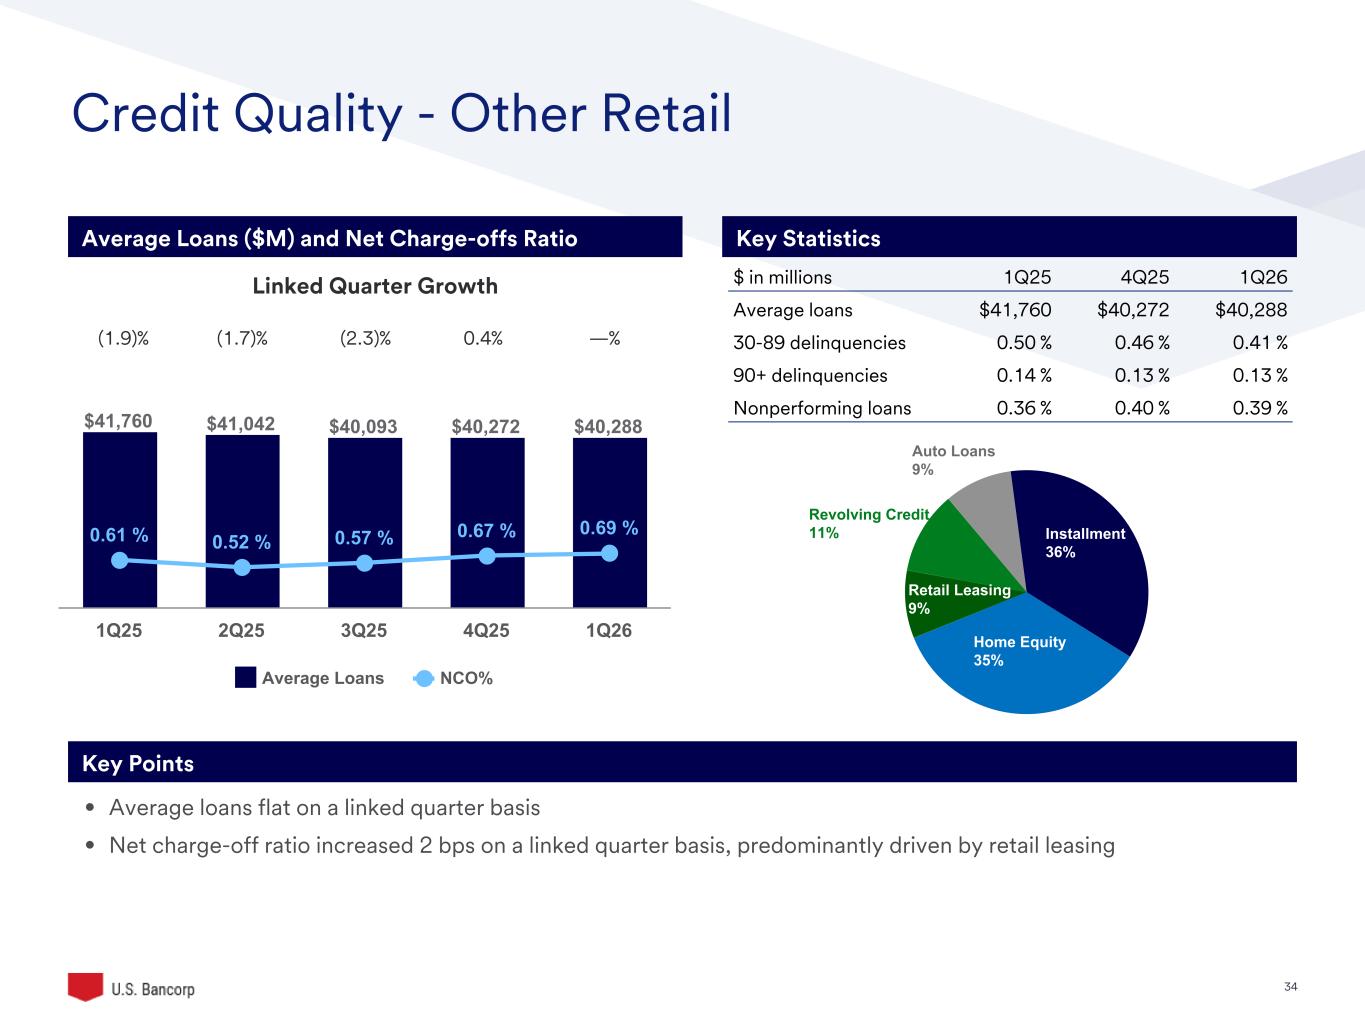
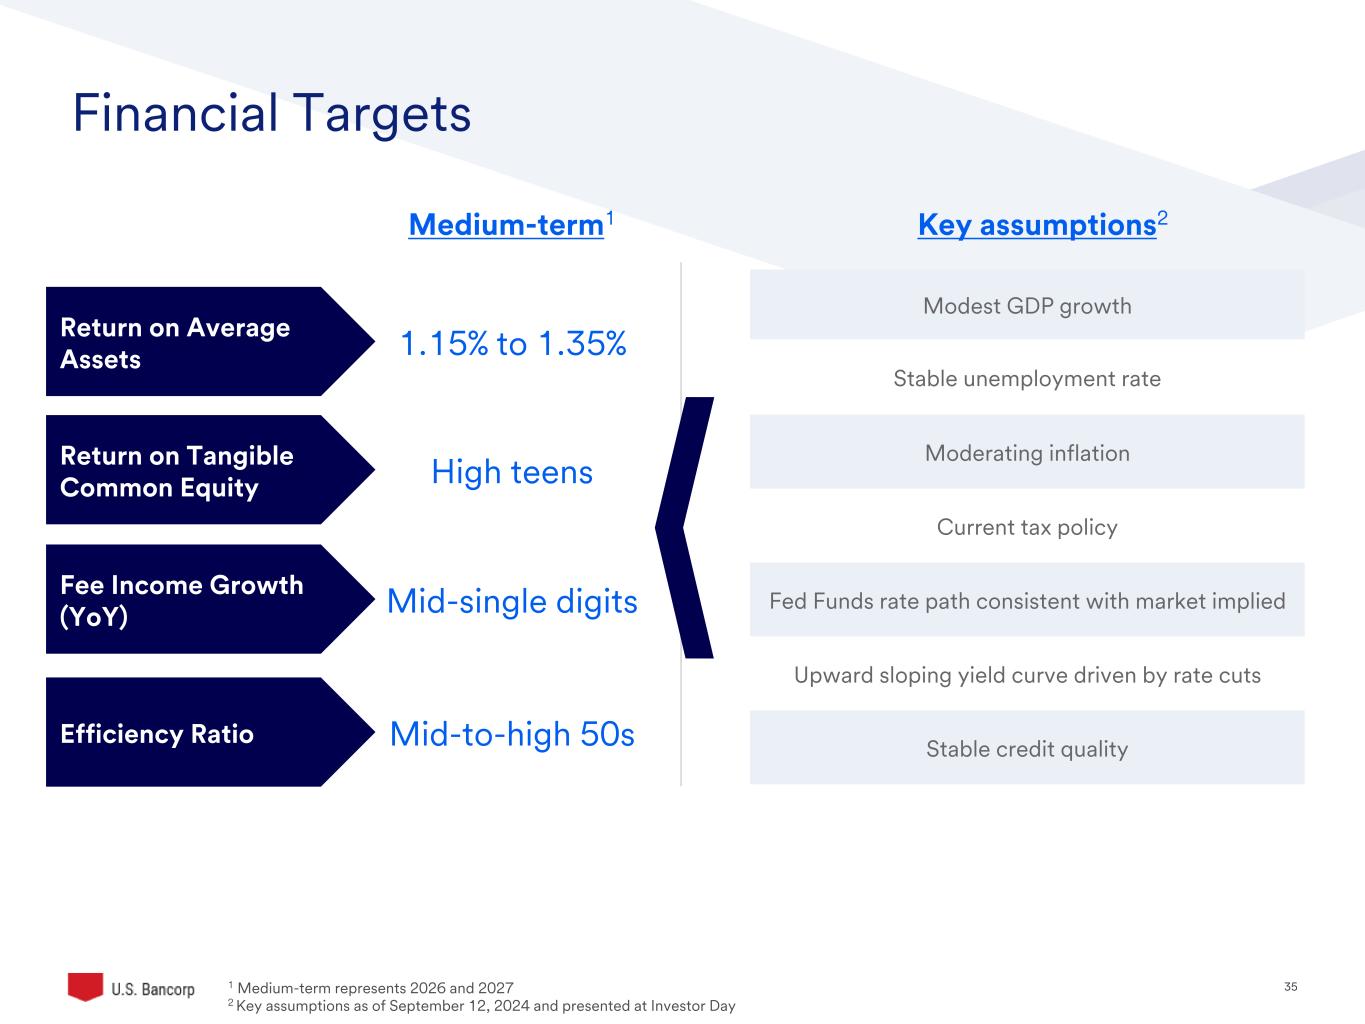
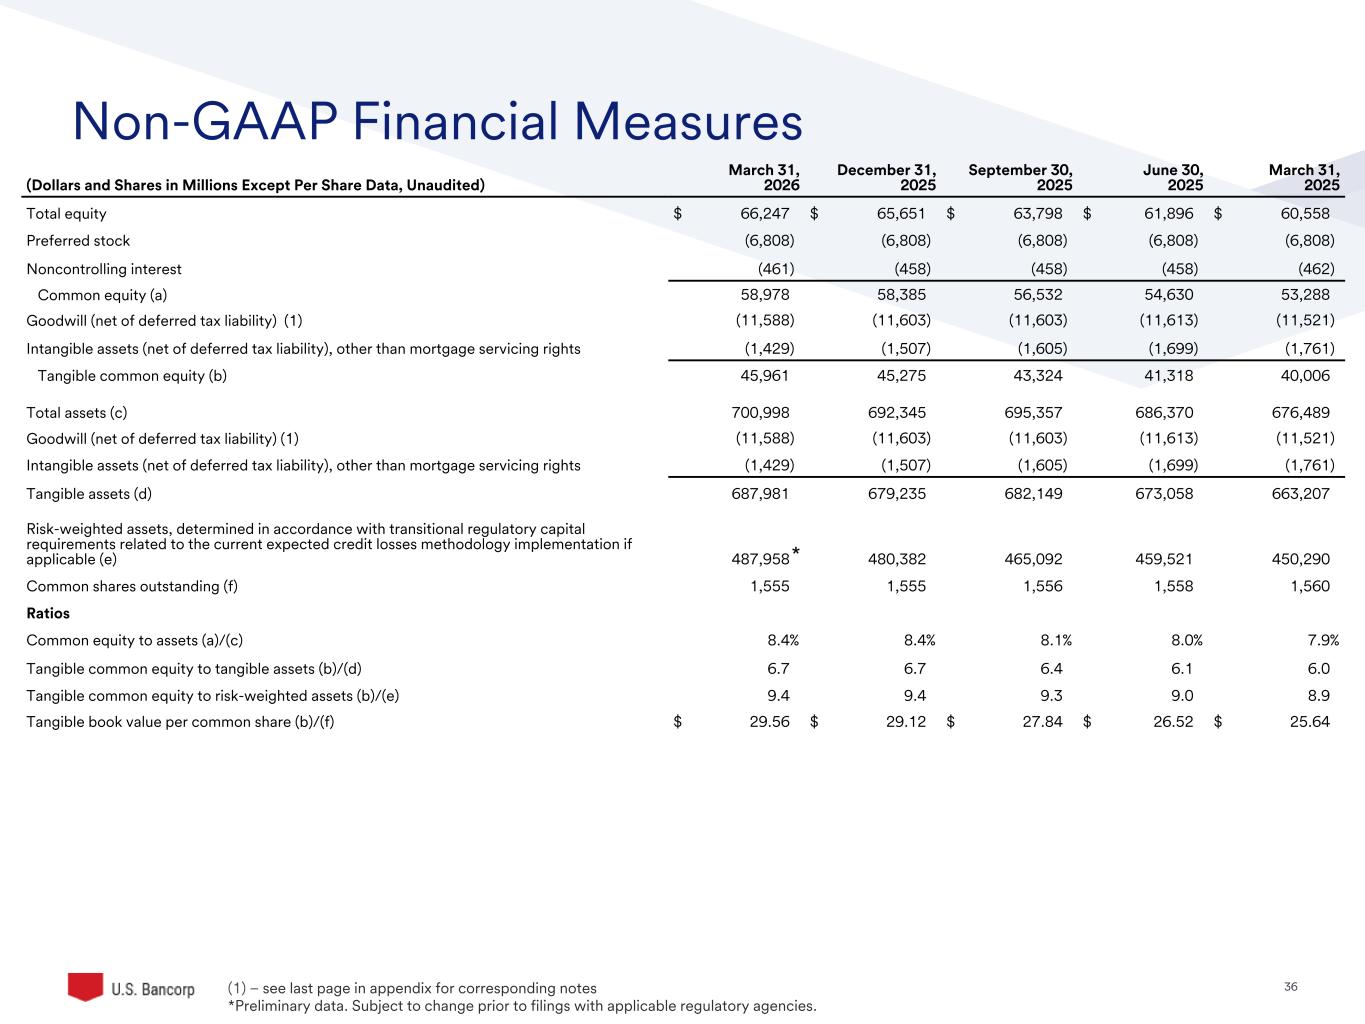
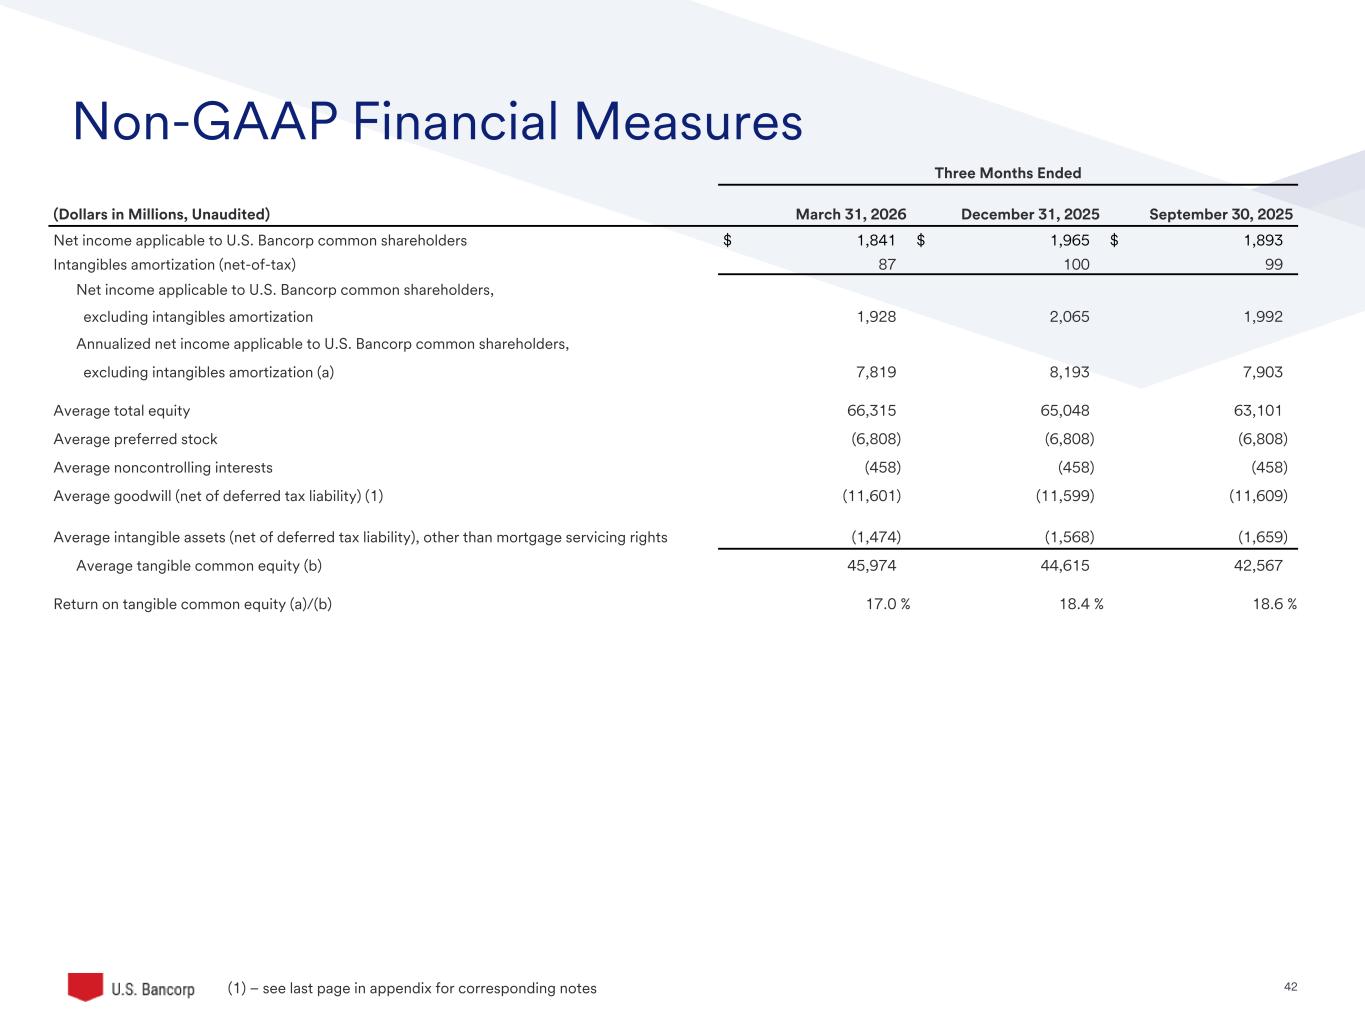
Thank you, Gunjan, and good morning, everyone. First quarter results showcased another quarter of strong business momentum and ongoing execution against our medium-term financial targets. If you turn to slide eight, I'll start with some highlights, followed by a discussion of trends for the first quarter. We reported earnings per common share of $1.18 and generated $7.3 billion of net revenue, representing 4.7% growth year over year. Improved revenue trends reflect strong loan growth in areas like C&I and credit cards along continued momentum in fee-generating businesses like capital markets, investment services, and payments. Average total assets increased 0.7% linked quarter to $688 billion, reflecting steady client activity across the franchise. For the first quarter, ending assets were $701 billion. As a reminder, the Category 2 transition requires four quarters of average assets to be $700 billion or more. As expected, credit quality metrics remain stable, underscoring the resilience of our clients in an uncertain operating environment. As of March 31st, our tangible book value per common share increased more than 15% on a year-over-year basis. Slide 9 provides our key performance metrics. We continue to operate comfortably within our medium-term targets for profitability and efficiency. Disciplined balance sheet management and strong returns drove a return on tangible common equity of 17%, while return on average assets was 1.15% this quarter. Net interest margin was flat-linked quarter at 2.77%, as core loan growth and stable deposit pricing were offset by elevated mortgage prepayments and somewhat tighter credit spreads. Turning to slide 10, over the last two years, we have increased our tangible common equity 31% while continuing to deliver high teens returns on tangible common equity given steady and improving earnings growth. The sequential step down this quarter reflects normal seasonality along with the impact of continued AOCI burndown rather than any change in the underlying earnings or profitability trajectory. As we look ahead, we remain confident in our ability to deliver high teens returns on tangible common equity. Slide 11 provides a balance sheet summary. Total average deposits were relatively flat on a linked quarter basis. As record consumer deposits were offset by typical seasonality in our wholesale and investment services businesses, improving our deposit mix. Our percentage of non-interest bearing to total average deposits remained stable at approximately 16%. Average loans totaled $394 billion, up 3.8% from the prior year, or 5.3% when adjusting for loan sales in the second quarter of 2025. The growth was broad based and centered around credit card, commercial, and commercial real estate. The ending balance on investment securities portfolio as of March 31st was $174 billion. Turning to slide 12, net interest income on a fully taxable equivalent basis totaled $4.3 billion, an increase of 4.1% on a year-over-year basis driven by a robust loan growth, funding optimization, and ongoing benefits from fixed asset repricing. Slide 13 highlights fee revenue trends within non-interest income. Total fee income increased 6.9% on a year-over-year basis, supported by nearly 30% growth in capital markets, nearly 10% for trust and institutional fees, and ongoing momentum across our payments business. As a reminder, our capital markets business is focused on fixed income, foreign exchange, and derivatives including our commodities business. Our pending BTIG acquisition adds equity and investment banking capabilities in the future. During the quarter, we also made updates to a select number of fee categories to better align our disclosure with how we manage the businesses. Prior results were restated for these classification changes with no effect on total fee revenue. Turning to slide 14, non-interest expense totaled approximately $4.3 billion, up 0.8% linked quarter. On a year-over-year basis, ongoing productivity and continued expense discipline helped us fund strong investments in technology and marketing. Slide 15 highlights our ability to effectively manage our expense base while driving top-line growth. Disciplined expense management has become foundational to how we operate, showcased by our seventh consecutive quarter of positive operating leverage. Looking ahead, we see opportunities to build on our strong operating leverage story, supported in part by the ongoing deployment of AI and other automation tools to improve efficiency. Slide 16 highlights our credit quality performance. Our ratio of non-performing assets to loans and other real estate was 0.38% as of March 31st an improvement of three basis points from the previous quarter and seven basis points from a year ago the first quarter net charge-off ratio was 0.56 percent increasing two basis points sequentially driven by the seasonal nature of credit cards while our allowance for credit losses of nearly eight billion dollars represented 2.0 percent of period and loans on slide 17 we're providing a closer look at our business credit exposure within the non-depository financial institution loan portfolio, given the increased attention on this segment. Business credit intermediaries represent approximately 3% of total ending loans, and these exposures are well-structured. Our risk framework includes meaningful over collateralization, clearly defined industry concentration limits, and first lien collateral. Importantly, this reflects U.S. Bank's longstanding approach to risk management and underpins our comfort with both business credit and the broader NDFI portfolio. Turning to slide 18, as of March 31st, our common equity tier one capital ratio was 10.8% or 9.3% including AOCI. On slide 19, we wanted to provide some initial thoughts following the updated Basel III proposals. We're encouraged by the initial proposals and expect to see meaningful RWA relief under both methodologies, particularly in areas like mortgage and investment-grade corporate lending, providing additional flexibility to support clients through disciplined balance sheet usage. While we await final outcomes around key elements such as the AOCI phase-in and the effective date of the new rules, the framework, as proposed, supports our return to historical capital deployment ranges under both scenarios. On slide 20, we provide a comparison of our first quarter results to our previous guidance. For the first quarter, net interest income, fee revenue, and non-interest expense all exceeded our previous guidance. I'll now provide forward-looking guidance for the second quarter in the full year, 2026. Starting with the second quarter, 2026 guidance, net interest income growth on a fully taxable equivalent basis is expected to be in the range of 6% to 7% compared to the second quarter of 2025. Total fee revenue growth is expected to be in the range of six to seven percent compared to the second quarter of 2025. We expect total non-interest expense growth of three to four percent compared to the second quarter of 2025. I'll now provide full year 2026 guidance which is consistent with our previous guidance. We expect total net revenue growth to be in the range of four to six percent compared to the prior year. We expect to deliver positive operating leverage of 200 basis points or more for the full year. Our guidance excludes the impact of the pending BTIG acquisition, which is expected to contribute approximately $200 million of fee revenue per quarter, with an anticipated close date in the back half of the second quarter. The impact of the Amazon small business card and the NFL partnership are fully contemplated in our guidance. Turning to slide 21, first quarter results represent another consecutive quarter of operating within all of our medium-term targets. While we are pleased with our continued momentum, our focus remains on delivering consistent, sustainable, and industry-leading returns over time. And we have a high degree of confidence in our ability to strengthen our performance and build on these results. Let me now hand it back to Gunjan for closing remarks.
Thank you, John. as we look ahead, the macroeconomic backdrop remains constructive, despite some softening of sentiment recently. Consumer spend, core loan demand, and credit delinquency trends all indicate relative stability. The regulatory backdrop is becoming more helpful, giving us greater capital flexibility over time, and our execution has strong momentum. All All of that gives us confidence in our ability to continue building earnings power and creating long-term value as we move forward. With that, we will now open the call for your questions.
Operator
At this time, as a reminder, if you would like to ask a question, press star then the number one on your telephone keypad. We'll pause for just a moment to compile the Q&A roster. And our first question will come from the line of Scott Seepers with Piper Sandler. Please go ahead.
Good morning, everyone. Thanks for taking the question. John, I wanted to ask about positive operating leverage. You kept the 200-plus basis points target for the year, although you're doing significantly more than that now. It looks like you'll be about 300 basis points in the second quarter. Maybe I was hoping you could discuss how you're thinking about it. Would you sort of manage to that level or maybe let some incremental revenues drop to the bottom line if they came in better? I guess the or more leaves a lot to the imagination. So just curious on your thoughts.
Sure. Thanks, Scott. I appreciate that. Yeah, no, we feel good about the outlook, as we mentioned in our guidance slide. We have a lot of growth opportunities, as we talked about. As we've mentioned in the past couple of quarters now, as we think about 2026, we're really thinking about our revenues growing faster, and that being the driver of positive operating leverage. and we have a desire really to invest some of the savings that we have into things like technology and marketing, some of the things that we've talked about in the past. And, you know, it also kind of depends on the nature of the revenues. You know, if fee revenues grow faster, as an example, you know, that's going to bring with it more expense, you know, just by the nature of the compensation and things like that. And then interest income, of course, we welcome that as well. So from an operating leverage standpoint, we have a lot of flexibility and we feel good about our outlook.
Okay, thank you very much. And then maybe Gunjan or John, you know, really good commercial loan growth. Maybe if you could touch on sort of what you're seeing in terms of utilization rates, and then Gunjan, you touched on customer sentiment a bit toward the end of the prepared remarks, but maybe just some thoughts on what you're seeing there. Maybe if you could expand upon that a bit.
Yeah, no, absolutely, Scott. I'll start. The commercial loan side, we saw broad-based, good core loan growth, really across a number of different sectors. On the large corporate side, food and beverage, energy, health care, we're probably the top ones in our area. M&A for these customers, as well as just general CapEx, really starting to kind of see its way through. Small business also continues to be a very strong performer for us, and that we expect that all to continue. You know, we've talked about loan growth to being in kind of 3% to 4%, but I certainly think it's going to be higher than that. It's probably more in a mid-single-digit range from a broader loan growth perspective for the full year. So I think there's just a lot of momentum. And in terms of utilization rate, you know, we're at 25% or so, a little bit north of 25%. That's probably a good level for it. It's been creeping up a bit. I don't think there's a lot more upside from that standpoint, but just in general, core loan growth has been really strong.
Good morning, Scott. What I'll add on sentiment is it's turning to more core demand, which we find to be very healthy. So if you compare this time last year when the tariff discussion was very present, And the demand we saw last year was very focused on the AI trade data centers, some M&A-driven trades, but a real pause pending some resolution or clarity around tariffs. What we see with loan pipelines going forward, which are quite robust, is people beginning to invest in kind of core middle market expansion and CapEx. So the sentiment has stabilized quite nicely.
Perfect. All right. That's great. Thank you both for the color.
Operator
Our next question will come from the line of John Pencari with Evercore ISI. Please go ahead.
Morning. And then just on the funding and the margin side, I appreciate your loan growth commentary in terms of what you're seeing. What does that imply in terms of how we should think about the pace of deposit growth? And what are you seeing on the deposit pricing side? We've got a number of even the larger banks that are flagging some, you know, pressure still in the deposit pricing side from a competitive dynamic. And then lastly, how should we think about the progression of your margin here as you look out through 26?
Yeah, a couple things there, John. You know, on the funding side of things, the deposit equation, you know, we're seeing, you know, it's a competitive market, right? It's always been that way on the deposit side. But we saw, relatively speaking, price stability really within across the portfolios that we have. Maybe just as a reminder, our focus is really going to be and has been on growing consumer deposits. Again, we saw another record level on the consumer deposit side, and we've seen a $7 billion increase year-on-year, nearly 3% growth. We've seen a focus for us on operational deposits on the wholesale side, really utilizing deposits that can help us along with the broader relationship and leverages into fees and things of that variety. So that has been where our focus has been on the deposit side, and we've been able to just navigate, you know, the deposit environment as we typically do. On the margin side of the equation, you know, just as a reminder, I mentioned the margin was flat this quarter, and we gave some color that, you know, The positive drivers were really good core loan growth, as we talked about, and then the pricing characteristics I just mentioned on the deposit side. On the other end of that, though, there was some of the loans we brought on were at tighter spreads, still good returning, but these are larger institutions that trade at tighter spreads, and so that was a little bit of a way, as well as the impact of some refinancings on the mortgage side as rates. You know, we had more refinance activity, nearly 15% to 20% more than we did prior years. So those were kind of the puts and takes. Going forward, I expect that the mortgage stuff will abate and the other things to stick, meaning the good core loan growth, the deposit pricing stability, our earning asset mix, all improving as we think about the future. So we continue to see progression in our net interest margin going forward.
Okay, great. Thanks, John. And then just separately on the capital front, if we can maybe just talk a little bit about capital allocation priorities, how you're thinking about the buyback expectation. And then as you look at inorganic opportunities, you've done the BTIG deal. Should we expect that there'll be a more active effort to continue to build out the capital markets business, potentially inorganic? And then, of course, Gunjin, I got to throw the whole bank M&A question at you as well. Sorry to ask it this early in the call.
Sure. Maybe I'll start on the priorities of capital deployment. Really no change to our thinking here, John. I think from a capital deployment, we really focus our client and loan growth. And we certainly saw that this quarter. We're going to support our clients as needed. And then we're going to focus on the capital deployment to our shareholders. Certainly the dividend is extremely important. And then the buybacks, as you know, we went from $100 million to $200 million this quarter. I would anticipate we're going to continue to glide up. I think we're going to start at $200 million would be my base case, but because we see such strength in the pipelines, but it could increase from there, or that would be our intention. We're certainly going to glide up, again, as we get to our capital levels that we need to get to.
Thank you, John. I do want to just reiterate that we are very committed to a long-term capital distribution targets of 70 to 75 percent, and we are keen to get back to those levels with shared repurchases. And we are very close, John, to just stabilizing our capital ratios in a Category 2 framework, and of course very encouraged by the capital rules that might accelerate that. So that's the backdrop. On our bolt-on acquisition strategy, we are constantly looking at properties. They are usually not as big as the acquisition we did with BTIG. It would be unusual for us to think about another bolt-on in the capital markets world because we are focused on closing the BTIG deal and getting synergies out of that. But we stay open to that. Those tend to be quite accretive immediately. They're small deals that give you local scale in a particular product to fill a gap. On your broader M&A question, nothing has changed about our strategy. We are very excited about the organic growth opportunities we have in front of us and the momentum we have. So that is our focus.
Operator
Our next question will come from the line of John McDonald with Truist Securities. Please go ahead.
Hi, good morning. Thank you. John, maybe just to follow up on your net interest margin comment, just to clarify, you do expect the margin to continue expanding and maybe expand in second quarter and move steadily upward, and are you still on a path to that 3% sometime next year?
Yeah, John, thanks. Yeah, we certainly still see a path to that 3%. You know, The margin is not always linear, and I gave kind of the reasons why this quarter, the pluses and minuses, of course. I mean, if I think about just the underlying metrics, just to repeat, we feel like in terms of loan growth is a good indicator and that will help in terms of the earning asset mix of how we think about the loan growth driving, the balance sheet sizing. You know, the deposits are stabilizing, as I mentioned, and then just our asset mix is improving. You know, if I think about just, you know, the small business Amazon acquisition that will come on in the third quarter as an example. So it's things like that that are going to be – that we will continue to focus on that should help drive the net interest margin go forward.
And that 3% target, is that still a good target for next year timeframe? Yeah, we certainly feel there's a path. in 2027 uh to get to that level and then just maybe broader your thoughts on the the revenue growth um guidance for this year with the loan growth now looking a bit better and you know fees starting off strong in the in the first quarter uh is it fair to say you're starting off the year feeling like the higher end of that four to six uh range is achievable maybe just some thoughts on you know what are the big swing factors for the low end versus the high end of that four to six?
Yeah, no, good question. You know, we certainly have good momentum on a number of different areas in the fee categories. We've listed out capital markets have been extremely strong for us. You see that growth. Payments is, you know, we're starting to, we've been making a clearer inflection there, and things like the corporate payments, you know, after the second quarter are going to, the drag of government spending from last year, that's going to fall away and we have good pipelines in that area and our institutional businesses are doing extremely well so I would expect yes will my bias certainly is to be on the higher end of that four to six percent range on the fee on the fee revenue side of the equation and I was thinking also on the total revenue guidance is also the four to six and the total yeah total revenues four to six we feel like that's the right that's the right level for us to be at this particular juncture.
And John, on NII, you know, we're very, we're feeling optimistic about the volume demand for loans and the deposits have stabilized. Is this the Iran war? It has a level of uncertainty around monetary policy and rate path that does impact the resi mortgage book and credit spreads.
So we are staying with the four to six percent on the NII just because there's quite a quite a heightened level of uncertainty around the rate path okay thank you our next question will come from the line of Ibrahim Poonawalla with Bank of America please go ahead hey good morning all right so I had two questions one I think on the regulatory stuff or the regulatory changes just talk to us because I think given you obviously slightly cross 700 billion dollars this quarter we have heard tailoring is front burner agenda for the for the Fed over the summer if category two moves to I don't know nine hundred billion dollars billion dollars in assets what does that mean for you strategically capital allocation wise does it change anything does it not change anything would love your perspective there yeah sure Ibrahim Thank you.
I think, you know, from a Category 2, you know, certainly we're watching to see what the rules are and how those come up. Right now, we have to focus on just kind of what the rule set is, so we are focusing on our Category 2 level. Of course, you know, with the regulatory changes, we put the slide in on the two different proposals in terms of standardized and expanded versions. both of those are better than the Category 2 regime. So that's going to be more of a help for us. And in the end, it's just going to give us more flexibility. So those are going to be kind of the helpful nature of the capital areas.
Ibrahim, the big variable is timing of when the rules, either indexing and tailoring or even the proposed BASIL-3 rules are effective. So to the extent that the indexing is forward-looking, it doesn't make a difference. If the proposed rules get implemented sooner than we think, then we are in a good shape. But either which way, we are very prepared for Category 2 with full AOCI in our capital. That's what we are counting on, and we are very proximate to that. So it's not a meaningful change to anything we would anticipate doing with capital distributions.
Got it clear. And then on your slide five and seven, I'm just going to size the idiosyncratic growth opportunity for USB. And slide five, California, super competitive. You have a Canadian bank that's also trying to gain share in California. And then on slide seven, where you lay out Amazon, NFL, like I'm not sure if that's going to be a needle mover or it's a good logo to have. If it's possible to frame what the actual opportunity could be on both those as we think about the P&L over the next year or two, I think that would be extremely helpful. Thank you.
Yes, thank you. These are quite needle moving. So, John, why don't you give some color on that and I'll add on.
Yeah, so on the Amazon side of the equation, we expect that to be coming online in the third quarter. You know, the loan amount is It's going to be about $1.6 billion area is likely the area, and it's going to be about 70,000 co-brand clients. You know, it's probably going to add in the neighborhood of $75 to $85 million per quarter. A majority of that is going to be on the net interest income side of the equation. Again, this is all taken into our guidance, of course, as I mentioned on our prepared remarks. But, you know, we're going to expect to see that in the third quarter, and we'll take a reserve with that at the appropriate time. And it's about kind of the same level that our card book represents.
And I'll add on California, yes, it is competitive, as are any other regions that have a big opportunity. But it's a very, very big market, too. And we are becoming very significant as a player there. And we are seeing the growth be higher than the rest of our franchise. I'll say a word about what is the significance of the new co-brand relationships we are doing. We built our digital platform to nationally serve co-brand card clients with banking services for the first time with State Farm. We improved that platform with Edward Jones, and it's unique in the market today. And it's very attractive to partners because you can provide a full range of service to your clients under sort of your user experience. The Amazon deal allows us to take that platform and then expand it to the small business side, at which point it becomes a very big asset to attract big co-brand mandates. So that's a lot of revenue. We have 1.4 million small businesses today. These are banking clients. And the Amazon deal will bring 700,000 new small businesses to the co-brand side with the opportunity to attract them to the business side. So it's a pathway to a very different type of growth that doesn't need to come with sort of deposit pricing erosion or any of the usual ways banks grow their business. So we are very excited about these possibilities.
And if I may follow up just, Gunjan, on the State Farm and the Edward Jones, because it is idiosyncratic what you're doing there. Is the view that you can actually grow cards or grow rev fees in markets where you obviously don't have an on-the-ground presence, or is the success determined by converting that state-farm client into a core USB client? What determines success?
We think of it as an attractive value proposition for core brand relationships, first and foremost. That's the easiest value proposition to the partner because they like to provide the banking services. We think it's a good front-edge brand build with the local client base on the ground. It does not, you know, compete in size with what the deposit gathering machine of a bank generally is. But the results show up here in a very unique way to go to market on our card business, on attracting new clients for, you know, for a bank of our size. That's the fifth largest bank, and we're very, very well-known within our own franchises, but trying in a very disciplined way to build our brand out outside of our franchise. And that's what the NFL deal is about, too. So it is an idiosyncratic approach. It has been very economically lucrative for us, and because the platform is now built and now we're going to expand it to small business, it also supports our own product sets, like the BankSmartly products that is attracting very meaningful level of deposits along with the card loyalty programs. Got it. Thank you both. Yeah, thank you.
Operator
Our next question will come from the line of Mike Mayo with Wells Fargo Securities. Please go ahead.
Hi. You certainly have come a long way with your CET1 when you highlight over the last three years going from 6% to 9%, so the days of are you going to be issuing caps are long behind you. But still, when you look back over time, the positive operating leverage is something relatively new. It's not the U.S. Bancorp of old in terms of the efficiency ratio. And John, you mentioned this is the second quarter in a row of a positive operating leverage. Is this something that you're going to kind of track quarter to quarter to quarter and then on the other side of that I'll contradict myself a little bit here I think everybody wants to make sure you're investing for that growth and you've highlighted all sorts of growth initiatives from partners to California to small business middle market to payments if you were simply to highlight your three priority areas for investing for growth what would those be but first the operating leverage if you would. Thank you.
You bet. Thanks, Mike. Yeah, we've had seven quarters in a row of positive operating leverage, which we are very proud of, and we are very much committed to positive operating leverage. We are tracking that. We will continue to track that. We're going in with a mindset this year. Well, last year was more driven by expense management and finding savings within the company to become more efficient. We continue to do that, but what we're doing now is we're taking those savings and investing in some of these projects that we were talking about, and Gunjan will highlight some of the priorities here in a moment. But things like the small business area, more of the marketing, more of the technology builds and all that sort of thing are really what we are very much focused on. But we are very much committed to positive operating leverage and having it more driven by revenue growth here as we look into 2026.
Thank you, John. Mike, what I'd add is last year we were very focused on expense management and fee growth. Both of those were natural extensions of last five years of very heavy investments digitally into a really world-class product set, and the product set is very good, And it came with some sacrifice of efficiency ratio in the past. And going forward, our business mix is very, very helpful to delivering consistent, positive operating leverage. And I want to just reiterate that we are very committed to sustaining that over time. The priorities in terms of growth are very simply to continue to grow out our fee categories. We want to always be known as very heavy in fee mix, driving heavy returns for us as a bank. Our second real focus is to strengthen our consumer and small business franchise. And all of the examples that we are sharing here are towards that goal, so that the consumer franchise and the core funding mix continues to strengthen over time. And we do want to go back to our DNA of being a very simplified, streamlined cost structure, which we think we can do. In the past, it was very much around the automations, and going forward, we are very focused on what AI can do it. So that's the priorities. these fee growth, strengthen the consumer franchise, and go down the journey of becoming an AI-native organization.
All right. That's clear. And then just one follow-up. You're saying you have credit card customer growth of 10 percent, but you've only had fee growth of 5 percent. So does that imply you expect much better fee growth ahead, or it doesn't work that way?
No, it does work that way. There is a leading gap between acquisitions and when revenue shows up, and that's just the reward structure and the upfront rewards of transitioning the book. So if you see what we have done really over the last six quarters is elevated our marketing and acquisition spend, and we track that very closely across the two big types of segments, the balance revolvers and the transactors. We've always been quite strong on the balance side. If you look at our ANR, it has consistently exceeded HA data, but it was the fee side, the transactive side, that we really accelerated acquisitions. Faster acquisitions are actually negative revenue on the core revenue pipeline. So you see this measured balance between acquiring new clients and it showing up in revenue. And so you see the acquisition numbers be much stronger, and they will lead to stronger, strengthening revenue growth about four to six quarters out.
That's helpful. Thank you.
Operator
Our next question comes from the line of Erica Najarian with UBS. Please go ahead.
Hi. Thank you so much. Just a few follow-up questions for me, please. Just on the forward look for deposit costs, if the Fed doesn't cut John, do you think US Bank can hold the line on you know deposit costs and you know to that end some investors were asking for clarity on your response to John's question just want to make sure we were taking away the right thing in that fee revenue you're confident you could be at the high end of the guide but you're keeping your ranges for both net interest income and total revenue because while loan growth is strong, the rate curve has a little bit more volatility in terms of the forward look.
Yeah, so thanks, Erica. So on your first question on the deposit side of the equation, yes, I think the short answer is yes. I think we've seen stabilization in our deposit mix. We are ultra-focused on the priorities that I just mentioned in terms of consumer deposit growth, as well as on the wholesale side of the equation. You know, what we've been doing, maybe just to add a little bit more color, is we have been doing a lot of work to reduce, and you'll see this in our numbers, CDs and, you know, higher cost institutional type deposits and things like that that have less value, maybe are one more one-off type transaction as opposed to multi-serve. So that's really where our focus is on the deposit side. So we do see that. Just to repeat what we've said, our bias is really on the high end of the range for fees. Just given the momentum we're seeing in all those categories, and we have that visibility because you can see the pipelines of the businesses that are coming online. You can see in all the different categories that I just talked about, including payments, including institutional services, and then capital markets just has been continuing to be robust. On the net interest income side, just to, you know, we continue to expect mid-single-digit growth in that area, and that's a reflection of just the uncertainty in the marketplace right now. There's a lot of puts and takes that are occurring, and so while we have deposit stabilization, while we have good core loan growth, those are all good things. Some things are coming on tighter spreads, and the interest rate environment is uncertain, and we just are taking that into consideration here.
Got it. and and the second question is just a follow-up on the capital discussion um you know so you know under the current rules obviously in theory you'll be crossing cat two at some point next year um if you do elect um to be um erba or enhanced risk-based approach um is your understanding that But is the five-year phase-in going to be the overarching sort of guide? Or does the AOCI cliff once you cross over? Or to Gunjan's earlier point, does it matter very little because of the timing issue and your AOCI would burn down by the time that's valid anyway?
Yeah, it's a good question, Erica. It's one we actually have for the regulators in terms of just clarification of it. you know, we're unique in that we have proximity to Category 2, so there is a little bit of a timing collision between the Category 2 timing of when we come online, which is we expect that would to be under current rules sometime in 2027, the effective date of ERBA, and when does that occur, and then, of course, Ibrahim, I believe, had the comment about, you know, is there some rules that will change on the index. So a lot of things are moving. What I will tell you is that we're preparing for a CAT 2 world. That is what we have been ensuring that we will be in compliance with. We have the capability to go to standardized or ERBA.
Technologically, that's very simple for us to to execute and uh you know i i think overall we will just uh have we'll monitor and we'll update you as we go but we're we feel prepared and we have a lot of we feel like we have a lot of flexibility now with the capital rules and and how that will go how ultimately will play out yeah and just a quick follow-up question in terms of what gunjin's saying in with regards to optimizing the payout does the timing of the clarification um you know um impact sort of the path to optimization, or does that really have to do with sort of the RWA demands from stronger loan growth in terms of timing of capital payout optimization?
Erica, I would say that we believe the regulators' intent is to allow all banks five-year phase-in on AOCI to take the cliff effects away, but we are waiting for that clarification a very good outcome from a capital distribution site for us will be let's say a very prompt date to have the current proposals of BASIL 3 be effective and for us to get a five-year phase-in period in which case we'll be well ahead of our capital needs even as a cat 2 and we will bring forward the capital distributions we are thinking here one or two quarter changes so that's why i say it's not that material to our strategy or our timing but it can move by one or two quarters in terms of how quickly we step up thank you so much for acknowledging me the extra question thank you sure our next question comes from the line of ken houston with autonomous research please go ahead Thank you.
Good morning. Just one question on the expense side. You did a great job holding the line as you'd expected to on year-over-year growth in first. And we can see in the second quarter guide that it's as expected, you know, moving higher. Just wondering, you know, first and second quarter costs last year were actually down. So, understanding the year-over-year growth goes up a little bit. But kind of tied to the prior points about operating leverage and magnitude, you know, if we get back into this 3% to 4% growth, is that how we kind of think about it as we just move forward on a regular basis, that the investment that you're making kind of and revenue-related leads you to, you know, that decently higher expense growth rate than what we had seen in the first quarter, which I don't think people thought was going to be the baseline?
Thanks. Yeah. Thank you, Ken. Yeah, I appreciate that, because, you know, right, we've been operating at pretty much a flat expense base for several quarters now. I think it's 10 or something like that. And here we are stepping that up, and I'll tie it back to some of the answers we've been given on positive operating leverage. We're very much committed to positive operating leverage, but we want it to be driven by revenue. And so to the extent that revenue is at the levels that we are forecasting, for example, here in the second quarter of that 6% to 7% area, then that calls for expenses to be elevated and higher so that we can invest more into the business. Certainly, if the revenues don't materialize, we have levers to move that down. And I think you can tell from our actions over the past two to three years plus, maybe decades, that we have the ability to manage expenses and have the different levers to do so. So we have a lot of confidence in our ability to achieve positive operating leverage.
Thank you, John. I'll add, Ken, you can be confident in our degrees of freedom around expenses. We have quite a lot of flexibility in delivering the positive operating leverage and flex with the revenue setup. The productivity that the franchise is observing is very real and not just squeezing expenses, which I know investors worry about, whether that is sustainable. So we are, as John said, very committed to positive operating leverage and with some ability to flex on the expenses as needed.
And are you able to pull forward investments?
Like, you know, if you are doing that well on the revenue side and you still want to keep, you know, closer to that 200, I mean, I think people are hoping for more than 200, but how much on the flex side do you also kind of have the opportunity to just get some spending done and then set yourself up for even better results in the future? it's a combination so there are things like branch investments and things like big technology bills that you don't think you can flex and change in the short term but a lot of our expense is contra revenue in the sense of you know marketing expense for acquisition of card or marketing expense for brand building is very short-term flex so that mix is is flexible enough for us to think about it. And we do hear your point. I'm not ignoring it, that investors would prefer it to be more than 200 basis points. But as you know, the opportunity set in our portfolio is really very attractive. So we are leaning into it this year, while last year we realized that we really needed to put some points on the board on positive operating leverage. You saw from John's chart, we've reduced the efficiency ratio by more than 400 basis points over the last two years, and we still have some aspirations to be just a lean bank, but not at the expense of really investing to capture some of the growth opportunities we have.
Operator
Our next question will come from the line of Gerard Cassidy with RBC Capital Markets. Please go ahead.
Hi, Gunjan. Hi, John. Morning. Gunjan, can you share with us, obviously you're very clear about focusing in on organic growth, and we all know in the banking industry that consumer transaction accounts or DDA deposit accounts are the gold that really drives profitability from the liability side of the balance sheet for all the banks. And our industry or your industry has obviously consolidated. U.S. Bancorp has been a big consolidator over the years, and that's one way to grow those core deposits, of course. But with organic growth, is there any plans for U.S. Bancorp? Maybe they'll follow some of the strategies your peers are pursuing now of building out nationwide or regional-wide branches to grow these core deposits, Even though I know online digital is a main driver of capturing new growth, but it seems like it's complemented by having physical branch presence. What are your thoughts on that?
Good morning, Gerard. Well, we very much agree that the physical branch presence is very critical, both to the quality of the deposits and the deposits per account. So the economics of a branch-based deposit acquisition are very attractive to us. As you know, we spend $200 million a year on our branch network. We still have work to do in changing the formats of the branch to go from, you know, focus on servicing, which our legacy branch network very much had focused on, like these small branches many times and in-store. What you see us building out, even sometimes in the same location, are these multi-product branches where you can have a small business advisor, a wealth advisor, a mortgage advisor, and of course, our banking and loan and small business specialists. So we are very committed to branch expansion. The slight nuance here is that our focus is on densifying those parts of our existing footprint where a brand is very powerful to become the top three depositor in that geography. And so that's been our focus. We're building out branches in places like Nashville, Phoenix is a big focus for us, and Reno, and pockets of sort of really new young growth is where we are building out the branches. What we want to do, though, is to leverage the uniqueness of our payments franchise and our digital capabilities to augment that branch-based growth. But all of this to say we strategically understand the need to be very highly focused on building out a high-quality consumer and small business franchise and improving the deposit quality over time. That's why we track the consumer deposits as a mix of our total deposits like a hawk now, and we are very focused on growing that mix. What would you add, John?
Yeah, I mean, I think that's well said, and from a deposit standpoint, as I mentioned, we've been growing those deposits, and I think the opportunity for us to refurbish and to where we have scale and lean in on those areas that you mentioned, and then some is really where we are focusing our investment and time. And that's where ultimately, once you have scale in those markets, you can get the deposit features that you want that help us with the things like the deposit stabilization that we're getting in terms of not as much rotation in the consumer side of the equation and things like that. So that's very much a focus for us, as Gunjan has articulated.
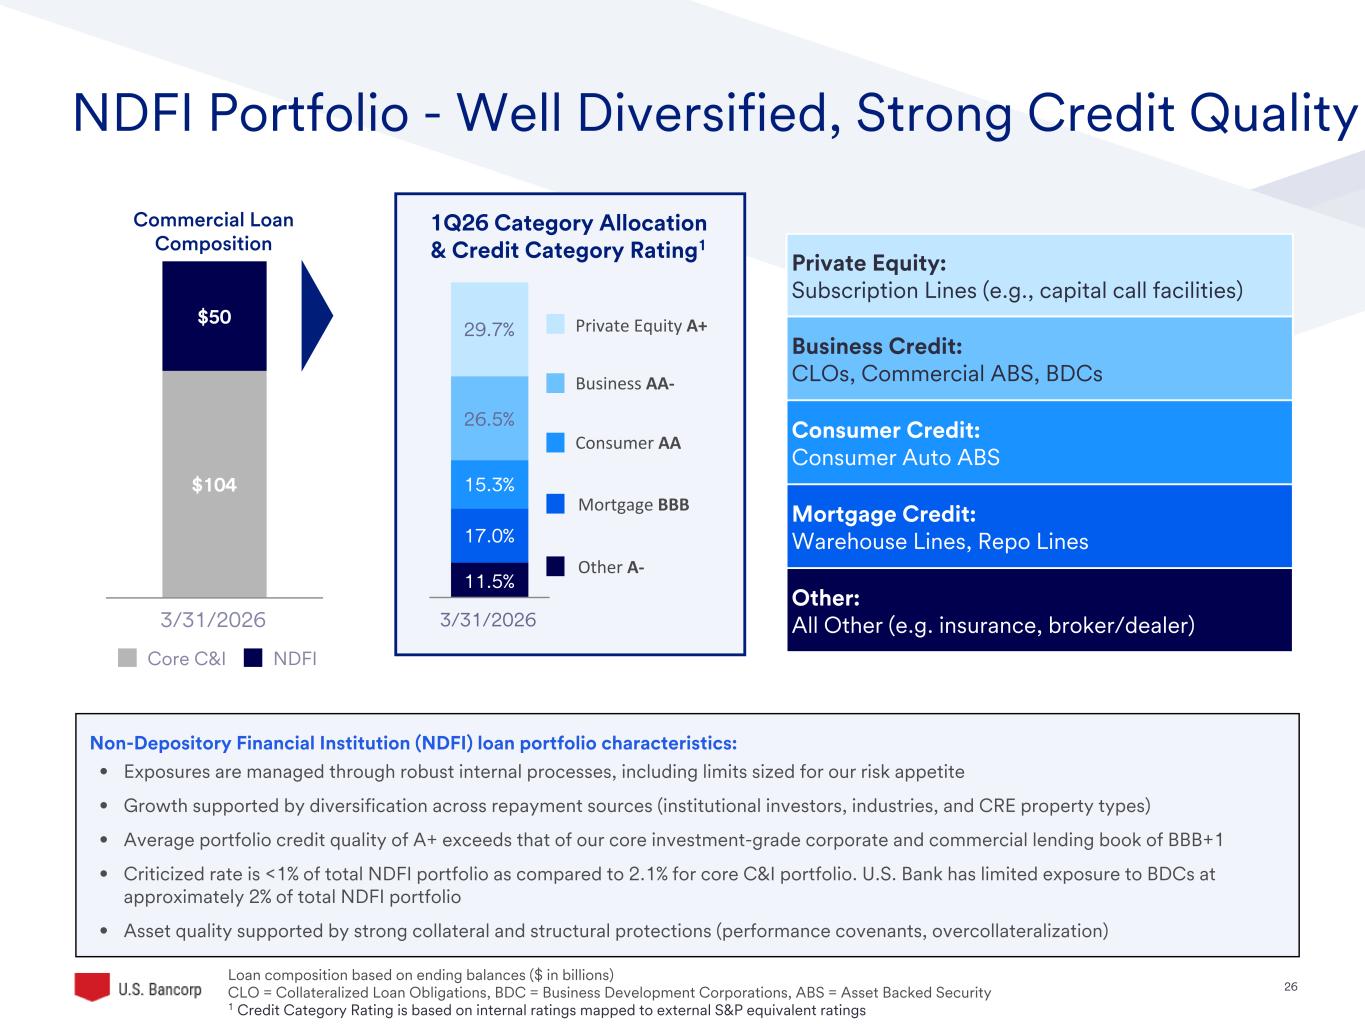
Very good. Thank you. The follow-up question is, you know, I direct it to you folks because you're well respected on credit quality through a full cycle. You're one of the banks that has demonstrated consistent underwriting conservativeness. And I want to come back to the slides that you put out, John and Gunjan, 17 and 26 on the NDFI portfolios. And what's interesting is that many of the banks are giving us this information, which is very helpful. And And it doesn't appear that these NDEFI portfolios, even in the business credit intermediary category, are that frightening, if you will, because of the structure of the portfolios. And so this is more of an educational question I'm asking for myself and probably others. What kind of scenario, and again, I'm not saying it's going to happen to you folks, but again, it's more you guys know credit very well. What kind of scenario would you actually have to see for losses to show up in these types of credits? Because it doesn't appear that it's going to happen even in a traditional credit cycle or on my way off.
Well, thanks, Gerard, for that thoughtful question. I think a couple points I'd make. One, we put the slide out there. This really started, I think, a couple quarters ago. There was a couple unique losses that were in the marketplace. And there was a reaction to, you know, hey, what's in the book from an investor standpoint? And so, you know, I think more information, more education is helpful. I think getting more granular like we did on page 17 in terms of giving you some color on the structure and how it's set up to give just, you know, what exactly you just said, that we think there's very low loss likelihood in these sorts of structures. It would, you know, in terms of like AAA CLOs, I mean, we've never really seen losses. And, of course, as a banker, you want to never say the never say never because that's why you have limits. That's why you have underwriting practices. That's where the risk management comes in because it's hard to envision any – there's lots and lots of scenarios out there, and there could be one that could trigger something. I don't know what that would be. I don't know what the trigger item would be, but that's why we have the limits. That's why we have the rigor that we do, and we'll stay true to that. And we wanted to illustrate that on page 17 and the other page in the appendix.
Operator
Our next question will come from the line of Saul Martinez with HSBC. Please go ahead.
Thanks again for squeezing me in here. I want to go back to Amazon. on you guys seem very excited at the at the opportunity set here and gunjin i think you said they it meaningfully expands your card growth and john you gave some some numbers around it 1.6 billion of loans and and i guess 75 80 million of revenue but can you talk to the the the the size of the opportunity i mean it seems like a a relationship that can really grow how big can this get um either in terms of volumes loans um revenues and what can you do what are you doing to to ensure that this partnership is is enhancing value for uh for yourselves and for amazon
thank you so so you know we have a portfolio of co-brand partners and the growth in that book is very reliant on the growth of the customer base of our partner so to that extent you know just because Amazon's ability to grow its small business base and their aspirations around this segment give us optimism around our path forward. Just when we convert the book in the third quarter, what we are expecting is about a $75 million to $85 million per quarter type of impact, which is meaningful from a growth standpoint. Our intention would be to have some of that show up in the revenue projections of the business, but some of that will reinvest in driving new client acquisition. But our goal here is to take our payments business to a more robust, long-term growth trajectory, and that's what this platform helps us do, along with many others that we are building.
Okay, that's helpful. Maybe to stay on payments, I wanted to ask you about the merchant acquiring business. The merchant processing fees did grow. nicely. Again, mid-single digits, 5%. The volumes have been a little soft, though, the last couple quarters. I think it was 2% last quarter, 1% this quarter. It's actually a little bit lower than even the number of transactions, which grew slightly more than that, which would suggest lower average tickets, a little bit unusual in an inflationary backdrop. But anything to read from this? Are you seeing higher take rates? Does it reflect a mixed shift? Are you seeing changes in consumer behavior or consumer sped patterns um you know i'm just curious if there's anything to read from this because you know obviously the volume eventually i think you you know you would want to have volumes growing um a little bit faster than than what they've been growing uh the last couple quarters thank you solid you know it's a great great insight uh and question um i'll give you with the the the quick fact on it is it's just it's basically one or two clients that have exited that have really no revenue impact on the numbers.
And so the big picture then, therefore, is that the underlying trends of our clients are more reflective of the growth rate that you see. So if you were to take that, and what I mean by that is the growth rates we had in CARD are kind of that 5% to 6% area. That's kind of more reflective of what we're seeing in our core for merchant, which is reflective of that growth rate of 5.1 percent that you see for the quarter. And broadly speaking, payment trends have been just very strong. I mentioned in our comments, despite the sentiment that is out there, the spend patterns that we've seen, both in terms of high FICO and mid FICO are about the same, discretionary versus non-discretionary about the same.
It's broad-based strength in the spend, despite the sentiment that you see out there and you know over time we do want to decouple from the volume growth this is a vast industry and a lot of volume comes with very little revenue and a lot of risk so we are going to be quite disciplined about only focusing on the revenue growth and I do understand from your point of view there's not that much visibility to revenue trends a lot of the external reporting is only volume and we'll try to bring as much transparency but we're very committed to a profitable business that grows modestly and not chase after sort of big big volume that comes with very very thin revenue which you can do in this market quite a bit yeah yeah all right that's that's very helpful thanks so much for the answer our next question will come from the line at Vivek Genesia with JP Morgan.
Operator
Please go ahead.
Hi, thanks. I have a couple of questions. One, to sort of follow up on payments. I think you have a new category now. It says corporate and treasury payments. Pardon me if I get that wrong, or is it treasury and corporate? I know you just changed corporate payment and treasury management revenues. You can't reclassify that. The growth rate in that slowed to 2% year on year. And, you know, you have the fuel card, which sort of benefited a lot from gas prices. So, any color on what's going on there that you can help elaborate on that growth rate?
You bet, Vivek. Yeah. So, with the change, we combine treasury management as well as corporate payments. That's kind of the classification change based on how we manage the businesses here within the company, along with other changes that we put in the 8K a week or two ago. In terms of the growth rate, just on the corporate payment side is where we're seeing the drag in that number. And that's really a reflection of last year at this time. Recall, there was the tariff announcements and things of that variety, and a lot of focus on government spend uh from doge and other things like that that really uh we're beginning to lap that in the uh in the second quarter you'll start to see that lapped and fully in the third quarter so we we see the pipelines being really strong there and so uh by the time we get to the third quarter that'll be more representative of what we we believe that'll be uh the the true growth rate in that in that business great okay thanks a different question john uh thanks for the disclosure on the NDFI stuff.
I know you give BDCs and CLOs. How about private credit? What's your exposure there?
Yeah, so I think if I'm reading you right, just on the capital call facilities and things like that.
No, that's private equity. I'm thinking private credit because that can be different from BDCs or is that in your mind synonymous?
Yeah, I mean, I think of page 17 is a lot of the private credit type of exposures. So I think that's So that's the laundry list is how I would lead to. Then the call facilities, which I know you mentioned private equity, that's going to be in the equity component of NDFI. So I look at this page as really the private credit component and exposure on page 17.
Okay. You mean because you've got the five different categories, but not all of that should really be private credit, no?
Yeah, no, true. True, true. Yeah, CDF, BDCs, and the CLOs, I would say, are really representative of the private credit components, yes, which is just under 3% of our total loans. Thank you.
Operator
Our next question comes from the line of David Ciaverini with Jefferies. Please go ahead.
Hi, thanks. So the other boogeyman out there is AI disruption risk as opposed to just private credit. Can you frame to what extent any of your fee-income businesses could be at risk from AI, particularly payments and the modes you have to defend your position?
Let me start. You know, we don't see any particular business be truly exposed to an en masse or a disruption either in terms of price collapse or volume transition. What we are seeing is a very rapid shift in customer search behavior in how they find products and services. So to the extent that we need to keep up with discovery, and it's very basic things like search engine optimization tools for marketing are very rapidly migrating to the AI world. The reason we don't think that is going to be impacting our businesses because we are building those capabilities and transitioning our approaches pretty rapidly, too, and there's a lot of toolkit. So I will tell you we are watching these trends very carefully to see how it might be, but as of now, we are not seeing anything that would show a sudden discontinuity or shift here.
Maybe I'll just add, I mean, I think we had a commentary from Stephen in a recent conference about the usage of AI. We have a lot of businesses that have complex operations that we do very well. If you think about fund services and corporate trust. So this is an opportunity for us to leverage AI and go on offense, really, and simplify our operations and the complexity that goes along with it. We have the knowledge of how these things work, and so we should be able to take advantage of that faster than any other outside competitor, fintech, or whatever the case may be. So that's kind of how we think about it.
Very helpful. That's all I had. Thank you.
Operator
Thank you. Our next question will come from the line of Chris McGrady with KBW. Please go ahead.
Great. Good morning. Thanks for the question. I'm interested if any of the optimism on loan growth is perhaps non-bank lending turning back to the traditional banks such as yourself.
I don't think so. This is what we're seeing is, you know, if I think about private credit and where they've grown, they've grown in more of the leverage space, more in HLT and other places like that. And, you know, a lot of that, we just, because of our credit underwriting and the way we look at things, that's, those are areas that we're not as focused on, really. So we never really have truly competed head to head with the private credit wing, so to speak. This growth that we're seeing is going to be more in the large corporate space. I mentioned food and beverage and energy, all these sorts of categories are really coming online, and that's unique. That has not shown up in the last several quarters, so I think that is why we wanted to call that out and why we have such optimism in our pipelines go forward.
Okay, John. Thank you for that. And then given the optimism on growth, is the expectation core deposit funded? Do you think you'll need to rely on perhaps more expensive sources to fund the stronger Yeah, maybe just to link a couple comments we've made here.
I think, you know, deposits will generally grow in line with loans, although it may not be one for one. It will probably be a little bit less. And the reason I say that is because our focus is really on consumer deposits and growing operational deposits and really limiting or eliminating things like CDs and higher-cost institutional or just kind of one-time clients. That's all we have is just the deposit. So we're going to be more nimble on the deposit side of growth versus the loan side, I would imagine. All right. Perfect. Thank you.
Operator
Our next question is a follow-up from the line of John McDonald with Truist Securities. Please go ahead.
Hi. Thanks, guys. Just a quick modeling question on the BTIG. John, understanding it's not part of the guidance, when you say accretive for the year, does that include any integration charges that's kind of all-in accretive to your results for the year is the expectation?
Yeah, that's our expectation, John, is slightly accretive, too, inclusive of those charges. We'll start to provide some of that information as we come online. We're expecting kind of back half of the year in terms of that. So obviously there will be a bigger expense base. There's less of a margin with this business than most of our businesses. So you'll see that flow through. And then it's a merger cost that we'll all identify as well.
Okay, so the financial impact, probably not much in the second quarter. This will all start hitting the back half.
Yeah, that's right. Yeah, I wouldn't expect much of anything in the second quarter and in the third and fourth quarter. We should be pending regulatory approvals, yes. Okay, great.
Operator
And there are no further questions at this time. I'll hand the call back over to Jen for closing comments.
Thank you, everyone, for joining our call this morning. Please contact the Investor Relations Department if you have any follow-up questions. Regina, you may now disconnect the call.
Operator
This concludes our call today. Thank you all for joining. You may now disconnect.