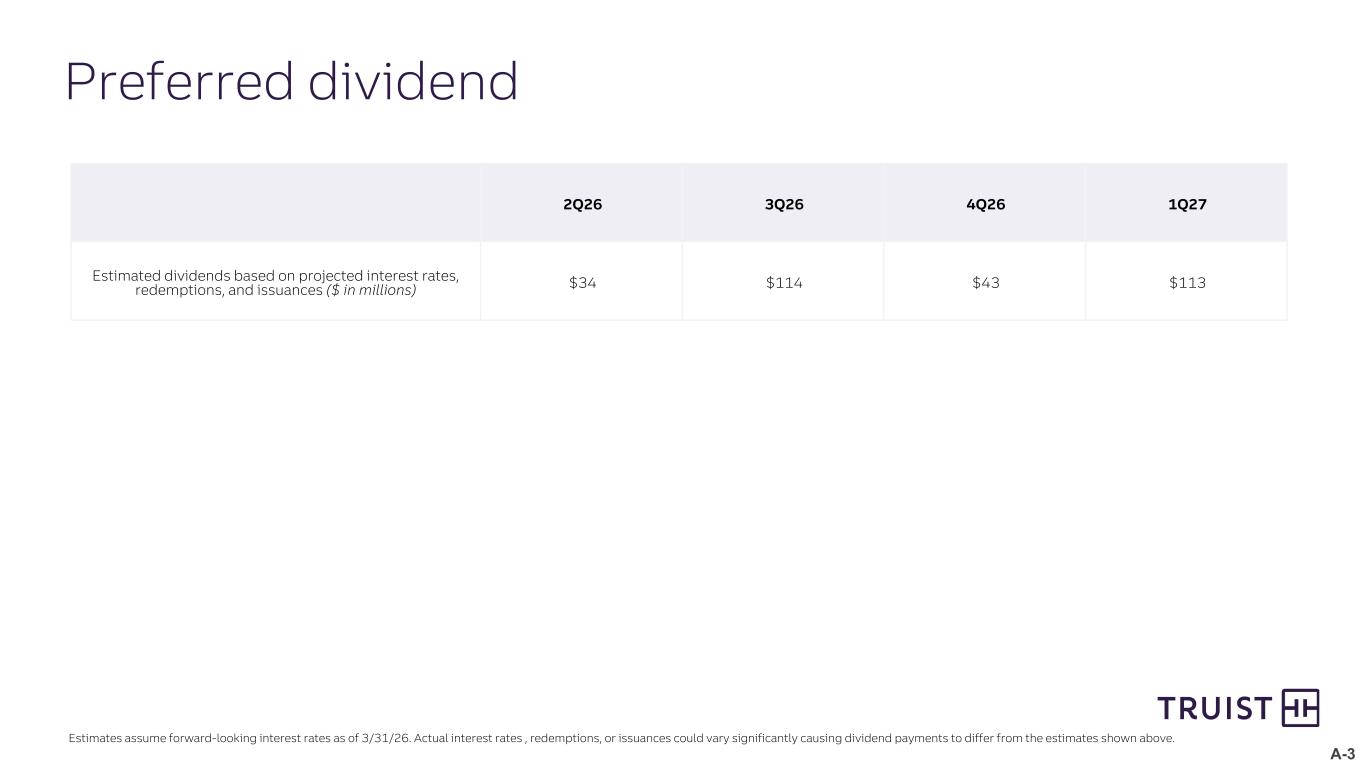
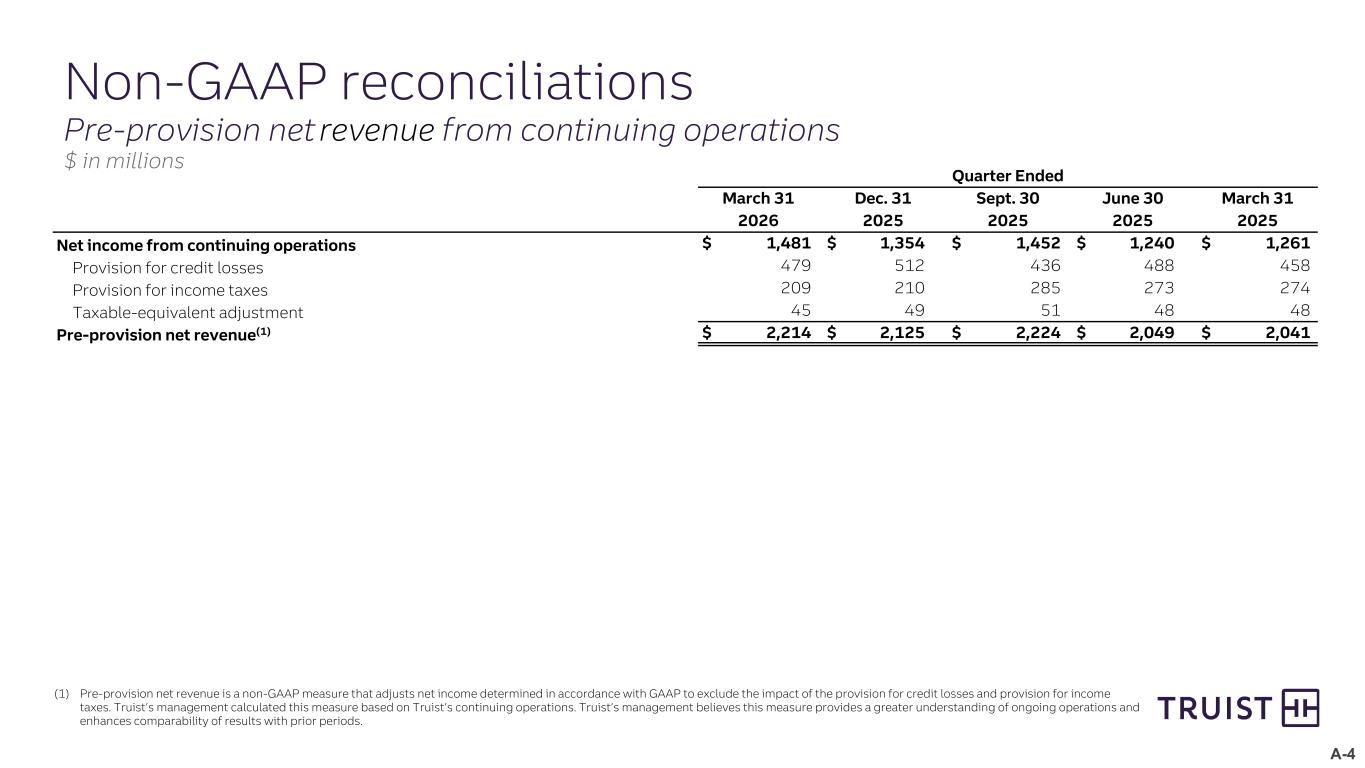
Thank you, Betsy, and good morning, everyone. Welcome to Truist's first quarter 2026 earnings call. With us today are our Chairman and CEO, Bill Rogers, our CFO, Mike McGuire, and our Chief Risk Officer, Brad Bender, as well as other members of Truist's senior management team. During this morning's call, they will discuss Truist's first quarter 2026 results, share their perspectives on current business conditions, and provide an updated outlook for 2026. The accompanying presentation, as well as our earnings release and supplemental financial information are available on the Truist Investor Relations website, ir.truist.com. Our presentation today will include forward-looking statements and certain non-GAAP financial measures. Please review the disclosures on Slides 2 and 3 of the presentation regarding these statements and measures, as well as the appendix for appropriate reconciliations to GAAP. With that, I will turn it over to Bill.
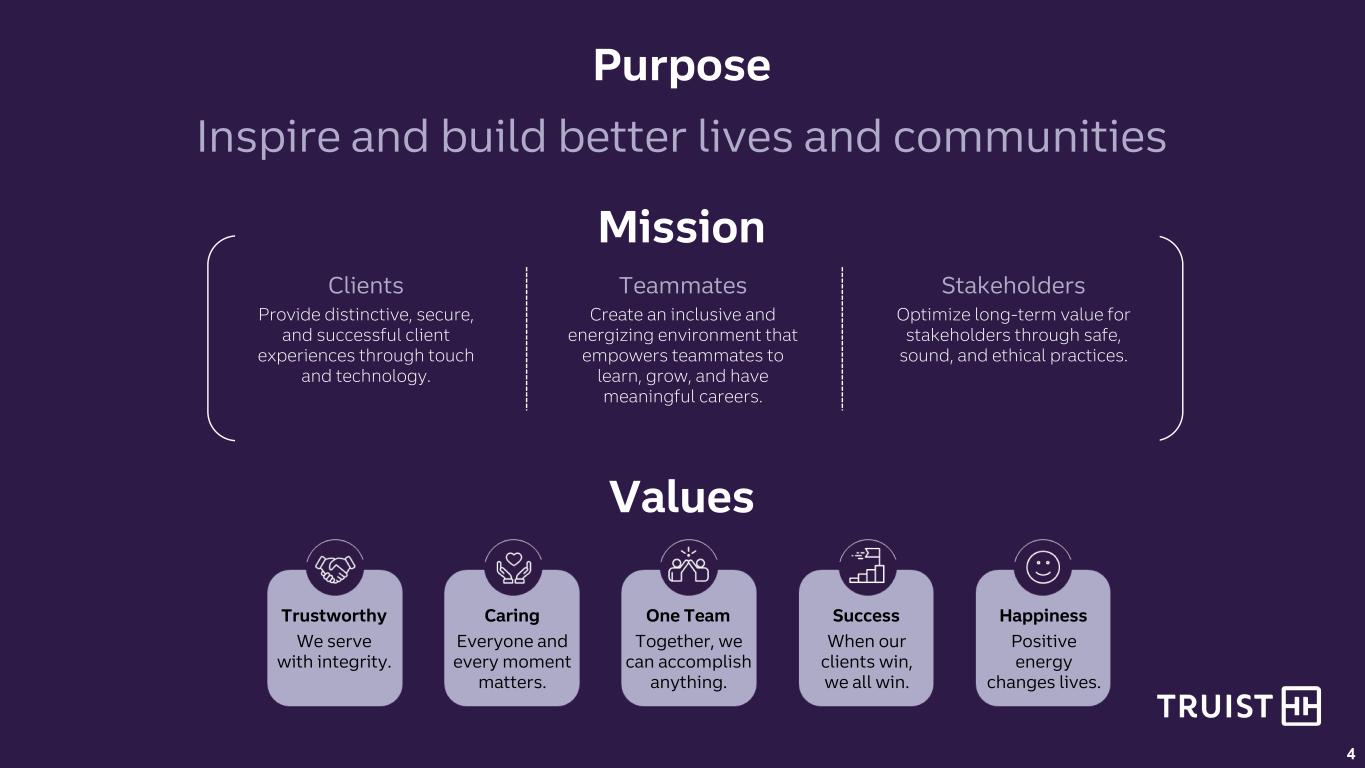
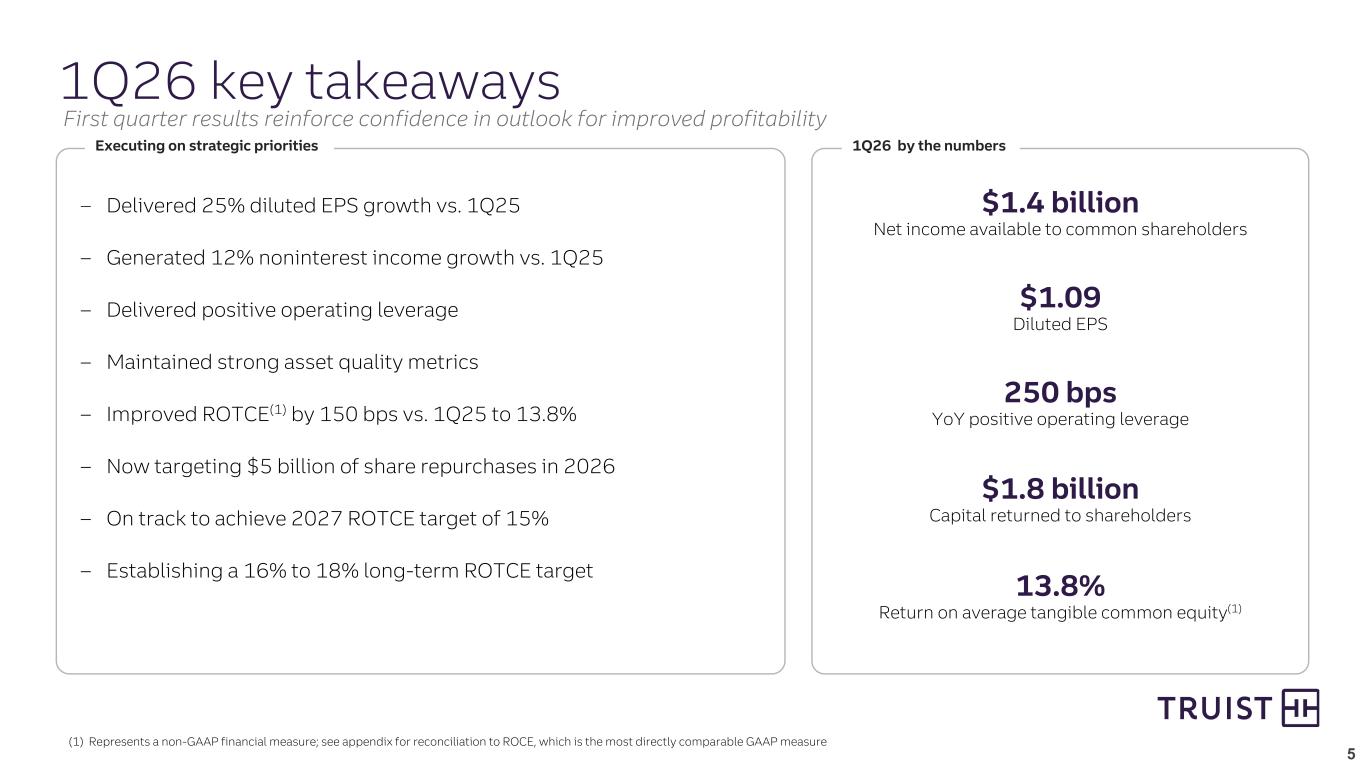
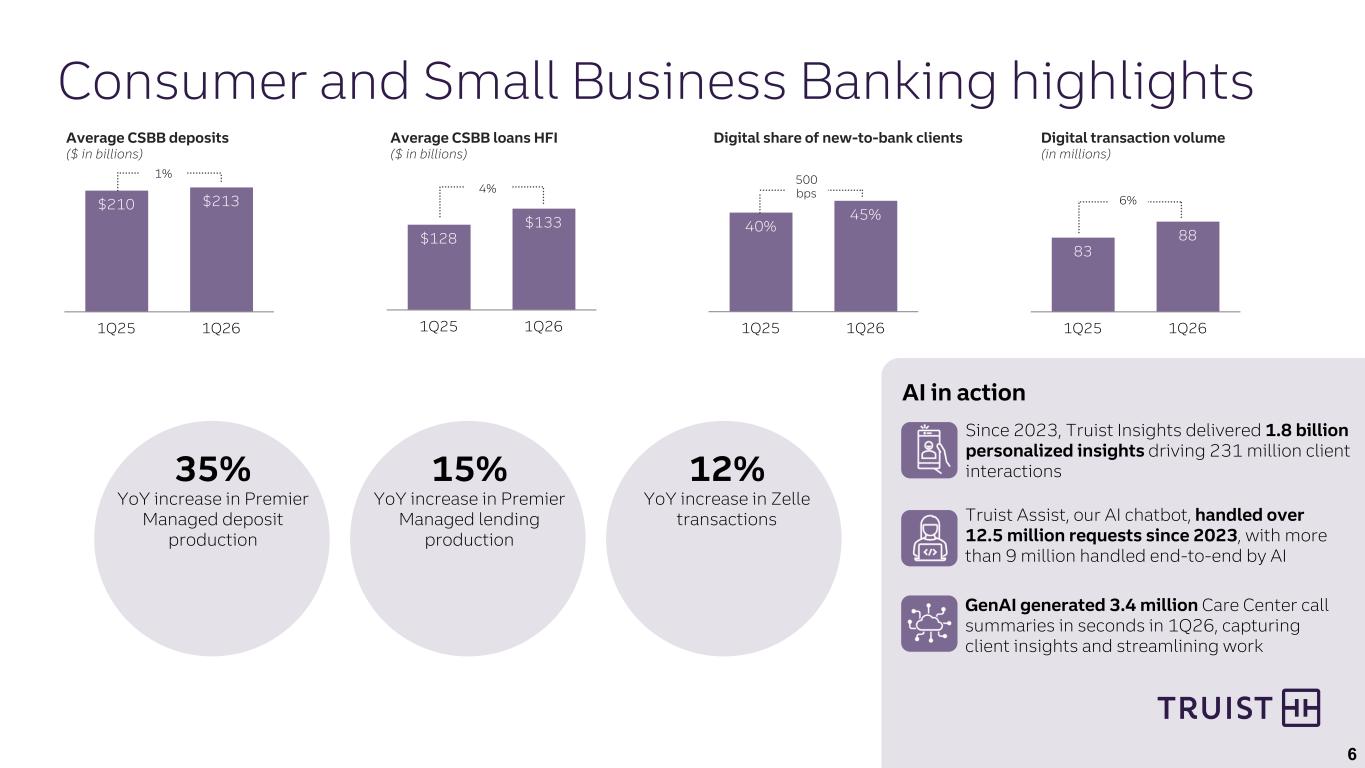
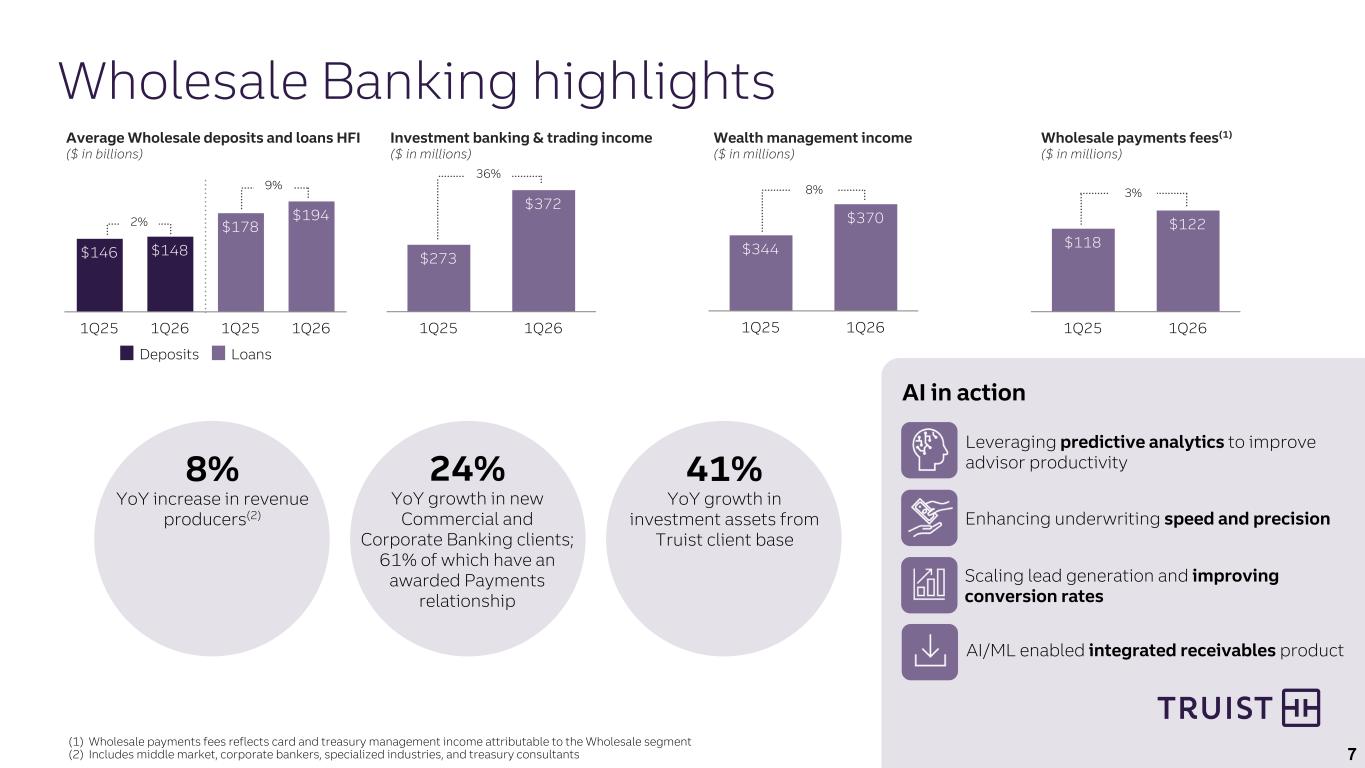
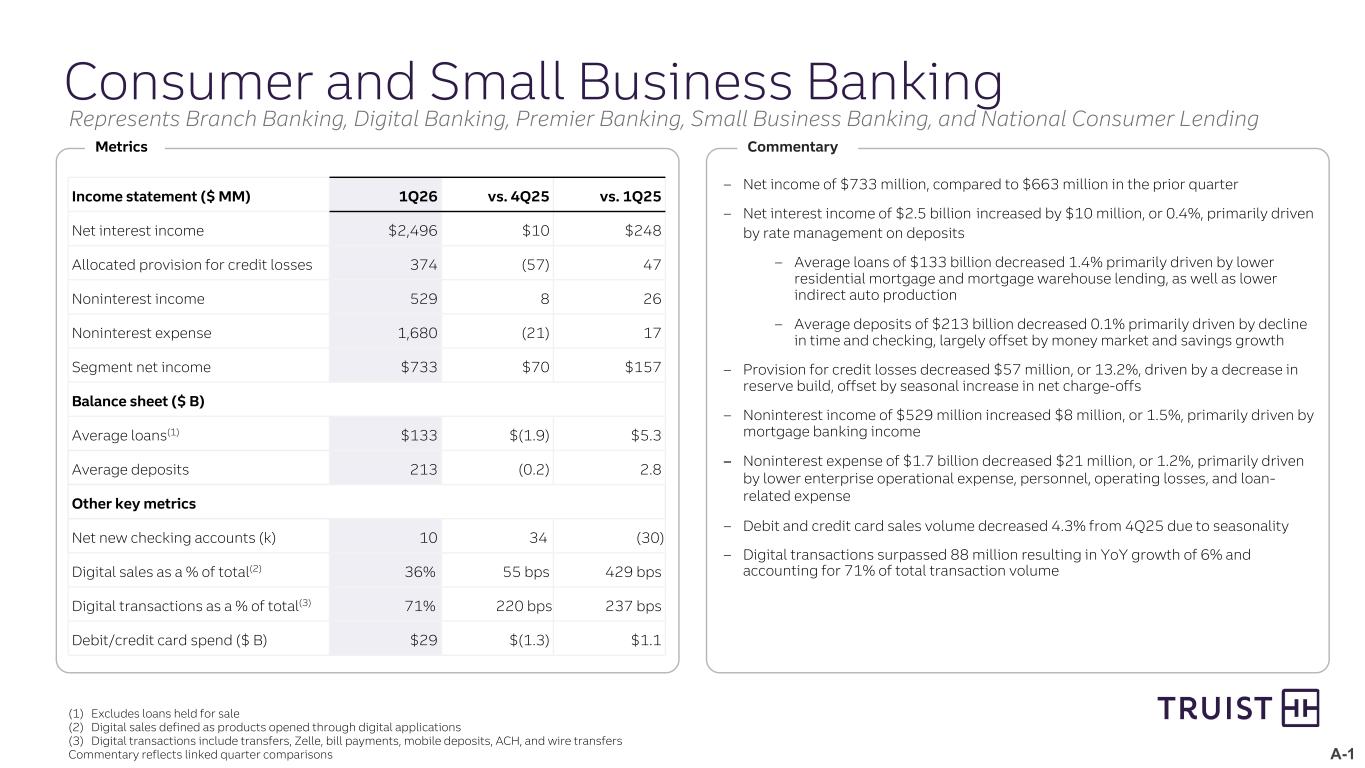
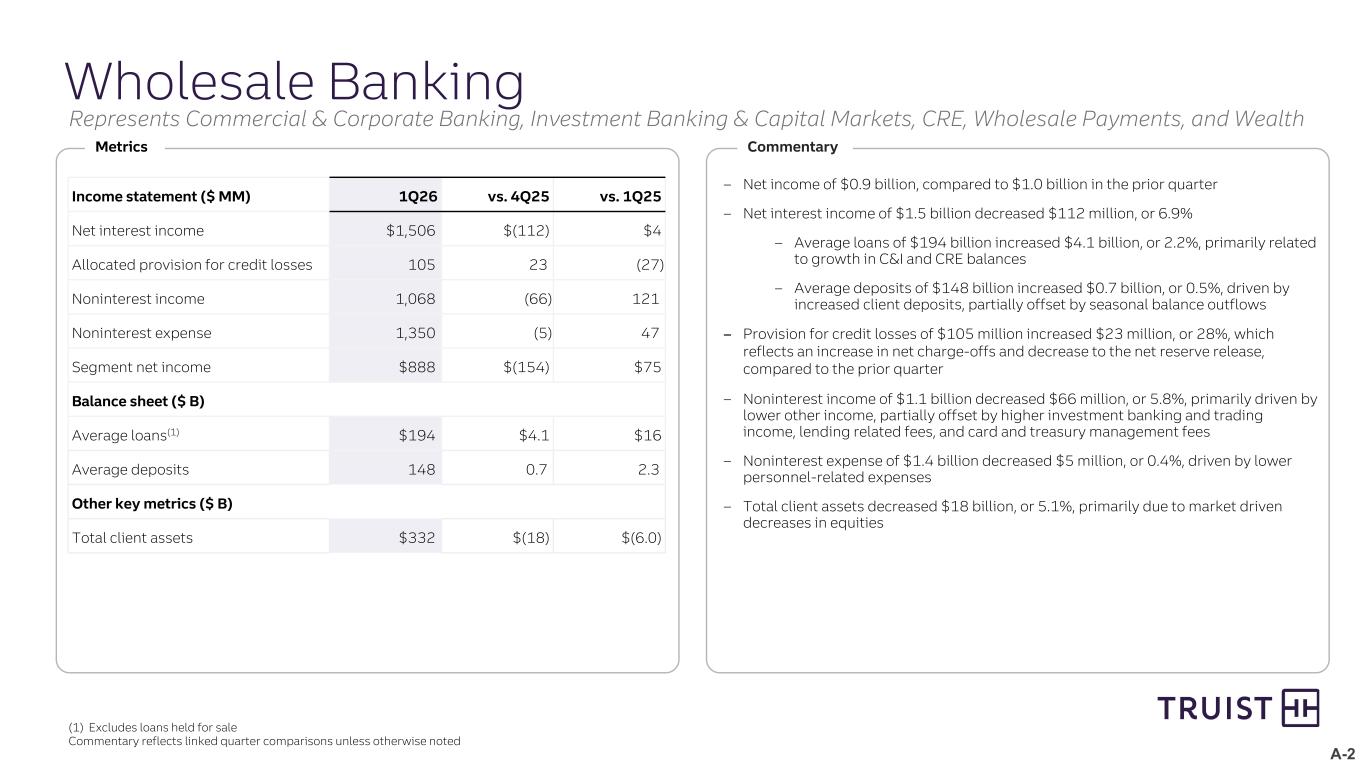
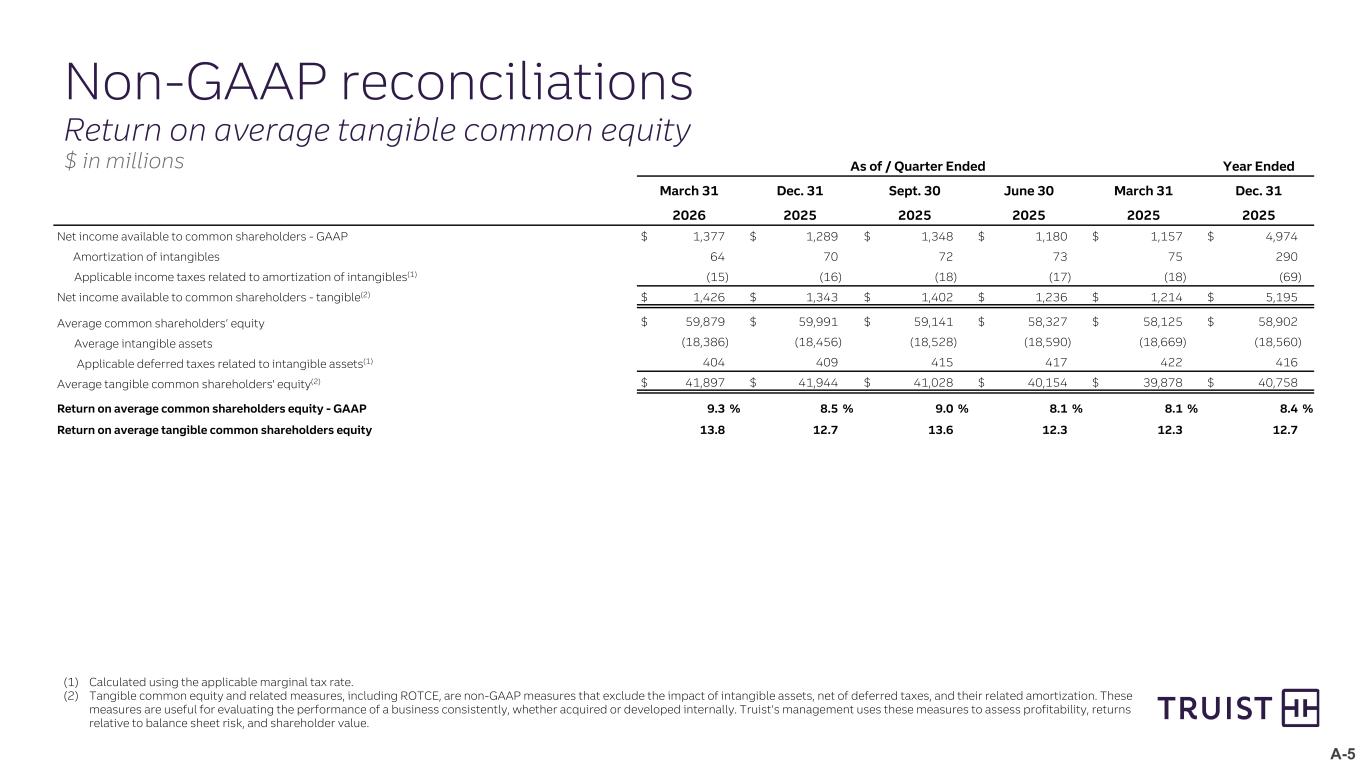
Thanks, Brad. Good morning, everyone, and thanks for joining our call today. Before we discuss our first quarter of 2026 results, let's begin as we always do with purpose on slide four. At Truist, our purpose is to inspire and build better lives and communities. And one way we bring that to life is through the work we do every day for our clients. One example of this is our project finance business, which is a client-focused platform that provides financial advice and capital to help develop essential infrastructure that drives long-term economic growth, job creation, and stronger and better our communities throughout our footprint in the United States. Our relationships with these clients have led to broad-based franchise engagement, which includes deposits, payments, and lead roles in capital market transactions. From a financial perspective, there are aspects of this business that generate returns somewhat differently than our other businesses. A meaningful portion of this benefit is realized through reductions to our tax provision rather than reported revenue. Mike is going to walk you through the impact of that later in the call, but this dynamic that contributed to our lower tax provision in the first quarter and is a factor in our expected lower tax rate for 2026 compared to 2025. This, though, is a great example of how serving our clients and communities is true to our purpose and also drives strong financial outcomes for our shareholders. Now, turning to our results on slide five. Before I get into the details of our first quarter, I want to spend a moment on the quality of what we're delivering across the company and how we're executing against our strategic priorities what I'm most excited about this quarter is the underlying momentum we're seeing new client pipelines are growing activity levels remain healthy and we're continuing to add talent and execute in the areas that matter most to our strategy of driving improvement and our profitability during the quarter we once again added new clients deepened existing relationships and grew profitably in the business and products where we're chosen to focus, with loan growth coming from priority segments, fee growth driven by core client activity, and stronger referrals and connectivity across the company. I can clearly say that we're focused, we're aligned, and we're executing well, which is evident in our first quarter results. As you can see on slide five, we delivered net income available to common shareholders of $1.4 billion, or $1.9 per diluted share for the first quarter, which represents a 25% increase over the first quarter of last year, earnings of $0.87 a share. Our performance was driven by continued execution against strategic priorities, including growth in both consumer and wholesale loans, along with strong non-interest income growth led by our investment banking and wealth management businesses. Together, those factors, along with our expense and credit discipline, contributed to a 250 basis points of year-over-year positive operating leverage in the quarter. As a result of this execution in managing our capital through share repurchases, return on tangible common equity improved by 150 basis points to 13.8% compared to the first quarter of 2025, representing meaningful progress towards our full-year 2027 ROTC target of 15%. While we remain firmly on track to achieve this target, as I've said before, it's not a ceiling for our company. The progress we're seeing today across our company gives us confidence in our ability to drop profitability higher over time. With continued execution against our strategic priorities, continued capital return, and the benefit of expected changes to the capital framework, we're establishing a long-term ROTC target of 16% to 18%. Before I hand the call over to Mike to discuss quarterly results, I want to spend some time discussing the positive momentum we're seeing within our business segments and with a digital strategy on slides six and seven. First, let me start with consumer and small business banking. DSBB delivered another solid quarter that was consistent with our expectations and strategy to drive profitability improvement across the enterprise. Average consumer and small business deposits and loans were up 1% and 4% respectively versus the first quarter of last year of 2025. Average loans declined modestly for the fourth quarter, which is consistent with normal seasonality, and our goal of emphasizing growth in categories offering the most attractive risk-adjusted returns. As you can see on the slide, premier banking was again a source of strength with both deposit and lending production up significantly, driven by deeper client engagement, advisor productivity, and continued momentum in financial planning activity. Digital continues to be a key growth engine for CSDB. Digital share of new-to-bank clients increased to 45%, with Gen Z and Millennials representing more than half of the growth. Active digital users grew year over year, and digital transaction volumes remain strong, reflecting sustained client engagement with our platforms. building on that digital progress we're increasingly focused on how AI can further enhance productivity decision-making and client engagement across the company we see AI is a real operating lever one that improves the client experience while also creating productivity and operating leverage across our businesses without compromising control safety and reliability our focus is on using AI to strengthen relationships giving clients faster, more personalized service, and enabling our teammates to spend more time advising and problem-solving, not navigating processes. We're already deploying AI across consumer and small business banking in practical, client-facing ways. Truist Insights delivers personalized financial guidance at scale. Truist Assist handles most routine service requests digitally and around the clock, improving consistency and reducing call volumes. AI-enabled call summarization is live for care center agents, lowering after-call work and enhancing insight capture. Overall, a disciplined focus on capital allocation, pricing, productivity, and digital execution is translating into strong underlying performance and positions consumer and small business banking well as we progress through the year. Now, turning to wholesale on page 5.7. In wholesale, we delivered a strong start to 2026 with continued momentum across loans, deposits, and fees while maintaining a disciplined focus on relationship returns and capital efficiency. Average wholesale loans and deposits increased 9% and 2% respectively versus the first quarter of 2025, reflecting diversified growth across our industry banking, middle market, and CRE teams as we continue to prioritize high-quality, relationship-driven loan growth. Middle market deposits, in particular, are an area where we've invested heavily through 11% year-over-year, driven by 7% growth in our legacy markets and 30% growth in expansion markets such as Texas, Ohio, and Pennsylvania. Wholesale fee performance will also stand out this quarter with strong results in wealth management and investment banking and trading. Investment banking and trading delivered its highest quarterly revenue since 2021, driven by strength across a broad set of product areas. Importantly, we're also seeing even stronger connectivity among our commercial, corporate, and investment banking platforms. This is driving higher quality feed growth with an increase in the number of lead roles and meaningful contributions from existing commercial and wealth clients. We're also leveraging AI across wholesale to enhance productivity, underwriting, and client engagement using predictive analytics to improve advisor effectiveness, accelerate underwriting speed and precision and scale lead generation and conversion among payments and wealth. These capabilities are helping us serve clients more efficiently while improving returns and speed to market. Overall we see clear evidence that our strategy is working. We are pairing high quality balance sheet growth with improving fee mix, stronger client engagement, and enhanced operating efficiency which gives us confidence in wholesale outlook for the remainder of this year. Now, let me turn over to Mike to discuss our financial results in a little more detail.
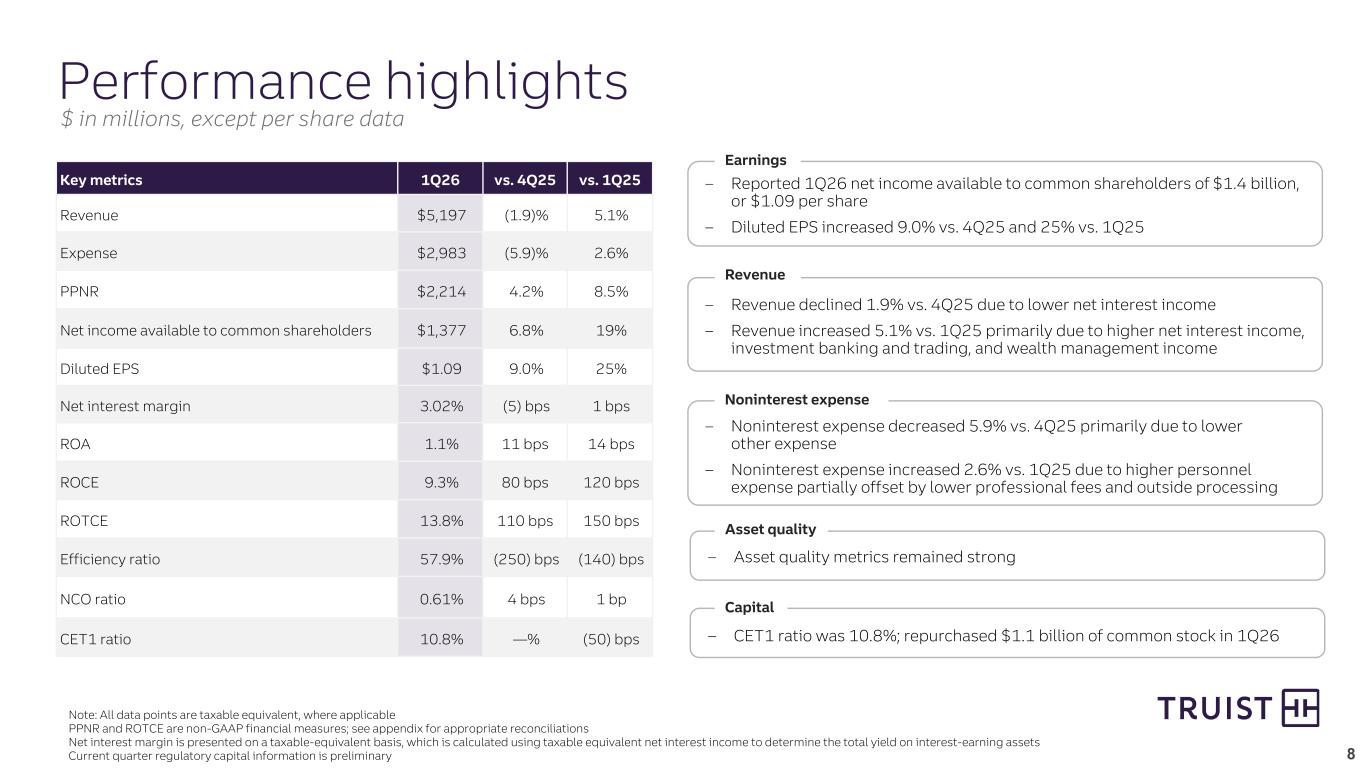
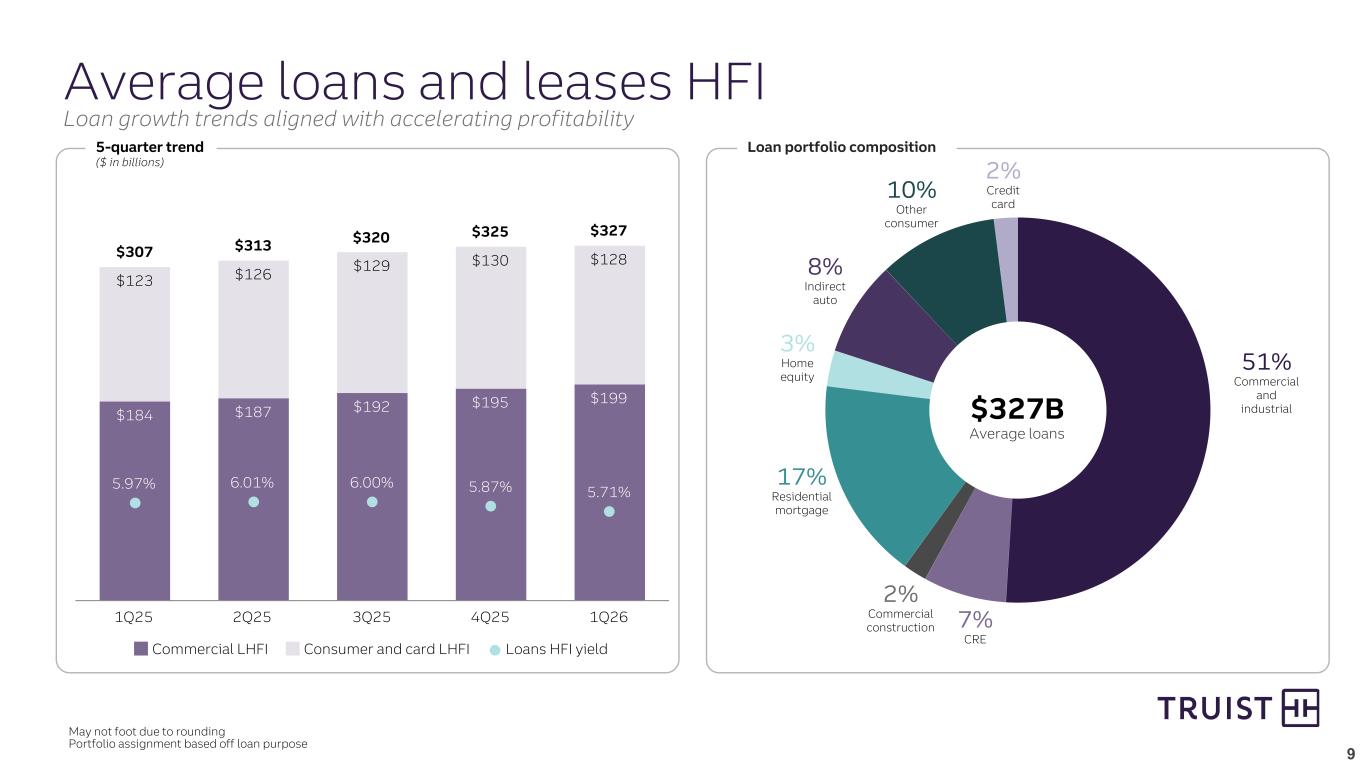
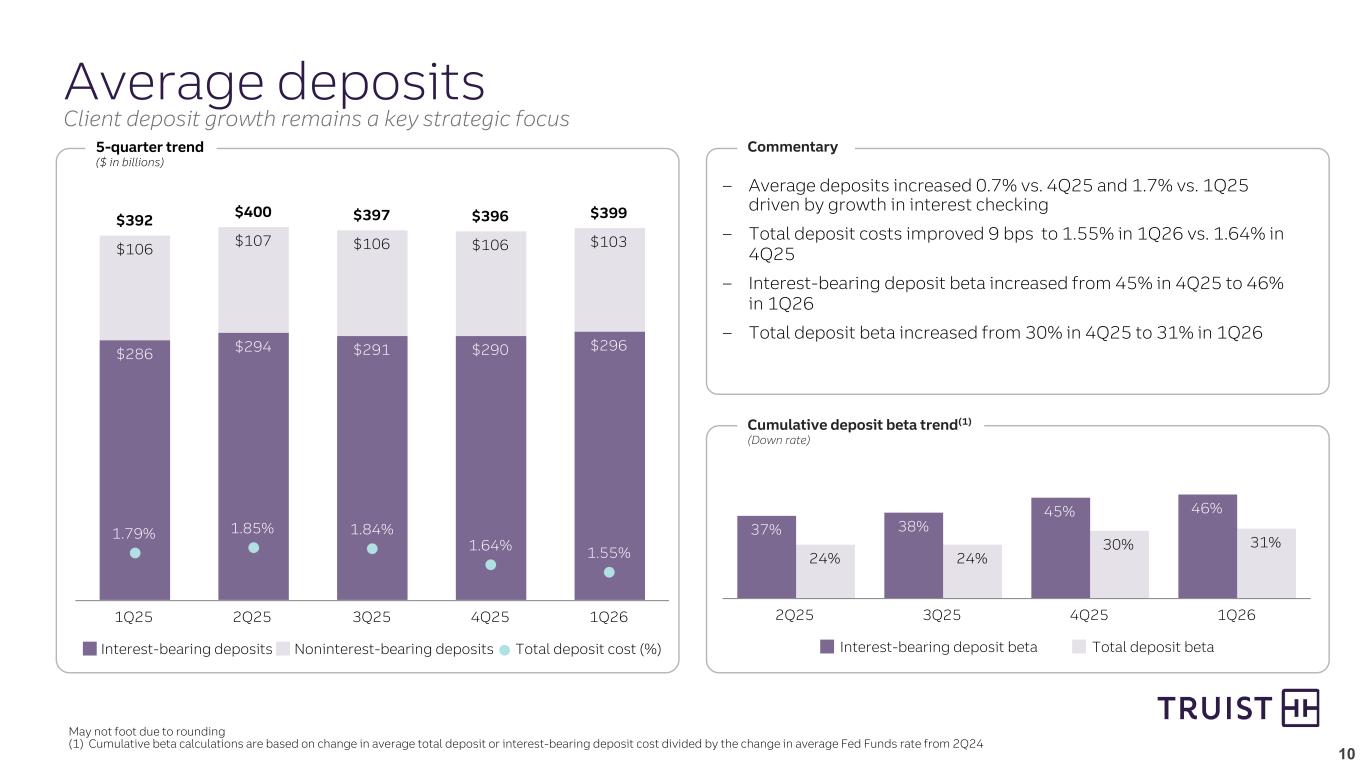
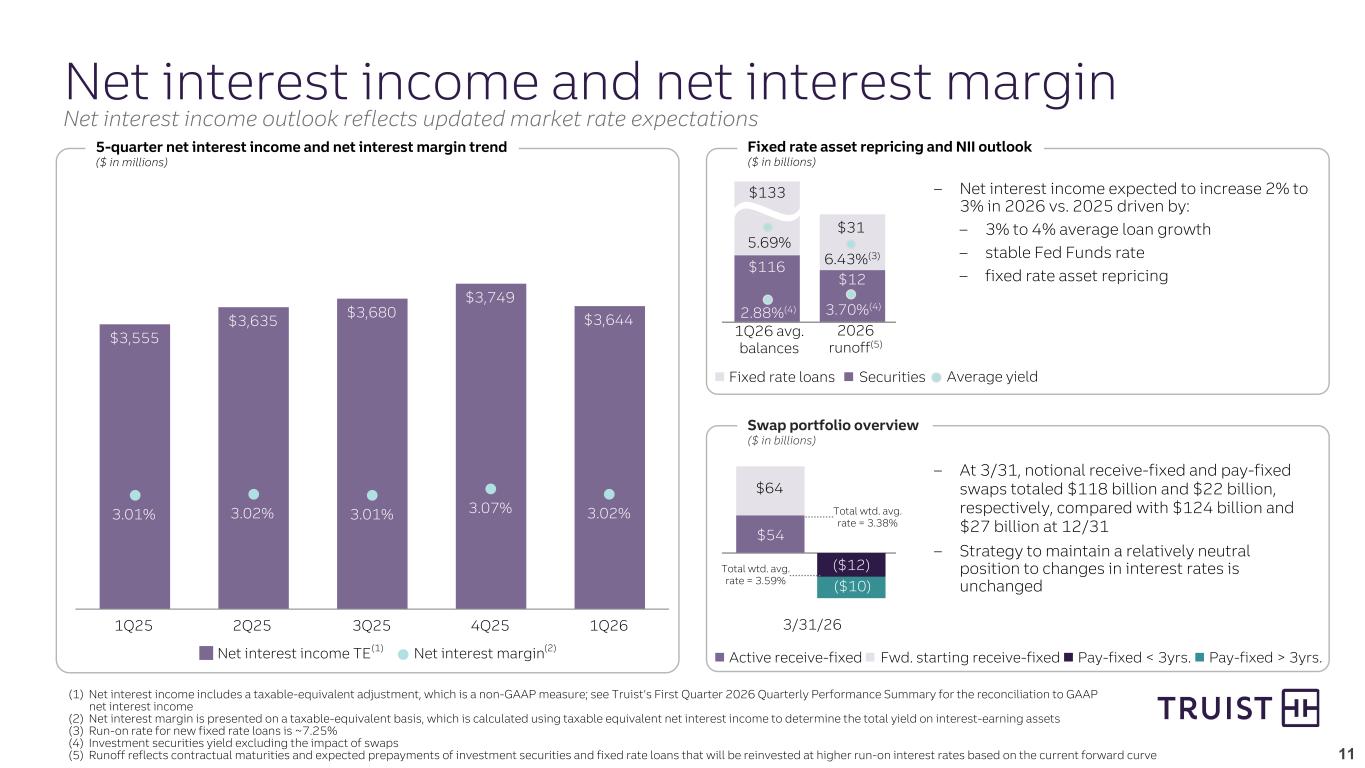
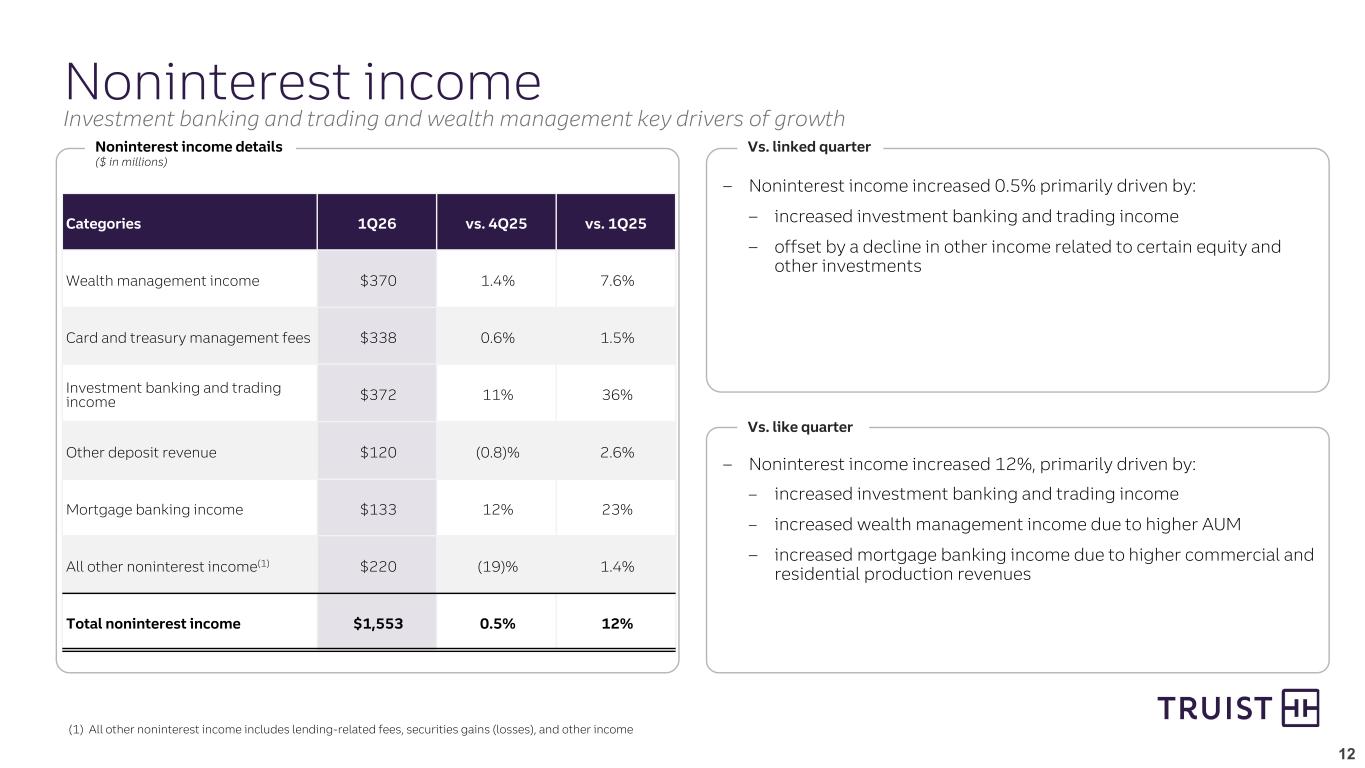
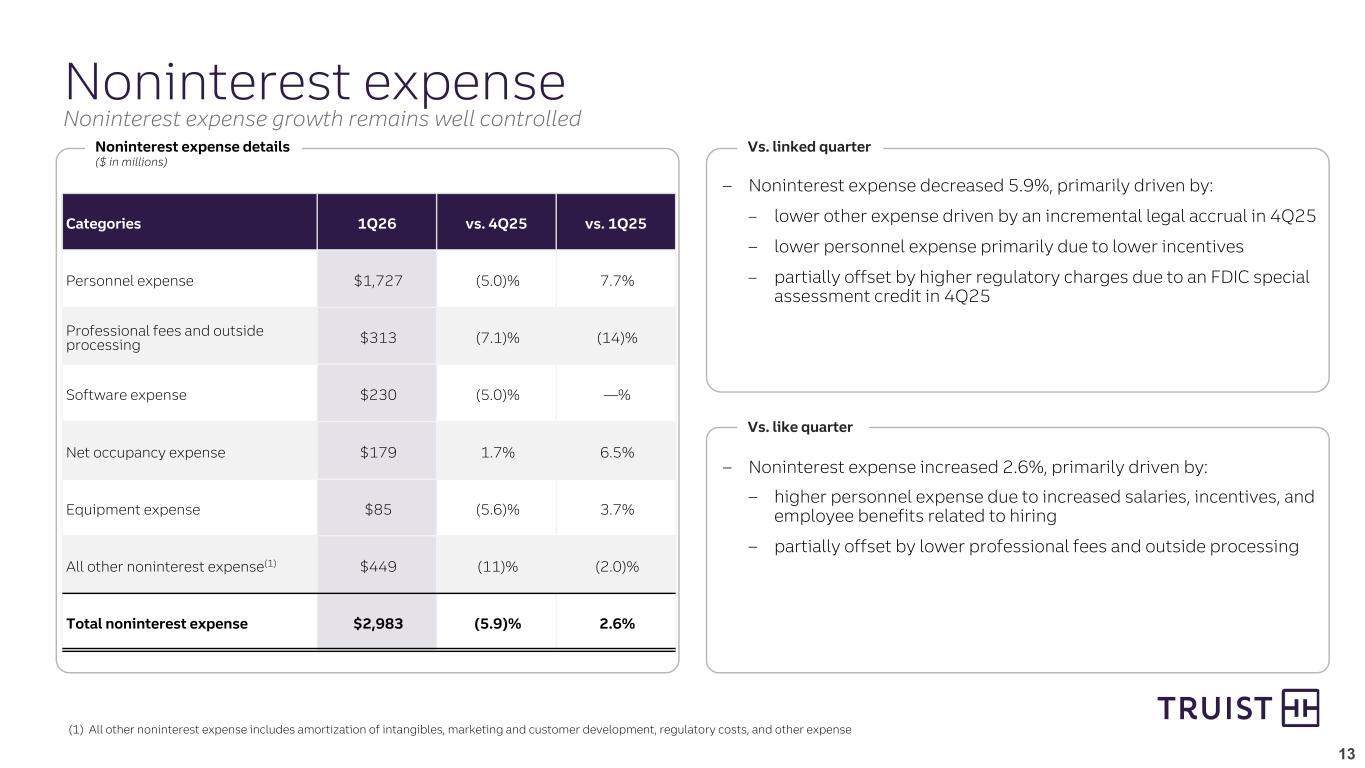
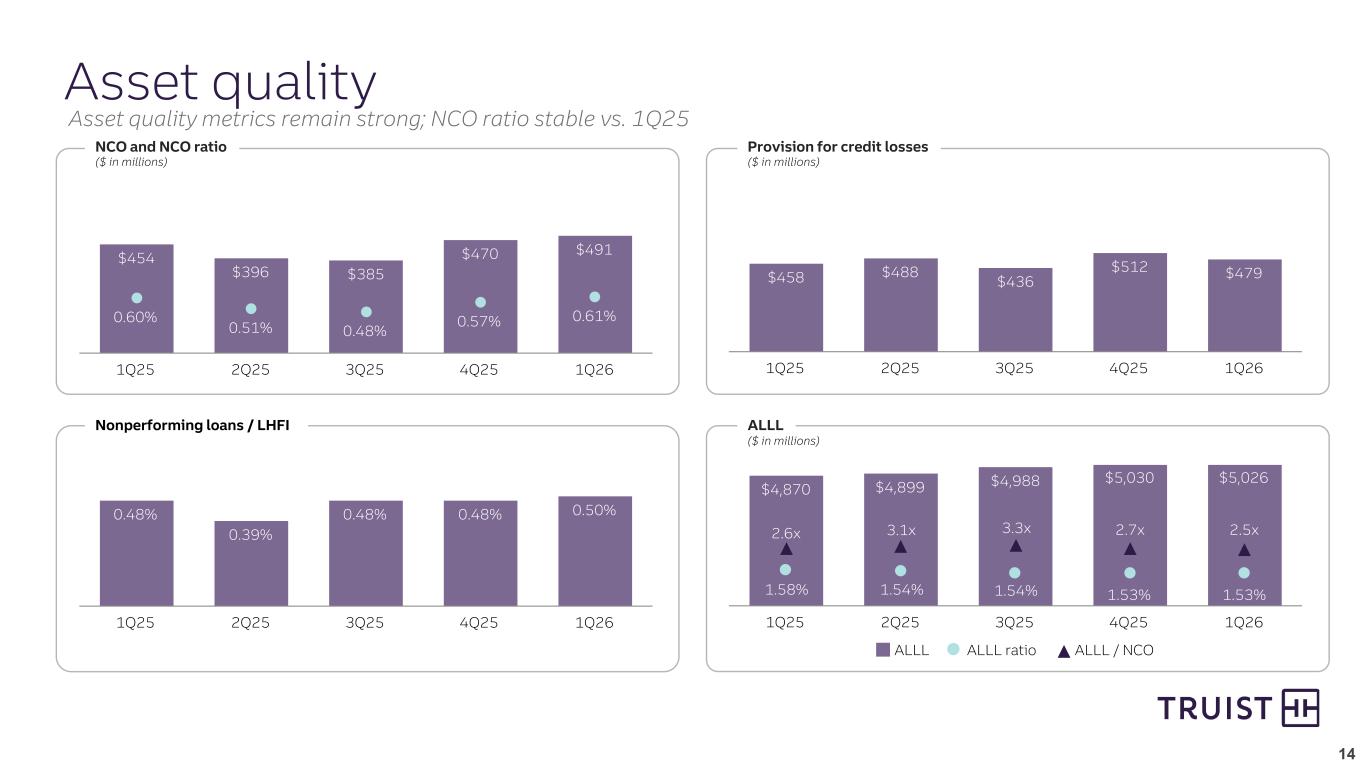
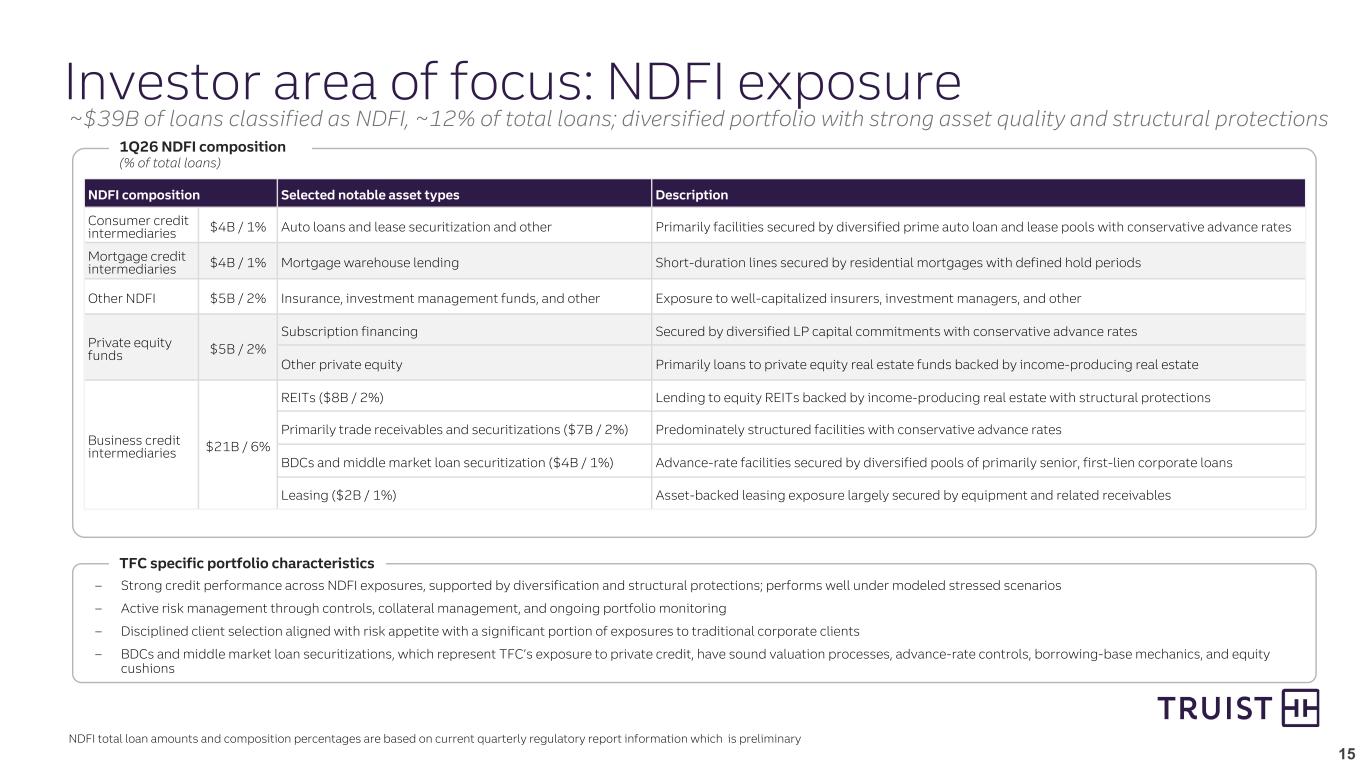
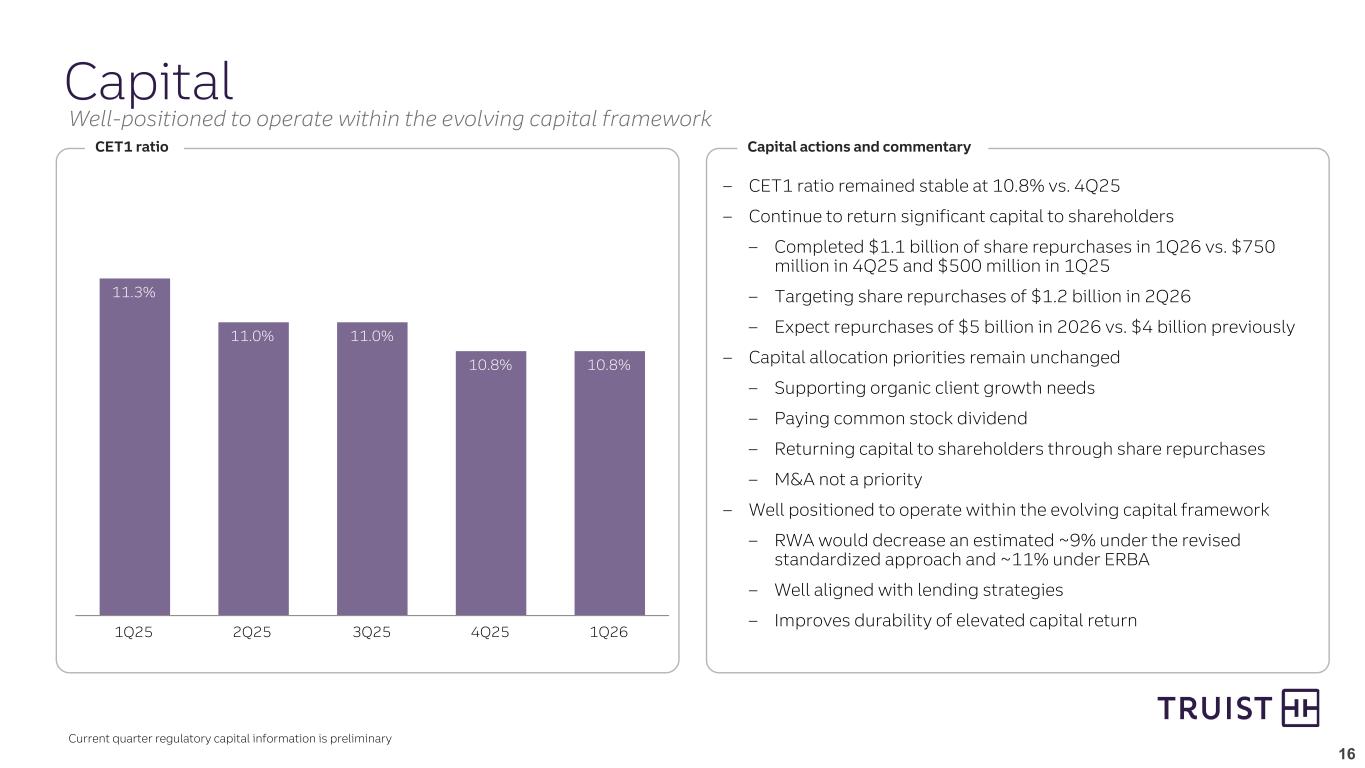
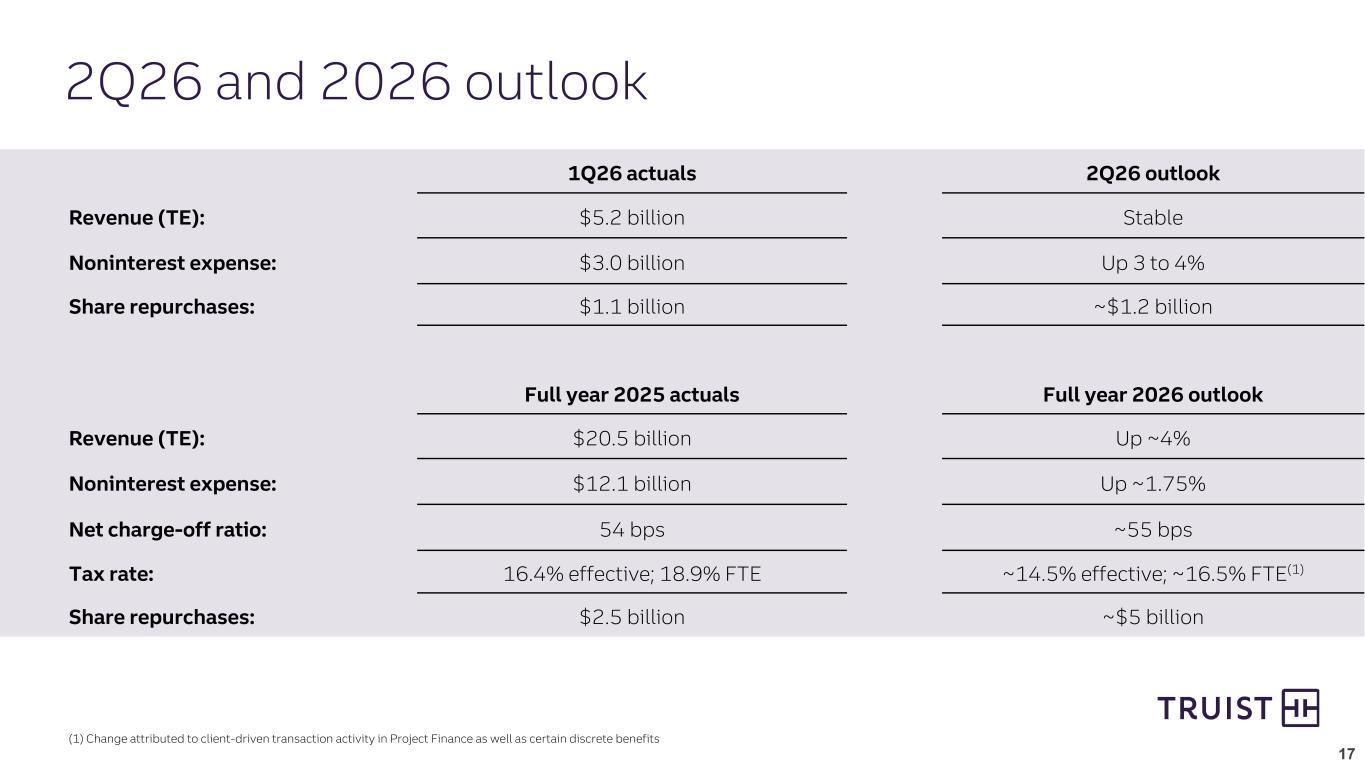
Thanks, Phil, and good morning, everybody. We reported first quarter 2026 gap net income available to common shareholders of $1.4 billion, or $1.9 per diluted share. Earnings per share increased 25% versus the first quarter of 2025, and we're up 9% versus the fourth quarter of 2025. Revenue decreased 1.9% linked quarter due to lower net interest income primarily related to day counts. Revenue increased 5.1% versus the first quarter of 2025 due to higher net interest income driven by strong loan growth and higher non-interest income primarily due to growth in investment banking and trading and wealth management income. Gap non-interest expense decreased 5.9% versus the fourth quarter of 2025 primarily due to other expense increased 2.6% versus the first quarter of 2025, which helped drive the 250 basis points of year-over-year positive. Our effective tax rate in the first quarter was 12.4% versus 17.9% in the first quarter of 2025. Approximately half of the year-over-year decline was due to increased client transaction activity in our project finance business that Bill mentioned earlier in the call. Next, I'll cover loans and leases on slide nine. Average loans held for investment increased $2.3 billion, or 0.7%, on a linked quarter basis to $327 billion, driven by 1.8% growth in commercial loans, partially offset by a 0.9% decline in consumer loans. End-of-period loans increased modestly linked quarter, as 1% growth in commercial loans was offset by a 1.1% decline in consumer loan balances. Both average and end-of-period loan trends are consistent with the expectations for loan growth and MIX that we outlined in January. As a reminder, our expectations for 2026 were that average loan growth would be driven primarily by commercial and other consumer categories, with relatively slower growth in residential mortgage and indirect auto. This outlook reflected our focus on profitability and being selective in where we deployed capital. Within consumer, average other consumer loans, which include our specialty lending businesses like Sheffield, Service Finance, and Lightstream, were relatively stable on a linked quarter basis, consistent with normal seasonal patterns. We continue to expect these portfolios to grow at a mid- to high single-digit pace in 2026, given their attractive risk-adjusted returns. Based on our current pipeline and economic outlook, we continue to expect average loan growth of approximately 3% to 4% in 2026. Moving now to deposits on slide 10. Driving client deposit growth is a key priority across many of our top businesses and growth initiatives, and I'm encouraged that we sell growth in client deposits in what is typically a seasonally weak quarter for client deposit growth. Average deposits increased 0.7% linked quarter, driven by growth and interest checking, partially offset by declines in all other deposit categories. Average interest-bearing deposit costs declined 14 basis points linked quarter to 2.09%, and average total deposit cost declined nine basis points to 1.55. As shown in the chart on the bottom right of the slide, our cumulative interest-bearing deposit beta increased from 45% to 46%, and our total deposit beta increased from 30% to 31% on a linked quarter basis. Moving now to net interest income and net interest margin on slide 11. Net interest income decreased 2.8% linked quarter, or $105 million, dollars primarily due to two fewer days in the quarter compared with the fourth quarter and seasonal changes in our deposit mix. Our net interest margin decreased by five basis points in each quarter to 3.02 percent driven primarily by that same seasonal change in the deposit mix. For full year 2026, we now expect net interest income to increase two to three percent compared with our prior expectation of three. The change in our outlook is primarily driven by our expectation that the federal funds rate will remain unchanged throughout 2026 compared to our previous expectation for two 25 basic point reductions, one in April and one in July. Our net interest income outlook still assumes 3% to 4% average loan growth and the continued benefit from fixed-grade asset repricing. Although we expect the net interest margin to remain relatively stable in the second quarter, we do anticipate the full year 2026 average net interest margin will exceed the 25 average of 3.03%. As you can see on the right-hand side of the slide, we also look in our SWOT disclosure. Turning now to non-interest income on slide 12. Non-interest income increased $7 million, or 0.5%, versus the fourth quarter of 2025, reflecting strong growth in investment banking and trading income and lending-related fees, largely offset by a decline in other income due to lower investment income. Investment banking and trading income increased $37 million, dollars, or 11% linked quarter, to $372 million, reflecting stronger trading income and capital markets activity, partially offset by lower M&A fees. Non-interest income increased 11.6% versus the first quarter of 2025, due primarily to the 36% growth in investment banking and trading and 7.6% growth in wealth management income. Next, I'll cover non-interest expense on slide 13. On the first quarter basis, non-interest expense declined 5.9%, driven by lower other expense and lower personnel expense. Other expense in the fourth quarter of 2025 included an accrual related to a legal matter, while the decline in personnel expense was driven primarily by lower incentives compensation. These benefits were partially offset by higher regulatory costs, as the fourth quarter of 2025 benefited from an FDIC special assessment credit. On a year-over-year basis, expense growth remains well-controlled. Non-interest expense increased 2.6% versus the first quarter of 2025, reflecting higher personnel expense, partially offset by lower professional fees and outside processing costs. Moving now to asset quality on slide 14. Our asset quality metrics remain strong on both a linked and like quarter basis. Net charge-offs increased four basis points linked quarter to 61 basis points, and we're up one basis point versus the first quarter of 2025. Non-performing loans held for investment increased two basis points linked order to 50 basis points of total loans, driven by higher consumer non-performing loans partially offset by improvement in C&I and CRE. The increase in consumer non-performing loans is primarily due to a change in the non-accrual criteria for certain indirect auto loans, which we disclosed in our 10K, rather than any deterioration in underlying credit trends. While this enhancement will result in higher reported not performing indirect auto loans over time, there's no impact to the cash flows or loss expectations over the lifetime earnings of these loans. Before I move on to discuss our capital position on slide 16, I do want to spend a few moments on our non-depository financial institution, or NDFI exposure, and how we think about the risk profile of that portfolio. To support that discussion, we've included expanded detail on our NDFI loan portfolio on slide is NDFI represented 12% of total loans. This is a well-diversified portfolio across 35 different asset classes, and it's structured with protections that have held up well historically in stress environments. Our largest NDFI exposure is to diversified equity REITs. This is a client driven business that we've been active in for more than 20 years, and it's an area where we have deep experience. These loans are secured by income producing real estate, underwritten with conservative leverage and supported by strong covenant packages, which helps mitigate downside risk. With respect to private credit, our exposure is primarily through lending relationships with business development companies, or BDCs, and middle market loan funds. In total, these exposures represent about 1% of our loan portfolio. From a risk standpoint, these facilities are underwritten with advanced rate limits, borrowing-based mechanics, and meaningful equity positions beneath us, all of which are designed to provide significant loss protection in more stress scenarios. Slide 16, the CET ratio was stable. During the first quarter, we repurchased $1.1 billion of common stock compared with $750 million in the fourth quarter. We are targeting repurchases of $1.2 billion in the second quarter and approximately $5 billion in 2026 compared with our previous expectation for $4 billion of repurchases for full year 2026. Overall, our capital allocation priorities remain unchanged. These priorities include supporting the organic growth needs of our clients, paying our common stock dividends, and returning excess capital to shareholders through share repurchases. M&A is not a priority for Truist as we remain focused on improving our own profitability and returning capital to our shareholders. We are well positioned for the recently issued Basel III proposal. Under the newly proposed capital rules, we estimate that risk-weighted assets could decline by 9% under the revised standardized approach and by 11% under IRBA. We believe that proposed changes align well with our lending strategies and support continued elevated capital return to our shareholders. In the second quarter on, we now expect 2026 net interest income growth of 2% to 3% compared with our prior expectation. On the other hand, we now expect stronger non-interest income growth this year, reflecting continued momentum across all of our fee-based businesses. We now expect high single-digit growth in non-interest income compared with our prior expectation of mid-to-high single-digit growth. In addition, we now expect full-year gap non-interest expense to increase approximately 1.75% in 2026 versus our previous expectation of 1.25% to 2.25% growth. Taken together, although we are modestly refining our revenue outlook to the low end of the by our 4% to 5% range, our overall earnings expectations for 2026. In terms of asset quality, there's no change in our, as I mentioned earlier in the call, driven transaction activity in our project finance business. We now expect our effective tax rate to a 16.5% on the taxable equivalent basis in 2026 versus our previous expectation 5% respectively. Finally, as it relates to buybacks, we're now targeting $5 billion of share repurchases in 2026 versus our previous expectation of $4 billion. In other words, despite the pressure we see in net interest income, our stronger non-interest income, increased share repurchases, and a lower tax rate from client-driven activity result in an overall earnings expectation for 2026 that remains unchanged. As a result, we remain confident in the EPS trajectory we expected in January and in our ability to achieve our 14% ROTCE target in 2026 and our 15% ROTCE target in 2027. Now, looking into the second quarter of 26, we expect revenue to remain relatively stable relative to the first quarter, revenue of $5.2 billion. We expect non-interest income to increase approximately 1% in the second quarter, primarily driven by an additional day, and increase client deposit balances. We expect non-interest income to decline approximately 1% linked quarter due to lower investment banking and trading income, partially offset by higher other income and card and treasury management fees. Non-interest expense of $3 billion in the first quarter is expected to increase by 3% to 4% linked quarter due to higher personnel expense. Consistent with our full-year outlook, we're targeting approximately $1.2 billion of share repurchases in the second quarter of 2026. Now I'll hand it back to Bill for some final remarks.
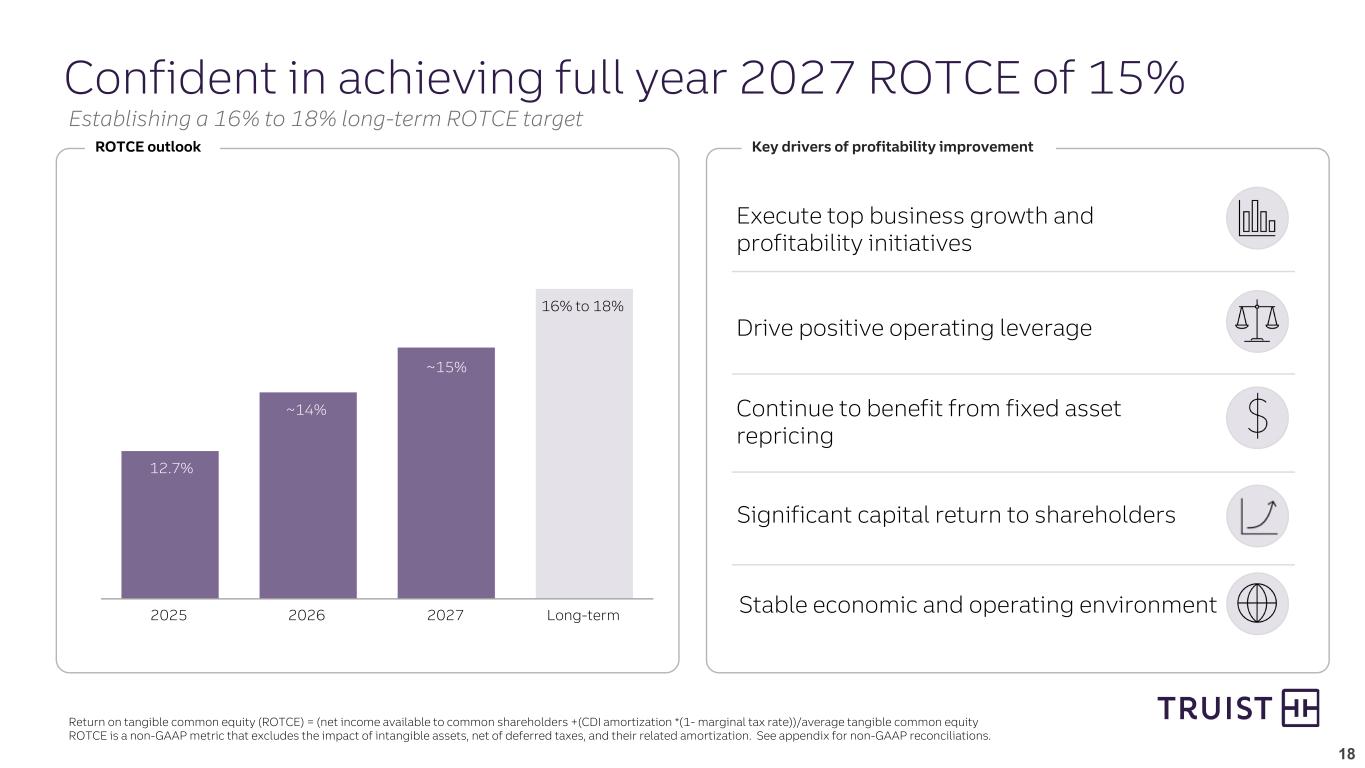
Thanks, Mike. To close, I want to reinforce the confidence I have in True's direction and earnings trajectory we're building. As shown on slide 18, we continue to have a clear line of sight of 14% return on tangible common equity in 2026 and 15% in 2027, driven by improving profitability, continued execution across the franchise, and strong capital return. As I mentioned earlier, our 15% ROTC target in 2027 remains a firm and achievable target. However, we view it as an important milestone, not the end point. With continued execution and discipline, we have the ability and clear line of sight to drive returns to 16% to 18% over the next three to five years as earnings power continues to strengthen and capital is deployed. Achieving these returns will be driven by the same core factors we've discussed today and on previous calls. These factors include sustained growth in our key businesses, positive operating leverage, discipline, expense, and risk management, and elevated capital return to shareholders. Overall, we're encouraged by the progress we're making, and we remain focused on executing with discipline, delivering for our clients, and creating long-term value for our shareholders. I want to thank our teammates for their commitment, focus, and their purposeful work, and thank our shareholders for your continued trust and support. Well, Brad, let me turn that back over to you.
Thank you, Bill. Betsy, at this time, will you please explain how our listeners can participate in the Q&A session? As you do that, I'd like to ask the participants to please limit yourself to one primary question and one short follow-up in order to accommodate as many of you as possible today.
Operator
We will now begin the question and answer session. To ask a question, you may press star, then 1 on your touchtone phone. If you are using a speakerphone, please pick up your handset before pressing the keys. If at any time your question has been addressed and you would like to withdraw your question, please press star, then 2. We ask that you please limit yourself to one question and one follow-up. At this time, we will pause momentarily to assemble our roster. The first question today comes from Scott Seifers with Piper Sandler. Please go ahead.
Morning, guys. Thank you for taking the question. Hey. Let's see, Mike, when you think about the rationalized NII outlook for the year, could you please provide just a little context regarding just more specifically how the lack of likely fed fund rates cuts impacts things, just hoping to understand, you know, is that just what it means likely for deposit cost leverage, or are there other factors involved? And maybe you can talk a little about the competitive environment, particularly on the deposit side, please.
Yeah, sure. Good morning, Scott. No, I think you said it. I mean, you know, we had cuts in April and July, you know, with both coming out of our outlook, you know, we've, I think, been pretty consistent about the fact that we're positioned liability sensitive on the short end, and so a little bit of pressure there that came through, and frankly, the second part of your question is probably the other contributing factor, which is, you know, it is competitive. I think, you know, with rates, where they are, we're seeing a little bit more rotation on product. We're seeing a little bit more yield-seeking and rate awareness in the probably not unexpected, you know, given the expected path on rates. I think the good news, Scott, you know, just to say, and we mentioned this in our prepared remarks, you know, we are seeing great momentum on the fee side. And so, I think, you know, end of the revenue guide and, you know, that couple, you know, we're seeing the bottom line still in line with our January expectations.
Yeah, perfect. And then on that last point, you know, it's basically the pace of repurchase step up in the first quarter as well as the higher expectation for the year. Maybe you could talk a little more about that decision. You know, how much would you say is sort of confident in your own outlook versus just sort of panning in the risk-related asset relief you'll get from the Fed's new proposals?
Attribute the increase from $4 to $5 billion to the Basel III proposal. I think that will have an impact in terms of, we mentioned the durability of, you know, into 28 and maybe beyond. We'll need to see where the rule finalizes. This was more of a follow-through on, you know, how we've been thinking about capital management in 26 and 27. You know, we're targeting that 10% CT1 level in 27 as, you know, the various moving parts that you would expect to contribute to capital planning that just retrended the buyback.
That's perfect. So, thank you guys very much.
Operator
The next question comes from Ken Usten with Autonomous Research. Please go ahead.
A follow-up to that longer-term 16 to 18 ROE. Just wondering, you know, you just talked about the kind of capital part and what that might look like. How do you think the ROAs projects as you think about that new 16 to 18 and how much, you know, extra that might be, you know, on top of the – once you get to 15?
Hey, good morning, Ken. I'll start there. Look, I think as you think about the 16 to 18 percent over just that extended horizon, right, I think we've got a lot of confidence based on a lot of the areas that Bill mentioned in his remarks in terms of the areas where we expect to improve profitability, right? Client deposits, we expect our margin to improve, our fee business, those same factors are going to contribute to that next horizon, the three to five-year outlook of 16 to 18%. I see our ROA profile, you know, moving closer to, you know, call it 120 in that sort of 27 outlook, and I think it creeps a little higher, you know, from there.
Yeah, Ken, I would just add, you know, I think the 16 to 18 is a mixture. You know, Mike talked about, you know, just accelerating our growth in fees, expanded NIM, you know, margin, client deposit growth, you know, optimizing the balance sheet, you know, benefits, prudent capital allocation, more durability in our return on capital. Think about things like that for us, you know, the HTM pulled apart. And then just efficiencies in our business, you know. So not only is it a, you know, ROA story, but it's also an efficiency story. I mean, I think that we're, you know, we're seeing some of the benefits of things like AI, but in fairness, just the process improvements that we're making that we can, you know, redeploy for growth and also harvest for profitability.
And second question on investment banking, a really solid result this quarter. I know, Mike, you talked about the second quarter a little bit, but just can you talk about the different sides of the business? What was the driver's IV versus trading? And then just how you're seeing the environment and customer confidence in terms of transaction willingness, thanks.
We had broad-based strength, you know, this quarter, you know, and especially on a light quarter basis, you know, you saw outsized performance in trading. But I'd say, you know, we're seeing really good activities across, you know, the core banking business as well as trading. If you think about our outlook for the year, you know, I think at one point we were thinking about kind of mid-teens growth. I think it could be higher than that. You know, high teens, maybe even 20% across that full line. A lot of that is trading, you know, year over year. But we expect double-digit growth in what I think of as like the traditional investment banking business. And it's broad-based, you know.
And I mentioned my comments. I think one of the things I'm probably most excited about is just connectivity to our core franchise. I mean, I think that's a bit of our secret sauce in the investment banking business. You know, the fees from our commercial and wealth businesses were up actually substantially, and the pipelines are up substantially as part of that. So it feels, and the confidence, you know, that we talked about, it just feels more durable, you know, and feels more sustainable to the franchise.
Operator
The next question comes from Erica Najarian with UBS. Please go ahead.
Yes, thank you for taking my question. You know, Bill, this one is for you. I guess I'm wondering, you know, why unveil today a new long-term ROTC target? You know, fully realize that, you know, you have the Basel III reform coming, you know, but you also, Mike also mentioned that wasn't a factor in the repurchase. So I guess is there something in the ROA profile that you saw, you know, accelerating or improving that gave you the confidence to unveil a new Rossi target today?
Yeah, I mean, I think, Erica, you know, you and others have asked us a lot. Is 15 sort of the, you know, the end point or is it a point on the journey? And I think, you know, one, we feel confident where we're going. You can see this quarter's results, and we feel confident in the momentum that we're building. Quite frankly, the Basel III is a component, so we wanted to answer that question as well. sort of how does that fit into this piece. And, you know, as Mike highlighted, you know, it's pretty beneficial to our balance sheet. You know, it's beneficial to how we do business. And so our ability to redeploy capital as it relates to that is part of it. So I think it's a variety of things. We thought it was important to start putting a stake in the ground for you as your constituency, for our shareholders, and for our teammates. And we just feel really good about the momentum we're building.
Coming to that, Eric, I mean, in fairness, we didn't really have a long-term target out there. You know, the 14% and 15% ROTC targets really are short-term. And I think Bill presented a target. I think, you know, having clarity on the evolving capital framework contributed to that. But really, I think it's the confidence in the business that we're in, in the momentum that we're seeing in the businesses. So really all three of those factors contributed to our decision to provide a new target.
Thank you. And my second question, you know, we have to ask because obviously Truist was in the news a few weeks ago. There was a Bloomberg article essentially speculating that you could potentially be attractive to another partner. And I know you just put a stake in the ground, so clearly you have a, you know, a view of your future that's bright. You know, at the same time, your market cap to core deposits is quite low relative to your peers. And, you know, looking at your board, you have some heavyweight financial institution veterans on your board. You know, Bill, I guess like, you know, this is sort of a free-flowing question. You know, what are your thoughts on, you know, that, you know, monetizing your business?
Yeah, I mean, Erica, you know, we've all been at this a long time, and, you know, to ask me to speculate on some rumor and some, you know, article, which, by the way, has been refuted, I think, pretty solidly by the person, you know, identified in that. So, let's just, like, put that aside. Now, how do we feel about our business? You know, I think we feel great about our business, and we feel great about the trajectory that we're establishing. You know, we've sort of set forth, you know, a plan that achieves mid-teams EPS growth over an extended period of time under a really good risk posture. I think that provides an advantage return to our shareholders, and, you know, that's always going to be the goal is let's make sure we have a plan that gives an advantage return to our shareholders. And that's the 100% focus of our board, myself, and our team.
Operator
Thank you. Sorry to ask. The next question comes from Manan Gonzalez with Morgan Stanley. Please go ahead.
Hi. Good morning. Still a question for you on the ROTC target. I know you laid it out as a three- to five-year target, but as we think about that 15% number for next year, do you need to see the benefit from the lower capital requirements come through before you get to the lower end of that longer-term ROTC target, or, you know, can we continue to see some improvement both at 15% as we get into 2028 and beyond?
Yeah, I mean, if the question is, the 15% was established without any regard to Basel. So if that's the question, that's how we establish that goal. And then the 16% to 18%, you know, starts to take a first, you know, sort of nibble at that in terms of how we might deploy capital and confidence in how we would use capital to continue to grow our business. But as Mike highlighted, it's really about our, you know, just accelerated, you know, confidence in our business, you know, our ability to improve margins, accelerate growth in fees, and continue to stay on the trajectory that we've already established. So the 15 was established under sort of, I would say, non-Basel, and then 16 to 18 has some incorporation, but more in terms of how we would utilize the capital against our strategies. Does that make sense?
Was that the question? Yeah. It sounds like it's coming from both the numerator and the denominator as we go out beyond 2027. 100%.
Absolutely. And I would just add, you know, the Basel impact, while, you know, as a contributing factor, is not the majority of the benefit that I think we'll see over that period. It's going to be more capital-efficient revenue. It's going to be a more efficient balance sheet, efficiency productivity. So, it really – we're focused on the numerator and the denominator. I'm glad to have both, but I have a good line of sight to operating in that area.
Got it. And just as my follow-up, as we think about net interest margins, Mike, you noted some yield-seeking behavior and more competition on the loan side. I guess, how are you thinking about that three-teens level on NIM going forward?
Yeah, I think, you know, so we still feel good about getting to, you know, a three-teens net interest margin. I think without the cuts this year, you know, we won't get there by the end of the fourth quarter, which is what we said we'd be able to do in January. And, again, I attribute that to the rate path. I think current curve this year, you know, is not likely to happen. got it thank you we will see by the way just to clean it up you know we we will see our net interest margin continue to expand throughout the second half of the year so you know we get a little bit of benefit in the second quarter from some seasonality on the CSBB side on some deposits which show up in the third quarter and then we have good seasonal patterns in the fourth quarter as well around public funds plus the other factors I mentioned so you will see us after kind of a stable Q2 expand, and we do expect for the full year to have a net interest margin better than we had in 2025. We just won't get to that three-teens exit rate as we see it right now.
Great. I appreciate the color. Thank you.
Operator
The next question comes from Mike Mayer with Wells Fargo. Please go ahead.
Hi. You mentioned an increase in yield-seeking behavior among customers for deposits. And I guess everybody loves your markets, obviously. And, you know, they're moving there, they're vacationing there, and all the banks are opening up branches and hiring bankers. So I ask this question every quarter. It just seems like it continues to pick up. I know you'd say none of this is new, you're used to that, but just see if you reach the next level. I think you have, like, the truest one, checking sign-up bonus. So, I guess my question is, what's the temperature on the degree of competition? How much are you using kind of marketing expenses, such as, you know, paying customers to move their accounts? And what impact is it having? Thanks.
Yeah, Mike, you know, it is competitive, as we've noted. And, you know, we're seeing, you know, that show up from people who've moved into our markets. And they're coming to our markets for the right reason. You know, our markets grew net migration by almost 300,000 in last year. And Charlotte, as an example, grows by 150 people a day. You know, so we see and feel that in-migration into our markets and the competitive nature of that. On the deposit side, you know, we also grew net new. You know, so that's an important barometer that we look at. So first quarter, again, grew net new. That's a critical barometer for us. It's sort of like in the are we winning category. Yes, we use marketing tools like everybody else does. Yes, we use incentives for, you know, for clients to join us. But you also saw the, you know, really good production in the places that we're emphasizing. So think about our Premier Banking. Production was up 20%. Premier is a bit of a place where we just started leaning in the last couple of quarters. So we're starting to see the real benefit of very focused, very targeted, you know, deposit production. And then we're seeing deposit production outside of our core franchise. So if you look at sort of our overall deposit production, we talked about this earlier, as you know, it's up pretty significantly outside of our franchise, core franchise. So, you know, not only are we competing, we're also, you know, on the offensive side in lots of places. But as Mike noted, rates higher for longer is a tough operating environment for deposits. And what we look at is are we creating net new? Are we growing our business with new clients? And we see that both in the wholesale and the consumer side. So while the profitability of those clients is less today, the fact that we're adding them is a good harbinger for profitability in the future.
Okay, so planting seeds for the future. And just to follow up to your answer to the other question, I wasn't sure on the exact answer about what is Truist, under what conditions would Truist consider, say, another merger of equals? Under what conditions would Truist consider selling to another bank? Under what conditions would Truist consider buying another bank? And this topic does come up, not just in the press, but with investors, as you know. So, and, you know, as you said, 60 to 80 percent ROTC with a lower risk profile over three to five years. It seems like you have a game plan. Having said that, the question does come up. And also, Bill, you sound like you have a lot of energy, as we hear you right now. But, you know, what's your plan to stay on? How long is there a mandatory retirement? I forget. And succession and that whole kind of big question.
So, Mike, you're just going to go after all of them. Well, let's go down it. So, on the succession side, I've got a great job leading a great purpose-led company. You know, we've got a great team, incredible teammates, strong leadership team, businesses hitting on more cylinders every day towards our performance and return objectives. and just be confident that our board has a strong succession process and they can apply against this incredible framework. So just, like, put that one in that category. We've been really clear on the M&A front, Mike. I mean, I don't know how to be more clear that that's just not a priority for us. So, I mean, I'll just say it one more time. And to your, you know, part of your question is part of the answer is we've got a great plan. You know, we've got a really strong plan. I think this quarter is, you know, one more evidence of the fact that we're executing against that plan. We have an opportunity to deliver, you know, return to shareholders that I think are advantaged, and they're advantaged, you know, given where we're coming from, given the growth that we see. And, look, that's going to be the goal is, you know, how do we maximize this franchise? How do we create, you know, advantaged shareholder value? And that's the focus every day. Again, for me, my team, the board, and, you know, our incredible teammates.
All right. If I can squeeze one more, you're a poor investment banking business growing double digits, even without trading. That seems to be much faster than peers your size. I'm not sure why you're growing so much faster than others there.
Well, a couple of things, Mike. I mean, I think, one, we've been at this for a long time. You know, so, you know, this is a, you know, multi-decade build of our business. And as I mentioned in the earlier answer, is this tie into our franchise? So, this isn't a separate business that's, you know, just, you know, solely market dependent. We really have incredible bankers, you know, on the field right now that really understand how to utilize the skills, the advice, the industry specialization, the products for all of our commercial, corporate, and middle market clients. So I think the, you know, the confidence that we have not only in the future, but a bit of the, you know, you noted the excess, you know, performance is really tied to this durability of our franchise. And this is a culture that we've built over decades. This is why teammates want to come be part of this investment banking business and be part of our core corporate and middle market business. They want to come here and be part of it because they can see that opportunity, and it's manifesting itself in the results.
I mean, the consistent pattern, Mike, for IB is that we're playing more meaningful roles in even larger transactions. So you've got some leverage there, too, just as we continue to bring great talent to the platform and are, again, are earning, again, more. All right.
Operator
Ladies and gentlemen, to accommodate all questioners, we ask that you limit yourself to one question. The next question comes from Matt O'Connor with Deutsche Bank. Please go ahead.
Okay. Good morning. Liz, just helping to dig into the loan growth a little bit. I guess, you know, first, why didn't we see a little bit more on the commercial side this quarter, and, you know, why not more optimistic on the year? And is there some kind of loans that are being fed through kind of the banking network instead as we just think about kind of the business holistically?
Yeah, sure, Matt. If you look at the commercial corporate banking business, it's up a little over 8% year over year and a little under just under 2%. So we got good momentum in the places that we're emphasizing. And what I really like about it is our team is really focused on the return side. So 22% more new relationships, 60% of payments and business associated with it. You know, it's a higher quality, you know, so as we enter into the, you know, a risk profile, it's a higher quality. The revenue per client's higher. So I see this, you know, investment in the future. And then we're seeing really good activity in, you know, other markets, Texas, Pennsylvania, Western, you know, Western PA, Ohio. So I think our model is actually resonating really well. I think our teams are focused on the right things, on, you know, higher returning, more fulsome relationships where we can play a lead in more meaningful roles. So, you know, maybe our at-bats are a little smaller, but our batting average is really high, you know, so we're winning where we want to win. And then on the consumer side, you know, there was some intentionality on that side. So some of the places that have lower returns, I think indirect auto, spreads have tightened pretty significantly there. That's an area that we've throttled back a little bit. But our core consumer businesses, so think Sheffield, Lightstream, Service Finance, you know, that's up, you know, seven and a half plus percent over like average balances are And remember, that has a seasonality to it. So the production in those businesses, remember, if you think about power equipment and HVAC and all that, production will go up 30 to 50 percent here in the next couple of quarters. So I think we're actually positioned in the right place to be focused on higher returning businesses that, you know, achieve really good return for us. And pipelines are strong, you know. And, again, pipelines in the businesses, in the places where we think are most important to win and achieve the best return long-term for our shareholders.
Operator
The next question comes from Ibrahim Sunawala with Bank of America. Please go ahead.
Good morning. I just wanted to follow up, Bill. I guess with all the questions, and just from a stock standpoint, I think you said you've got a great plan, strong momentum, just as you talked about the businesses. Correct me if I'm missing something. When you look at the revenue growth outlook for the full year, 4%, expenses, whatever, up 2%. Is that the algo, or do you think this bank should be doing much better than 4% in a nominal GDP world of 3 to 5? Just how do you put sort of the medium-term growth outlook for the company, and is 4% the right way? Because I think part of it is, you've got the scale, you've got all these businesses, shouldn't you be doing better in an environment which seems generally constructive? Thanks.
Yeah, I think what you're seeing is that building over time, right? So we're hitting on more cylinders, so, you know, that growth and revenue continues to increase. You know, as it relates to this specific, you know, outlook, I mean, we took a posture that we looked at the forward curve and took a, you know, view that that's, you know, going to have an impact on NII and wanted to reflect that. But if you look at the momentum in terms of new clients, the activity, the fee businesses, the things that are going on, I think we'll continue to sustainably build that business and sustainably build it with a, you know, a more positive and continued operating leverage. And you see it, and you see it in this quarter. And you see it in our confidence in establishing that in a longer-term goal. And that was the purpose of doing that. I said, you know, we'll continue to improve, continue to hit on more cylinders. and I think every day it better reflects the opportunity that's our franchise.
Operator
This question comes from John Pencari with Evercore. Please go ahead.
Good morning. Just on the – back to the deposit side of the equation, can you maybe just update us on your growth expectation there and then the areas of, you know, what businesses that you're really focusing on I know deposit generation on the core side has been an intensified focus for the bank this year. And if you could talk to us about that progress you're making in remixing the deposit base. And then just lastly, what is your updated rate sensitivity to moves along the curve?
Get the first and the third and maybe let Bill throw out a little. I think, you know, we are, we feel fine about that, very focused on mix as well. The new baseline, right, we've got relatively neutral.
Yeah, and then, you know, in terms of the focus areas, John, so the, you know, I mentioned before the premier production, which is really strong, net new, which is good. And then overall, like in our middle market business and across wholesale, we've had a really significant increase in their activity and deposits. Sixty percent of our new business has a mandated component to it. So while some of those are, you know, more interest-bearing at this point, I think it's indicative of the quality of the relationship and ability to improve the profitability on that going forward. And so I feel good about the momentum that we've established in the wholesale side and the consumer side. I think today getting new clients is actually really important, and I think our engine is firing on a lot of cylinders, and the profitability of that, certainly from the deposit side, will improve over time.
Operator
The next question comes from Gerard Cassidy with RBC. Please go ahead.
Good morning, gentlemen. Thank you for the added disclosures on the NDFI. And everyone is obviously giving us better disclosures, which is great. So the question is, there's really no concerns, I don't think, today about credit losses and the way the loans are structured, as you described in your disclosure, suggests that even in a downturn, losses might be limited. But I guess, and you guys have done credit well through the cycle, so from your perspective, can you share with us, in a downturn, what are the real risks in this portfolio for you folks, again, in a normal recession, normal credit cycle, where we know everybody's going to have higher credit issues?
I appreciate the question. So I think, you know, first for us, we start with really strong relationships with solid bankers covering these asset managers and the clients. And then, as you noted, the structural protections that exist, particularly in the BDC or the private credit section, that middle market, you know, our advance rates are sort of in that 60% to 70% range, and so we have significant protection in there. So we've also modeled this in a stressed environment, and this overall actually performs better than our aggregate C&I portfolio. And so we're confident in where we sit today with how we've underwritten these credits and how we manage and monitor them. As you know, they have regular collateral inspections, strong borrowing base, so we're confident in where we sit downturn. You would watch what happens to the underlying companies and their performance. Great.
Operator
The next question comes from Saul Martinez with HSBC. Please go ahead.
Hi. Thanks for closing me in here. I wanted to follow up on the investment banking outlook. Good quarter, high-team growth expectations, which is off of maybe some easy comps off of the first half of last year. But I wanted to ask just about your confidence in sustaining double-digit growth beyond 2026. What drives that? Which products? Is it ECM? Is it advisory? And how are you thinking about the growth there? And just as a clarification, when you say double digits, are you talking about core investment banking or investment banking and trading, the trading line as it's presented in the consolidated income statement?
I'll take the easy one first. When I said double digits, I was talking about this. And, you know, as we think about, you know, the sustainability of double-digit growth, you know, this business for us has been a high single-digit, low double-digit grower. obviously, you know, a transaction activity and marketing plot, but it has been, you know, consistently performing in that range. So, and I think for the foreseeable future, we're going to continue to invest in the business, continue to, you know, hire great talent. We feel like we've got the products that we need to win and to serve our clients all along the spectrum in the industries that we're focused in, but we're constantly finding, you know, new and other ways to serve those clients as well. So, for us, it's a growth business, and I think an expectation for high single-digit, low double-digit growth is appropriate.
Yeah, and you mentioned, I mean, this is a broad-based, which is really good. I mean, the sense that we've got a strong equity capital markets business and a, you know, FRM business, and we talked about project finance earlier in the call. You know, our debt capital markets has been a strong contributor for a long time. I think M&A will be a bigger part of the growth going forward. We've invested a lot in that area. And, again, back to this tie-in to the franchise. The other part is we've got our corporate and middle market banking teams, about 23% of them are new to the platform. And so they came to this platform to leverage these capabilities and products. So, you know, what we're seeing is their productivity is really high, and that gives us more confidence in the future of where we're going. We've added good teams in the investment banking side. The specialty areas that we've chosen to specialize in are strong. Pipelines are strong. Now, quarter to quarter, there'll be volatility. So we all know that. I mean, there'll be volatility quarter to quarter. But our overall confidence in the business is predicated, again, on a multi-decade organic strategy. Remember, I mean, we built this business organically, sort of one step at a time, adding teammates and creating product and capability, you know, along the spectrum to build this momentum going forward.
Operator
The next question comes from Chris McGrady with KBW. Please go ahead.
Oh, great. Thanks, Courtney.
Mike or Bill, I'm interested in the operating leverage narrative over the three to five years that you lay out for your new targets. I'm interested in, does that get easier? Does that get, you know, perhaps more challenging? And what role does AI in investing in the company play in that? Any kind of color of the grid?
Yeah, good morning, Chris. Look, I do think that we're going to be able to continue to drive positive operating leverage over that horizon. You know, there are, you know, I think it was maybe Ibrahim's question a moment ago about, you know, revenue growth. You know, there are natural accelerants, whether it be, you know, the under-earning, you know, in our NIM. You know, Bill mentioned the bond portfolio. We've got sort of natural fixed-rate asset repricing that's happening. We've got more focus and rigor around capital allocation and portfolio construction. So, I think we feel good about the top line. And then to your point around, you know, tools like accelerants like AI, you know, I think will play a role in that. I think too soon to necessarily in establishing.
I think as you noted, Chris, I mean, I think AI is going to play a really big role and give us a lot more flexibility. Flexibility in terms of reinvesting in the business or, as I mentioned earlier, harvesting for profitability. So we've – we're pretty – we're far down the process. We consolidated our tech and ops units for a specific reason so people can look at process sort of end-to-end. We're seeing, you know, significant improvements and opportunity. And as Mike noted, I mean, we're just starting. I mean, I think this is a significant opportunity for industry as a whole. And I think we've got a great team on this and looking at the ways that we can expand our client business, improve efficiency, make this a great teammate experience, and benefit shareholders along this path.
Operator
Last question today comes from David Chivarini with Jeffrey. Please go ahead.
Hi. Thanks for taking the question. So, it sounds as if the pricing pressure is more on the deposit side versus the loan side. Can you talk about the loan pricing environment and how spreads are holding up?
Yeah, I'd say, you know, credit spreads have actually remained relatively tight, you know, despite all that's happening in the world. And so, that's been a little bit of a head-scratcher. You know, as you look at our yields, you know, you've got a lot going on, right? You've got some remixing. We're expanding our corporate and commercial banking business, so you might see a touch of mix in yields. You might see, you know, obviously, you know, spreads across the board still as well.
Operator
So, you know, that concludes our question and answer session. I would like to turn the conference back over to Brad Millsaps for any closing remarks.
Thank you, Bessie. That completes our earnings call. If you have any additional questions, please feel free to reach out to the investment relations Thank you for your interest in Truist. We hope you have a great day. Betsy, you may now disconnect the line.
Operator
The conference is now concluded. Thank you for attending today's presentation. You may now disconnect.