Operator
Welcome to the Vestis Corporation Fiscal First Quarter 2026 Earnings Conference Call. At this time, all participants have been placed in a listen-only mode, and the floor will be open for your questions following the presentation. If you would like to ask a question at that time, please press star 1 on your telephone keypad. If at any point your question has been answered, you may remove yourself from the queue by pressing star 2. To enable others to hear your questions clearly, we ask that you pick up your handset for best sound quality. Lastly, if you should require operator assistance, please press star 0. I would now like to turn the call over to Stefan Neely with Phallum Advisors. Please go ahead.
Thank you, operator, and thank you all for joining us on the call this morning. Leading the call with me today is Jim Barber, President and Chief Executive Officer, and Adam Boehm, Interim Chief Financial Officer. Also with us on the call today is Bill Seward, Chief Operating Officer. Jim and Adam will provide prepared remarks, and then we will open the line for questions. Before I turn the call over to Jim, I want to remind everyone that today's discussion contains forward-looking statements about future business and financial expectations. The Private Securities Litigation Reform Act of 1995 provided the safe harbor from civil litigation for such forward-looking statements. Actual results may differ significantly from those projected in today's forward-looking statements due to various risks and uncertainties, including the risks described in our periodic reports filed with the Securities and Exchange Commission. Except as required by law, we undertake no obligation to update our forward-looking statements. Further, this call will include the discussion of certain non-GAAP financial measures. Reconciliation of these measures to the closest GAAP financial measure is included in our quarterly orderings press release and corresponding supplemental materials, which are available at ir.festus.com. With that, I'd like to turn the call over to Jeff.
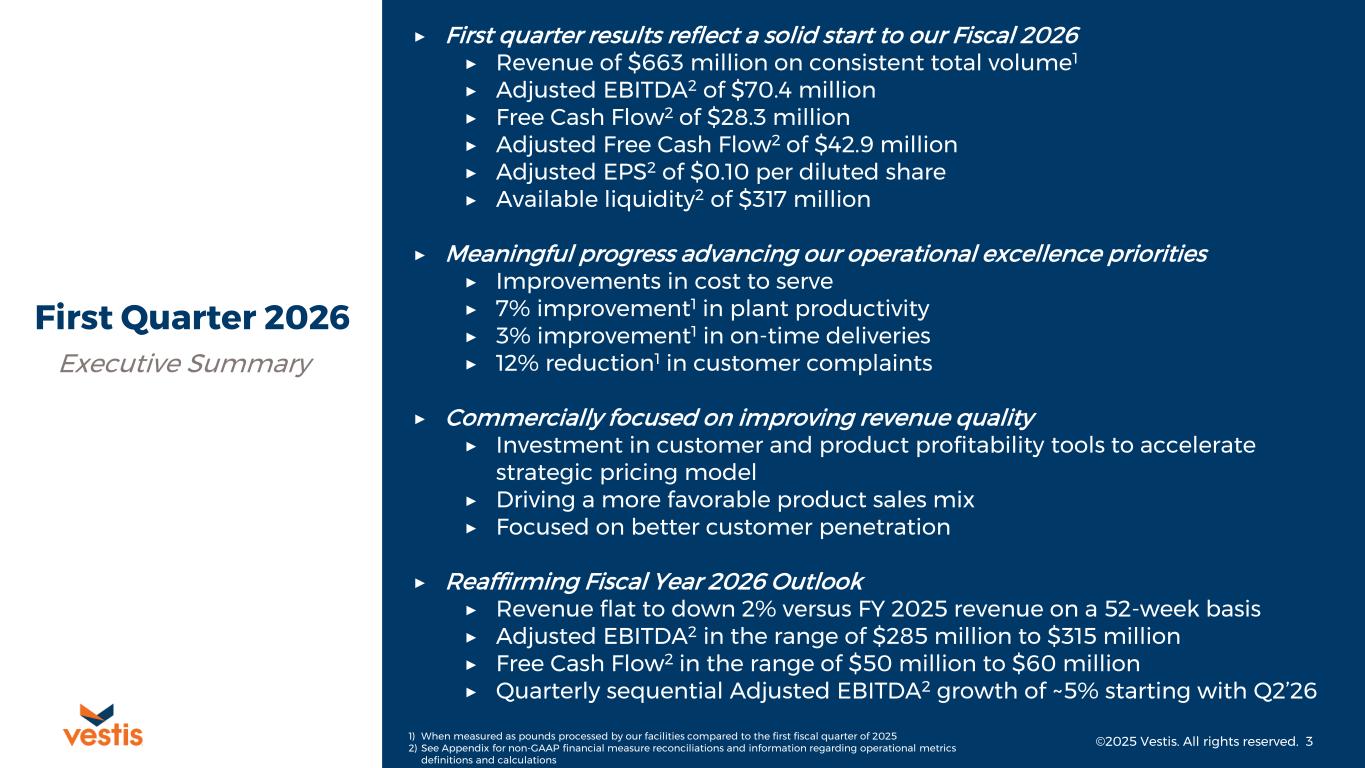
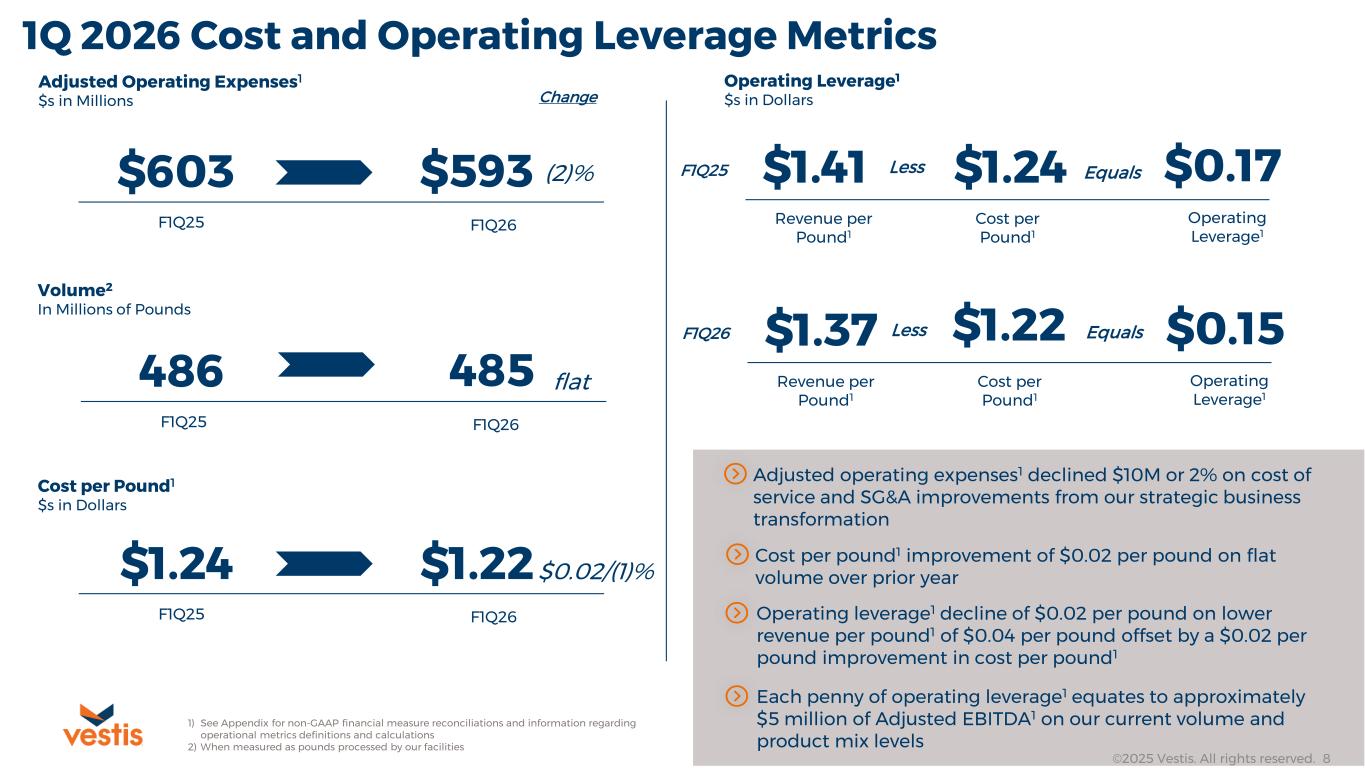
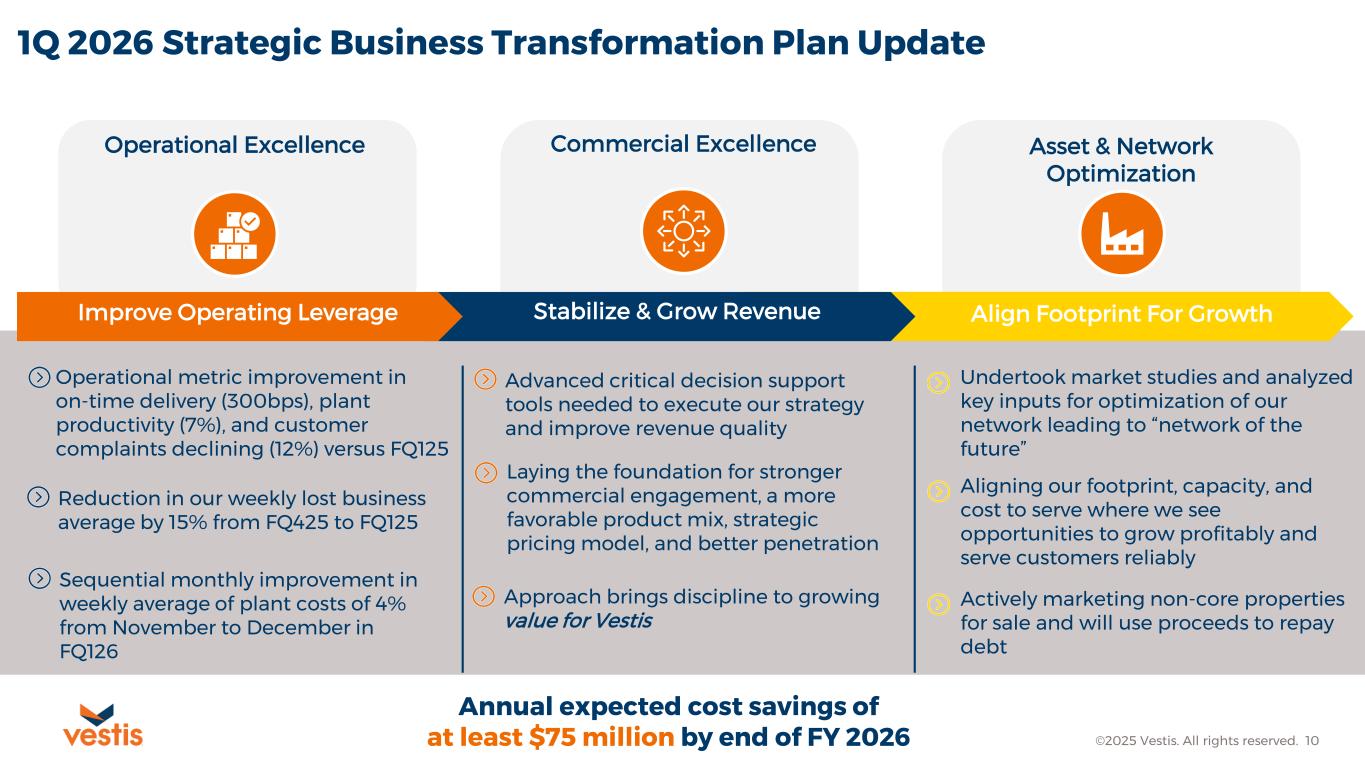
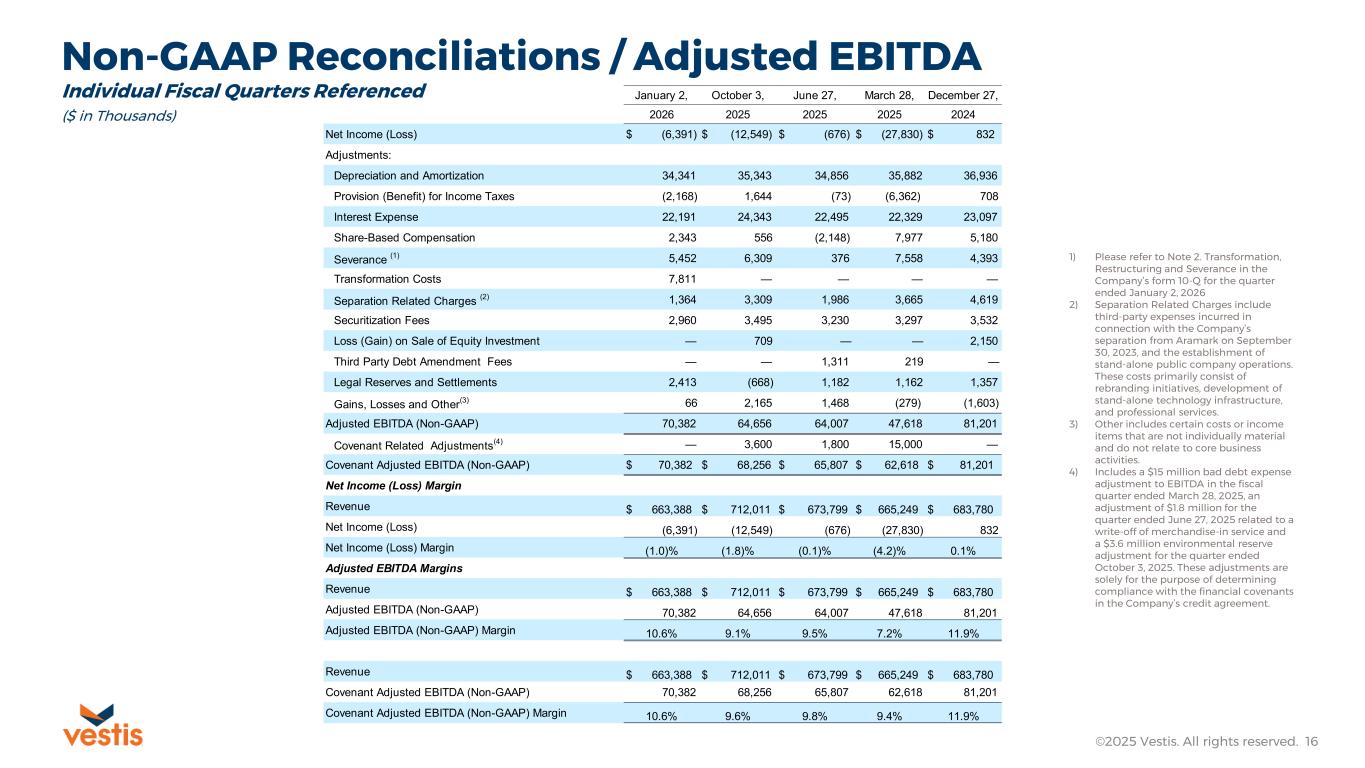
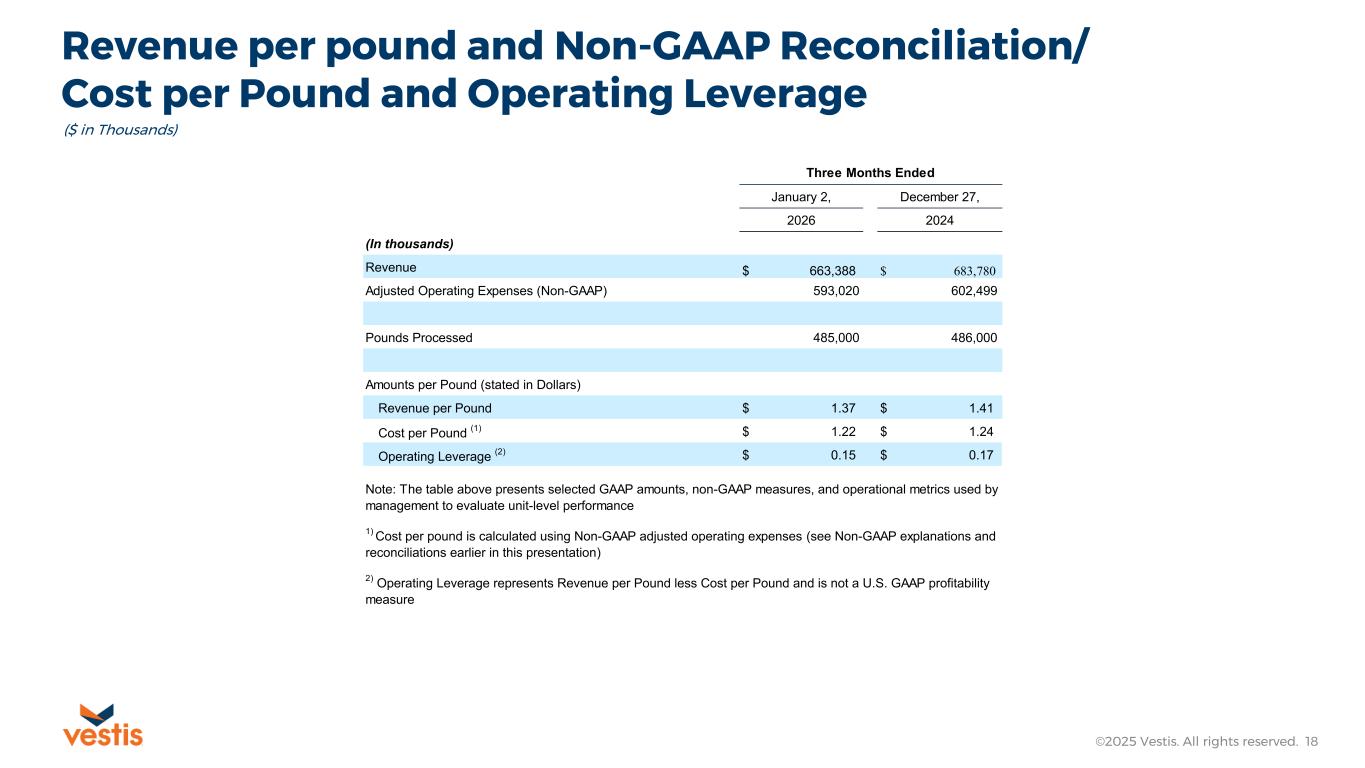
Thank you, Stephan, and good morning, everyone. Thanks for joining us. We started fiscal 2026 with disciplined execution and a clear focus on our business transformation framework. I want to walk you through what we've accomplished in the first quarter across our three pillars, operational excellence, commercial excellence, and network and asset optimization. Before that, I want to briefly touch on the financial performance for the quarter. Adjusted EBITDA was $70 million, improving sequentially from fiscal Q4 2025, which represented a low point in our profitability. This improvement is exactly what we set out to achieve with our transformation, reflecting early, tangible progress from actions to bend the cost curve and drive better utilization of our people and our network. Now turning to the first pillar of our business transformation, operational excellence. In a route-based, asset-intensive business like ours, operational excellence starts with the basics, consistent service and a network that runs reliably every day. When we execute well in our plants, we improve productivity, enhance service quality, and unlock operating leverage across our network. In the first quarter, we made progress in the leading indicators that matter most to our customers. On-time delivery improved 300 basis points versus the first quarter of 2025. Plant productivity improved 7%, and customer complaints declined 12% year over year, and our average weekly loss business in Q1 declined 15% from the fourth quarter. These are not just statistics. They are leading indicators of operational efficiency and profitability. We expect the benefits to show up in the customer retention, lower cost per pound, and stronger operating leverage. This is the kind of progress that builds momentum because when the network runs better, we can serve customers more reliably and create capacity for the right growth. going forward operating leverage is going to be our primary scorecard for value creation in the first quarter we saw a two cent improvement in cost per pound over fiscal q1 2025 which translate to roughly 10 million dollars in adjusted EBITDA at our current volume and mix levels we expect to see continued improvement in this trend throughout the year and let me be clear This is not a one-quarter effort. This is about building repeatable processes and a culture of accountability that produces better performance quarter after quarter. Given our operational priorities, I've asked Bill Seward, our Chief Operating Officer, to join us today, and he's prepared to provide additional context on our operational execution and key priorities in response to your questions after the conclusion of our prepared remarks. Moving on to the second pillar, which is commercial excellence. In the first quarter, we advanced the decision support tools we need to execute our strategy and improve revenue quality. This work lays the foundation for stronger commercial engagement, a more favorable product mix, a strategic pricing model, and better customer penetration. We've also begun strengthening local customer engagement, including the introduction of market development representatives to help deepen relationships and expand penetration over time this approach brings more discipline to how we grow and how we create value helping our team make informed decisions on mix pricing and how we serve customers shifting the organization to growing value for bestest the third pillar is networking asset optimization during the first quarter we undertook market studies and analyzed where we see the best opportunities to grow profitably and serve customers reliably over time in addition we are actively marketing several non-core properties for sale as part of optimizing our asset footprint and we intend to use those proceeds from any non-core property sales to repay debt stepping back the key takeaway from the first quarter is that we're improving operating consistency while building the analytical foundation required to make better commercial and network decisions that is how we expect to unlock the operating leverage that's embedded in this business we've also taken steps to connect deeper with the decision makers driving actions across our business for the first time since going public we've assembled a comprehensive training program delivered in person here in our corporate office to educate our key leaders on operating leverage as we look to the second quarter we are beginning to advance pricing and product mix strategies building directly on the operational progress already underway we'll continue to manage the business through the lens of cost per pound because that's where the operating leverage will show up most clearly with every penny of improvement and cost per pound being worth approximately five million of adjusted evita on our current total volume and mix levels and while we're encouraged i'll emphasize Besides this, we are still early in the transformation. We're laying the foundation now so we can drive more consistent value creation over time. To wrap up, I'm pleased with the progress we've made in the first quarter. Going forward, we're managing Vestas as a pennies business. The compounding effect of small, disciplined decisions on mix, pricing, delivery, plant, and SG&A is how we build sustainable profitable growth and shareholder value. When we get that right, it allows us to not only improve financial performance, but to grow the business and create jobs in a way that is durable and supported by the economics. That's the standard and that's the focus of our entire team. With that, I'll turn it over to Adam to walk through the financials.
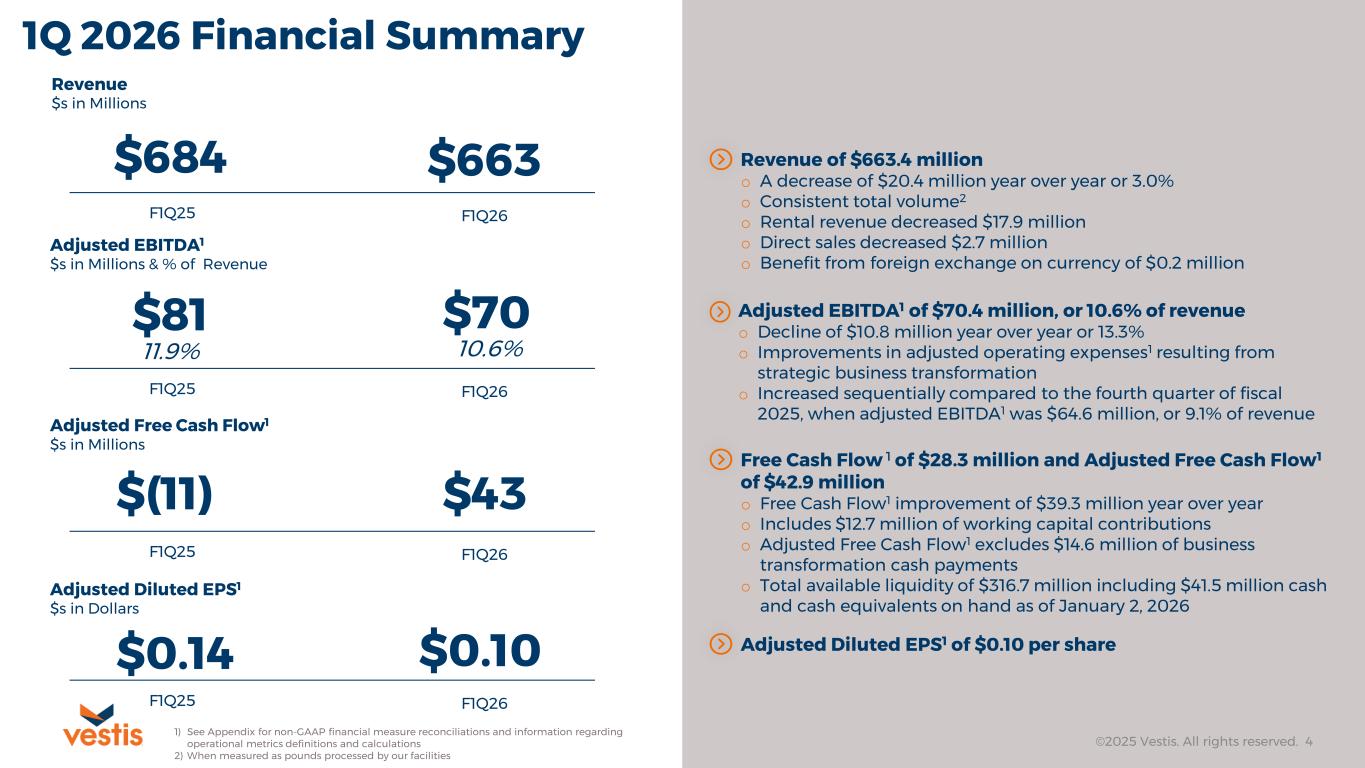
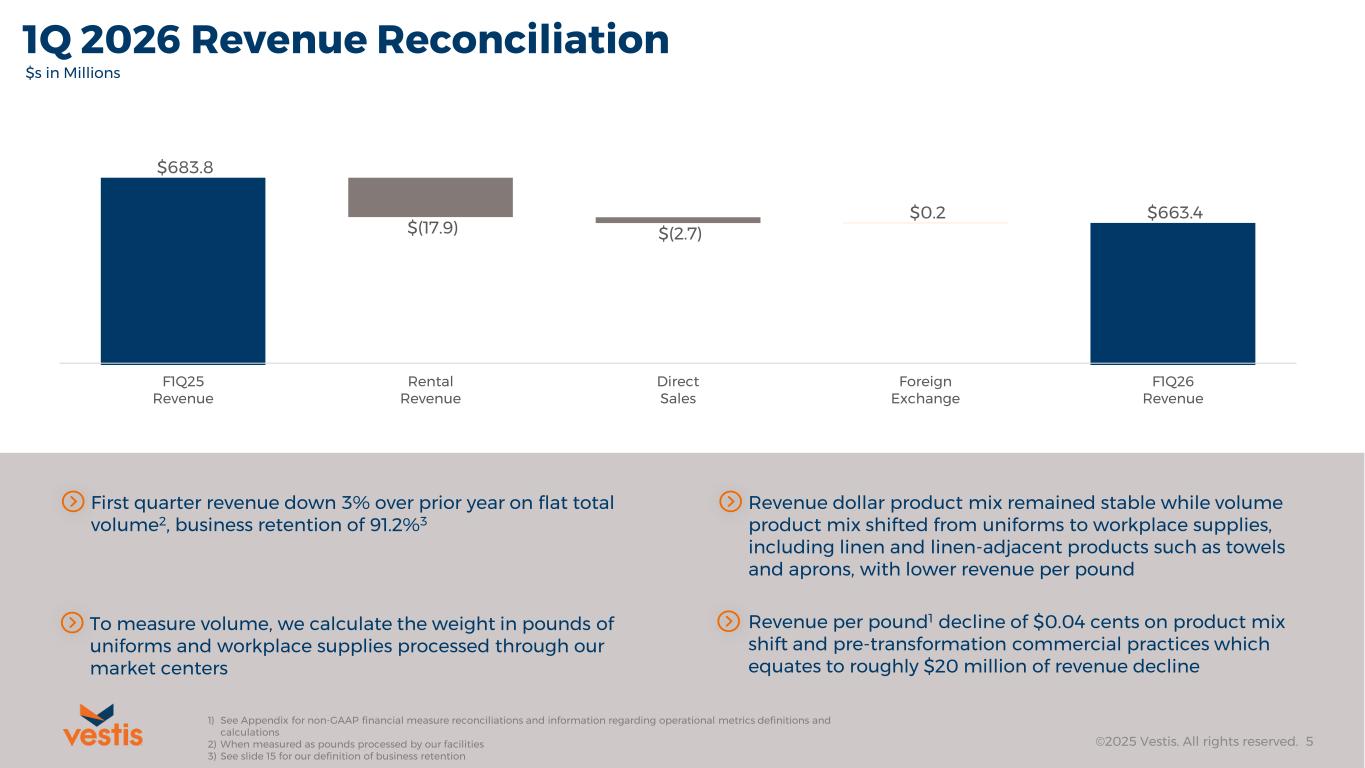
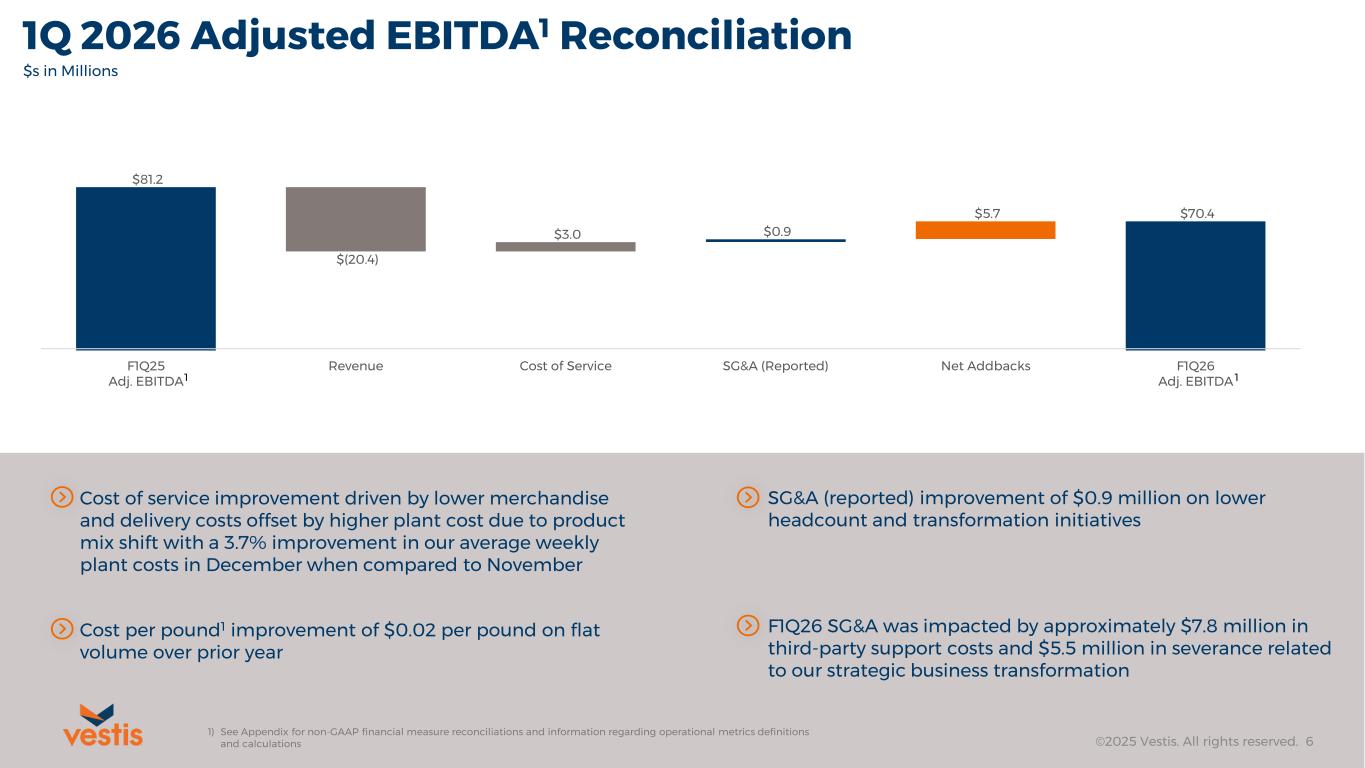
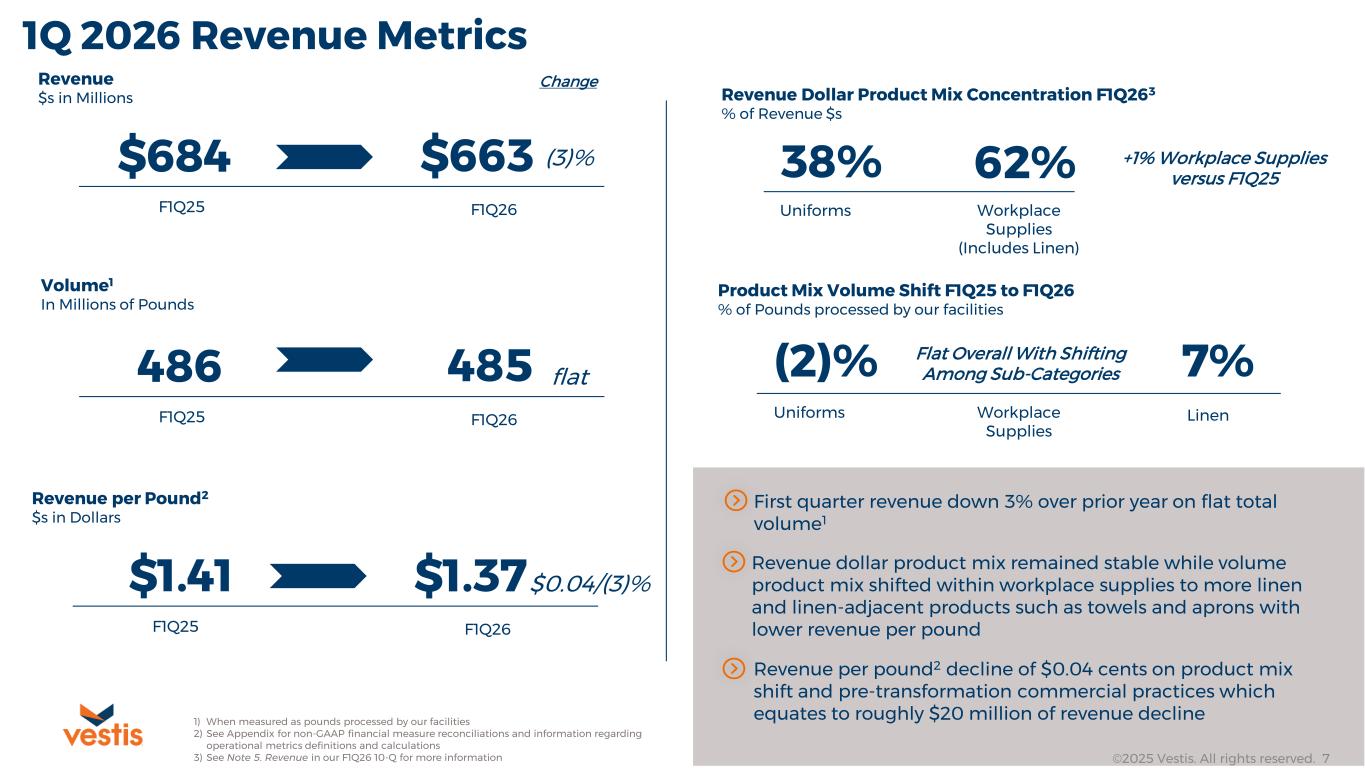
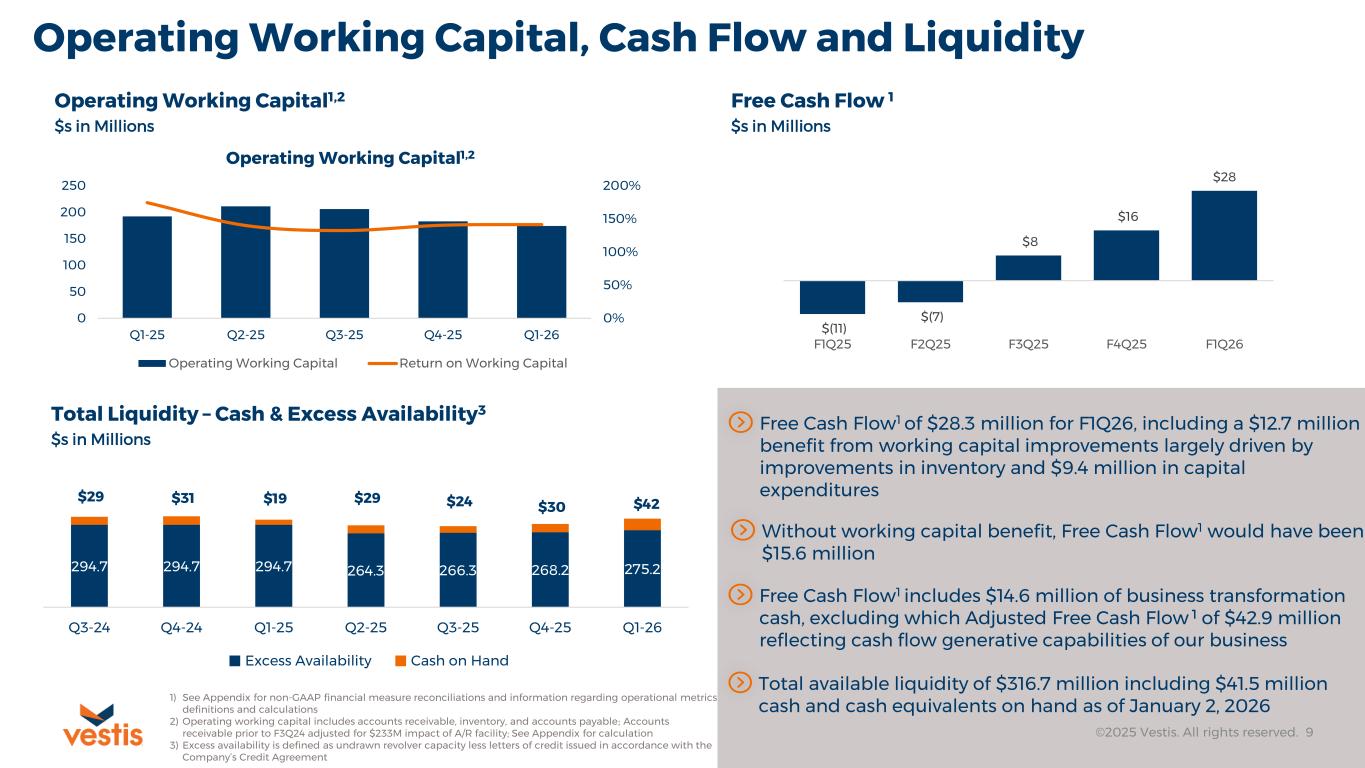
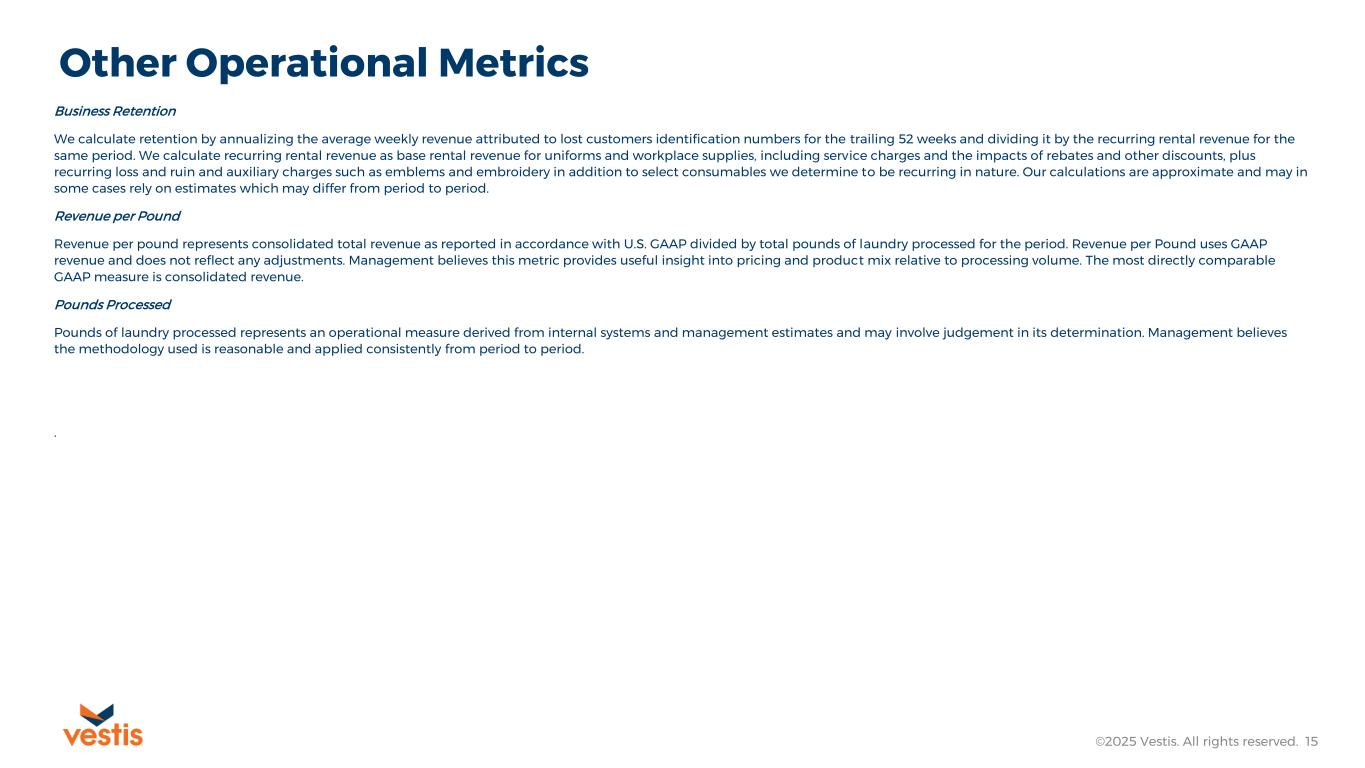
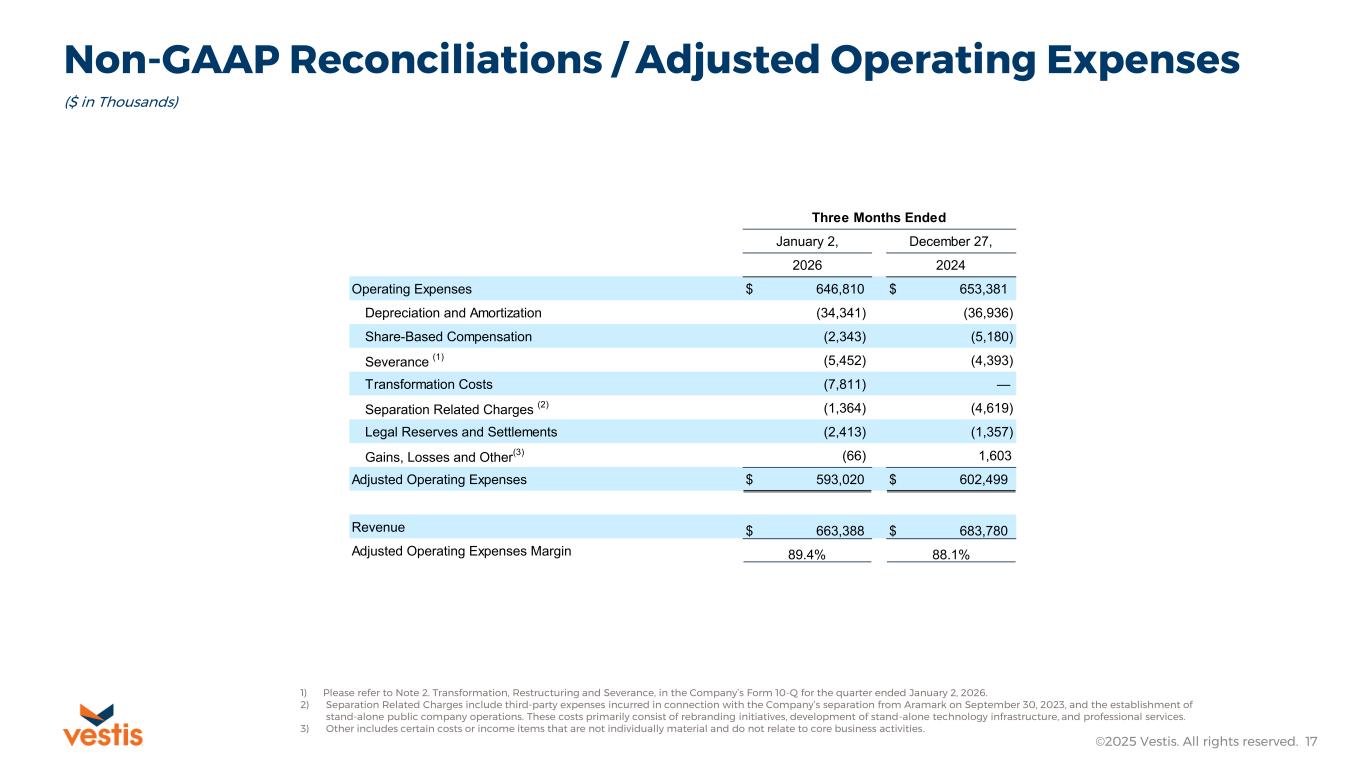
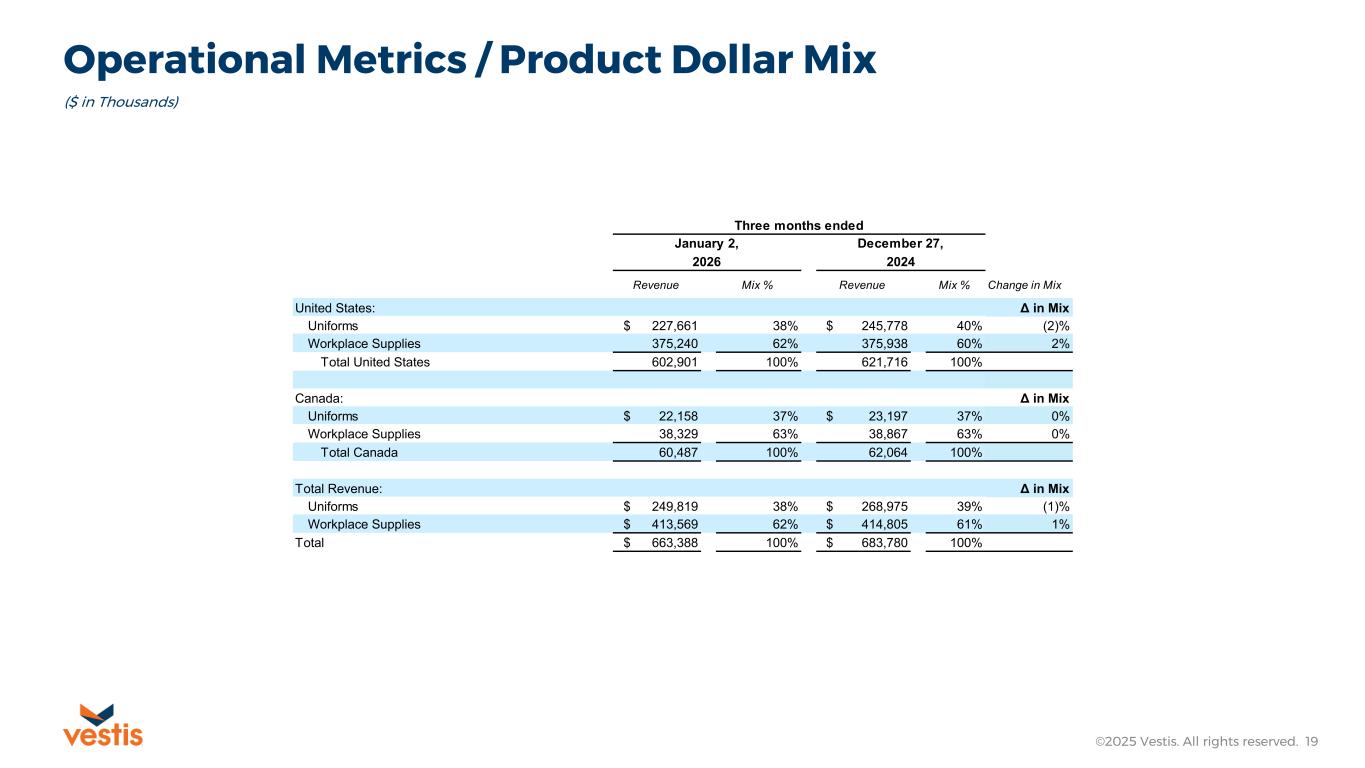
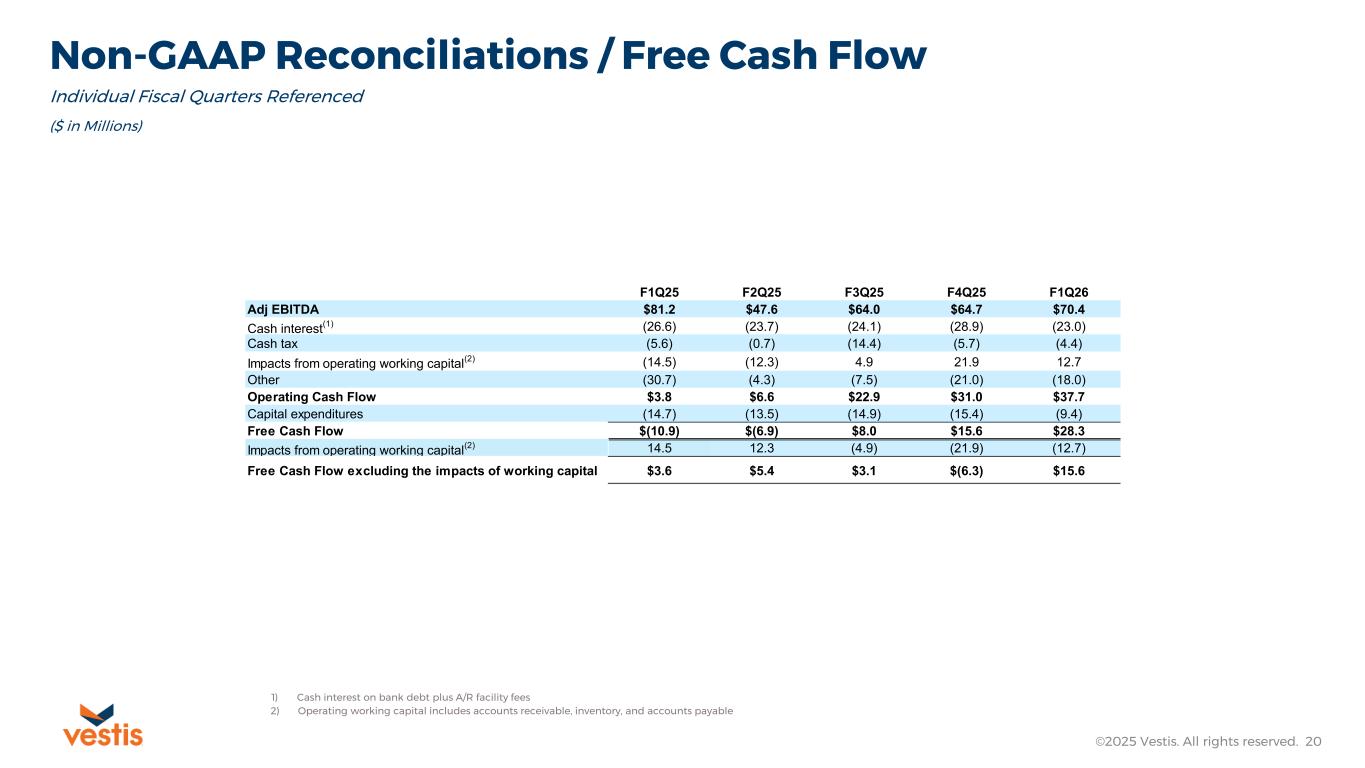
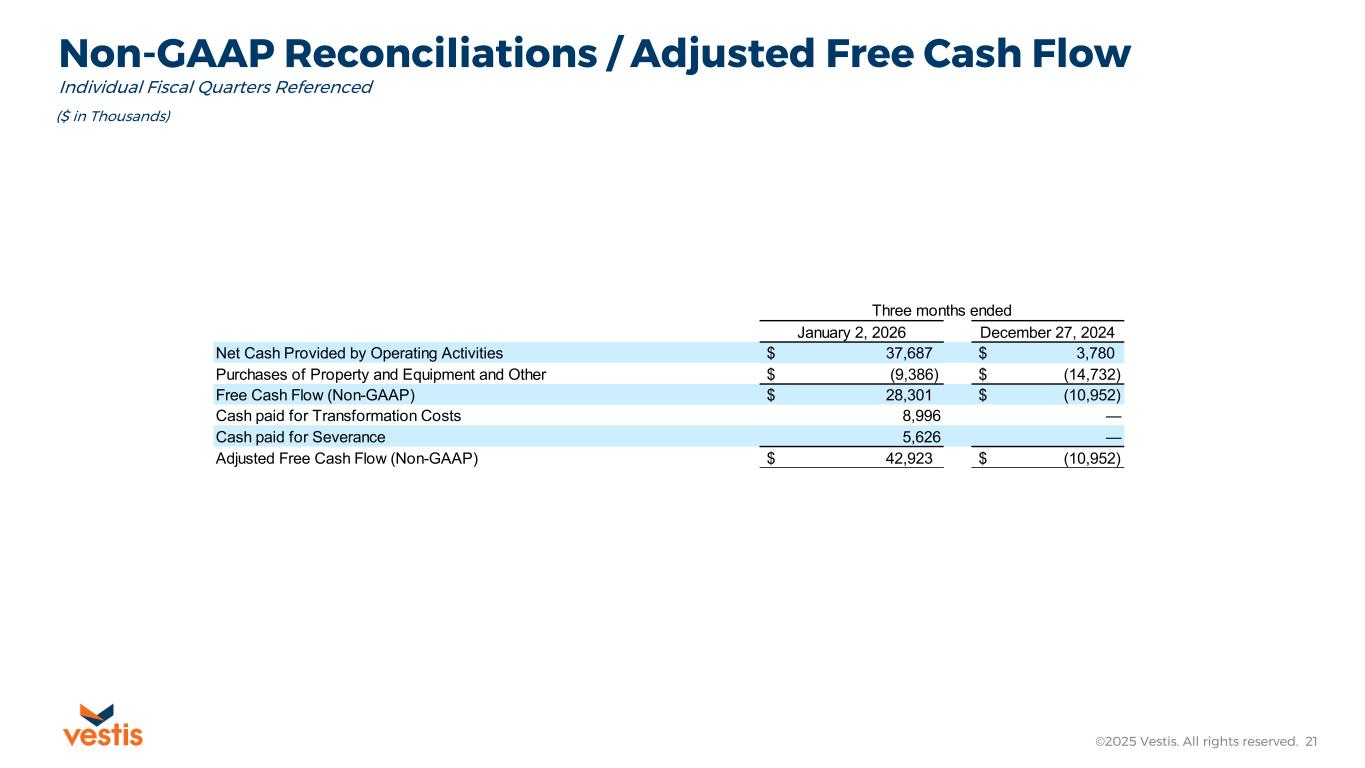
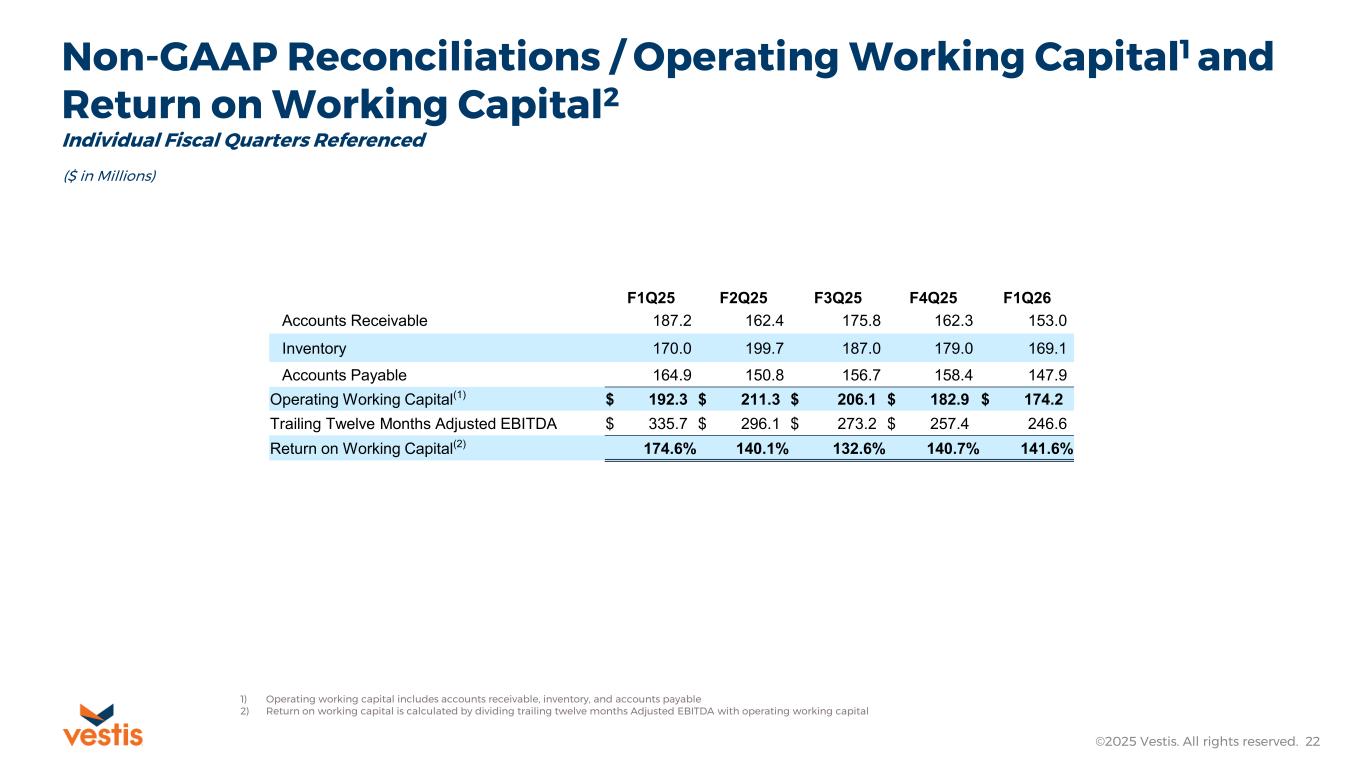
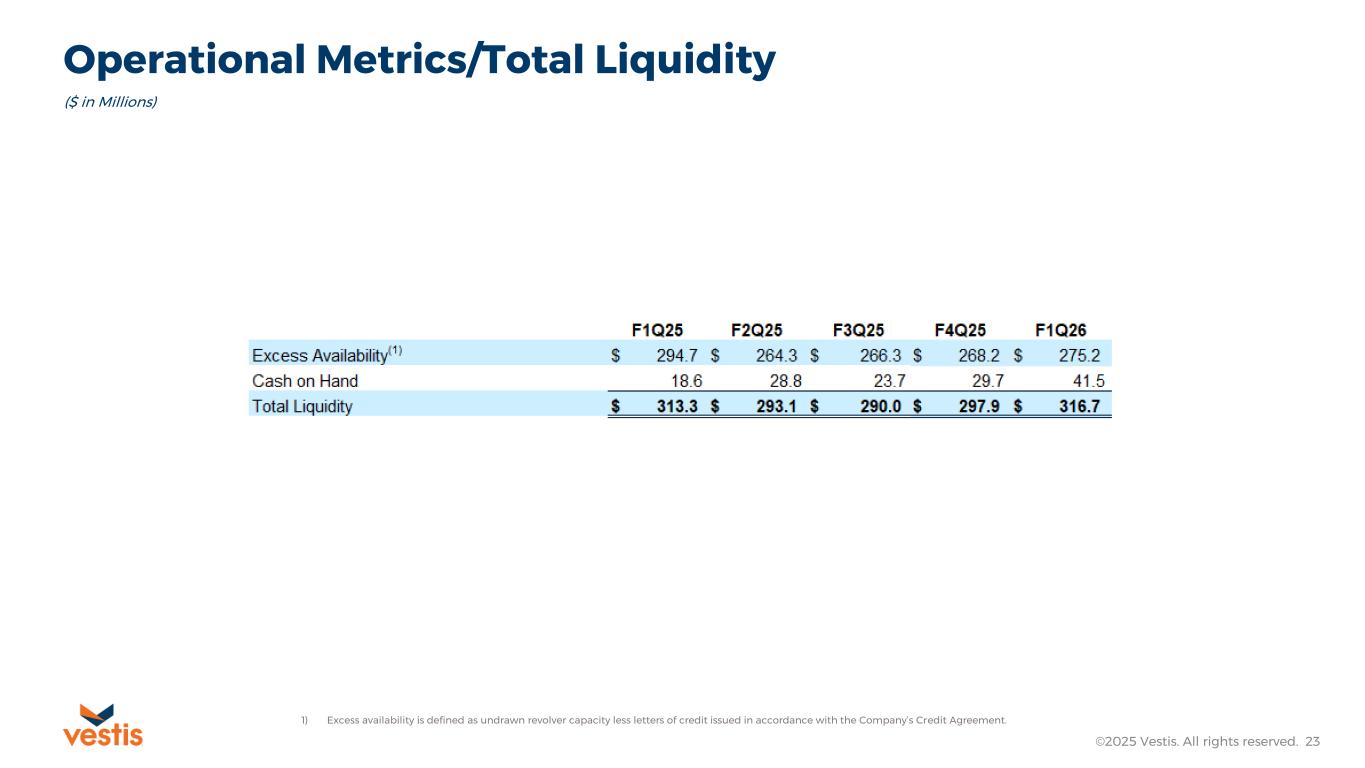
Thank you, Jim, and good morning, everyone. Revenue for the first quarter was $663.4 million, a decline of $20.4 million, or 3%, versus the first quarter of fiscal 2025. Rental revenue declined $17.9 million, and direct sales declined $2.7 million, offset by a $0.2 million benefit from the positive impact of foreign exchange on currency related to our Canadian business. Importantly, while revenue was down, total volume was flat when measured by pounds processed through our market centers. However, the product mix of those pounds has shifted meaningfully year over year. To measure volume, we calculate the weight in pounds of uniforms and workplace supplies processed by our plants at a category and subcategory level. Approximately 95% of our total revenue is related to products that are reflected in the volume of pounds processed. Looking closer at our volume, we processed 2% less in uniforms on a pound basis, but increased our linen volume by 7% in the first quarter of 2026 when compared to the prior For Vespas, linen was a subcategory of workplace supplies, and we saw meaningful shifts in other workplace supply subcategories towards more linen-adjacent products such as towels and aprons, which are significantly more costly for us to process than a uniform. While our revenue dollar mix has only shifted 1% to workplace supplies from uniforms year over year, our volume product mix has shifted more dramatically, representing a lowering of revenue quality and a limiting of top-line operating leverage despite stable overall throughput. The shift in our product mix has negatively impacted revenue per pound by 4 cents or 3%, which equates to roughly $20 million, or the total amount of our year-over-year decline in revenue. Quite simply, Vestas has not experienced a diminishment in sales volumes, but the pounds we processed in the first quarter of 2026 carried lower revenue quality and thus lower revenue per pound than the prior year, which when combined with other commercial practices that were in place prior to the beginning of our strategic business transformation has negatively impacted total revenue. Improving our revenue quality and revenue per pound is directly aligned with the commercial excellence priorities Jim discussed earlier. Our revenue focus is to drive a more favorable product mix, supported by stronger decision support tools and a more strategic approach to pricing and customer penetration over time. As we continue to execute these initiatives throughout the year, we expect the year-over-year quarterly changes in revenue to narrow in line with our full-year revenue guidance. Our cost of service was down $3 million year-over-year on a combination of lower merchandise and delivery costs. Even though plant costs were up year-over-year related to shifts and product volume mix that I discussed previously, we saw a 3.7% improvement in our average weekly plant cost in December when compared to November, a financial improvement tied to the plant productivity gains Jim mentioned in his remarks. SG&A was down approximately $0.9 million over the same period on a reported growth basis. However, in the first quarter of 2026, SG&A expenses were impacted by approximately $7.8 million in third-party support costs and $5.5 million in severance related to our strategic business transformation. When adjusted for these items, SG&A was down approximately 14 million, or 12 percent year over year, as we have taken aggressive action to improve our total operating expenses. Our cost per pound improved by two cents compared to the prior year, with costs measured as those operating expenses directly impacting adjusted EBITDA. At our current volume and product mix levels, $0.02 per pound equates to roughly $10 million in adjusted EBITDA, the amount of cost offset we saw against our revenue decline of $20 million year-over-year. First quarter adjusted EBITDA was $70.4 million, representing an adjusted EBITDA margin of 10.6% compared to $81.2 million, or 11.9%, in the prior year. First quarter adjusted EBITDA margin is higher by 150 basis points than our fiscal fourth quarter 2025 driven by a lower cost per pound of approximately one cent on consistent overall volume and revenue per pound when comparing the two quarters our first quarter standalone effective tax rate was 25.3 percent we expect our full year 2026 effective tax rate to be in the range of 25 to 30 percent now moving on to cash flow in our balance sheet. During the quarter, we generated $38 million in operating cash flow and $28 million in free cash flow, including a $12.7 million benefit from working capital improvements, largely driven by more disciplined steps taken within our procurement and supply chain functions, positively impacting our inventory. As a reminder, our fiscal 2026 free cash flow guidance was neutral to the impacts of working capital. When excluding working capital improvements our first quarter 2026 free cash flow would have been 15.6 million in line with our full year guidance of 50 million to 60 million spread evenly throughout the year. Our first quarter capital investments were 9.4 million below our baseline target of 15 million per quarter due to longer lead times for industrial laundry equipment investments we are making in our plans which we expect will come in future quarters throughout fiscal 2026 our strong operating cash flow of 38 million in the first quarter of fiscal 2026 represents a 33.9 million dollar increase in operating cash flow year over year and a 39 million dollar increase in free cash flow over the same period improvements in working capital management are attributable to 27 million in cash flow improvements year over year Looking at how our strategic business transformation impacted free cash flow, during the first quarter of 2026, we spent $9 million in cash for third-party expenses and $5.6 million in cash for severance. Excluding those transformation-related cash expenditures, adjusted free cash flow was $43 million, which reflects the strong cash generative capabilities of our business. On the balance sheet, at the end of the first quarter, net debt was $1.29 billion and our principal bank debt outstanding was $1.16 billion, including $19 million on our revolving credit facility, which declined $7 million from the fourth quarter of fiscal 2025. Our liquidity position is strong, with no debt maturities until 2028 and $317 million of available liquidity, including $275 million of undrawn revolver capacity and $42 million of cash on hand. Our capital allocation strategy is to maintain a strong balance sheet and allocate capital toward high return opportunities with a firm focus on delevering. Our prudent balance sheet management and working capital actions are providing a stronger foundation for which to support our business. As Jim discussed, we are actively marketing several non-core properties for sale, all in various stages of the real estate disposition process. We intend to use the proceeds from any non-core property sales to repay debt, and we anticipate delevering actions taking place in the fiscal second quarter, our current operating quarter. Today, we are reaffirming our outlook for fiscal 2026, we continue to expect that revenue for the year will be between flat to down 2% as compared to fiscal 2025 revenue on a 52-week basis. We also continue to expect that adjusted EBITDA for the full year 2026 will be in a range of $285 million and $315 million, with 5% successive quarterly improvements beginning with the second quarter. Additionally, we continue to expect fiscal 2026 free cash flow to be in the range of $50 million to $60 million, assuming capital expenditures are generally consistent with 2025. As it relates to our free cash flow guidance for the year, we continue to expect working capital to be generally flat on a full-year basis. With that, operator, please open the line for questions.
Operator
Thank you. The floor is now open for questions. At this time, if you have a question or comment, please press star 1 on your telephone keypad. If at any point your question is answered, you may remove yourself from the queue by pressing star 2. Again, we ask that you pick up your handset when posing your questions to provide optimal sound quality. Thank you. Our first question is coming from Magnav Patnike with Barclays. Please go ahead. Your line is open.
Hi, good morning. This is Ronan Kennedy. I'm from Manat. Thank you for taking our questions. For the revenue for pound decline at 2.8%, I think it was due to an element of mix and legacy commercial practices. Can I confirm how we should expect that to trend for the year? And then, you know, I understand there may be a lot, but what would be the most important drivers from a pricing mix action or either commercial initiatives to improve that? and when should we think about, you know, how that could potentially inflect and show in results?
Yep. Hey, Ronan, it's Adam. Good morning. Thanks for your question. With respect to the remainder of the year, you can expect us on a full-year basis to be flat to down 2% comparing to FY25. We're reaffirming that guidance this morning, so generally expect to see kind of consistent trends in revenue per pound throughout the year as we work towards the midpoint of that guidance. And some of the most important leaders, which I'll let Jim talk to in more detail here, is going to be focusing on shifting that mix, strategic pricing, and a couple of other initiatives that he'll dial in in more detail.
Thanks, Adam. So, look, the plan is to improve revenue per pound throughout this year. A lot of that's going to be timing-based. We've already started in the first quarter. We'll continue each quarter to add to that to turn their revenue per pound up that supports the plan. I would also, though, tell you really quickly, I wouldn't do revenue per pound in isolation. I would do it in concert with cost per pound. It's super important because that's going to reset the basis of what good revenue per pound looks like in this business. So it will continue to adapt going forward.
Thank you. And then on the sequential EBITDA growth assumptions, I believe it was guided to 5% sequential adjusted EBITDA growth for each remaining quarter. And I know you touched on some of these key metrics. How should we expect those, you know, to play out sequentially? And what are, again, the most important operational commercial assumptions underpinning that sequential progression? And any upside or downside risk to that, please?
Yeah, Ronan, I can talk a little bit to how that's going to flow off through the year as far as our guidance goes on adjusted EBITDA. Remember, for FY26, we're guiding to 285 to 315 adjusted EBITDA on a full-year basis. So if you plan that out sequentially across the quarters, looking at that 5% sequential improvement, you'll be able to see kind of the differences that are coming through in adjusted EBITDA through Q2, Q3, Q4 successively. And if you work back to that cost per pound calculation that Jim mentioned, you'll be able to get there. Of course, you use Q425 exit rate as your benchmark when you do those differences to be able to get the incremental uplift that we're going to see throughout the year. And just to be clear, from Q4 to Q1, that's about $5 million. And remember, it was $40 million in-year benefit from our transformation, and we saw $5 million over that in Q1 from an improvement in one cent per pound, between the two quarters.
Okay, thank you. I appreciate it. Sure.
Operator
Thank you. Our next question comes from Stephanie Moore with Jefferies. Please go ahead. Your line is open.
Hi, good morning. Thank you for the question. Maybe to start, could you comment on what you're seeing from a general macro standpoint or customer demand standpoint?
Any flowing or maybe reduction in overall demand that can be pointed to just more of a macro standpoint that'd be helpful thank you hey stephanie it's adam i can comment a little bit there um we're still concentrated in the same q vertical that we've been concentrated in year over year so we've seen no shifting in our macro vertical concentration we're seeing really no waning in demand and as i mentioned in our remarks our volume is consistent on a pound basis year over year so we're putting the same amount of work through the network that we put through last year on a per-pound basis. The difference is that mix-shifting, which is a part of our commercial excellence aspect of our transformation.
I would add, Stephanie, Jim, that I think that, you know, as we start out this transformation, the concept of the macro is really secondary in our business right now. It's getting the foundation of this right so we can grow as we need to grow for all the stakeholders. that will outweigh anything macro in this business in the near term. But that's how I kind of think about it.
Absolutely. No, and I think well understood, and that's a good segue into just my follow-up question there. So, you know, maybe, Jim, as you think about, you know, your time the last, I guess it's not many years, but let's just say nine months roughly, you know, as you look at the transformation underway, how would you calibrate your progress thus far?
Are you ahead of schedule, aligned with schedule? and as we think about the next let's just say 12 months where do you think we should see the biggest change from an operations standpoint thanks so a couple I'm going to bifurcate it because second half I'm going to give to Bill Seward to talk a little about the operations as well so if depending on what sport you think about if I'm in baseball I would say we're in the first inning right now that's where we are um and we can you know this is a continual move quarter over quarter over quarter and it will be a blend of cost per pound improvement and revenue per pound improvement there's there's multiple layers of behind it of opportunity in this business which is why in the opening comments we made it it's embedded in this business the value is there we just have to unlock it going forward what you plan to do so it'll be both of those levers that's why we're going to bring offering leverage in the business so we can keep score on that and i'll have bill talk for a second about one of the service metrics in the operations Is it put in there on plant production kind of where we are?
Yeah, thanks, Jim. I think the way I think about your question is that the service comes along with the cost and the revenue per piece as well. So what we're seeing is sequentially month over month, since we've kind of leaned into the transformation, that we are getting better outcomes on cost and really importantly for our customers and for our shareholders, our service levels of tracking with that. So I agree with Jim, early innings for sure.
Operator
Thank you. So next question comes from Sam Mulroney with William Blair. Please go ahead. Your line is open.
Jim, Adam, Bill, good morning. Good morning. Digging into some PROS KPIs here. So I wanted to ask about that plant productivity metrics, which showed a 7% increase. Looks like you measure it in terms of pounds processed, but pounds processed per what? Per hour, per day? Can you just help me understand that? Say again?
I'm sorry to interrupt you. Per operating hour. And, you know, the idea there is that we've had some tools and some pathology in place in the past. It was kind of underutilized, I would say.
We were leaning in on it with really good visibility, daily visibility to what our productivity levels are, and as I mentioned a moment ago, also daily visibility to what our service levels are to make sure that we don't just get the cost, but we may gain service and improve outcomes for our customers at the same time got it so that's seven percent improvement in plant productivity is that directly related then to that two cent reduction we see in cost per pound can you connect those ideas for me and can you also talk a little bit about you know the things that you're doing that drove that those efficiency gains like like and and i guess where you think you are along this journey um to get that wash alley efficiency up
to stop well this Jim let me let me put a couple things together for you so and I like the line of questioning too because that's kind of where we're going with the whole thing is that the first question you asked was is it related to the two cents and the answer to that is no no not in the first quarter but we also made the point that December is where it started to move forward and so that's where it started to move and and more impactful going forward and so even in the second quarter, it's picked up pace so far. It will show up in the cost per pound going forward. There's no question about that. I think the other piece is that, you know, coming from a long-time UPS background that we had an army of engineers behind us doing time measurements and working on all these things, Vesta's already had some really good technology, in my opinion, in it to actually take each building in the network and define what good looks like, what 100% effective of a building should be. They just haven't quite pulled it together yet to move it into this transformation mode and convert it to cost per pound, and that's what's going on. And so you will get that, and each step of the way will continue to optimize the buildings, and that opens up more capacity and opens up more ability to grow based upon the way they can flow those pounds through the network.
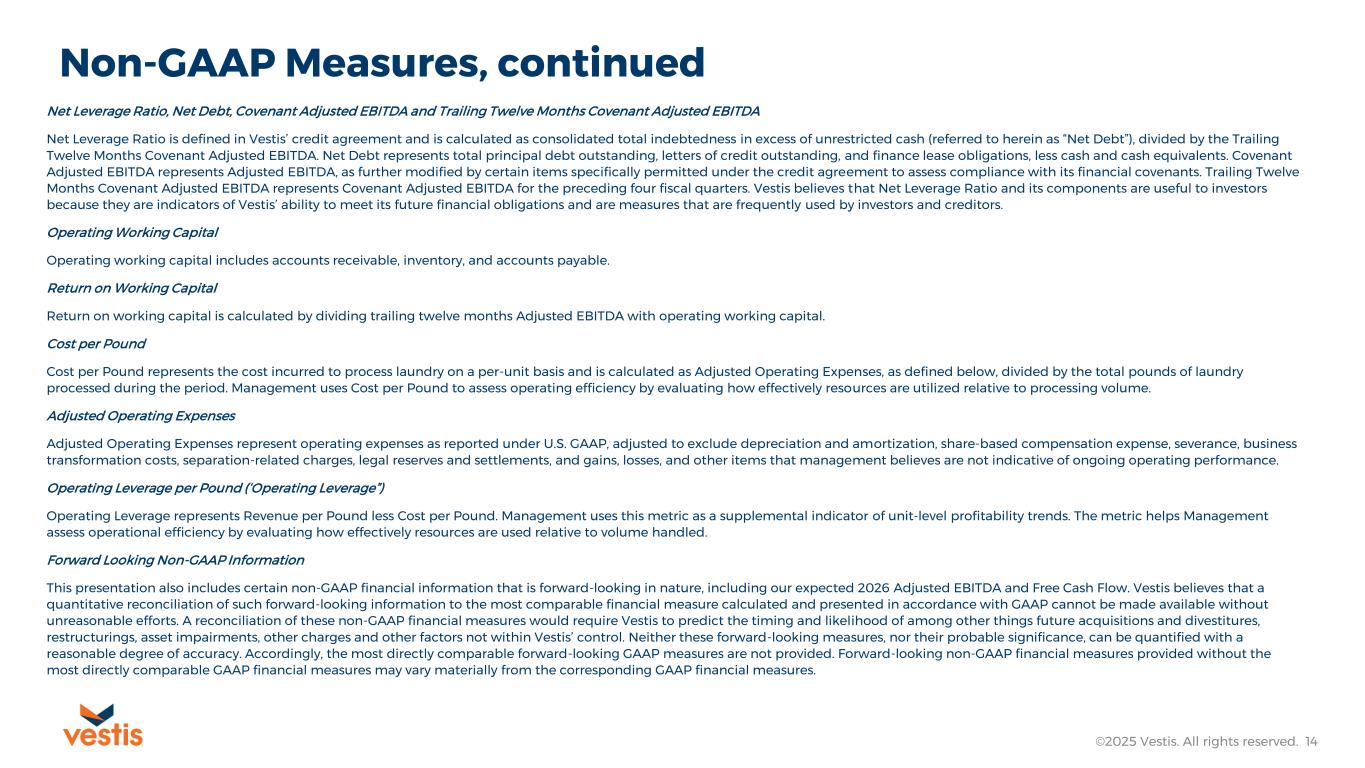
And let me add one thing there to what Jim mentioned. The way we're doing cost per pound, If you look in our materials, you'll see that it's those costs directly impacting adjusted EBITDA, which is essentially operating expenses adjusted for the add-backs for adjusted EBITDA. So if you take a look at that calculation, you'll be able to see kind of what's driving that cost per pound savings.
Understood. Very clear. Thank you. Welcome.
Operator
Thank you. And once again, if you do have a question, you may press star 1 on your telephone keypad at this time. We will move next with George Tong with Goldman Sachs. Please go ahead. Your line is open.
Anna
Analyst — Goldman Sachs
Hi, everyone. This is Anna. I'll applaud George. Thank you for taking all the questions. Just wondering if he, sorry if I missed a quick confirmation, how much of that 75 million has been realized in the first quarter, and how should we think about a cadence of cost-saving realization for over the remainder of the year and what are some puts and takes there. And I have a follow-up on if you are seeing any increasing traction in the vendetta market and how is that growth in white space trending compared to last year.
Hey, Anna, it's Adam. I'll answer the first part of your question, and then I might get you to repeat your follow-up just to make sure we're giving you the right answer. So we're on the cadence of how you're pointing about the $75 million. Now, keep in mind, the 75 is a full-year number that's going to be realized after our transformation in FY26. So, in FY26, it's $40 million in-year, and that $40 million becomes 75 on a full-year basis moving forward. So, the way you get to the $40 million is essentially by taking kind of where we landed in Q1 compared to Q4. That's about a $5 million increment. That's that one cent per pound that I mentioned earlier. That gives you $35 million of additional savings to get to $40 million that's going to run off between Q2 and Q4. And the way you calculate the way that's going to phase in, you take the Q2 5% uplift from Q1 and subtract it from our exit rate of $65 million from Q4. That's going to get you roughly $9 million. And then you'll have $13 million in Q3, and they're approximately about the same kind of in Q4. So that's going to run off. Perfect. That's super helpful. And just so we're clear, that's going to largely be focused, you know, as we talked about earlier on the call and Q&A on cost per pound savings.
Anna
Analyst — Goldman Sachs
That's super helpful. Thank you so much. I'll give them a second part of the question is more about if there is any increasing traction in penetrating into the unvended market, like no programmer's market, and how is that in the web space training for you guys?
Yeah, Anna, hey, that's a great question. and thank you. We're still roughly, you know, on our new business side, 60-40, with 40% of them being non-programmers, 60% of them being programmers, and haven't seen a dramatic shift there.
But I would add to Adam's responses, Jim, that you mentioned in the prepared remarks that we're introducing market development representatives into our growth model, and very clearly they'll have more feet closer to the front line where the customers are and they will be focused on continuing to go both sides of that growth equation both non-programmers and those that are already in the industry got it thank you so much thank you and this concludes the q a portion of today's call i will now turn the call back to stefan newly for closing remarks thank you nikki and thank you everyone for joining us today We appreciate your time and your interest in Vestas. If you have any questions, please don't hesitate to contact us at IR at Vestas.com. We look forward to speaking with you again next quarter. Have a great day.
Operator
Thank you. This concludes today's Vestas Corporation Fiscal First Quarter 2026 Earnings Conference Please disconnect your line at this time and have a wonderful day.