Operator
Welcome to the Vestas Corporation Fiscal Third Quarter 2026 Earnings Conference Call. At this time, all participants have been placed on a listen-only mode, and the floor will be open for your questions following the presentation. If you would like to ask a question at that time, please press star 1 on your telephone keypad. If at any point your question has been answered, you may remove yourself from the queue by pressing star 2. To enable others to hear your questions clearly, we ask that you pick up your handset for bust-down quality. Lastly, if you should require operator assistance, please press star zero. I would now like to turn the call over to Stephan Neely with BALAM Advisors.
Thank you, operator, and thank you all for joining us on the call this morning. Leading the call with me today is Jim Barber, President and Chief Executive Officer, and Adam Bowen, Interim Chief Financial Officer. Also with us on the call today is Bill Seward, Chief Operating Officer. Jim and Adam will provide prepared remarks, and then we will open the line to questions. Before I turn the call over to Jim, I would want to remind everyone that today's discussion contains forward-looking statements about future business and financial expectations.
The Private Securities Litigation Reform Act of 1995 provided the safe harbor from civil litigation for such forward-looking statements.
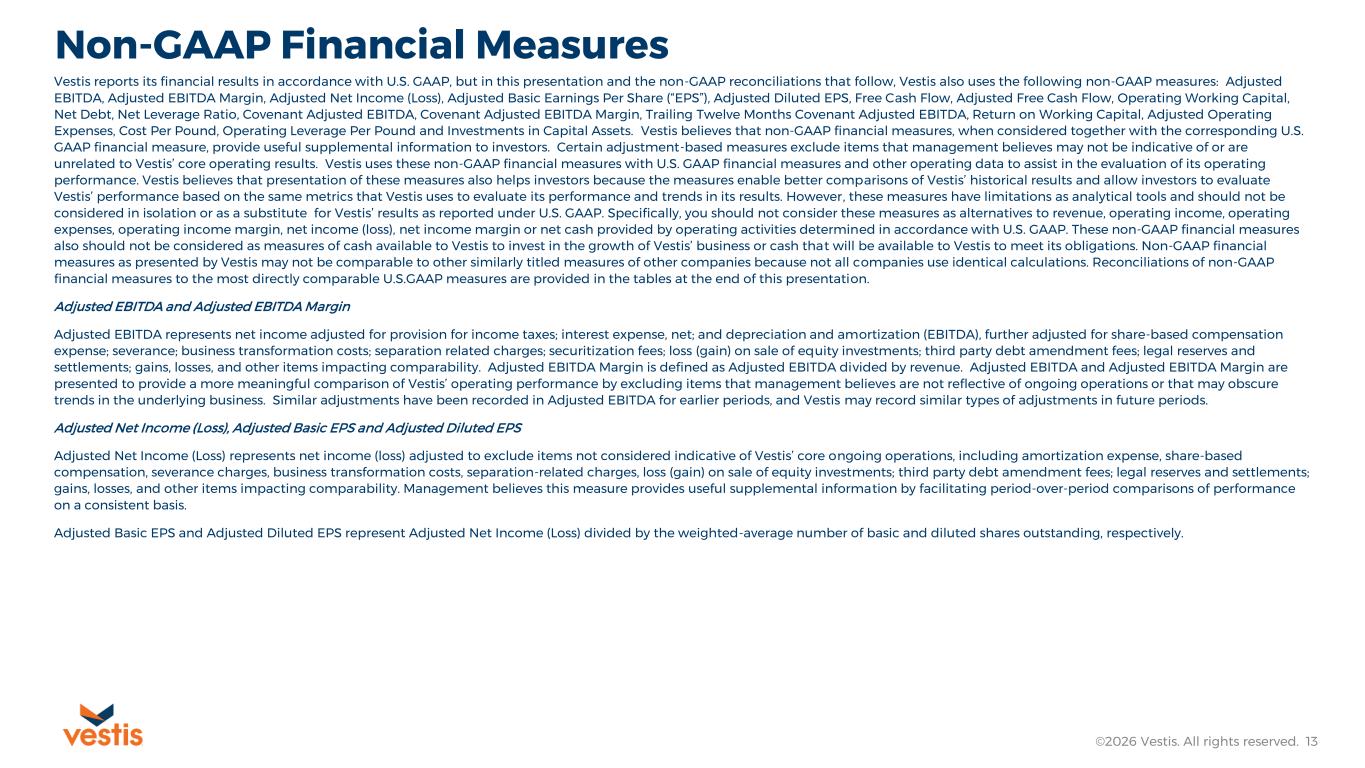
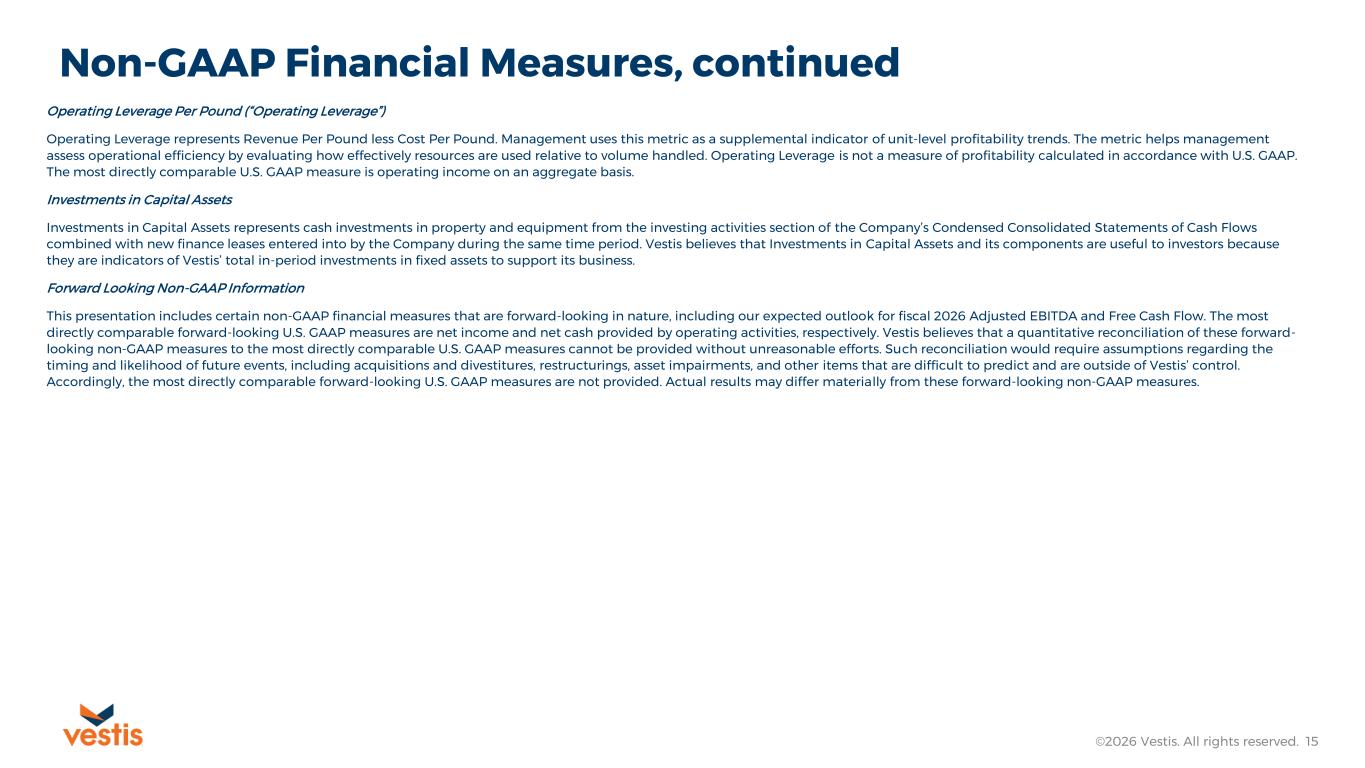
Actual results may differ significantly from those projected in today's forward-looking statements due to various risks and uncertainties, including the risks described in our periodic reports filed with the Securities and Exchange Commission. Except as required by law, we undertake no obligation to update our forward-looking statements. Further, this call will include the discussion of certain non-GAAP financial measures. Reconciliation of these measures to the closest GAAP financial measure is included in our quarterly earnings press release and corresponding supplemental materials, which are available at ir.vestus.com. With that, I would like to turn the call over to Jim.
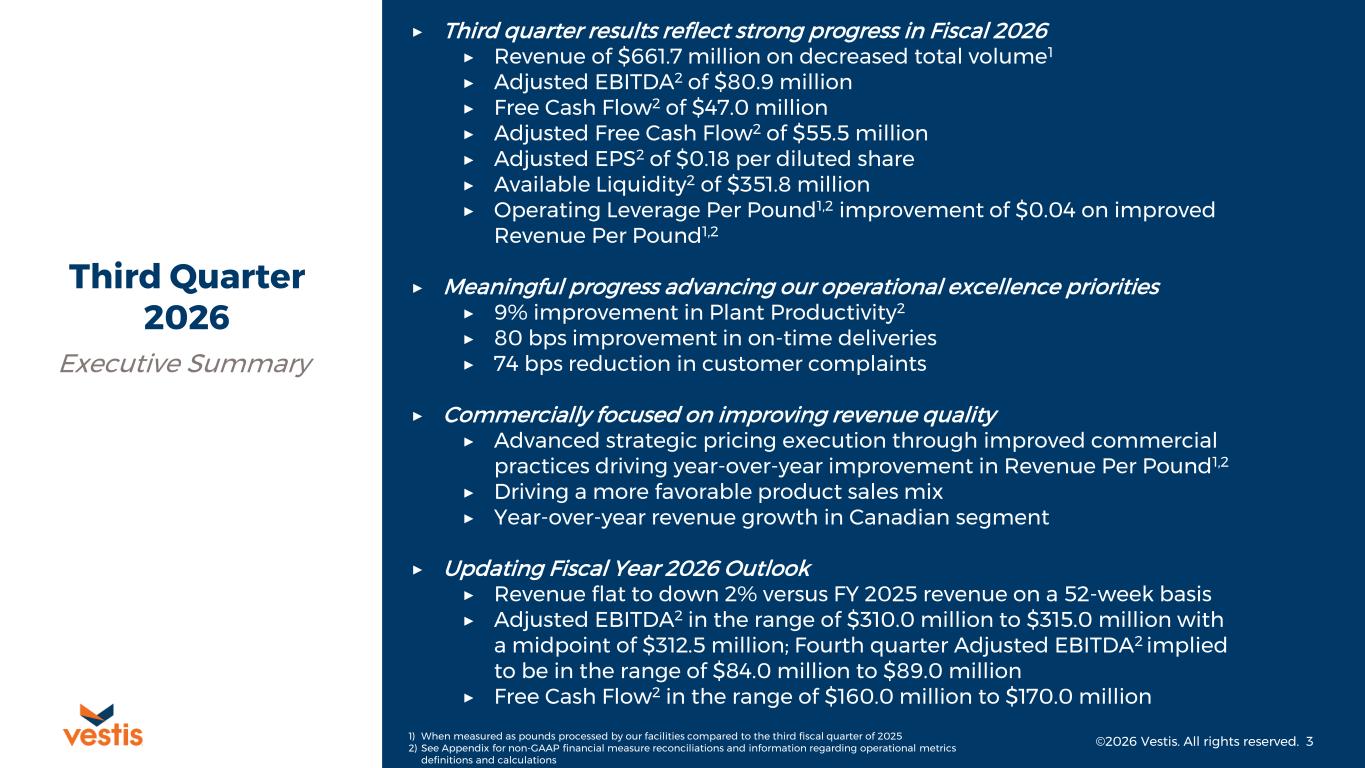
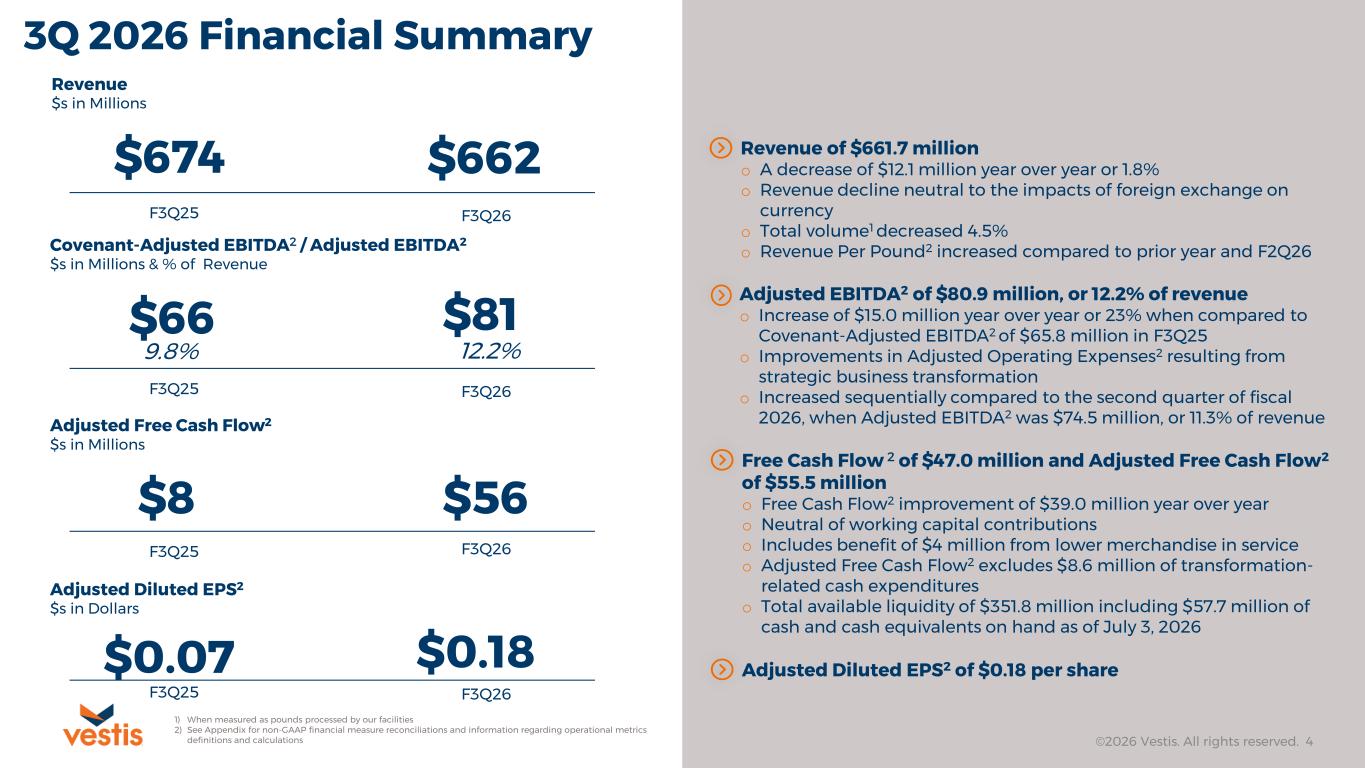
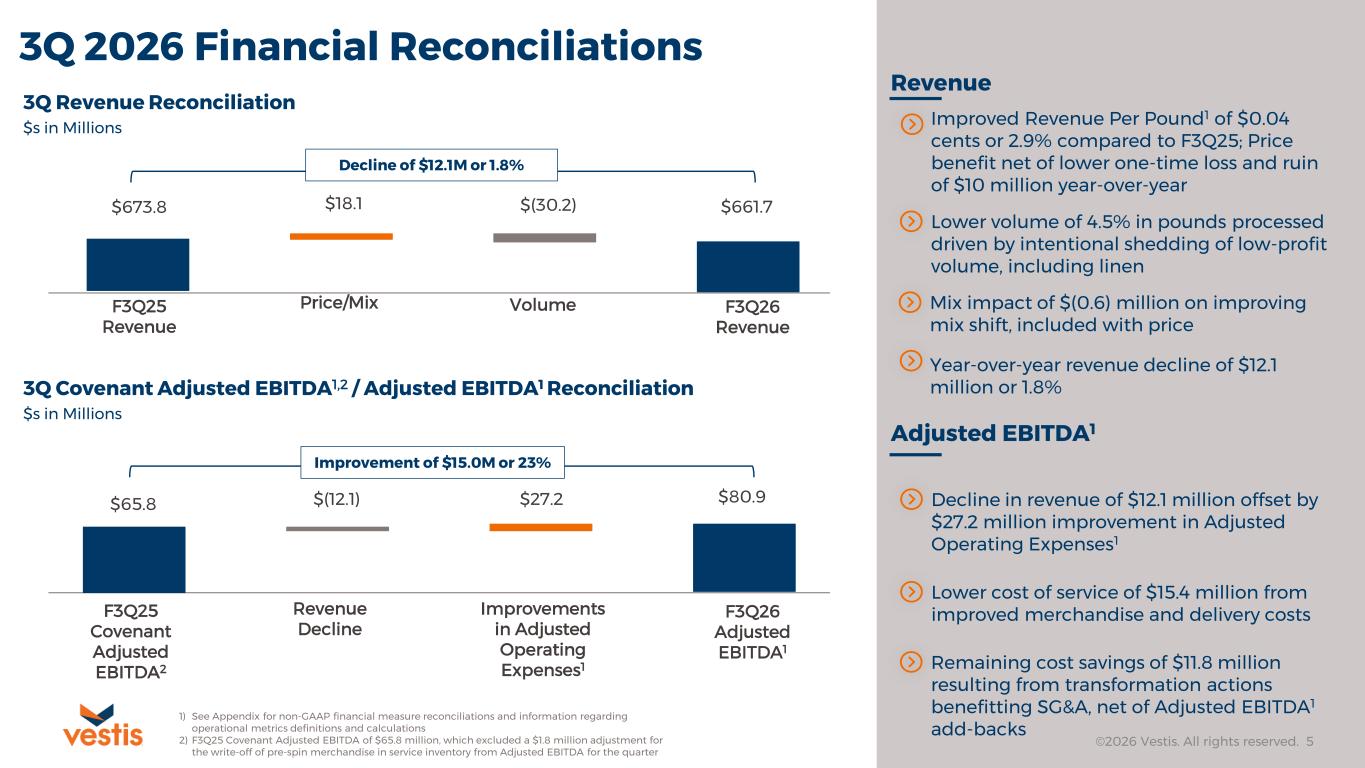
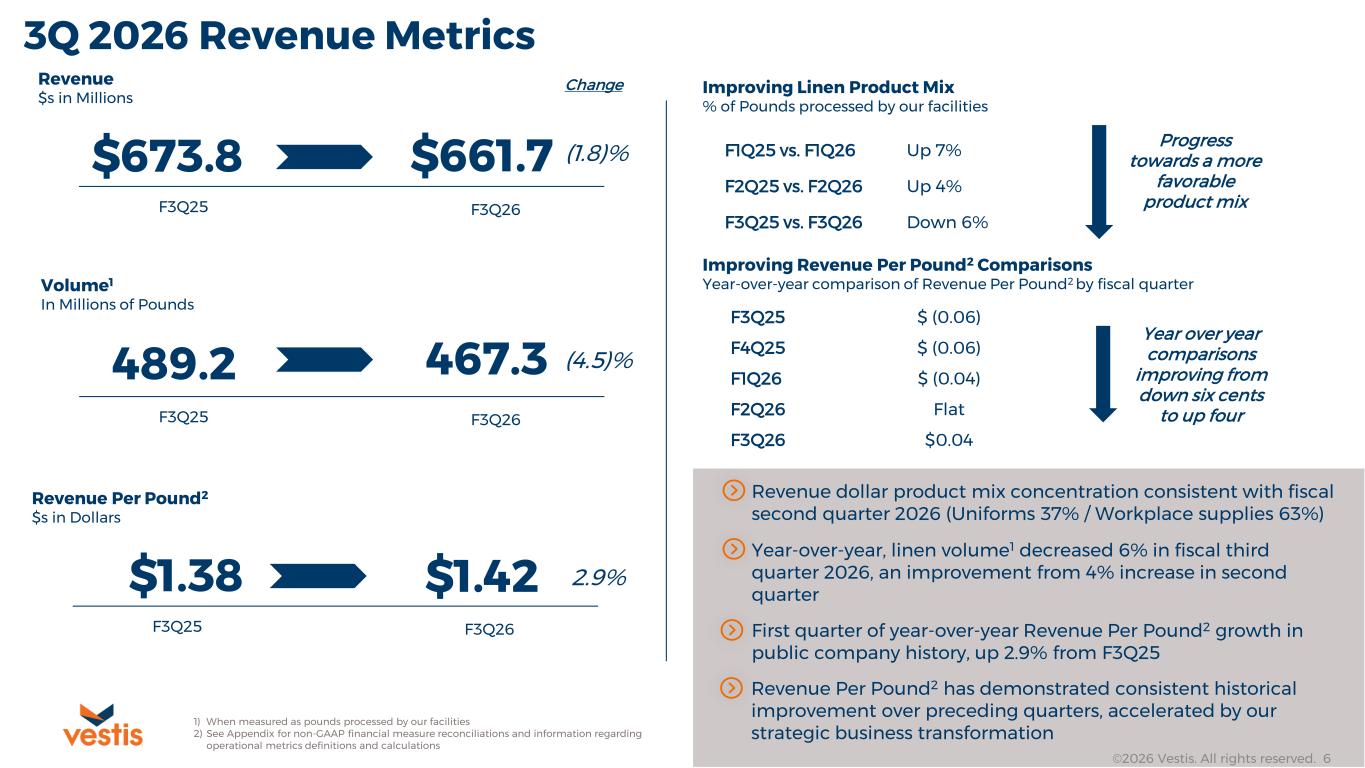
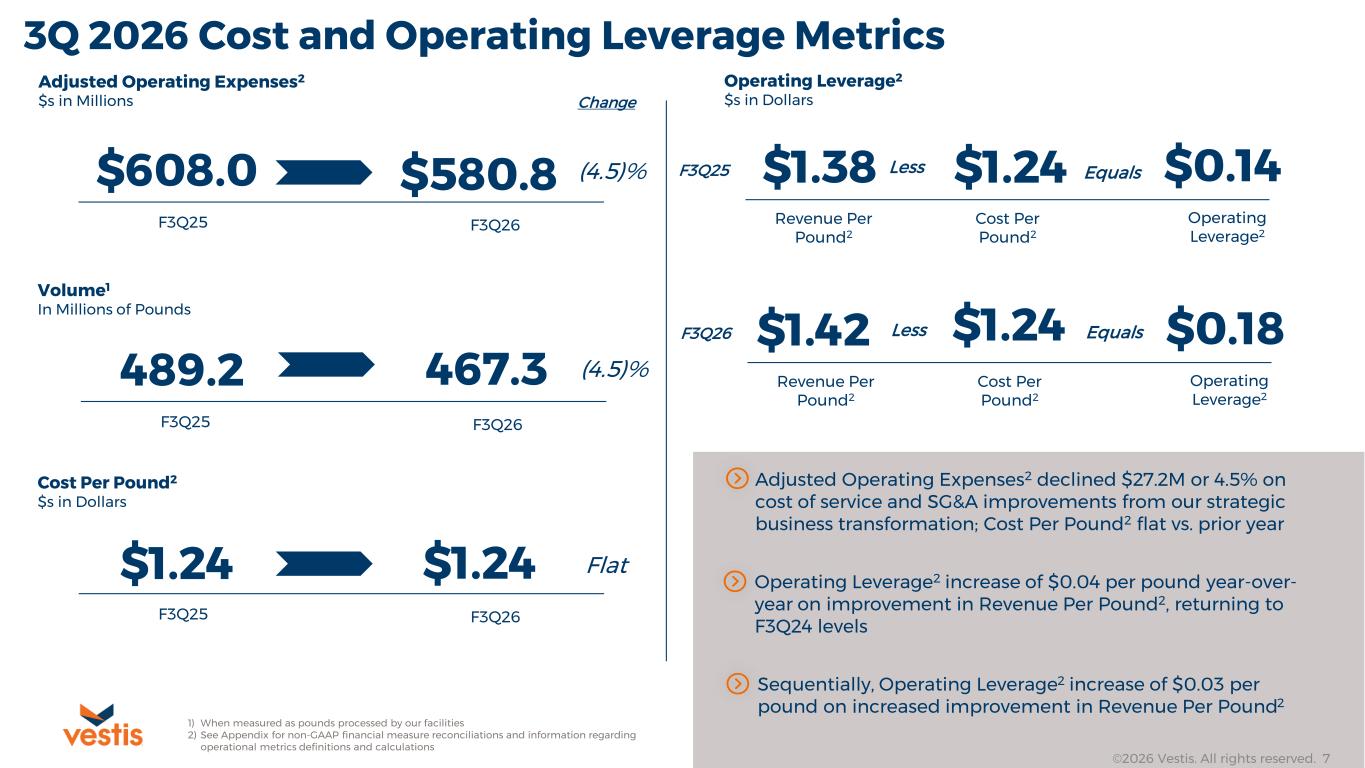
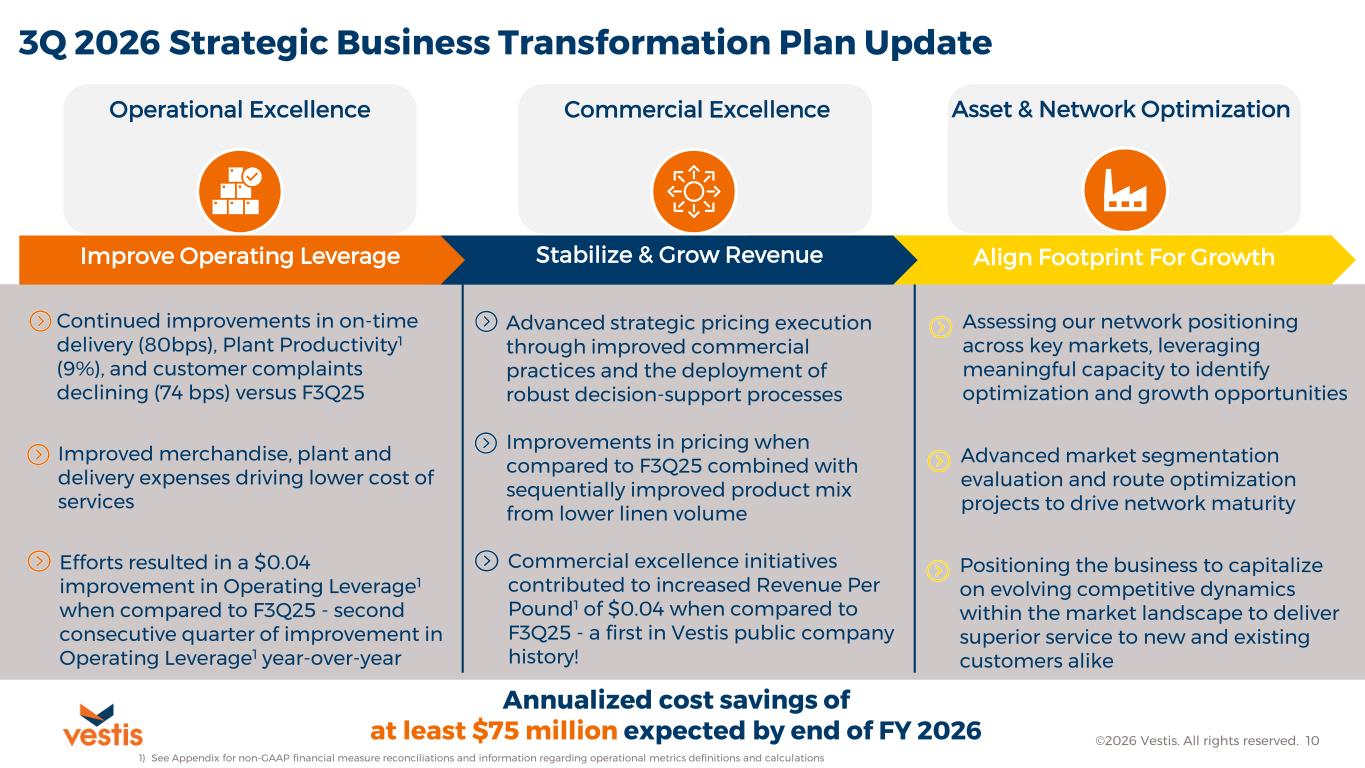
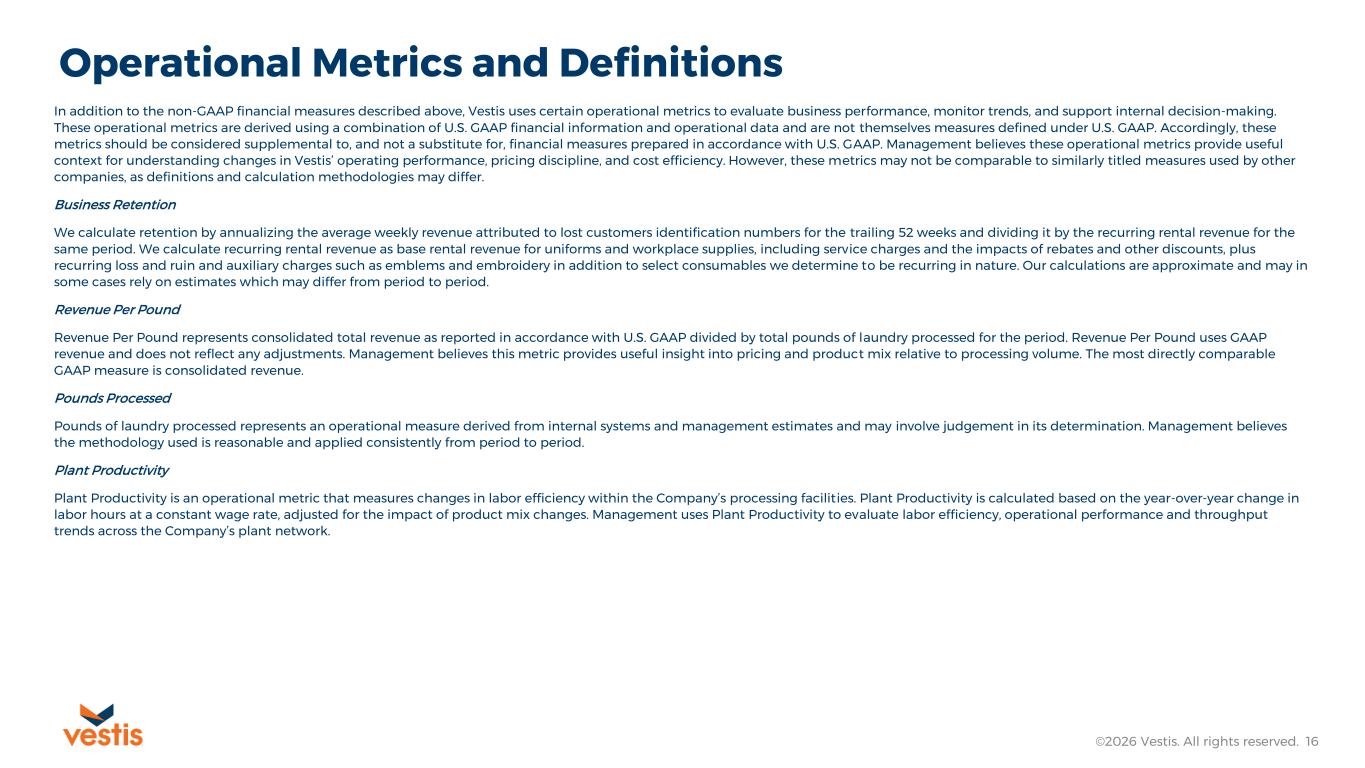
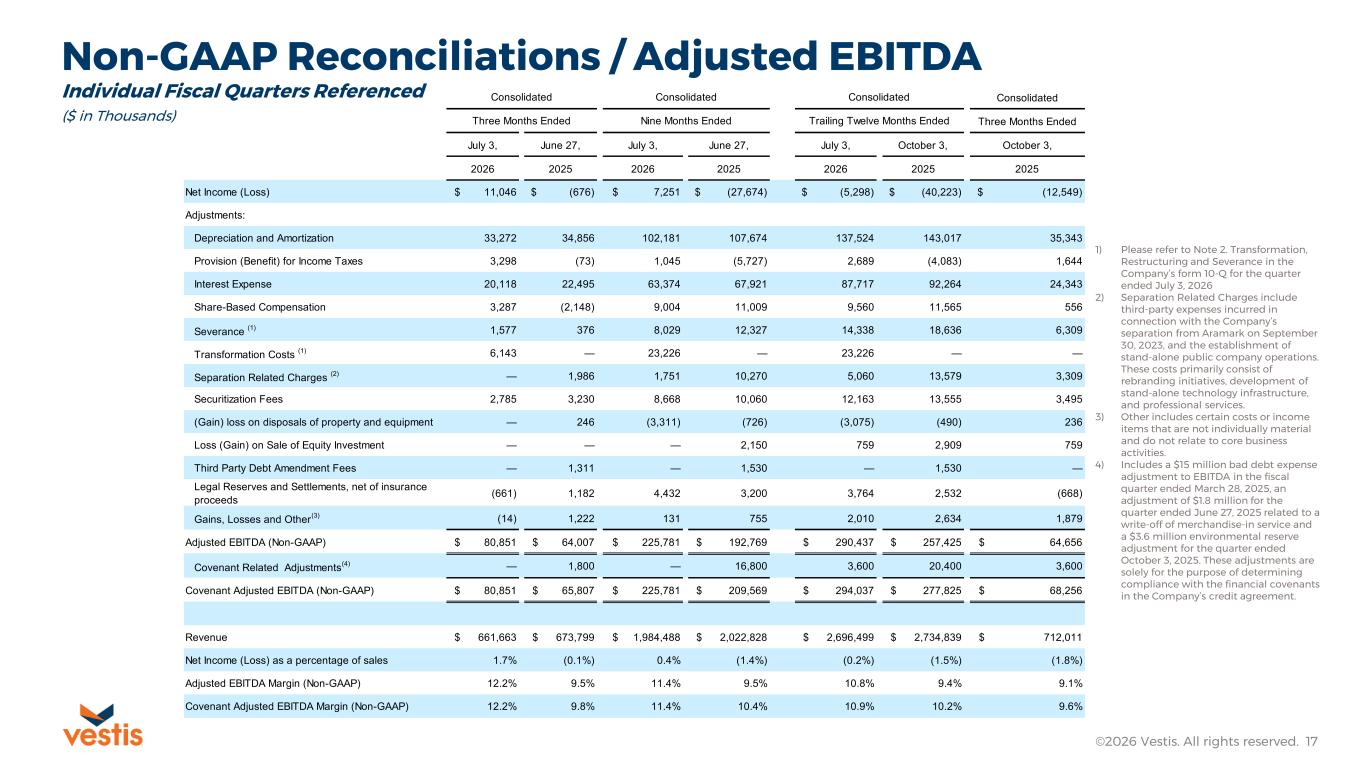
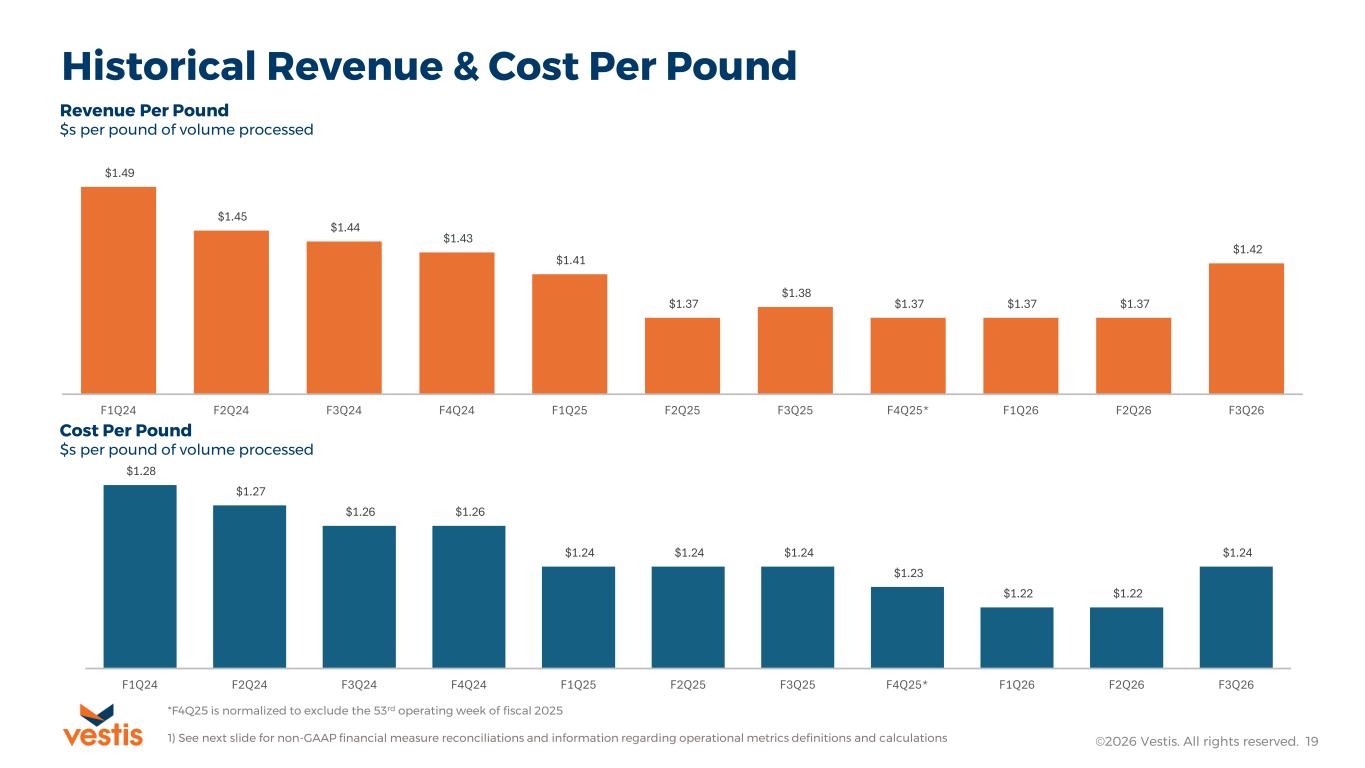
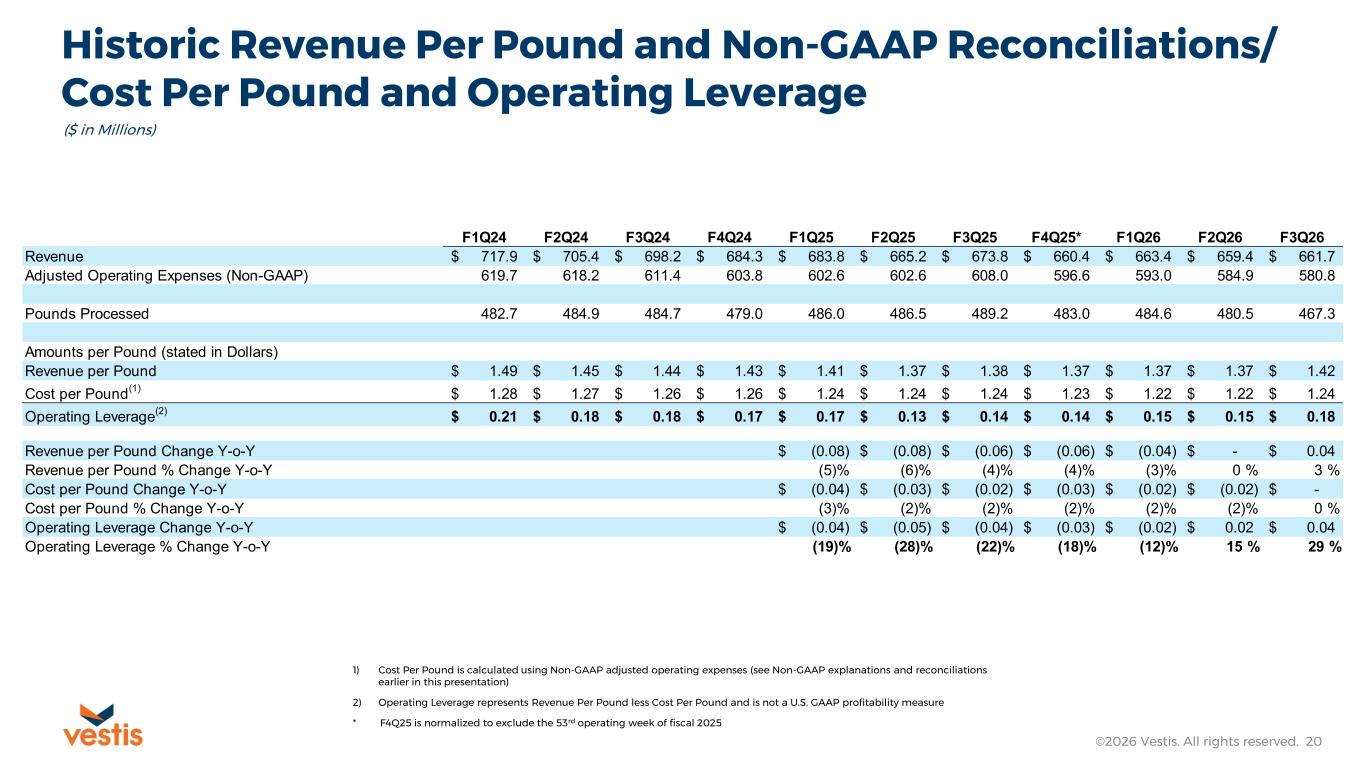
Thank you, Stephan, and good morning, everyone. We appreciate you joining us. Our third quarter results highlight consistent execution of our transformation plan. For the second quarter in a row, we grew adjusted EBITDA year over year and improved operating leverage, and we did it by running the same discipline playbook across the business. Third quarter adjusted EBITDA was approximately $81 million, an increase of roughly $15 million or 23% year-over-year on a covenant-adjusted basis. Adjusted EBITDA margin expanded to 12.2% from 9.8% a year ago. We again reduced our operating expenses, holding cost per pound flat year-over-year as we continued to exit low-quality volume, and for the first time as a public company, we grew revenue per pound year-over-year, up $0.04 or approximately 3%, driving a 4-cent improvement in operating leverage per pound year over year. With that context, let me walk you through the progress we've made against each of our three strategic priorities. Beginning with operational excellence, our key metrics are improving consistently, and those gains are holding. Compared with the fiscal third quarter of 2025, plant productivity increased by 9%, on-time delivery improved by 80 basis points, and customer complaints declined by 74 basis points. These results come from executing the same discipline practices well, consistently, and with the customer at the center of everything we do. When we run our operations consistently, service improves and cost comes out of the business. Those are the leading indicators of durable financial performance. We also made meaningful progress in exiting low-quality revenue volume, reducing our linen concentration by 6% on a year-over-year basis. We are encouraged by the progress, and we know there is meaningful room to keep raising the quality of the service and revenue and our revenue per pound. Importantly, these productivity gains are beginning to flow through to lower plant operating costs and a lower cost of services. Together, our operational excellence and effective cost management reduced our cost of services on both a year-over-year and sequential basis. We also enhanced operational excellence by streamlining key corporate support functions through an outsourced service agreement with a leading third-party provider. This should make us more flexible as an organization and enhance how we support our markets and customers, improving the overall quality of our service. It reflects a new way of operating at Vestas, one designed to lower our cost structure while giving us greater capacity to innovate in how we run the business. We should begin to see the benefits of this arrangement in our fiscal fourth quarter results and more significantly as we enter fiscal 2027 and beyond. As we close out fiscal 2026, we expect to sustain this operational discipline and build on the initiatives we launched in the third quarter. Beyond plant and network execution, we are creating a more efficient and nimble operational structure, one built to better support and anticipate our customers' needs, sharpen our strategic execution, and drive future profitable growth. Turning to commercial excellence, pricing execution was the biggest driver of our year-over-year revenue performance this quarter, and it sits at the center of the commercial disciplines we have built. Our progress starts with pricing. We continue to sharpen strategic pricing at the customer level, supported by data-driven tools designed to make our pricing and product mix decisions more profitable while we remain customer-centric. We also further strengthen customer segmentation, pricing frameworks, and approval discipline across national accounts, new field sales, and direct sales. Together, these actions should ensure that the revenue we take on supports operating leverage and adjusted EBITDA. That work is now evident in our results. After several quarters of narrowing declines, revenue per pound reached flat in the second quarter and turned positive in the third, rising $0.04 or approximately 3% year-over-year. This is the first year-over-year increase in revenue per pound since Vestas became a public company, and it was driven primarily by disciplined pricing execution reinforced by improved customer segmentation and product mix. We continue to put value ahead of volume. Pounds process declined by 4.5% year-over-year as we intentionally exited unprofitable business, improving quality of our revenue over the same period. At the same time, we are working to restore the commercial rigor that had eroded after the spin. That means enforcing pricing discipline, setting product mix targets on new sales, onboarding volume that is accretive to our network, and exiting business that does not meet our return thresholds. The principle is straightforward. Create durable value through disciplined decisions about what we sell, how we price it, and how we serve our customers. As these practices become standard across each market center, we expect operating leverage to keep improving through higher value mix, more consistent pricing execution, and deeper penetration of our existing customer base, supported by the ongoing expansion of our market development representative program while we continue to manage our costs on behalf of our customers and our shareholders. Our top line is still developing, but it is increasingly driven by pricing execution and better customer segmentation rather than solely focused on volume. Turning to asset and network optimization, the progress we've made so far this year comes from applying one consistent set of operating and commercial disciplines across the entire business to drive operating leverage. The same playbook deployed in every market, running that playbook everywhere has proven the model works, and we've seen this proof of our financial results so far this year, specifically in operational and commercial excellence. What we have not yet achieved is uniformity across our network the gap between our strongest and our lowest performing markets is meaningful many of our markets already operate at industry leading margins profitability and service levels while our lowest performers continue to weigh on the overall results closing that gap is our single largest opportunity the next phase of the transformation moves from applying the playbook broadly to executing it consistently but with consideration for the unique markets in which we serve, holding each market center to a more customized playbook, resulting in a higher standard designed to harmonize and optimize our assets and network. That is the work that will define our path as we exit fiscal 2026 into fiscal 2027, and it's work we've already begun. During the third quarter, we continued to assess and segment how our network is positioned across key markets using our available capacity to identify growth and optimization opportunities to further strengthen operating leverage while improving route efficiency and lowering delivery costs. As we optimize the network and position investors for growth, we will continue to evaluate asset sales where valuations present an attractive opportunity to unlock value, strengthen the balance sheet, and better align our footprint with higher growth markets. In parallel, we are evaluating our market positioning and network configuration so that we are ready to act on shifts in competitive dynamics. We are working to optimize routes while remaining particularly focused on the opportunities created by consolidation in our industry and on remaining a reliable, high-quality service partner that new and existing customers choose. As we work through the remainder of the year, I'm pleased with how we are executing our transformation. We're on track to deliver on all of our commitments for the year, and today we are again increasing our full-year guidance for free cash flow, which Adam will discuss in more detail. A foundational part of our transformation is our culture, and in particular, the accountability we are building at every level of the organization. We are aligning our teams around clear performance standards and our compensation around performance-based incentives that reward results, using them to drive stronger strategic execution and focus across the entire organization. On that point, our year-to-date fiscal 2026 results, along with our guidance for the fourth quarter, include accrued expenses for our management incentive bonus, or MIB, program. Creating a rewards-based culture was important to me as we set out our fiscal 2026 business plan and has remained paramount as we've stepped through each quarter this year. While we have historically had an MIB program, fiscal 2026 is the first fiscal year in which a management incentive bonus has been accrued for at this level since Vestas became a public company. Payments are subject to the final fiscal 26 results and certification by our compensation committee later this year. But these accrued expenses, while in the normal course for any business, have not been normal course at Vestas until now. Bonuses must be earned every year, but establishing them in our run rate is an important step towards building a rewards-based culture. Together with surveying our teams, investing in their development, and building our Vestas, this is how we ensure that every teammate is proud to be here, equipped to perform, and rewarded for delivery. In closing, I am proud of what our team delivered this quarter. With a stronger culture as a foundation, we are running Vestas as a pennies-driven business, one where small, deliberate improvements across mix, pricing, operations, and cost structure applied consistently in every market center can compound into sustainable operating leverage and long-term shareholder value one cent at a time. With that, I will turn it over to Adam to walk through the financials.
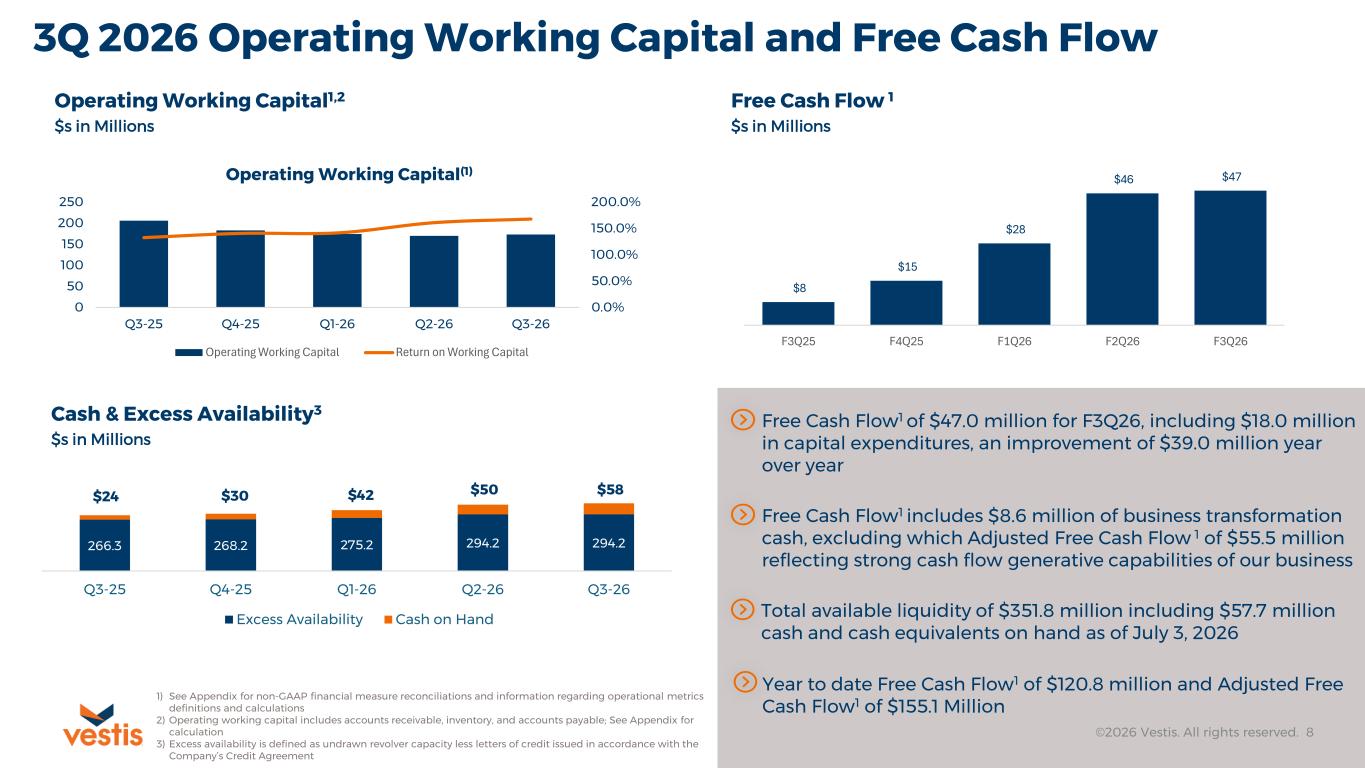
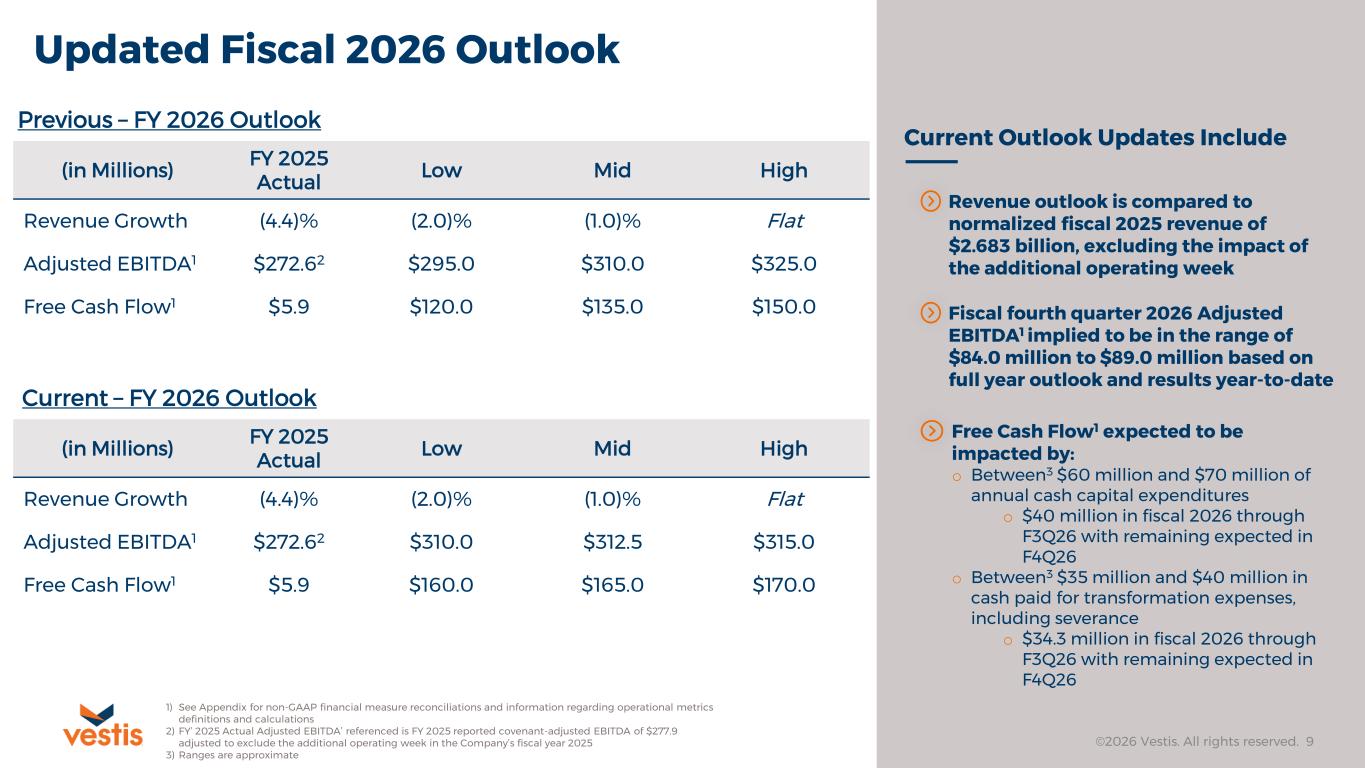
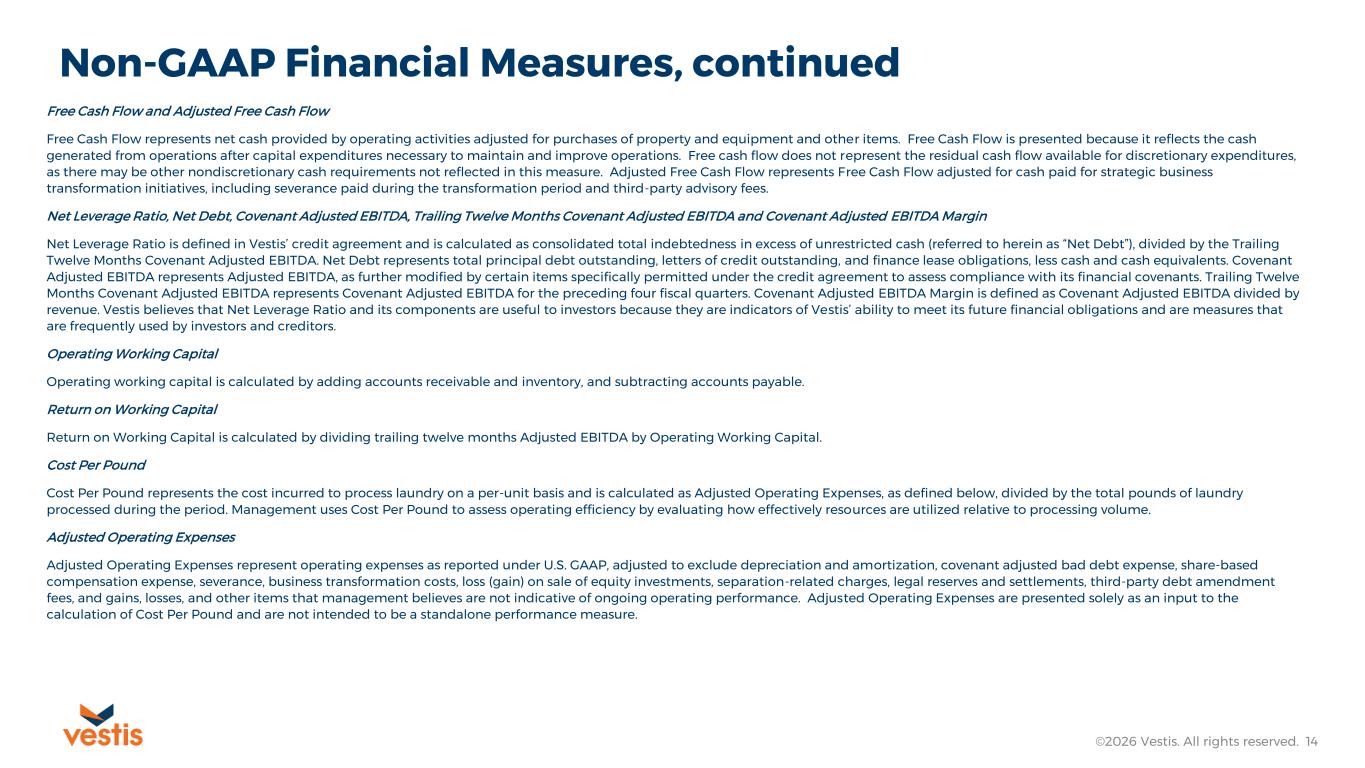
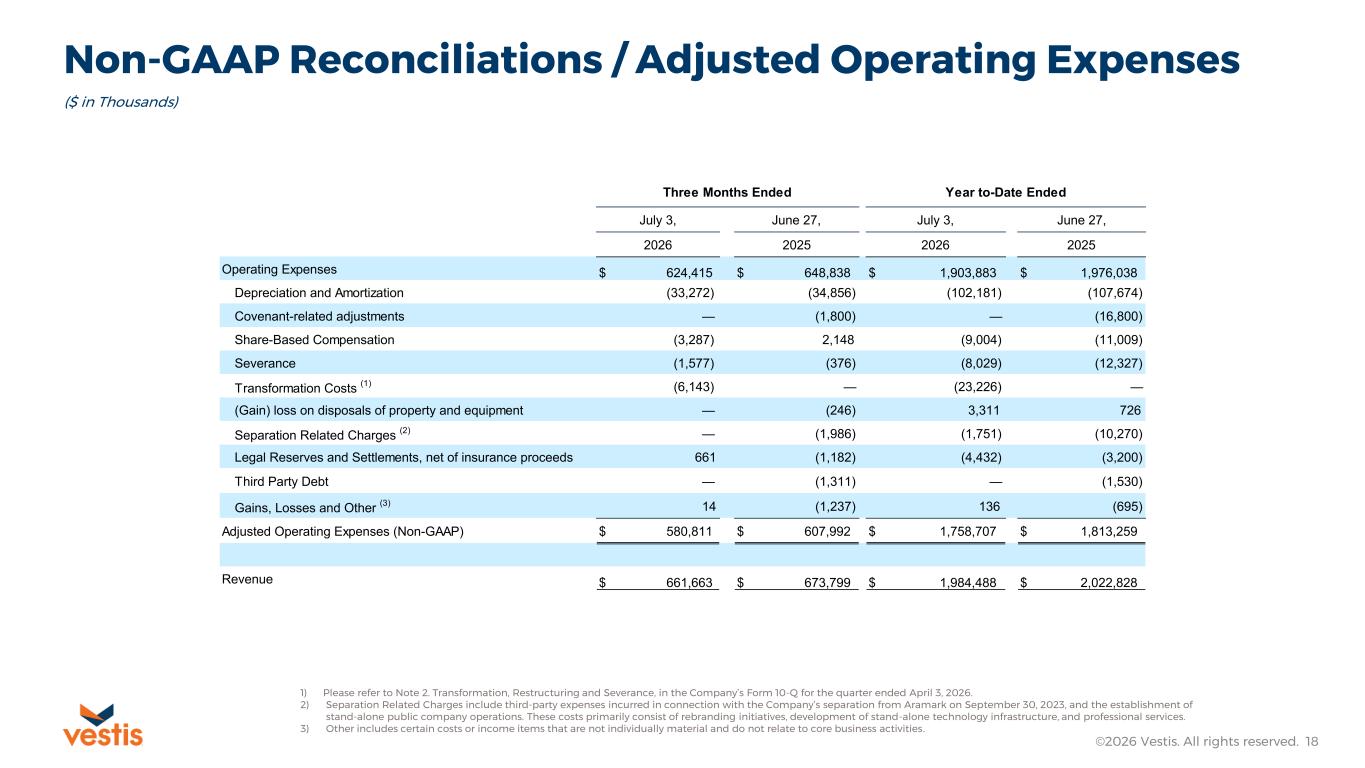
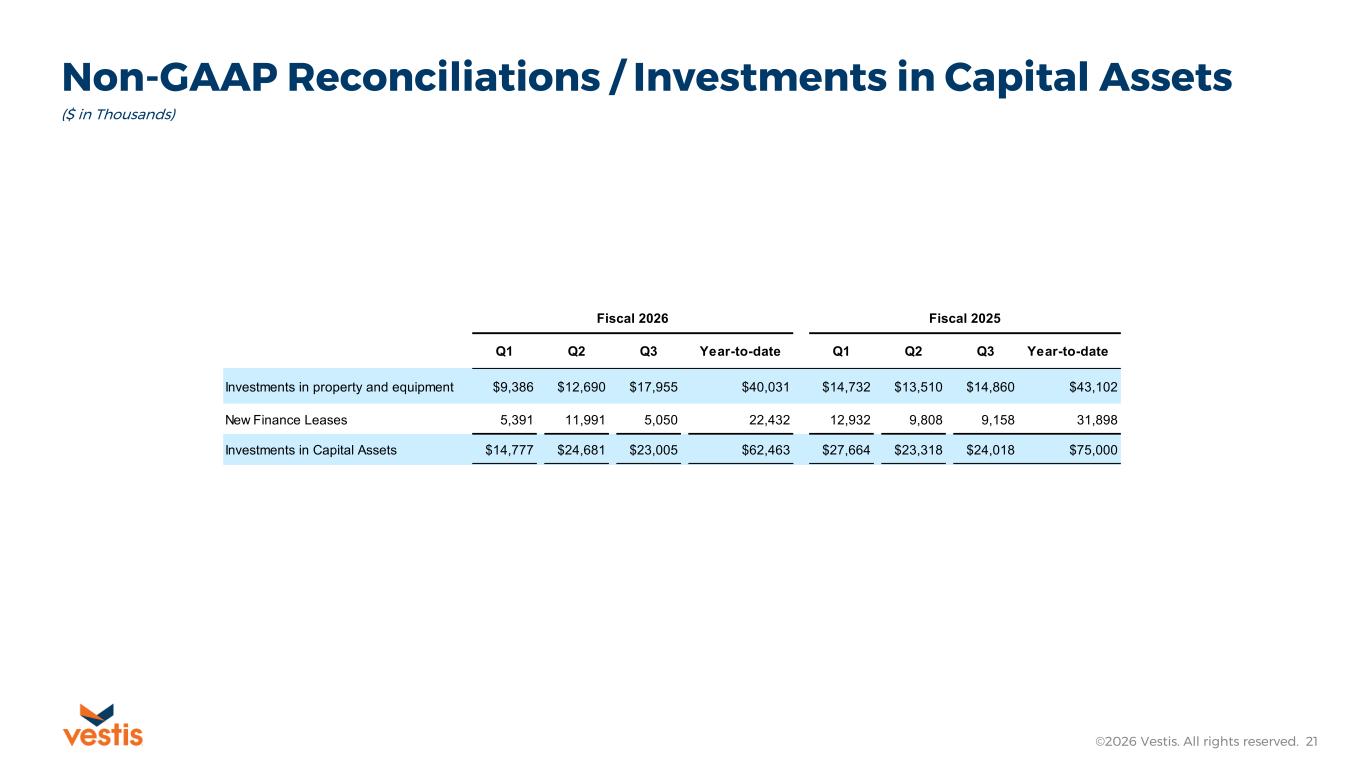
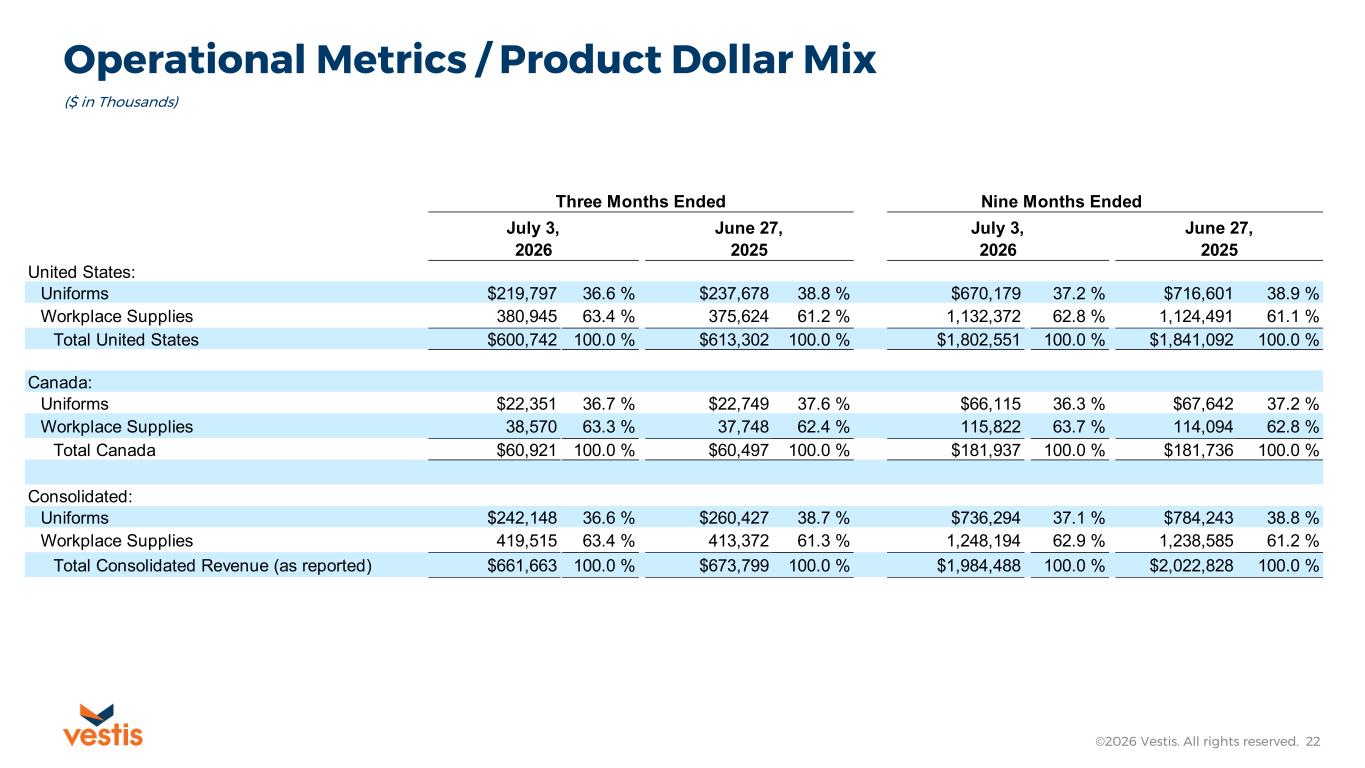
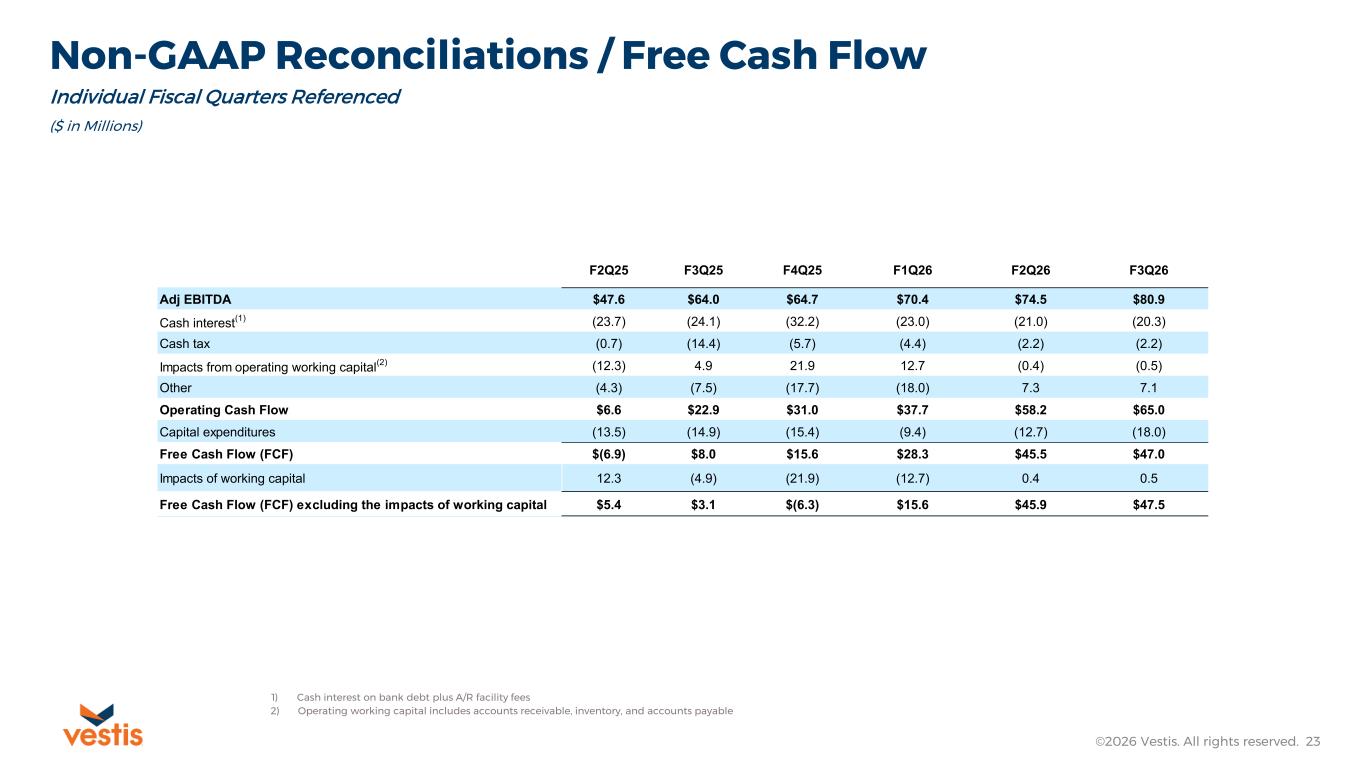
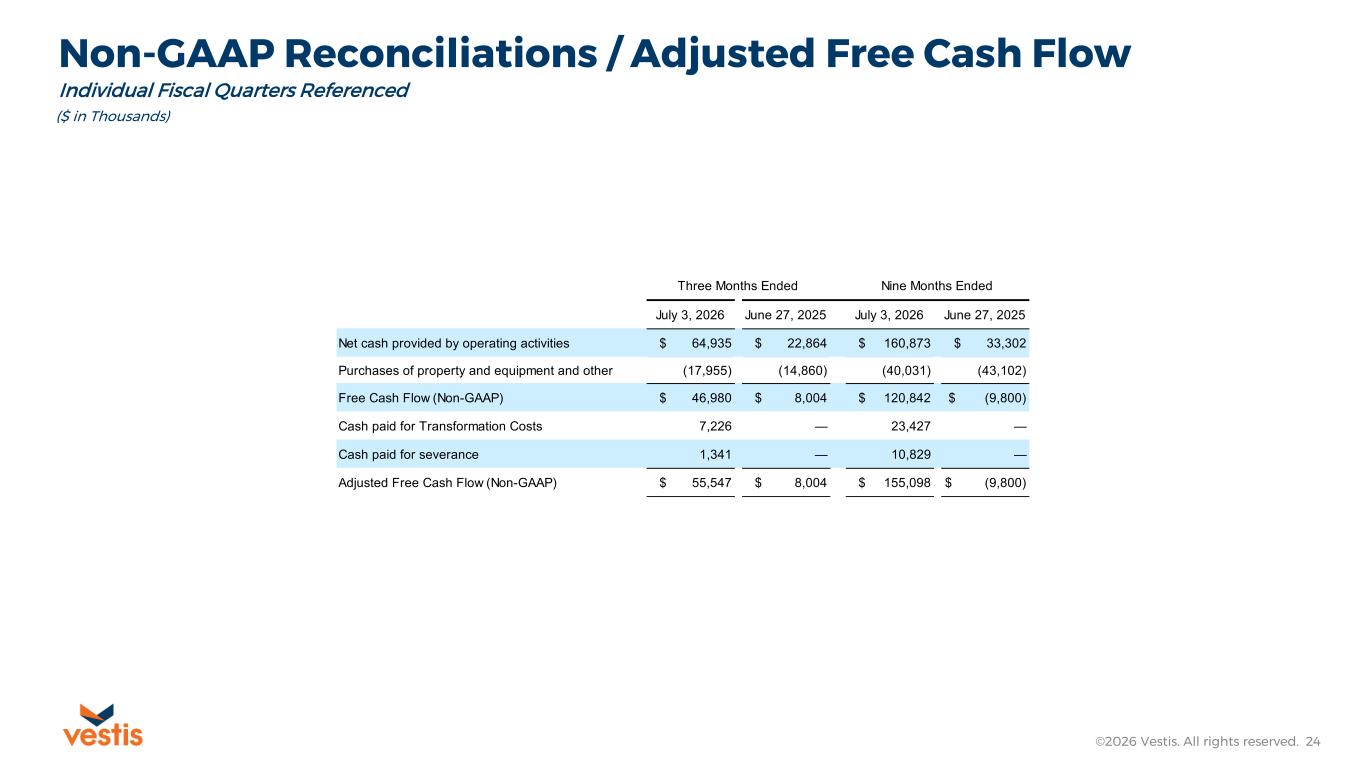
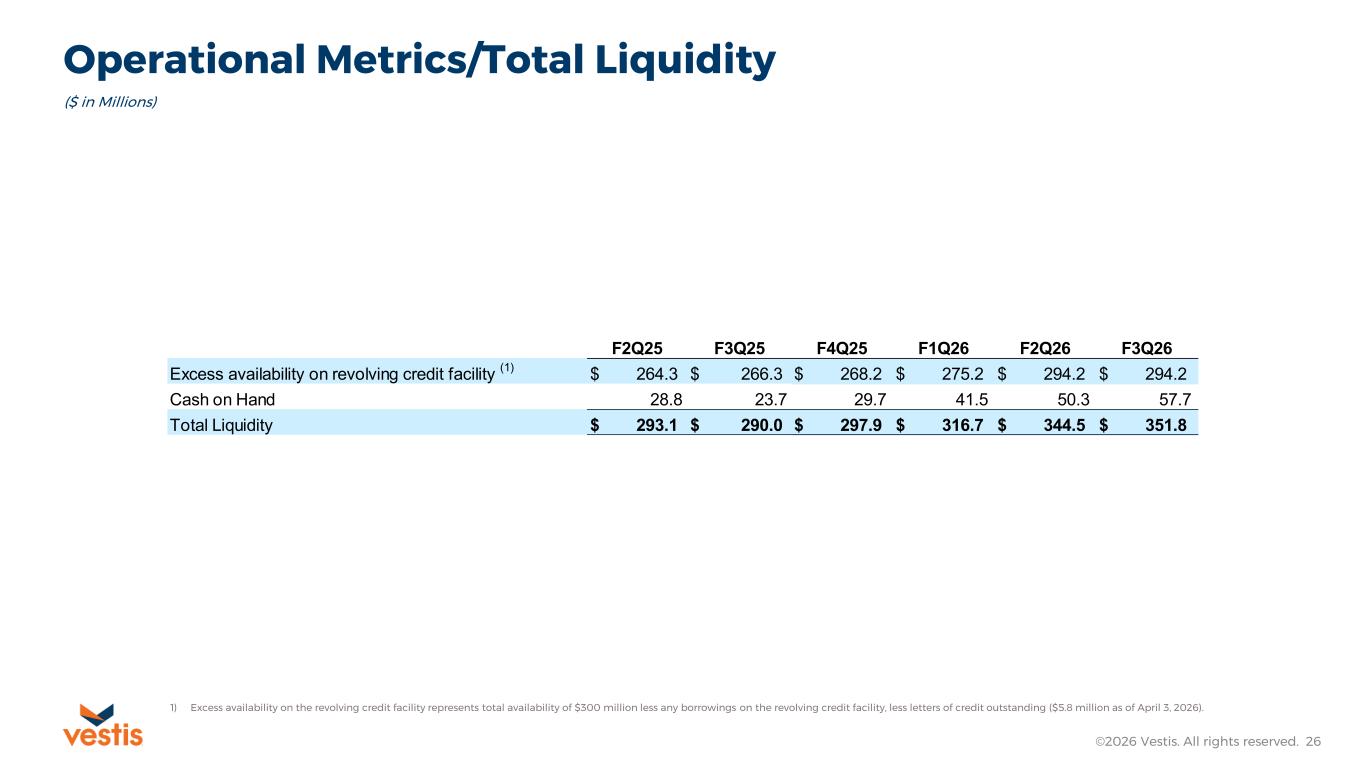
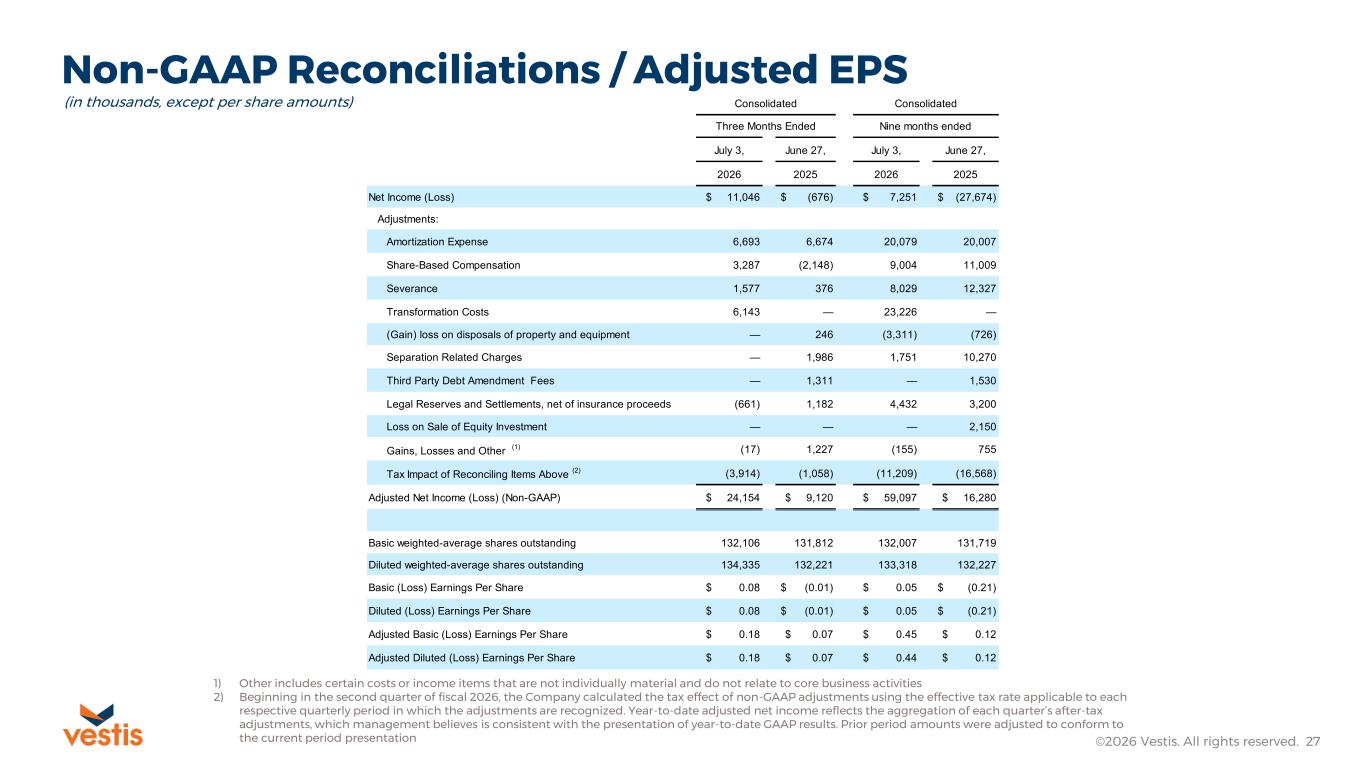
Thank you, Jim. And good morning, everyone. Revenue for the third quarter was approximately $662 million, down about 12 million, or 1.8% year over year. This includes a neutral foreign currency impact from our Canadian business. The decline was primarily driven by a 4.5% reduction in volume, measured as pounds processed, partially offset by improvements in strategic pricing, net of a $10 million decrease in one-time loss and ruin revenue. When excluding the impact of the lower one-time loss and ruin revenue from last year, total revenue was down approximately $2 million, or 0.3%, a sequential improvement from our fiscal second quarter, 2026. Revenue per pound in the third quarter was $1.42, an improvement of $0.04 year-over-year and $0.05 sequentially. The year-over-year increase in revenue per pound was driven by favorable changes in product mix, improved strategic pricing, and the intentional exit of lower margin volume. Volume declined by approximately 22 million pounds year-over-year, but the volume we lost was lower quality, carrying an average revenue per pound of approximately 55 cents. As a result, the decrease in volumes was accretive to our overall revenue quality. As we discussed throughout this fiscal year, prior to launching our transformation, our product mix shifted toward lower margin workplace supplies, particularly linen. In the third quarter, measured on a pounds process basis, linen concentration decreased by 6% year-over-year, improving from a 7% increase in the first quarter and a 4% increase in the second quarter, reflecting the early impact of our initiatives to drive a higher value product mix. Cost of services decreased by approximately $15 million year-over-year, driven by lower merchandise, plant, and delivery costs. This improvement reflects the increase in plant productivity that Jim mentioned earlier, supported by continued progress and execution of our operational excellence initiatives. SG&A declined approximately $7 million year-over-year, or approximately 6%, reflecting our continued focus on streamlining the organization and managing our total operating expenses. Net income increased by $11.7 million to $11 million, compared to a net loss of $0.7 million in the prior year. Adjusted EBITDA for the quarter was $80.9 million, with an adjusted EBITDA margin of 12.2 percent, versus $64 million, or 9.5 percent in the prior year. Excluding a $1.8 million adjustment for pre-spend-related inventory last year, adjusted EBITDA was $65.8 million in the fiscal third quarter of 2025, with an adjusted EBITDA margin of 9.8% on a comparable or covenant-adjusted basis, reflecting an increase of approximately $15 million, or 23% year-over-year, driven by our improvements in revenue per pound and operating leverage. When we look at our per pound metrics, the reduction in cost of service in SG&A drove a $27 million, or 4.5% reduction, in our adjusted operating expenses, which are those expenses that directly impact adjusted EBITDA. Taken in conjunction with our volume decline from the exit of lower quality revenue, cost per pound remained flat at $1.24 year over year. However, as previously discussed, our revenue per pound grew for the first time in Vestas public company history by $0.04, or 3%, driving an increase in operating leverage per pound by the same amount, $0.04 per pound. Notably, this marks the return to operating leverage per pound levels not seen at Vestas since the third quarter of fiscal 2024, directly contributing to our growth in net income and adjusted EBITDA. On a year-to-date basis, our transformation initiatives are contributing roughly $30 million of in-year cost savings towards our estimate of approximately $50 million. As a reminder, in-year transformation benefits are calculated by taking the accumulated year-to-date differences between our quarterly adjusted EBITDA for each quarter in fiscal 2026 and our fiscal fourth quarter 2025 adjusted EBITDA of approximately $65 million, when measured on a 13-week basis. We realized approximately $5 million in transformation benefits in the fiscal first quarter of 2026 approximately 10 million in the fiscal second quarter and approximately 15 million in the fiscal third quarter just completed with the remaining 20 million expected in our fiscal fourth quarter in line with our implied range for adjusted EBITDA as jim discussed during the third quarter vestus entered an agreement with a leading third party provider to streamline our corporate support functions primarily concentrated in back office activities within finance as well as certain information technology and customer service support functions this arrangement should create a more efficient and agile corporate support organization that will better serve our markets and customers and is expected to generate approximately 10 million dollars in annualized cost savings beginning in fiscal 2027, with some benefits realized as early as the fourth fiscal quarter of 2026. The cost benefits from this arrangement are already embedded in our guidance for the year and in our stated expectations for both the in-year and annualized benefits from our strategic business transformation. Turning to cash flow in the balance sheet, We generated $65 million in operating cash flow and $47 million of free cash flow in the quarter. On a year-over-year basis, operating cash flow improved $42 million, driven in large part by an $11 million improvement in net income, combined with a $4.3 million improvement in merchandise and service, and further supported by strong balance sheet management year-over-year, including a neutral impact from operating working capital during the quarter. Our strong cash flow results reflect the disciplined progress of our teams in working capital and balance sheet management, including several operational excellence initiatives focused on stronger collections, centralized purchasing, and tighter inventory control. Third quarter, adjusted free cash flow was $56 million. As a reminder, adjusted free cash flow excludes transformation-related cash expenditures, such as third-party costs and severance payments made during the transformation period. During the quarter, those expenditures totaled approximately $8.5 million, consisting of $7.2 million of third-party costs and $1.4 million of severance. On the balance sheet, at the end of the quarter, net debt was $1.2 billion, and our principal bank debt outstanding was $1.1 billion. During the third quarter of fiscal 2026, we used cash generated from operations to repay $30 million of term loan debt. During the quarter, we invested $23 million in new capital assets, which included $18 million in cash investments and $5 million in new finance leases for our delivery fleet. Year-to-date, we've invested $62 million in new capital assets, including $40 million in cash investments and $22 million in new finance leases for our delivery fleet. Throughout fiscal 2026, we've invested in capital assets that should provide clear financial returns to Vestas and our shareholders, in line with our growth mindset. Year-to-date, we've installed 30 new industrial washers and dryers across our plant network and are on pace to end the year with approximately 60 of these new assets installed, a significant increase from prior years. Additionally, we've invested in new information technology assets and programs to bring Vestas into the modern age. Taken together, these actions show that we can fund our transformation and position the business for growth without a step up in overall capital intensity. Our current capital investment strategy is holistic, yet targeted on the growth needs of our business. We ended the quarter with a strong liquidity position, with no debt maturities until 2028, and approximately $352 million of available liquidity. This includes $294 million of undrawn revolver capacity and approximately $58 million of cash on hand. Our capital allocation strategy continues to prioritize maintaining a strong balance sheet while allocating capital toward high return opportunities with a clear focus on delevering. Through disciplined balance sheet management and improved working capital execution, we are creating greater financial flexibility and strengthening the foundation to support the business over the long term. As discussed last quarter, we remain active in monetizing non-operating assets while evaluating our network for further optimization. We continue to actively market 11 properties with an estimated value of approximately $15 million, all in various stages of the disposition process, and more are under evaluation. As with prior dispositions, proceeds will be used to reduce debt, and we expect several to close in the remaining months of fiscal 2026. Turning to our outlook, today we are raising our full-year fiscal 2026 guidance for free cash flow. Reflecting the strong execution of our teams around disciplined working capital and balance sheet management, we now expect free cash flow in the range of $160 million to $170 million compared to a range of $120 million to $150 million previously. Our updated midpoint is $165 million in free cash flow for the year, $30 million or 22% higher than our prior midpoint. And this assumes $60 million to $70 million of cash capital expenditures, as well as $35 million to $40 million in cash paid for transformation-related expenses. As with our prior guidance, we continue to expect fiscal 2026 revenue to be flat to down 2% compared to our normalized fiscal 2025 revenue, excluding the impact of our 53rd week last year. We also expect adjusted EBITDA in the range of $310 million to $315 million for fiscal 2026, with a midpoint of $312.5 million, an increase of $2.5 million from our prior outlook. Based on our full-year guidance and results year-to-date, adjusted EBITDA for the fiscal fourth quarter is implied to be in the range of $84 million to $89 million. dollars. Additionally, we now expect our effective tax rate to be approximately 25 percent on a full-year basis, with a Q4 standalone rate at approximately 30 percent. Would that operator please open the line for questions?
Operator
The floor is now open for questions. At this time, if you have a question or comment, please press star 1 on your telephone keypad. If at any point your question is answered, you may remove yourself from the queue by pressing star 2. Again, we ask that you pick up your handset when posing your questions to provide optimal sound quality. Thank you. Our first question today comes from Stephanie Moore with Jefferies. Your line is open.
Hi. Good morning. Thanks, everybody. Congrats on a good quarter.
Good morning. Thank you. Good morning. Maybe just to start, you know, I would love if it would be possible for you to provide some color on how you're thinking about top-line revenue as you're closing out fiscal 26 and also beginning to look forward into fiscal 27. Probably a good place to start. Thanks.
I'll start it. May end up that Bill has a couple of comments as well when I'm done because I'm going to actually, and I like the question because I think a lot of answers can come together to kind of support this, Stephanie. First, I would say that, you know, the revenue per pound discussions we just had, as we move into Q4, I would say I'd classify it as we're encouraged by what we're starting to see. And if we continue on the trends we have, we're going to see growth in the fourth quarter. Okay, that's statement number one. As we move through this and get closer to the business, some things become apparent. First, that I consider us having six growth drivers in the business, that being direct sales, nationals, field, cleanroom, Canada, and kind of everything else. Five of the six of them are growing. The one that's not is field, and it needs to be corrected. We've made a recent move in bringing Steve in from the outside. He's been in the business three months. He's been in the business before and has held various CEO leadership roles, and I am confident in what I've seen in the first three months as he puts the strategy together to not just deal with the field issue that we have, but also to really bring some new views of how to grow this business in the other segments. I think lastly, the other thing I'd bring into this, because I'm not going to give guidance for 27 yet on growth, but I will tell you we plan to grow in 27. How will be a function of the next couple months of work? I think the other thing that's kind of new in the script today and the remarks was this concept of uniformity in the network and or top to bottom, too much variability. super enthused at the work that's been done now to kind of quantify it in quadrants and our first two quadrants are as good as you could imagine and exceed most any margin number you can think about the problem with some of these things and networks is averages of averages don't really tell how good you can be so we've segmented it we're going to focus really on quadrants three and four they will be our number one priority next year we've talked a lot about capital to grow maintenance versus growth capital um those two quadrants we will plan to invest about 70 percent our plant investments which is relatively modest quite frankly especially the free cash flow we're moving out with now um they our goal is to move them up each up one quadrant four turns into three three turns into two, and so it goes. And then at that point, the kind of growth becomes a natural byproduct because it's not just the margins of the business that they're kind of holding us back, but they're the issue for growth as well because if they're not performing at the service level, it's hard to bring on new customers and retain customers. And so we've seen it. It's real. It's there. And we're going to attack it, not just the way it's been looked at historically, but maybe some of the learnings from the past about asking our really, really good leaders to move to these quadrants to help us move them forward in a quicker way than just normal course of business because these networks are really about human capital, and we'll put the financial capital in, making sure it's matched to the right leadership. So, look, I'm encouraged by it, especially the revenue per pound. I know everybody wants us to grow volume. We will grow volume in 27. How we do that, as I said, we will update that at the end of Q4 as we talk about 27.
Appreciate all the color there, Jim. And maybe just a follow-up. Maybe can you help us explain what it means to be in the third or fourth quadrant here? What are the issues? How can it be fixed? How long do you think it can be fixed? And then probably most importantly for those listening on the call here, what's the margin gap or the ultimate impact of the bottom line?
So I'm – that's packed. So it is – the margin gap top to bottom is large. That's about all I'm going to say right now. But the great thing about it is that the top couple of quadrants, and the way we've done it, Stephanie, is if you've got roughly 120 to 125 market centers, we put them in clumps of 30. the top two quadrants I can tell you exceed anybody's margin of view of what this company can produce, even on an average basis. The two of them do, they're there. And if you think about that, then you know the business model works. It's correct. It's run properly. It produces outputs that, let's just say, people don't believe Vestas can produce. We do. We do it already in well over half of the market centers. The other ones struggle. And so it's up to us now in year This, to me, is the number one priority for next year for us as we move through transformation, is to move these quadrants up, put the right capital in, the right leadership in, and the right discipline in it, and we're actually building up very unique market-centered playbooks that leverage where each one is. And it's a long story about it, but the whole thing is still based upon service. That doesn't change. I'll ask Bill to add a couple of points to that in a second. But it is about getting those to where they look like they're, let's say, big brothers and sisters in the other network. And then this thing will, I think, will end up surprising people how good this can be as we move forward. But that's, I don't want to quantify it yet because there's a couple of nuances on how we want to deal with a couple of markets. And that goes hand in hand with the market dynamics that are going on in this industry right now. So we have to play that together. But it is material, and it is as big a transformation was to 2026 for us, this is that big in 2027 to get this right. Bill, you want to add anything? Yeah, I'll add a couple things. First of all, as Jim mentioned, that top quadrant is also, I know your question originally started with growth, Stephanie, is growing. And we've got some really good stuff.
And the margin gap you alluded to, that same gap exists between the top and the bottom across cost metrics, across service metrics, in some cases, and other metrics that are really important to us.
So we've launched an intense focus on that quadrant four, that bottom 30 market centers that is just kind of kicking off in full steam right now, leveraging some of the momentum we brought in through the year on some of the cost and service and quality metrics. And we're really excited about the fact that these places do need some love. They do need some capital.
And Jim mentioned a minute ago that, you know, between 2026 and, if you think forward into 2027, in quadrant four, we're looking to earmark about 42 percent of our CapEx in the plant to those market centers. And we've shown in 2026 that when we invest in those market centers with leadership, when we invest in them with some CapEx, that the market centers do respond and we do get better outcomes for our customers and for our shareholders.
I'd say the last thing on it that's important is that I don't think Vestis has ever properly put a bottom-up business plan together. It's happening now for 27. It'll be very unique to each market center. We will, in some market centers, where we're ready to really move growth out, we will move different resources and investments into them in 27 to do that. The other ones will stabilize them. At times, you don't really want more if you can't handle what you have, so you manage that as a priority. So it's going to be very unique. But, again, we'll talk more about it, Stephanie, when we roll out 2027 with a lot more flavor of the real question about the margin gaps so that you can have a better feel for it because it should roll up to produce our targets and financials for 2027. So thanks for that.
Thank you. And last one for me. Could you maybe help us understand what a normalized free cash flow conversion can look like here?
Yeah. Hey, Stephanie, it's Adam, and I can take that. Thanks for the question. So year-to-date through Q3, we're converting at about 54%, which you know is very much in line with what the company has said historically about free cash flow converting at around 50%. So that's where we're going to hold as we come through the end of the year. Our full-year guidance at the midpoint for our new free cash flow, midpoint of 165 over the 312.5 million for adjusted EBITDA, has us converting at roughly 53% as we go into FY27, and that's really where I think is a good place for us to exit. And as we go into 27 and give you more guidance for next year, you'll hear more for us on what we think the future could look like.
Okay. Well, thank you, guys.
Operator
Appreciate all the color.
Operator
Thank you. Our next question comes from Tim Mulrooney with William Blair. Your line is now open.
Yeah, Jim, Adam, good morning. Thanks for taking my questions. Jim, I was going to ask you about your plans to drive volume growth, but it sounds like you're planning to give the investment community an update next quarter on that. Is that correct?
All right. So I'm going to hold off on that. I'm just going to ask some different questions. And just building off of Stephanie's last question there, Adam, on free cash flow, what was the primary reason behind the updated free cash flow guidance? What drove you to push that higher?
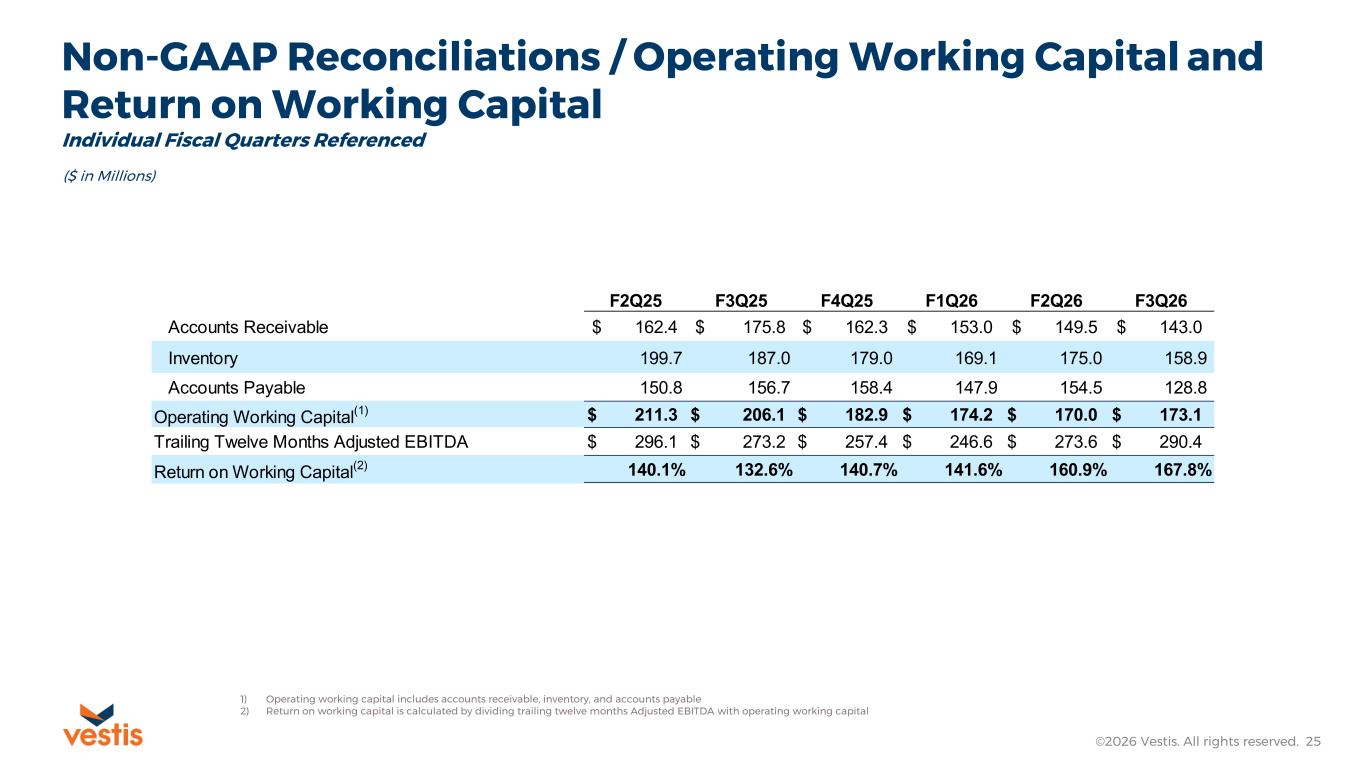
Yeah, it's a great question. And, you know, as we exited FY25 last year, we came out with about 2% conversion on free cash flow last year, about $6 million on the whole entire year. So as we started this year looking at the work that we knew we needed to do around working capital and balance sheet management and just converting adjusted EBITDA to free cash flow, we knew we had some things to go out and do as a part of our transformation. And full credit goes to the team all across Vestas, you know, under Jim's leadership, really driving good working capital management. We've been neutral on working capital for the last two quarters. We had a little bit of benefit from working capital in the first quarter. The team's driving really great collections. Our DSOs are at the lowest of big bins if the company went public. So it's really a holistic, cross-functional effort to drive free cash flow conversion, and it's exceeding our expectations, you know, especially compared to where we were coming into the year from FY25. So as we look at the last two quarters of delivering more than $40 million in free cash flow coming into Q4, it just gives us a lot of comfort to say, hey, Q4 is going to be another quarter where we get, you know, that mid-40s range that we've been putting up the last two quarters. So really excited about the work the team has done, really encouraged about the future around free cash flow conversion we're normalizing back to where the company has discussed this metric so far and again i'll give full credit to everyone across the company it's been a team effort yeah yeah it was good to see that um it was good to see that and i looked at the working capital metrics there it looks like some things are moving in the right direction there as well so that that was good to see not to cut you off it's really exciting this quarter because a big part of our free cash flow is net income We have $11 million of net income in the third quarter, and we've turned net income positive for the year, which is really exciting. So to see some of that free cash flow coming from net income and positive earnings per share is just great.
Yep, that makes it easier. Okay, that's really helpful. Thank you for all the color there. Just the last one for me, the EBITDA run rate that's kind of being implied here for the fourth quarter. Is it fair or is it a good way for us to think about that as a sustainable run rate as you are entering into fiscal 2027? 27, or are there some seasonal factors here in the fourth quarter that would prevent us from thinking about it that way?
I think it's a stable place for you to begin thinking about how we're going to build up FY27. Obviously, there's going to be growth in 27. We're targeting enhancements and efficiencies. We're going to come into 27 with a cost-neutral mindset. That's how we build our plan. But I think it's a great way for you to begin thinking about how we would build that. And, of course, there's some minor seasonal fluctuations throughout the year. You certainly saw that in FY26, and you've seen that before. But we're able to manage through that, to be perfectly honest with you, so I wouldn't expect there to be too much fluctuation in that run rate as we enter the year, and it will improve.
Okay. That's really helpful. Thanks, guys. Thank you. You're welcome.
Operator
Thank you. Our next question will come from Andy Whitman with Baird. Your line is now open.
Great. And good morning. And thanks for taking my questions. I guess just the annual revenue guidance, you got three months in the bag. And when I do some math on it, it looks like your fourth quarter revenue guidance is up at least 2%, three percentage points, more than that, to kind of the top end here. So, like, I guess I'm just kind of curious as to what's that comprised of. You know, is this just, you know, you've been running off the volume and the volume comps. Is there, I know, Jim, you talked a lot about your market development reps trying to get fair pricing. How much of a factor is that? Is the macro contributing or hurting you in terms of ads, stops, in terms of number of wares at your existing customers? I'd love to hear you just talk a little bit about the components behind that. and how they drive your fourth-quarter improvement, which obviously gives you that good top-line momentum or much better top-line momentum into 27, please.
I'm going to have Adam start on the 2% number because we have a little bit of a different number. Let's clean that up, and I'll give you a couple of thoughts on the rest, okay?
Yeah, so, Tim, the way I think about Q4 revenue is let's just compare, establish what our baseline is to make sure we're all on the same page. Q4 2025, if you go look at our printed materials, you'll see a $712 million number there. You have to normalize that number for 13 weeks because we had an extra week in Q4 of fiscal 25. So that $712 becomes really around $660 million that we're going to use as a comparative. So just start there. As you've seen throughout the year this year, we've done a really great job, credit to the team, for stabilizing the revenue run rate around that $660 to $663 million range all throughout the year. And that's a great accomplishment coming out of, you know, down 3% in prior year. So I would think about Q4 as we're moving in to exit the year as being generally around the same place for where we are in Q3, which would still be year-over-year growth versus Q4 last year. But I think that's going to get you more in the down 1.5% range if I just do the comparative there. So I just wanted to kind of lay that out. If you have any questions on that, I can take them, and then I know Jim wants to add some things.
So, Andy, on some of the build-ups, I think one of the things that we went through in the discussion today, which I'd like to point your eyes to, is this concept of the revenue per pound leaving the network versus the cost per pound, to just level set the magnitude of why the focus has been what it's been in 2026. And that is that we essentially had looked at the commercial side of the business and recognize that what had been going on prior to starting this transformation was all revenue, any revenue is good revenue, it's all creative, and that's not the way it works. Now, we are almost four quarters into it, and the 4.5% of volume that left us in the quarter had a revenue of 55 cents a pound. The business has a cost per pound of $1.24. If you just let that settle for a minute and you say to yourself, you know, what's more important right now, getting the right volume in the network or how much of it, I think you can see pretty much in those two gaps of why we're doing what we're doing. And this is a couple quarters on. As far as, you know, when does that stop, I think that just is dependent upon each customer's decision on how they look at things. But our job all along, in many of these instances, it's almost non-regrettable is what we call it, but that's not our long-term strategy, to be clear. We are going to grow volume. I'll give you a couple of touch points right now on why I'm pretty enthused about what's getting ready to come. I talked about Steve, his background. He's putting his strategy work to it. We've got a new leader out in the field, Carla. Carla Perez comes to us with background as well in this industry. She's off and running as well. We've talked about MDRs a bit. The MDRs are the target is to, and we'll give you exact numbers when we get into 27, But we're planning to about triple to go four times X on the MDRs that we have. But where we sit right now as we exit, as we come out of Q3 and into Q4, is the average weekly revenue being produced by the MDRs is almost twice as what we used to get out of the new sales rate. Twice, okay? So you'll see more about that as we go forward. I would say in your ads over stops, the ads over stops are somewhat neutral to a little bit, It's not helping us, we're not getting a lot of lift. A lot of that, though, is also tied into some of those customers that were the 55-cent-per-pound customers who had made certain choices that are just going to have some more stops coming out of them. That's just the way the business runs. But to me, as we move through this, direct sales is turning for us right now. The NDRs are already going for us. National accounts continue to do very good. Canada is growing way above, well, not way above, above what we thought. I'll put it to you that way. And, you know, as I talked about, it's just a field. And we can fix the field. The field, a lot of that will be the MDRs fixing that. And a lot of that will be the quadrant three and four market centers joining us and the rest of the company where we need to be. And I'll close with this, is that for the first time ever, we're going to have a leadership conference in the first month that we start the business that everyone walks out of line on what their exact role is to grow this business. And it will come naturally because of the alignment of these in a route-based business. That's how it works. So it's not one thing that you win with. It's four or five. And so it'll come. We'll do Q4, and we'll show that in 27, how it's going to come, when it's going to come, and why it's going to come.
It's really exciting. You can look at our filings and see Canada's revenue is increasing year over year, about 70 steps already in Q3. So we're already going to see some of this.
That's a really good answer. Maybe just one other thing to drill in, because I really feel like your MDR, your market development reps' comments, Jim, are important, particularly when you said you're getting a pretty great productivity out of them and you want to invest there. Can you just refresh mine for the benefit of everyone's view as to what their focus really is? I remember you saying when we met this past summer that there was going to be a big focus on getting fair price there, but it also sounds like you're tasking them with trying to get some deeper penetration of existing customers. Are those still the two primary thrusts of what the market development reps are doing for you? Let me say it to you.
First, let me segment the business a bit. They are really targeting this non-national space. It's about half of the revenue that they're after when you put circles around them. And it's much more of a patch-based growth strategy because the industry allows, if you're performing as you should be, allows a rational API once a year that's signed in the contract, and we should be able to go out and get that. And that's somewhere between 3%, 4%, and 5% typically in the industry. Investors' history has been we don't get it, and we get less than zero. And the NDRs are out changing that pattern, and they are showing us it works right now. And they're not in full force. We only got about 30% of them in the model right now. But Steve and Carla and team are running down the road to close that and get them in full flight as we move into 2027. That's not to say we won't go after new rooftops with the rest of them. We're going to do that. But we will do that when it's – and they're already there. So we're not abandoning anything. We're just splitting it as we started here in the Q3. And, yes, at the same time that they're going in to negotiate and ensure that we secure renewing contracts with the right APIs in them, they're going to try and sell additional value to the customer, be it through various channels. Could be ads or stocks. Could be direct sales coming in. It could be other issues that they're going to go out there and get that. And we capture that if it is a lift as new revenue. And that goes into the calculation of what the investment can be in return. And, by the way, the average is 2%. We've had weeks that's been higher than 2% in the last couple of months. So it's very encouraging, quite frankly. It's what we kind of thought it would be. And, by the way, the way that they'll then be incentivized and earn returns on this for us is the way the entire patch of land grows, not just each individual account. and that means you have to retain customers at the same time. Therefore, our churn has to continue to go down, and therefore they also have a very, very loud voice in customer satisfaction that we'll add more into next year about some real digital changes we're making this business that perhaps the industry hasn't seen yet to make sure that, A, we prevent defects, and, B, if we have them, we use those to our advantage in the customer relationship versus the path. So you'll hear a lot more about the NDRs, and we'll actually quantify it when we come out in 2027, okay? Thanks a lot.
Operator
Thank you. Our next question comes from Manav Patnaik with Barclays. Your line is now open.
Hi, good morning. This is Ronan Kennedy out from Manav. Thank you for taking our questions. You delivered a 3Q EBITDA beat and expect the full remaining $20 million of the FY26 transformation benefit in 4Q. Yet, I think the $10 million prior guidance high upside was removed. Can I just, apologies if I missed this, just precisely confirm the puts and takes to that. And then the second part to an evident question is, if the implied 4Q of roughly to 84 to 89 is an appropriate starting point for 27, how should we think about the largest drivers of improvement from that level? Is it field recovery, the quadrant improvement, pricing, volume, network optimization, or something else, please.
Yep. Hey, Roman, I'll start out. I know Jim will want to jump in here on your last part about the levers. Let's just talk about the adjusted EBITDA guidance. It's actually an increase in the midpoint. We were guiding you $295 to $325 for the year as we came out of Q2. That was a midpoint of $310 million. Remember, last call, we were giving you the sequential 5% increases and then 5% to 10% for Q4. I would say we're dead end overperforming a bit in Q3, and we're dead in that range for Q4, and we feel comfortable raising that midpoint to 312.5, even though we've well at the top and down, we're just tightening the range as we see the business perform through the end of the year to give you a really tight guide for where we expect Q4 to be. I mean, what's driving that between Q3 and Q4, your question on the transformation benefits, I outlined how to think about calculating that and how we think about it in the script. But essentially, it's each quarter's adjusted EBITDA in FY26 compared to the Q4 25 exit rate of about $65 million. And so with 70 million in Q1, that's less 65 is 5 million. You do the math in Q2. You do the math in Q3. The 81 less 65, that's how you get to 15. And as you go into Q4, you can do the math there, and that's where you get the additional 20. So we're at a run rate coming into Q4 of about 81 million. We're only about 5 million away from the new midpoint, 86.5 million for Q4. That's how we get the $20 million, $15 million of it's already in the bag. And the drivers there is our outsourcing project that we launched in Q4. Many thanks to the team, a very heavy lift there. We signed a new contract with a leading third-party provider to outsource most of our back office functions in finance, customer service, call center, as well as some areas of information technology. And that's going to give us the benefit in Q4 with that kind of steady revenue state that I mentioned on a prior question when Andy asked about it a moment ago. So that's kind of the buildup for Q4 as we exit into FY27. We're going to give you more detail and color on how we build up the FY27 guidance when we get later in the year. But hopefully that answers your questions. And if I didn't get everything, let me know and we can go back over something.
Let me add one point to it that we put in the script is that we are at this concept of a bonus program. You know, if you think about what we talked about, and I'll even size it for you, when we finish this year, it should come in somewhere between $15 million and $20 million of what was not in last year's EBITDA that is now in our EBITDA. And you can do the math on what that looks like. And so, you know, how this thing builds up for 27th, I'd rather hold right now because we're still finalizing the quadrant work on where it's going to come, the MDRs, the new sales, a couple of other things Steve and Carlin's team are working on. So I don't want to quantify it yet because I think it's super important to quantify it. As we move out of transformation and into more of a project initiative world, we'll be able to bring updates to, number one, how it's built and then, number two, how it's performing this year. So I'd hold on that, but I don't want you to undersell the fact that $15 million, $20 million has been banked for us, that we don't have to bank again the same way when it comes to year-over-year margin degradation. And that's a good story for us, and it's good for our people.
Thank you both. That's extremely helpful. If I may shift gears, I think you indicated decisions around certain market centers and network optimization are being evaluated alongside broader industry dynamics, including potential industry consolidation. Could you just provide your current assessment of current industry dynamics, any changes there, and then any potential impacts of industry consolidation in terms of how that potentially shape your thinking around investing and retaining, consolidating, or exiting certain or specific markets?
Well, I would, at least the way I think about it, I'd bifurcate it just a bit. Number one is that, you know, the market centers, the market centers in the new Vestas going forward that are in, that are not performing as they need to, this is, these things, once you put the capital in and the right leadership in, number one, I tend in the past to see them work, and by the way, you can pretty much see that somewhere between six and eight months from the point you put the capital in, and I've seen the impact in this network that can have in a very positive way. Next statement is, you know, in certain situations that market dynamics currently today may be allowing a node in the network to not return shareholder value, you might consider exiting that market center and doing it in different ways. So that's one way you have to look at it. We all know there's a merger going on, a potential merger in second request right now. Now, how that plays out, where it plays out, how that impacts Vestas or not, and how the FTC is thinking about the various scenarios that can unfold would also guide us into what we might do longer term. And that's not to say, by the way, that Bill and team and the engineers aren't continuing to optimize routes, lower the cost as it is. But we've got to make sure each one, as you think about it, essentially is a small business in and of itself. And if it's not shareholder accretive for us to put capital allocated to it and return it to shareholders, then we have another obligation to deal with it, right? And we'll do that. But it's not very quick, but we're starting. It's already started now. We're building it up, and we're going to have really good conversations with you about that. And, of course, I'm not going to tell you what's what and where they are, but I will tell you that the really, really strong ones exceed my expectations about what this business can actually do, and I'll leave at that on that point. Thank you very much.
Operator
Thank you. And once again, if you do have a question, you may press star 1 on your telephone keypad at this time. We'll go next to George Tong with Goldman Sachs. Your line is now open.
Hi, thanks. Good morning. You continue to exit low-quality volumes in the quarter. Can you discuss how much of the business you still see as low-quality and how much additional exits you expect to make over the near-to-medium term?
Hey, George, it's Adam. I'll start there, and I know Jim will want to jump in and talk to you about kind of the future and how we're thinking about that. Just from my perspective, I think it's underappreciated the level of effort that the team has put in this year to really exit to this unprofitable volume, to do it at the degree that we've done it, to take out 55-cent revenue per pound and target it in that way and still maintain a very stable top line throughout the year It's a Herculean effort, so full credit goes to them. I think we're kind of lapping the exit of the majority of the bad lemon volume that we saw came into the business last year. But as you know, purging your network of unprofitable volume is a continuous journey that we're always going to be on. But I think as we enter into Q4, you can really start to see that we've taken out a significant amount of that volume. And kudos to the team for the effort there.
I'll give you, I guess, one more point, George, is that, At least a lot of last numbers I remember looking at late last week was it's about 75% of that volume we kept and about 25% exited us. And as to where it goes, it just depends as each individual customer assesses how they go forward and the choices that they have. But I would also be fair to say that I do consider in the past that this was a low pricer in the market, and not by little, but by margins that don't make sense at $0.55 a pound when your business is $1.24 to run it. So I hope they all stay with us and give them a chance to grow back and support their companies. That will be their choice. We had to make the choice to stop the degradation of that. We just couldn't put it away at the right rates. And then each year, by the way, that will change and we'll modify what we do, how we do it, where we do it, based upon where the cost curves are going to go, not where they've been. And so all those kind of factor into what happens in the future, George.
The RPP growth is driven by, certainly as you talked about, the exited volume, but there are substantial amounts of customers that are paying more, and that's also driving the rpp growth on a year-over-year basis that's helpful um and then you discussed initiatives to sharpen your pricing strategy can you estimate how much pricing is increasing on a like-for-like basis once you exclude the benefit of exits from low quality volumes um and what your target is for pricing increases on a like-for-like basis the way i'm The reason I'm not going to answer that right now is simply because that's going very nicely
in every word but the field, and the field is where we have to go forward here. And so most of that activity was in the field accounts. You mean non-national field, non-national if you call it that. So, George, I think that ultimately that section of the business, which is material in this business, needed to take step one this year, and we'll move into step two. A lot of that depends on the quadrant that you're in. So if you look to quadrant one and quadrant two and halfway on quadrant three, the answer to that question is going to be very good and fine and adjustable, and the MDRs will manage it and grow it. The ones that aren't providing the right service, that are not taking care of the quality of the product at the right rate and then put a bad dispatch on the street that we're going to fix, they would have less chance to get that. And so averages, averages get you where they are right now. So I think it's more about, again, and we'll tell you that, George, when we build up 27 because we're going to segment the initiatives where you can better understand the power of each lever, not just one outcome number, and we'll question whether or not we can get it. We'd rather give you one level down in a manner that converts so you can manage your models the right way and we can manage our business the right way, and we'll get a little bit tighter of that as we end Q4 and Q27.
Operator
Thank you. And we'll take a follow-up from Stephanie Moore with Jefferies. Your line is now open. Hi.
Good morning. Thanks. Look, I think, Jim, you gave a lot of color this morning and appreciate you wanting to build a bottoms-up plan for 2027, but maybe it would be helpful if you just kind of tell me what's maybe off-sides in my thinking here. I mean, if we were to just annualize the updated 4Q EBITDA performance, we called out the 25 in cost cuts for 2027. Obviously, we have a lot of work doing, but we've talked through the quadrants. But, again, if we kind of annualize that math for 4Q, make some assumptions there, I mean, is that a pretty good run rate as we start to think about go-forward levels? I mean, again, maybe just tell me what I could be missing in that math. And then at the same point, if we look at the margin profile, it looks like you're going to be at about 14% for the fourth quarter. Again, you know, where can that be over the next couple years, too? So just wanting to put a bow on everything that was said today.
Yes, Stephanie, let me jump in at that. I'm going to give you kind of some color here to think about Q3. And as we enter into 27, I know Jim will want to add as well. So if you just take the midpoint of our guidance for Q4, which is $86.5 million, and you put that over roughly the same revenue that we had in Q3, if you just kind of hold that flat, you're going to get an exit EBITDA margin of around 13%. So it's a bit lighter than what you mentioned, that 14%. I just wanted to call that out to make sure you get that level in your models. And the way you can think about the wrap just for today is 86.5 exiting times 4 is going to get you roughly $350 million. It's about $346 million. And I don't really want you to add that $25 million, and I'm going to tell you why. Embedded in Q4, 26, is $20 million of transformation benefits, right? So if you annualize that 20 times 4, that gets you roughly $80 million. That's where the $75 million annualized is coming from as we exit Q4. And there's going to be improvements, and there's going to be enhancements in 27, and we're going to talk about top line and all of that in more detail. But I think if you kind of stick there in that general range for now, and let us give you an update in a few months, it would be appreciated.
And let me say this. So I respect exactly what you said, and I agree with what Adam said. There is a piece, though, that a lot of this depends what we're going to invest back in the business in 2027. And so I do believe that the best thing we can do is work on our balance sheet and reinvest in this business and make sure the shareholders are doggone happy when we're done. So that the reason we're not done with the work yet, Stephanie, we've got to finish that off the next couple of months here inside these quadrants, taking Steve's strategy, taking the market dynamics, and laying them over the network to be able to say, do we go up, stay the same, or go up based upon what Adam just walked you through, based upon what we need to keep versus distributing the bottom line, but knowing that every time we keep a dollar, we're going to get more than a dollar back. So just give us a little bit more time, a couple more months, and I think we'll have something nice to share with everybody at that time.
Operator
Thank you, Adam.
Thank you. Good chatting with you.
Operator
Thank you. This concludes the Q&A portion of today's call. I will now turn the call back to Stephan Neely for closing remarks.
Thank you, operator, and thank you everyone for joining us today. We appreciate your time and your interest in Vestas. If you have any questions, please don't hesitate to contact us at ir at vestas.com. We look forward to speaking with you again next quarter. Have a great day.
Operator
Thank you. This concludes today's Vestas Corporation Fiscal Third Quarter 2026 Earnings Conference call. Please disconnect your line at this time and have a wonderful day.