Operator
Good day, and thank you for standing by. Welcome to Ally Financial's second quarter 2026 earnings conference call. At this time, all participants are in a listen-only mode. After the speaker's presentation, there will be a question and answer session. To ask a question during the session, you'll need to press star 1-1 on your telephone. You will then hear an automated message advising your hand is raised. To withdraw your question, please press star 1-1 again. Please be advised that today's conference is being recorded. I'd now like to hand the conference over to Sean Leary, Chief Financial Planning and Investor Relations Officer. Please go ahead.
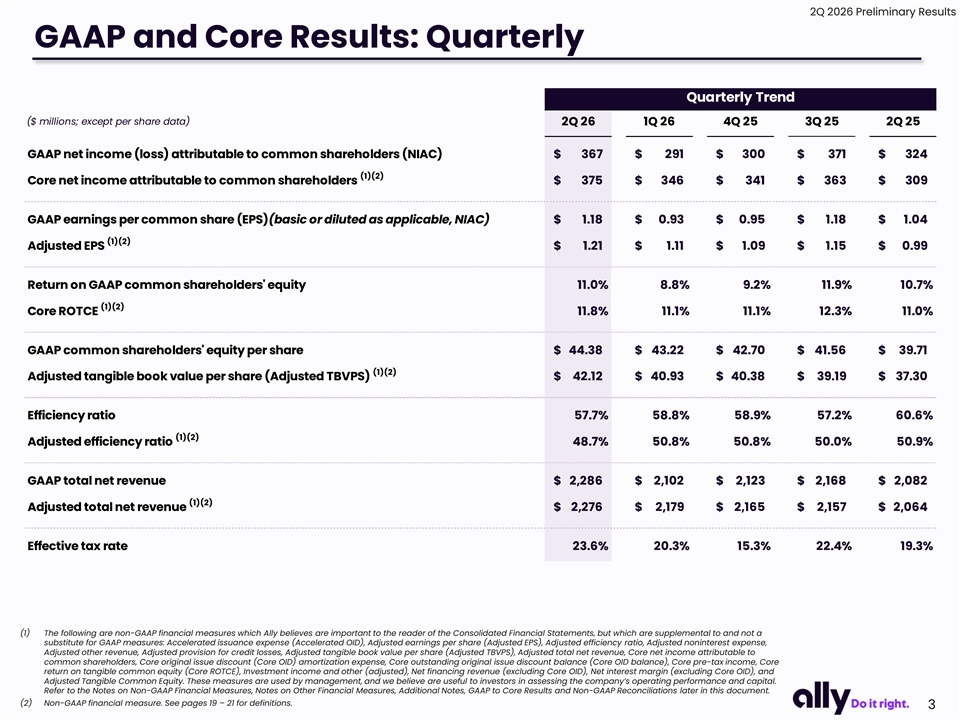
Thank you, Elizabeth. Good morning and welcome to Ally Financial's second quarter 2026 earnings call. This morning, our CEO, Michael Rhodes, and our CFO, Russ Hutchinson, will review Ally's results before taking questions. The presentation we'll reference can be found on the Investor Relations section of our website, ally.com. Forward-looking statements and risk factor language governing today's call are on page two. GAAP and non-GAAP measures pertaining to our operating performance and capital results are on page three. As a reminder, non-GAAP or core metrics are supplemental to and not a substitute for U.S. GAAP measures. Definitions and reconciliations can be found in the appendix. And with that, I'll turn the call over to Michael.
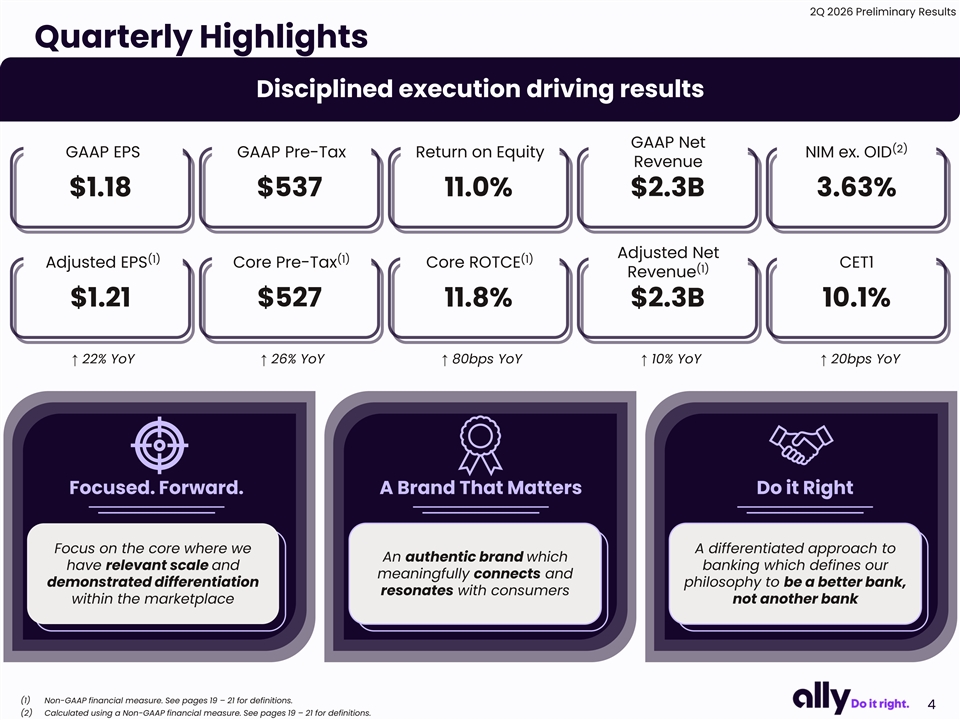
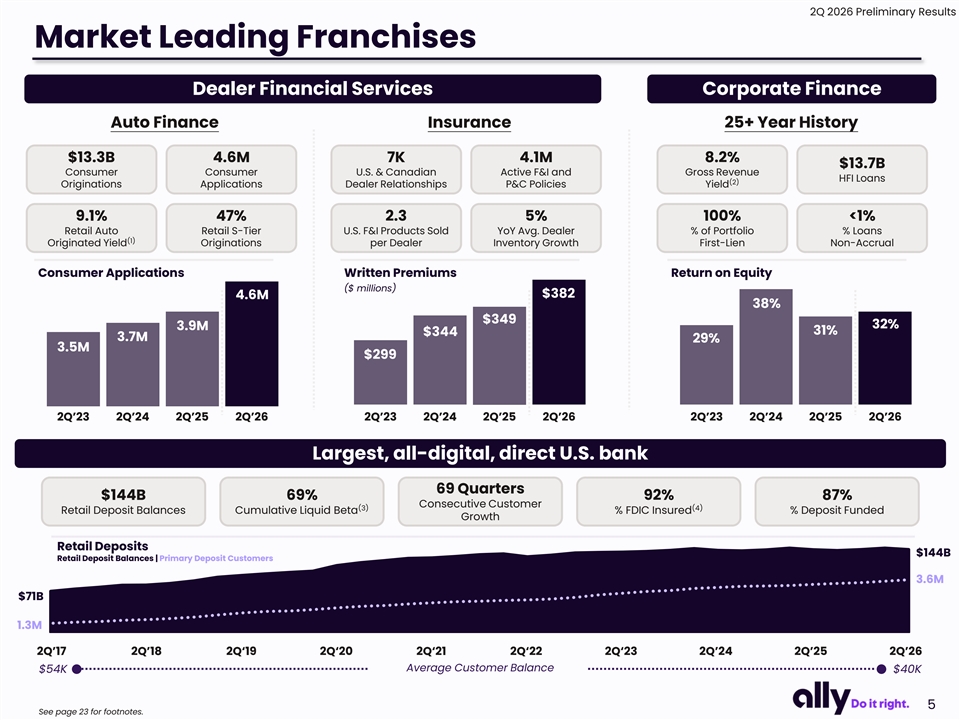
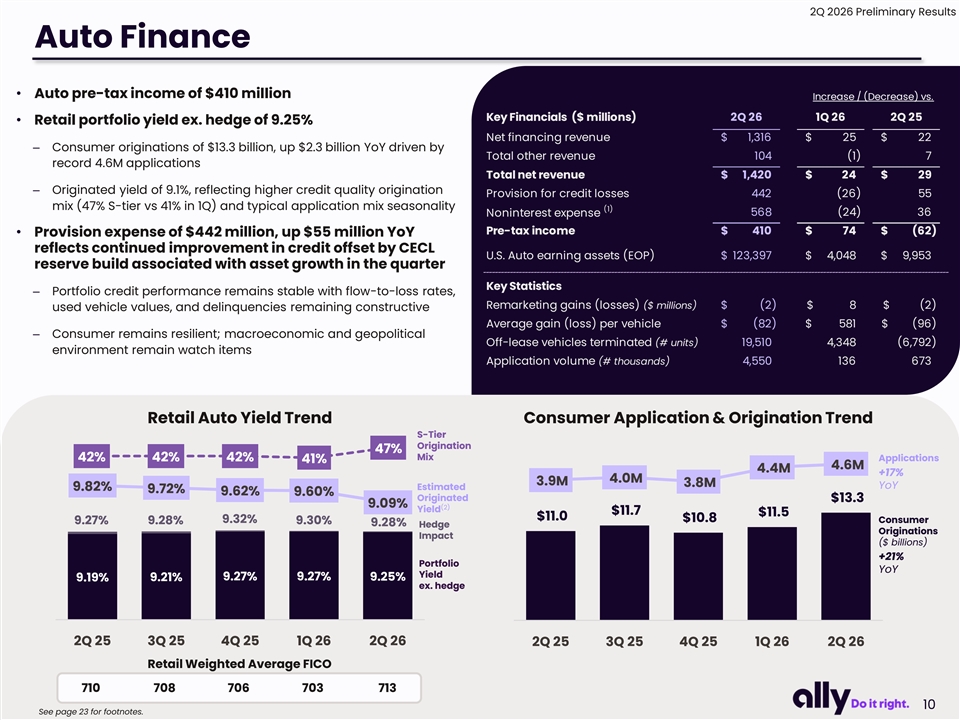
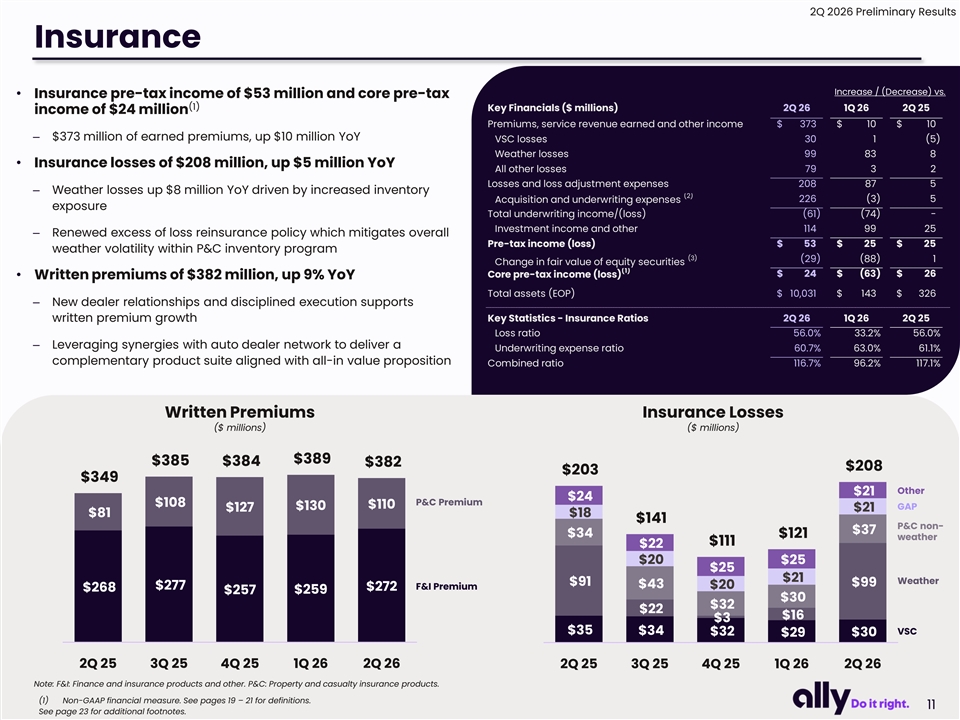
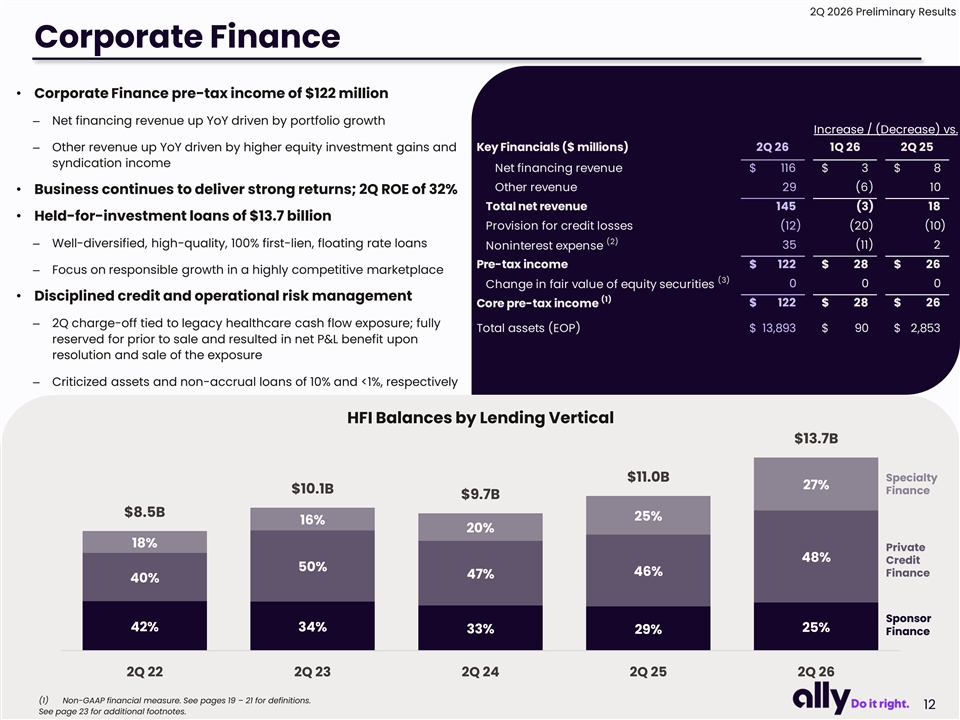
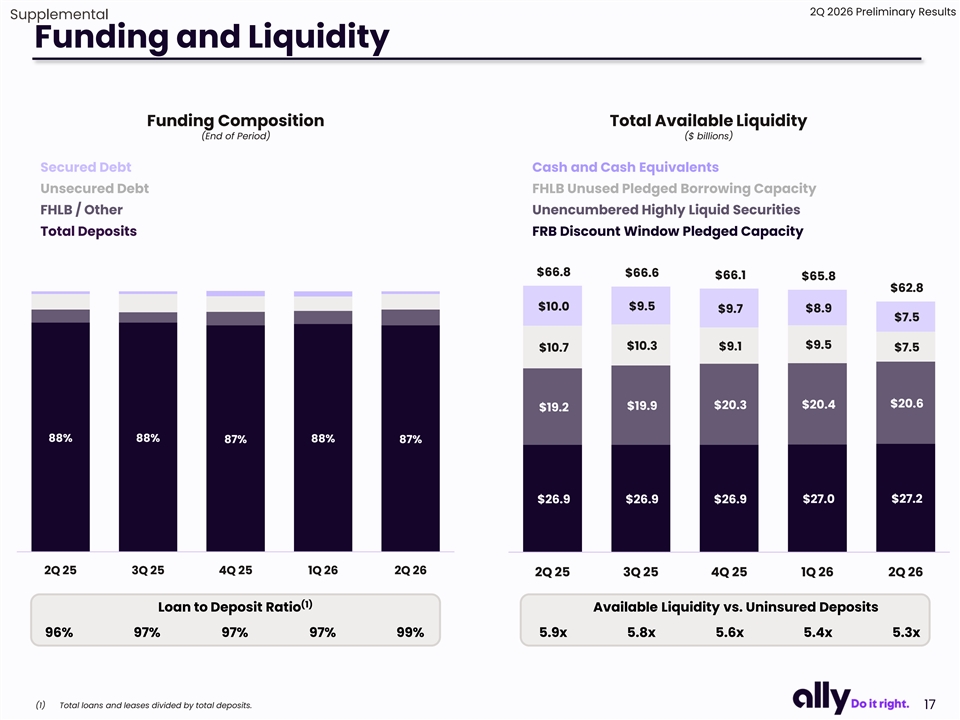
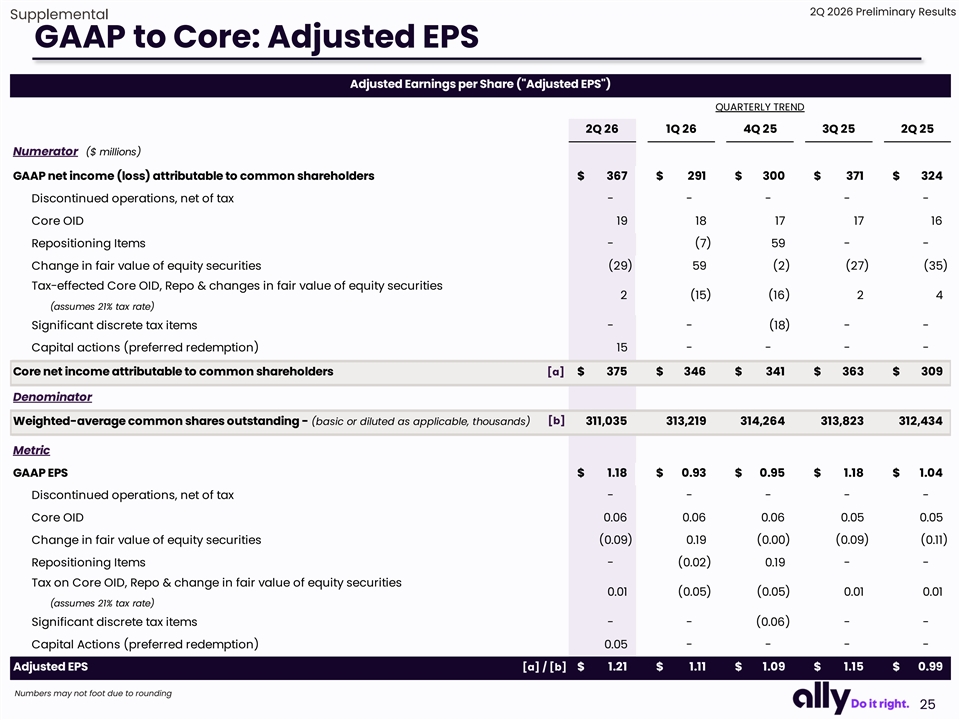
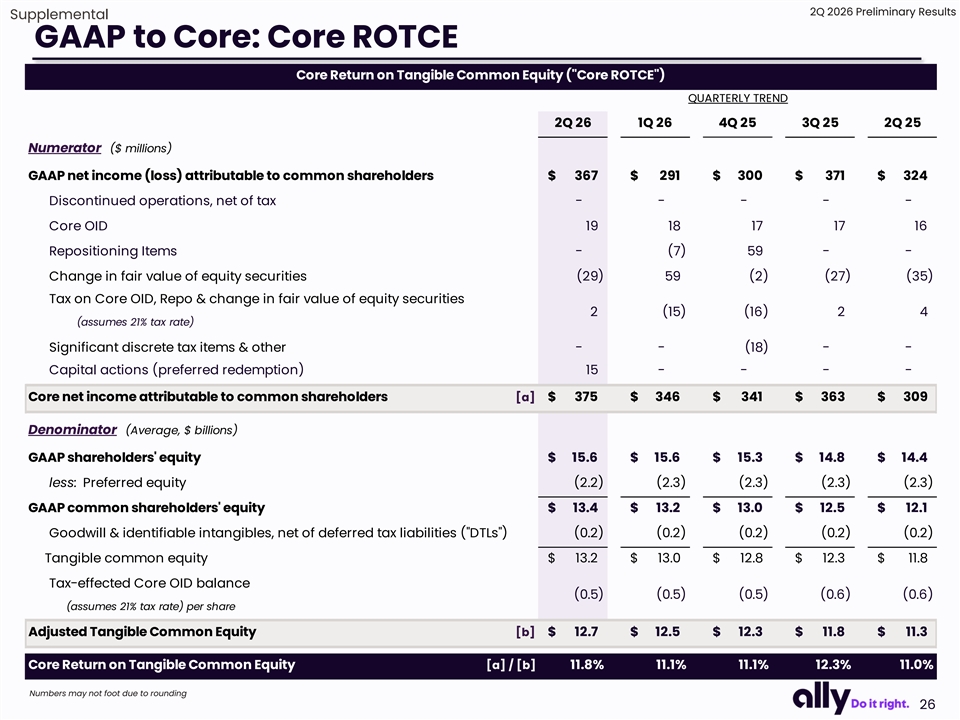
Thank you, Sean, and good morning, everyone. I appreciate you joining us today. Second quarter results were solid and reflect the progress we've made over the past several years to build a more focused, higher-performing company. The strategic choices we've made are creating a franchise with meaningfully greater earnings power. We are seeing that reflected not only in margin expansion and strong operating performance, but also our ability to invest for growth while simultaneously increasing capital returns to shareholders. Simply put, our results demonstrate our strategy. Backed by disciplined execution is working. The ally today is fundamentally stronger. We believe this positions us well to further enhance profitability, support customers through economic cycles, and create long-term shareholder value. For the second quarter, adjusted EPS of $1.21 was up 22% year-over-year, while core ROTC increased to 11.8%. Adjusted net revenue of $2.3 billion increased 10% year-over-year, reflecting continued asset growth and further margin expansion. To the point, retail auto and corporate finance assets grew nearly $8 billion year-over-year. That's up 8% year-over-year. And NIM improved 11 basis points sequentially to 3.63%. Our balance sheet continued to strengthen during the quarter, with CET1 increasing 20 basis points year-over-year. That strength is providing greater capital flexibility. Since announcing our authorization in December, we've returned more than $300 million to shareholders through share repurchases. Taken together, these results reflect improved earnings power, increased capital flexibility and a company that is better positioned to perform through the economic cycles Importantly, we are seeing broad-based momentum across the company with each of our core franchises executing well and contributing to our performance That momentum is supported by investments we've made to strengthen both the Ally brand and our culture. Our revitalized marketing campaign, Life Today, is resonating with customers and highlighting the unique value proposition of Ally, meaning customers where life and money intersect in today's world. We continue to see encouraging results in brand health, awareness, engagement, and industry-leading retention. Equally important, our culture remains a meaningful competitive advantage. Employee engagement scores improved again this year and ranked the top decile companies nationally for the seventh consecutive year, with particularly strong improvement across measures such as belief in our strategy. We believe highly engaged employees align around a clear strategy, create better experiences for our customers, and ultimately drive stronger business outcomes. With that, let's turn to page five and discuss performance across our core franchises. starting with dealer financial services our dealer centric through the cycle approach remains a key differentiator and a meaningful competitive advantage within auto finance applications reached a record 4.6 million increasing 17% from a year ago validating our strong value proposition and strategic initiatives are resonating with dealers more than ever. This application volume supported originations of $13.3 billion, up 21% year-over-year, while maintaining approval and pull-through rates. Retail origination yield of 9.1% included 47% S-tier, reflecting seasonal dynamics and our measured approach to navigating the current operating environment. Consumers have remained resilient, and we are encouraged by the credit performance across our portfolio. At the same time, we are mindful of the cumulative headwinds from ongoing inflationary pressures and an evolving macro backdrop. Insurance delivered another solid quarter with written premiums of $382 million, up 9% year-over-year, as we continue to demonstrate an ability to deepen relationships and highlight our unique full-spectrum value proposition to dealers. In corporate finance, we delivered record pre-tax earnings and continue to see strong client demand and attractive opportunities for disciplined growth. The portfolio ended the quarter at $13.7 billion. That's up 25% from the prior year, while generating a 32% return on equity. Our success is built on long-standing client relationships, deep underwriting expertise, speed of execution, and the ability to provide certainty when our clients need it most. We remain focused on profitable growth while maintaining the credit discipline that has consistently differentiated this business. Now, turning to the digital bank, customer growth and engagement trends remain strong. Retail deposit balances end of the quarter at $144 billion, with deposits representing 87% of total funding and providing a stable and cost-efficient funding source for the company. We now serve 3.6 million customers, up 7% year-over-year, and marking our 69th consecutive quarter of customer growth. Importantly, much of that growth is coming from younger consumers who are highly engaged in our digital platform. Nearly 70% of new accounts come from millennials and younger consumers, typically beginning with average balances just under $10,000 and growing over time. As consumer preferences increasingly shift towards digital-first experiences, we believe Ally's trusted brand, national scale, and low-cost operating model positions us exceptionally well for the future. Taken together, these results demonstrate the increasing strength of our core franchises. We're growing in businesses where we have clear competitive advantages, generating attractive returns, and deepening customer relationships across the company. While there's more work ahead, we remain confident in our path forward. We believe the benefits of our strategic actions will continue to accumulate, positioning allies to deliver higher profitability and stronger returns over time. And just as importantly, those same actions are creating a more resilient company that we believe is well-positioned to perform through economic cycles. And with that, I'll turn to Russ to discuss the quarter in more detail.
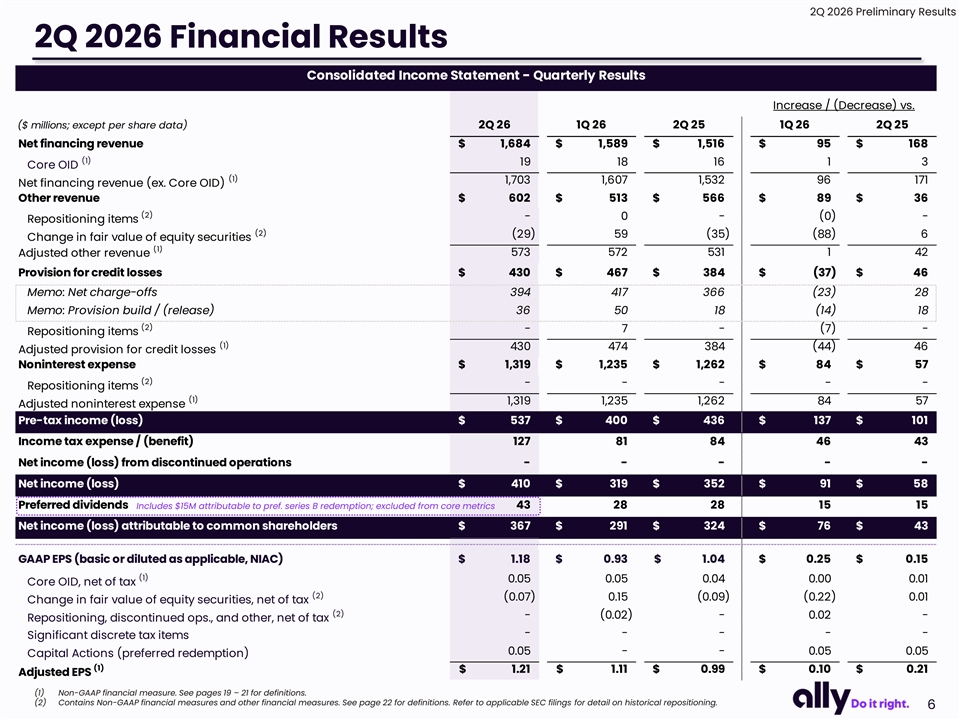
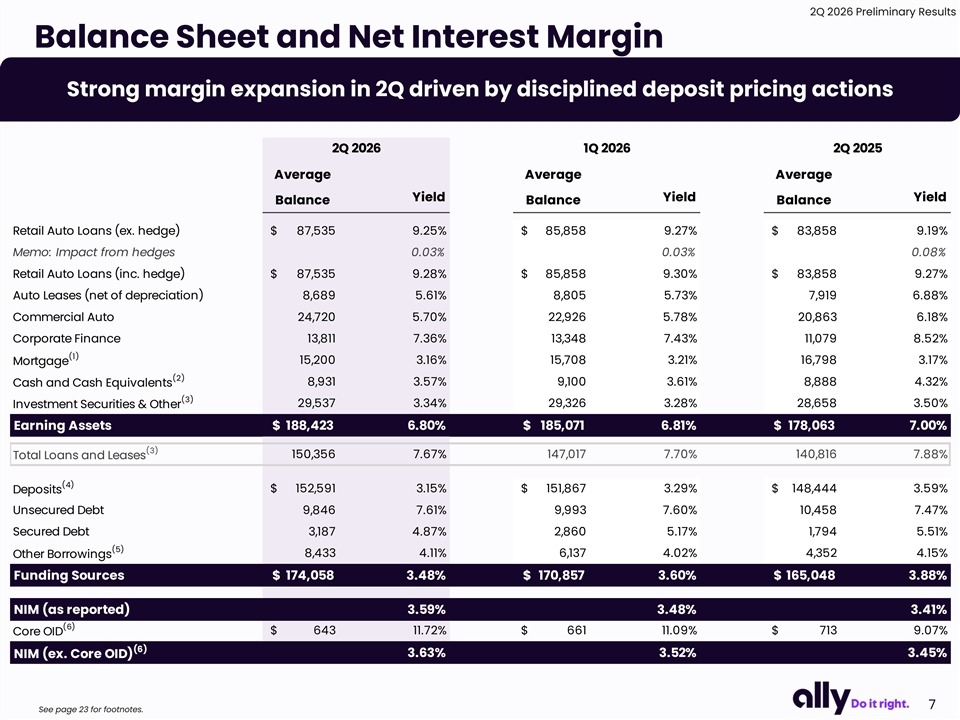
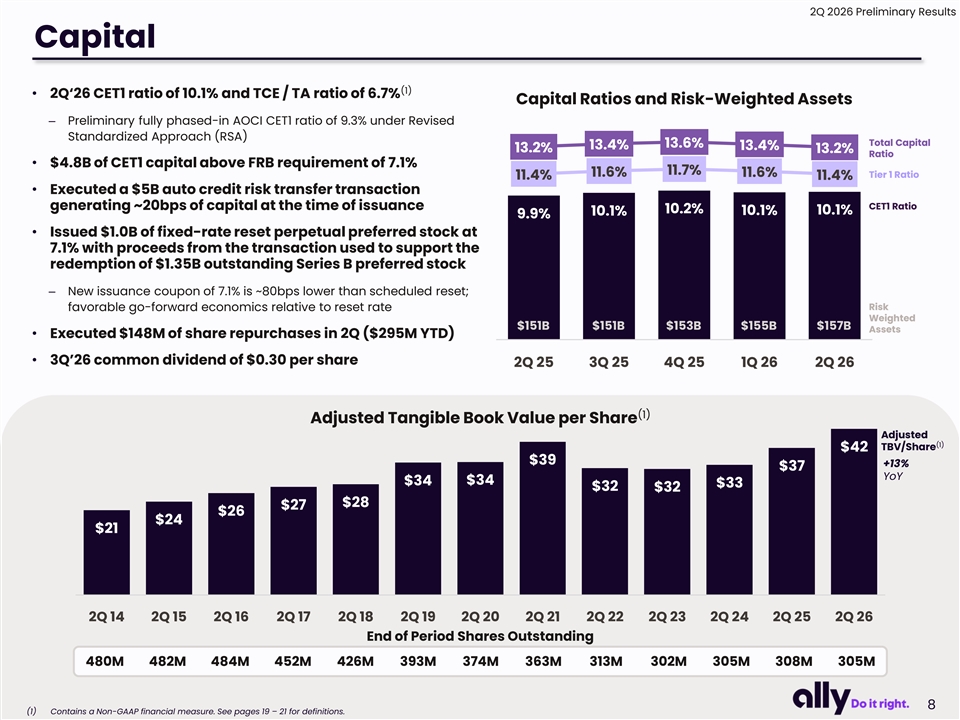
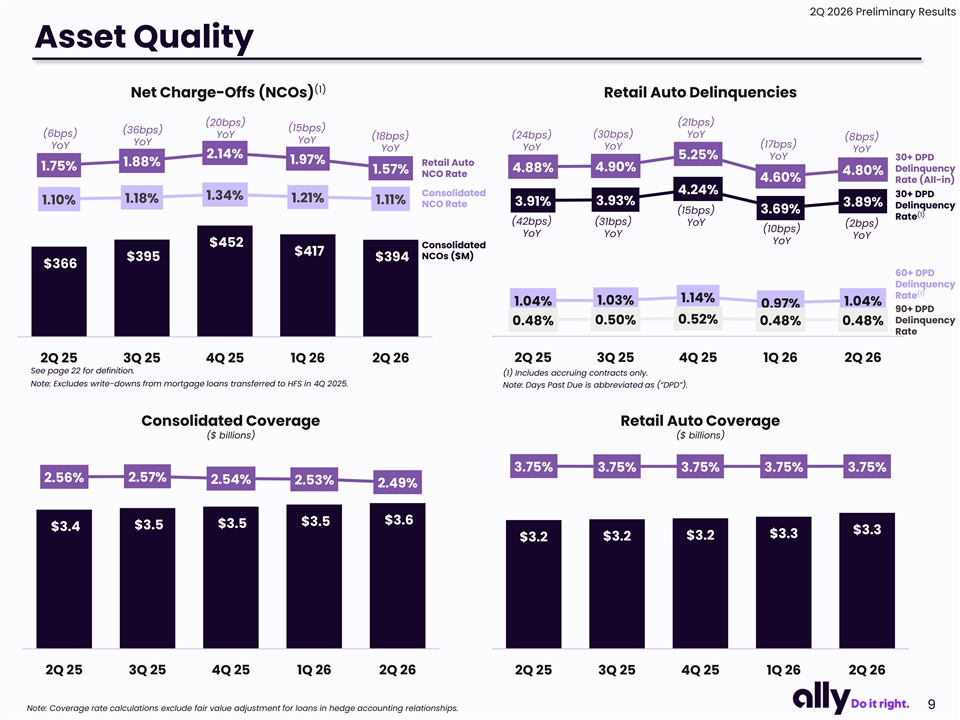
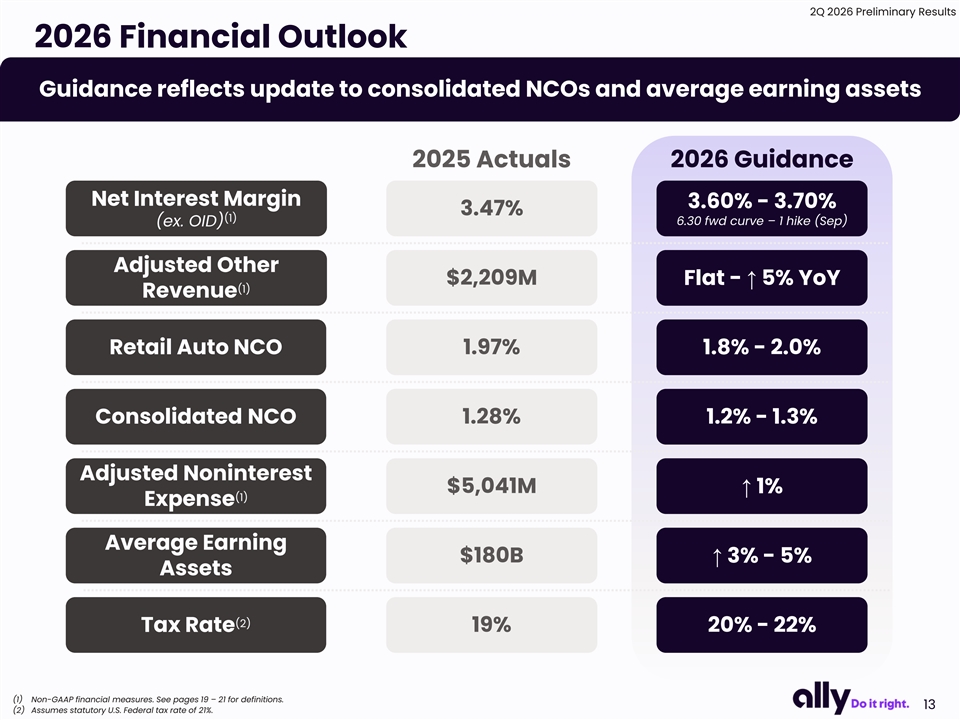
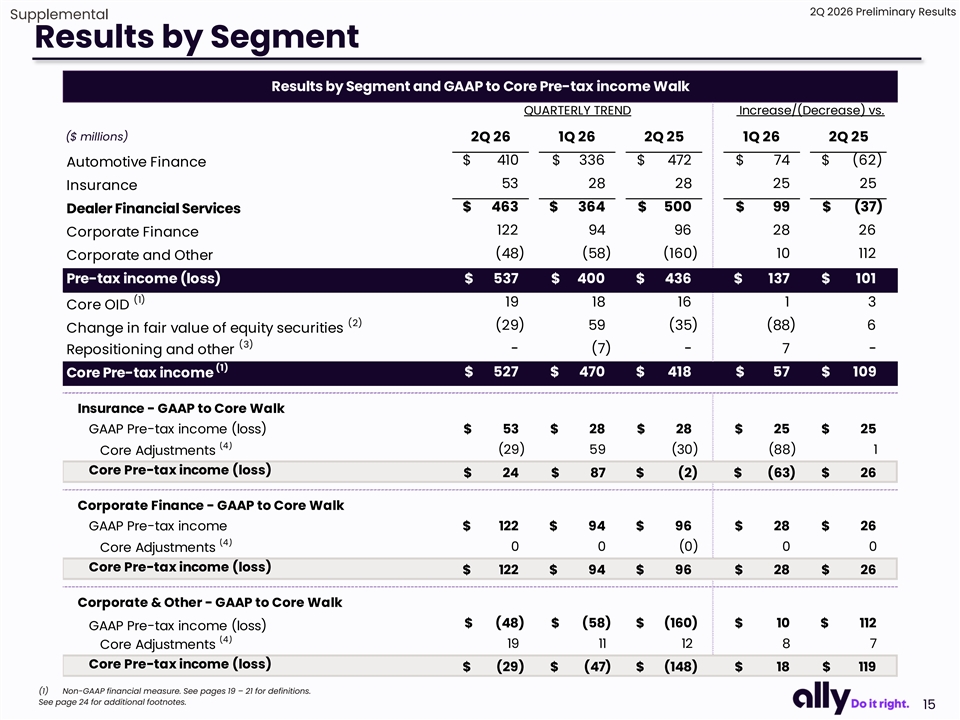
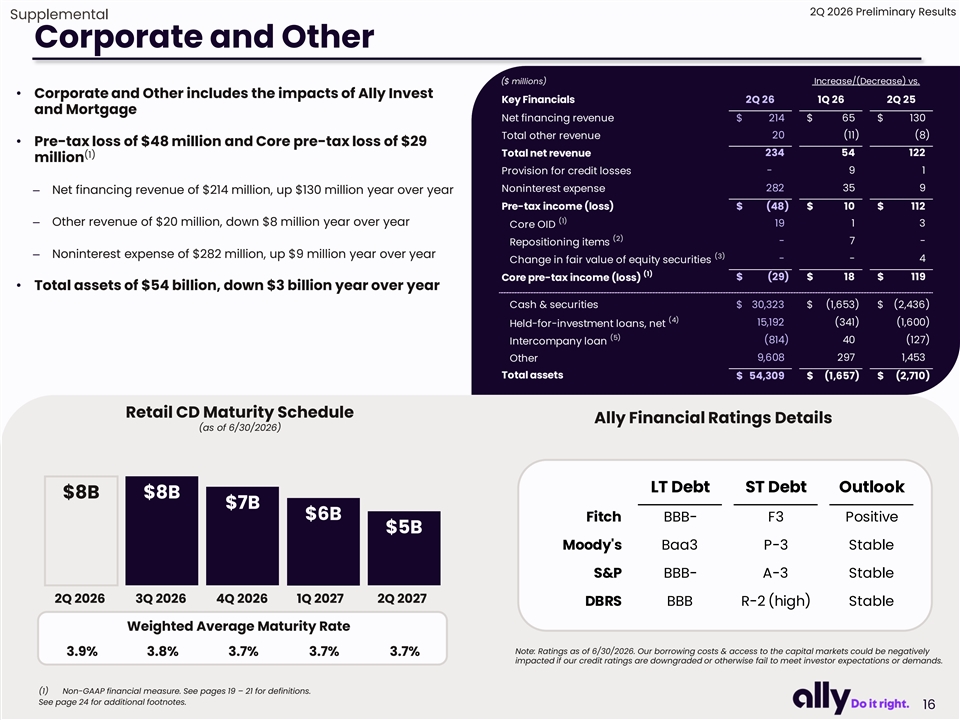
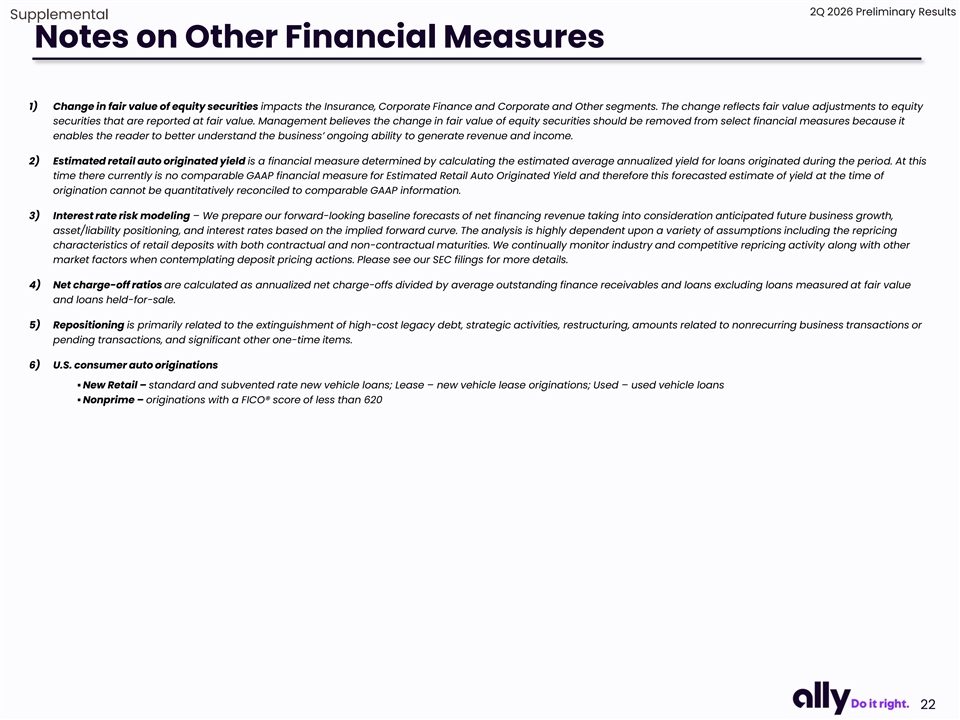
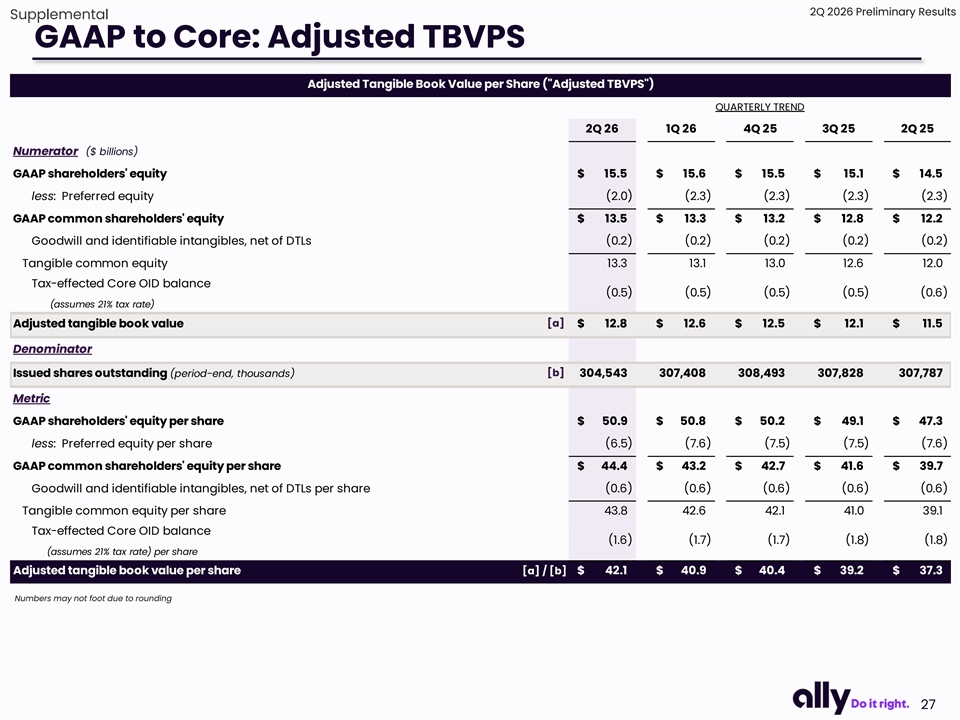
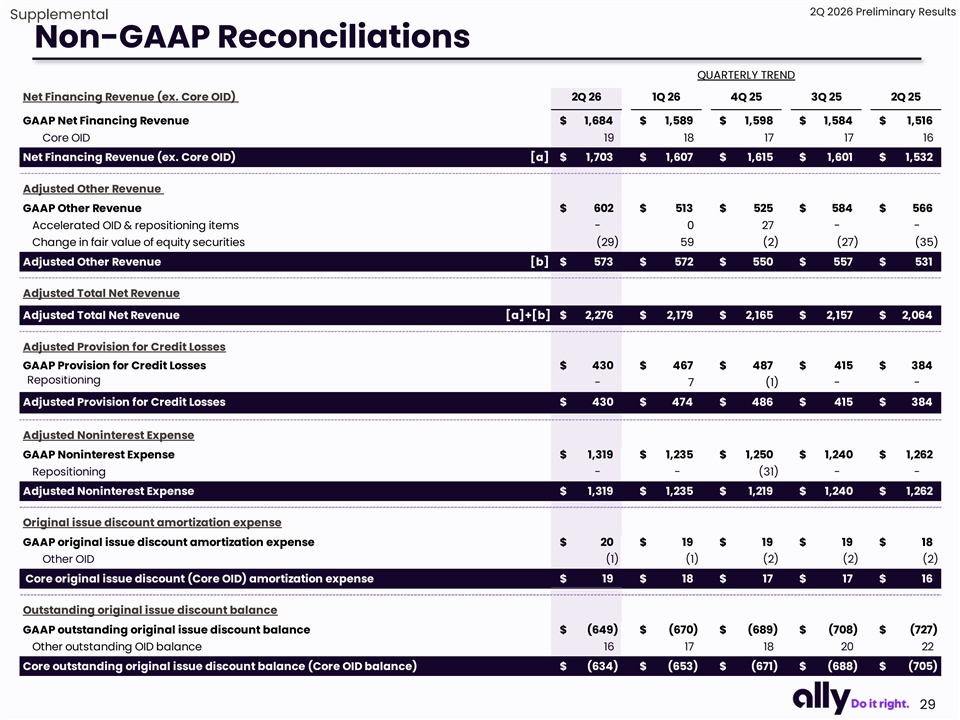
Thank you, Michael. I'll begin by walking through second quarter performance on slide six. Net financing revenue, excluding OID of $1.7 billion, was up 11% year-over-year. Balance sheet growth in our core portfolios and lower funding costs supported continued NII expansion. Adjusted other revenue of $573 million was up $42 million year-over-year as we continue to see momentum across our diversified revenue streams. Insurance, smart auction, and pass-through programs. Provision expense of $430 million was up $46 million year-over-year as CECL reserve of bills associated with strong asset growth more than offset the improvement in the retail auto net charge-offs. Retail origination momentum was strong throughout 2Q, finishing nearly $1 billion higher than our initial expectations. The growth supported earnings beyond 2Q, but drove $30 million of additional CISL build in the quarter, an $0.08 headwind to EPS. Adjusted non-interest expense of $1.3 billion was up 5% year-over-year in line with expectations. As noted earlier, adjusted revenue was up 10% year-over-year, driving strong positive operating leverage, as we have successfully executed on focused, accretive growth in our core businesses and disciplined expense management. During the quarter, we recognized a $15 million expense related to the early redemption of our Series B preferred stock. This one-time charge reflects a strategic capital management action, and given its non-recurring nature, is excluded from adjusted results. Let's move to slide 7 to discuss margin in detail. Net interest margin, excluding OID of 3.63%, was up 11 basis points quarter over quarter, largely due to lower deposit costs. Retail auto portfolio yield, excluding the impact from hedges, was relatively flat sequentially and in line with our expectations. Average earning assets were up 6% year-over-year with growth concentrated in our highest returning assets, retail, auto, and corporate finance, which on an end-of-period basis were up approximately 8% year-over-year. On the liability side, cost of funds decreased 12 basis points quarter-over-quarter, driven by disciplined deposit pricing actions through the first and second quarters. Retail deposit balances decreased $2.6 billion during the quarter driven by seasonal tax outflows, in line with normal seasonality. We maintain access to a wide range of alternative funding sources, which complement retail deposits and allow us to fund a creative asset growth in the most efficient manner possible. During the quarter, we reduced liquid deposit pricing 20 basis points and reached a cumulative liquid deposit data of 69%. We remain disciplined in how we price deposits, ensuring we continue to optimize customer growth and value, and are encouraged by the performance we've seen. Deposit customers grew for a 69th consecutive quarter and are up 7% year-over-year, demonstrating the power of our brand in the market. I'll cover guidance later, but despite the movement and short-term rate expectations year-to-date, we remain confident in our path to a sustainable upper threes margin over time. Structural momentum is evident in our creative asset growth and efficient funding sources, each supporting continued NIM expansion. Turning to page 8, CET1 of 10.1% is up approximately 20 basis points versus the prior year. While not final, under the current proposal for RSA, our CET1 would be above 9% when fully phasing in AOCI, And IRBA would provide roughly 30 basis points of additional benefit. We'll continue to assess each proposal as we await potential refinement following the comment period. During the quarter, we completed our fifth credit risk transfer transaction, generating approximately 20 basis points of CET1 at the time of execution, reflecting continued demand for our retail auto assets in the market and another efficient way to manage capital. Additionally, we issued $1 billion of preferred stock at a 7.1% coupon. The proceeds from the transaction were used to support the redemption of our Series B preferred stock ahead of its reset on May 15. The issuance resulted in a $350 million decline in our preferred stock outstanding and favorable economics relative to the Series B reset rate. In the quarter, we executed $148 million of share repurchases, and earlier this week, we announced our quarterly dividend of $0.30 for the third quarter of 2026, consistent with the prior quarter. We remain pleased with our ability to execute a story of and, not or. We're delivering strong growth in core portfolios at attractive risk-adjusted returns. We've migrated capital ratios higher and repurchased nearly $300 million of shares year-to-date. At the end of the quarter, adjusted tangible book value per share was $42, up 13% over the past year, and when combined with our solid dividend yield underscores our continued focus on delivering strong shareholder value. On slide 9, we will review asset quality trends. Consolidated net charge-offs of 111 basis points were down 10 basis points versus prior quarter and roughly flat year-over-year. During the quarter, the consolidated NCO rate included the resolution of a corporate finance exposure. The loan was in non-apprual since 2018, and we recorded a P&L benefit on this resolution as the specific reserves we had built exceeded our loss on the exposure. Within Retail Auto, net charge-offs of 157 basis points were down 40 basis points quarter over quarter and down 18 basis points compared to a year ago, marking a sixth consecutive quarter of year-over-year improvement. On the top right of the page, 30-plus all-in delinquencies of 4.8% were down eight basis points from the prior year. While the year-over-year improvement in NCOs widened given record flow to loss and supportive use values, the year-over-year improvement in delinquencies continues to moderate as expected. Portfolio performance has been solid year-to-date, but the macro backdrop remains dynamic, and while delinquency rates are down year-over-year, they remain a watch item along with used values and quota loss rates. In total, we remain confident in the credit quality of the portfolio and our ability to be dynamic in underwriting, servicing, and collections in the current operating environment. Turning to the bottom of the page on reserves, the consolidated coverage rate of 2.49% was down quarter over quarter, driven by the specific reserve release in corporate finance previously mentioned. Retail auto coverage of 3.75% is flat to the prior quarter. Our coverage levels continue to balance consistent credit trends across our portfolios against broader macroeconomic uncertainty. Moving to slide 10 to review auto segment highlights. Pre-tax income of $410 million was lower year-over-year, primarily due to fiscal reserve bills associated with strong retail asset growth in the period. On the bottom left, we've highlighted the trajectory of retail auto portfolio yields. Excluding the impact from hedges, yields were down two basis points quarter-over-quarter. Second quarter regionated yield of 9.1% was down approximately 50 basis points quarter-over-quarter as S-tier increased to 47% of origination. The origination mix was influenced by normal seasonal trends, the measured posture we highlighted in April, and a higher quality application mix, including stronger pull-through within those segments. As you recall, we had a richer credit mix in yield than we expected in 1Q, and we saw a pivot in the other direction this quarter with a cleaner mix and lower yield. The yield impact from higher S-tier volume was partially offset by increased pricing on the like-for-like segments. Looking ahead, we expect S-tier to decline modestly from 2Q levels and settle in the low to mid-40s over time, which we expect will support originated yields, absent moves, and benchmark rates. On the bottom right of the page, $13.3 billion of consumer originations were up 21% year-over-year as we continue to benefit from deeper dealer relationships supporting application growth. Application volume remains the key to our success and highlights the strength of our franchise. Approval and pull-through rates remain consistent with prior quarters, but a wider, top-of-the-funnel provided incremental opportunities for accretive growth. Looking ahead, we remain confident in our ability to continue driving accretive growth that we would expect the year-over-year growth rates to moderate in the back half of the year. Turning to insurance on slide 11, court pre-tax income was $24 million, up $26 million year-over-year. Total written premiums of $382 million were up $33 million year-over-year, while insurance losses of $208 million were up $5 million year-over-year. Insurance continues to drive capital-efficient, diversified revenue and remains a key component of our long-term growth strategy. We continue to leverage synergies with auto finance to sustain momentum within the business and deepen our all-in dealer value proposition as we help them succeed in all aspects of their business. Turning to corporate finance on slide 12, the business delivered another strong quarter with record free tax income and a 32% ROE. The team has a proven ability to deliver compelling returns while also driving strong growth as the portfolio is nearly $14 billion today, up 25% over the past year. Our longstanding relationships and deep underwriting expertise are the foundation of our differentiated risk management framework. Credit discipline underpins every decision we make, guiding our growth, and is reflected in the performance of the portfolio. Credit has remained exceptionally strong with non-accrual loans at historic lows. Results continue to showcase the durability of the franchise, and our prioritization of credit risk management will drive accretive growth moving forward. I will provide a brief update on our outlook before moving to Q&A. First half performance has been solid, and we are updating a couple aspects of the guide to reflect our latest view. We now expect average earning assets to be up 3% to 5% versus 2% to 4% previously, as our expansion of the top of the funnel has resulted in strong consumer auto originations alongside continued momentum within corporate finance. As we've consistently emphasized, we are growing where we want to be growing while maintaining a disciplined underwriting posture to optimize risk-adjusted returns. This accretive growth will drive higher earnings over time, but it does present elevated reserves built under CECL in 2026. Additionally, we're tightening our range on consolidated NCOs, which we now expect will land between 1.2% and 1.3%, compared to the 1.2% to 1.4% range we shared in January. Reflected within the guide for consolidated NCOs is our outlook for retail auto. As I mentioned previously, we're pleased with the credit performance through the first half of the year and view the midpoint of our retail NCO guide as appropriate. With respect to margin, the guide remains 3.6 to 3.7 percent with the potential to exit the year above the high end of the range. While we continue to closely monitor the impacts of macroeconomic uncertainty and evolving interest rate expectations, which now include rate hikes this year, we are confident in our ability to deliver. The timing and magnitude of potential rate actions can influence margin for a period of time, but we remain confident in our ability to deliver on the full-year guide. In total, our focused strategy and disciplined execution continue to drive improving operational and financial performance. While we have made significant progress, our focus remains on sustaining our momentum and executing on the meaningful opportunities ahead to deliver a compelling long-term value for our shareholders. And with that, I'll turn it over to Sean for Q&A.
Thank you, Russ. As we head into Q&A, we do ask that participants limit yourself to one question and one follow-up. Elizabeth, please begin the Q&A.
Operator
As a reminder, if you'd like to ask a question at this time, please press star 11 on your telephone and wait for your name to be announced. To withdraw your question, please press star 11 again. Our first question comes from Robert Wildeck with Autonomous Research.
Hi, guys. Let me just start on retail, auto, and credit there. You know, the net charge-offs were better than we were expecting, and the year-over-year decline there is accelerating, but delinquencies are kind of like leveling out. And then to add to that, you've got the quarter with the big spike in S-tier volume. How does that all come together, both in the context of the 1.8% to 2% net charge-off guide this year, and then also like zooming out the 1.6% to 1.8% loss rate you've talked about, bigger picture?
We're pleased with performance in credit in the first half of this year. I think we've seen, as we mentioned, a measured first half of the year, and we're holding our guide. We continue to think the midpoint of that range is, if we think about credit evolving in the back half of the year, again, you know, the lost items that we're paying, you know, as we think about credit on a longer-term basis, as you pointed out, It's been originating in that 1.6 to 1.8 range. The NTO rate that we – it's our expectation that we'll get there. We haven't given a timeline to that. And, you know, as we said before, that's a timeline that says that's going to evolve over time. That's not something that – you talked a little bit about experiment in your question. As we noted, originated portfolio in the second quarter elevated. It had some impact on yield during the quarter as well. You know, I wouldn't read too much into that. You know, obviously, if you look at further credit mix and a richer originated yield, and we saw PIVOT back in the second quarter, a lot of explanation. We expect to see a higher credit in the second quarter versus the stock is out in April, and impacting the mix is what's currently our expectation. We'll see that originated mix migrate to an S-tier mix that's probably more in the low to mid-40s again over time. So I wouldn't read too much into a single-quarters origination mix. We've seen that move from time to time. And as far as we see it, we think the opportunity for that mix to kind of migrate back to normal, provide support as we move forward.
If you take a step back and look at the consumer overall, and you're kind of going to take a step back from our portfolio, what you do see is that there's certainly working through the higher cost and a higher energy cost. Yet employment rates, the end we can see is that consumers are basically triaging on a real-time basis kind of how they pay every single month and then what they're paying. And that can transcend the last quarter. Tax refunds have probably more of an impact on delinquency. We didn't quite see that. I think we're seeing customers in delinquency more, but that is the photo of what we see in unflown laws. And, again, I just want to know.
Very helpful. Thank you both.
Operator
Our next question comes from Moshe Orenbuk with Didi Cowan.
Great, thanks. You know, pretty impressive growth numbers. You did mention that you expected growth to moderate some. Could you talk about, you know, perhaps what is driving that? Is it what you're seeing from an application side? Is it the competitive dynamic? Maybe just talk about that a little bit.
Well, maybe I'll start by giving our auto team a ton of credit here for the traction that they've delivered with our dealer base. the application flow, and that's driving that growth in application volume and thereby fueling. Great.
Thanks. And, you know, I think the area in which, you know, the results, you know, kind of were lower than our expectation was purely in that area that you had noted, driven by that faster growth. You know, as you look at the moderating growth, I think you mentioned that that should have a more moderate build in reserves. Anything that you would kind of highlight in terms of the tenor? You know, obviously you had, you know, high-quality loans originated this quarter, but anything that you would, you know, kind of point us to in terms of that, you know, that reserve rate as we go forward?
Yeah, our, you know, overall reserve levels on the retail auto side, you know, at $375, Yeah, they've held there that cares for a number of things. Obviously, we've continued to see good performance and improvement in terms of NCO level and delinquency rate in terms of our own portfolio. Yeah, at the same time, we're caring for a matter. As we said previously, you know, we don't plan. It kind of cares for kind of performance in our current that we see in the background.
Operator
Our next question comes from Sanjay Sakurani with KBW.
Thank you. Good morning. I guess I wanted to go back to the S-tier originations. I know you guys said not to read too much into it, but as we think about the NIM expectations, I think it actually improved despite you guys doing this. And it sounds like you're going to originate at a slightly higher run rate on S-tier, at least for the short run. Am I thinking about that correct? And maybe you could just talk about sort of what's driving that higher mix. Is it that there's these opportunities in front of you where there's a competitive void or some proprietary flow coming through? If you could help us with that, too, that would be great.
Yeah, thanks, Tanjay. It's a good question. And maybe I'll start with the ask here, and then I'll get to your question on the read-it process. And, you know, on the ask here, again, I wouldn't read too much into a quarter. There are a lot of things going on. I think there's that seasonality we pointed to earlier. Yeah, certainly our measured posture with respect to credit played into it as well. But, again, I wouldn't read too much into it. When you kind of think about the originated yield, I think it's important to point out that when we look at our originations on a like-for-like basis going from first quarter to second quarter, we increase price. So, you know, you saw the originated yield come down, but actually embedded in that is, you know, increased pricing on a life-for-life basis, but obviously, you know, overpowered by the movement up in credit in terms of that extra mix moving from the low 40% to 47% over the course of the quarter. And so I think that ability to put price into the market is a good sign that I don't want to be overlooked here. As you think about the forward in terms of, you know, how to think about our originated yield and how that translates into the portfolio yield, you know, I'd say one, as you pointed out, you know, we do expect that the mix will continue to move around. We'd expect on balance it's going to migrate towards a lower XMX. We talked earlier about low to mid-40s, albeit over time. That provides some support, independent of benchmark rates, that provides some support to the originated yield. As we think about portfolio yield, our expectation is it's going to be stable at current levels as you think about the next few quarters moving forward. So, read across the NIM, however, is a little bit different. We still continue to expect our NIM to increase, you know, we showed a nice increase going from first quarter, second quarter, a lot of that is on the back of changes we made in deposit pricing over the course of first and second quarter. Those changes still have runway in the third quarter, as you think about kind of the last price change on a full-quarter basis, we also continue to have a benefit from an perspective from CDE maturities as we have kind of higher-yielding CDs maturing and rolling into, for the most part, rolling into liquid deposits or other CDs. And then on a long-term basis, we have a continued dynamic where we have low-yielding mortgage loans and lower-yielding mortgage-backed securities that continue to roll off our balance sheet. At the same time that we're really growing our higher yielding retail auto loaning stock. So there are a number of dynamics, some that play out stronger over the next quarter or two, some that play out over a longer period of time that continue to contribute to that net interest margin expansion story that we've been talking about for some time.
And Rob, it's interesting to me to think back at the... I'm sorry, I was going to mention it. If you think about the kind of quarter origination mix, a lot of this stuff does work so well because they're at top of the funnel on volumes. And I know we talk about this a lot, but it's really incredibly powerful. And so it has to mention what our teams are doing every single day. Top of the funnel, increasing the high teams. It gives us the ability to constantly optimize. And our optimization this month might be different, the next month might be different, the month after that. All that in the case, if you look at our share of volume that we're actually capturing, it keeps on increasing. Three, keep on increasing more share with an optimized mix, which is why we say, look, you know, these strategies aren't set it and forget it. We're always optimizing and looking at what the market has and where pricing is, more pricing, and the top of total volumes make all this possible. And it's a real testament, you know, hats off the team that's making this happen.
100 percent. Thank you. That's very encouraging. Michael, just to make sure I'm not missing something, because I know you touched on it earlier, just this measured approach on growth and obviously credit, it sounds like those are just sort of the broader macro trends, nothing specifically that you're seeing inside your portfolio on how consumers are behaving, correct? Because the credit numbers look pretty good, just making sure.
The credit numbers are good, and, you know, we are being measured. And, you know, I know you've probably heard a cautious tone from us, or perhaps a year and a half, I feel it is, you know, ever since, you know, the tariffs came into place and they've been working through those. And now with oil prices and, you know, they kind of inflow on a day-to-day basis. So, you know, right now, like, the uncertainty in the environment just feels, and that kind of volatility, the data around the environment, I'll just use words like measure. And it's reflecting, you know, some of the approaches that we're taking are underwriting or evolving creation. But we're building this business for the long term, We think we're making the right decision every day, given the fact that there's a lot of uncertainty in the environment. And when the environment, you know, hopefully we start using the word measure a bit more. But between now and then, that is the world that we're living in. And even as three weeks ago versus today, I mean, I think Congress, you know, and hence that's reflected in some ways.
Operator
Thank you. Our next question comes from Brian Foran with Truist.
Hey, good morning. Two questions on credit. Maybe just start on retail auto, and Russ, I think you've mentioned the vintage stuff you look at. I mean, for a while here, there's been this kind of built-in improvement because the 22 and 23 vintages are burning off, and then the 24 and 25 vintages are pretty consistent at better levels than you used to show us. I wonder if you could just talk through that dynamic. First, is the 22-23 vintage burn-off still a good guy, or is that kind of played out? And then if you look at the 24-25, I don't know if it's too early to look at any of the 26 originations, are they all steady? Is there anywhere where you're seeing vintages improve or deteriorate from that kind of post-23 level?
Thanks, Brian. That's a great question. And, you know, as we mentioned earlier, when you look at our NCO rates during a given quarter, it's an expression of, you know, a lot of vintages at various points in their life cycle. And so while we've mostly been through the 22 vintage, you know, we still have loans on our book from 22. And so they are still contributing to our overall loss rates today. You know, and obviously we still have loans, obviously, from first half 23 as well. As you pointed out, as you entered kind of the back part of 23, and certainly as you entered that 24 vintage, we saw a number of vintages that had the full effect of forteilments that we had put in place. As we said previously, those vintages have exceeded our expectations in terms of performance. They continue to exceed our expectations in terms of how they're performing. As you would expect, and as Michael pointed out earlier, we made decisions around underwriting and pricing on a real-time basis. It's a dynamic process for us. And seeing that outperformance in 24, we made changes throughout the course of 2025. We don't expect to see that same outperformance on the 25 vintage versus 24. But, again, still a very strong vintage from our perspective, from an economic perspective. And so as you look at our NCO rates during a given quarter, there's a lot going on in terms of the different vintages. But, again, we continue to see kind of what we've been talking about in terms of, you know, some benefit from the ongoing roll-off of that 22 and first half 23 vintages, you know, positive contribution as we see that outperformance of the 24 vintage, and then you'll see some normalization as we work through the 25 and 26 vintages.
Rob, there are items that I can't swear to the top or vintage, both in terms of what these delinquency curves look like and the vintage curves, but also what the severity was. And we pretty much feel that severity hit when you look at it.
Thank you. If I could sneak one in on corporate finance, and I'm looking specifically at page 15 in the supplement. You know, and I don't want to miss the forest for the trees. It's only 4% of your reserve, even with the loss. It's only 6% of lost dollars year to date. You know, but it gets outsized to interest from investors, given everything going on in the market. So I wonder if you could just speak to this new coverage ratio of 1.19%. Now that that kind of large legacy health care loan is gone, is that kind of a normalized level for this business? Two, are there any other loans similar to that health care loan that have been hanging out for a while that may require resolution? And then three, if it's meaningful, is there any difference in that reserve level for the private credit versus the rest of the book?
Great. There's a lot there to unpack. I'll try to get through it. Maybe I'll start with the health care loan that we charged off over the course of the quarter. And maybe that's a good start, given some of the headlines. I think it's important to point out, this is a loan that we made in 2015. It's part of a vertical that we're no longer playing within corporate finance. This loan was actually put into non-approval status back in 2018. team. And I think it's a credit to our team in corporate finance. They're really their credit first, truly a credit shop perspective in how they manage the business. But they worked through this loan, obviously, over the course of a long period of time, reserved for it conservatively, and got us to a good place where it was a P&L good guy in the quarter. And we think about the book more broadly. Our criticized assets and our non-accountable loans are, again, we don't run this business as a zero-loss business. This is a closet, and we have a team, fortunately, that's able to run the large charge-off we saw, obviously, and quite frankly, even on a for Ally overall. We kind of manage the business. You should expect that for that business and the way credit evolves that you should see their number over.
Yeah, I mentioned private credit. Private credit may be obvious, how we're going to generate mid-teams returns, and we talk to the three drivers that lead to that. Each business plays a role. I hope you see in the results that we've been generating and the way corporate finance is performing and growing, they're a very important component of our overarching story. There's this one loan. I think the team handled it beautifully. I think the way they had it shows their effectiveness in working out loans and our conservatism in terms of how we take our marks. And if anything, I think this should give a lot of confidence that...
Operator
Thank you so much. Our next question comes from Jeff Edelson with Morgan Stanley.
Thanks for checking my questions.
Just wanted to maybe focus on the expenses a bit here. You know, you were pretty clear that the year-over-year growth rate would accelerate this quarter, I think due to some noise or some differences in the comps. But as you think about your unchanged guide for the year, it does, you know, as you noted before, seems to imply a 3% growth rate from here. Is that the right way to be thinking about the level of expense growth required in the business? Or, you know, as you sort of have seen your revenue growth step up here, maybe just help us understand how you're thinking about the operating leverage story from here, maybe the opportunity to reinvest back in the business.
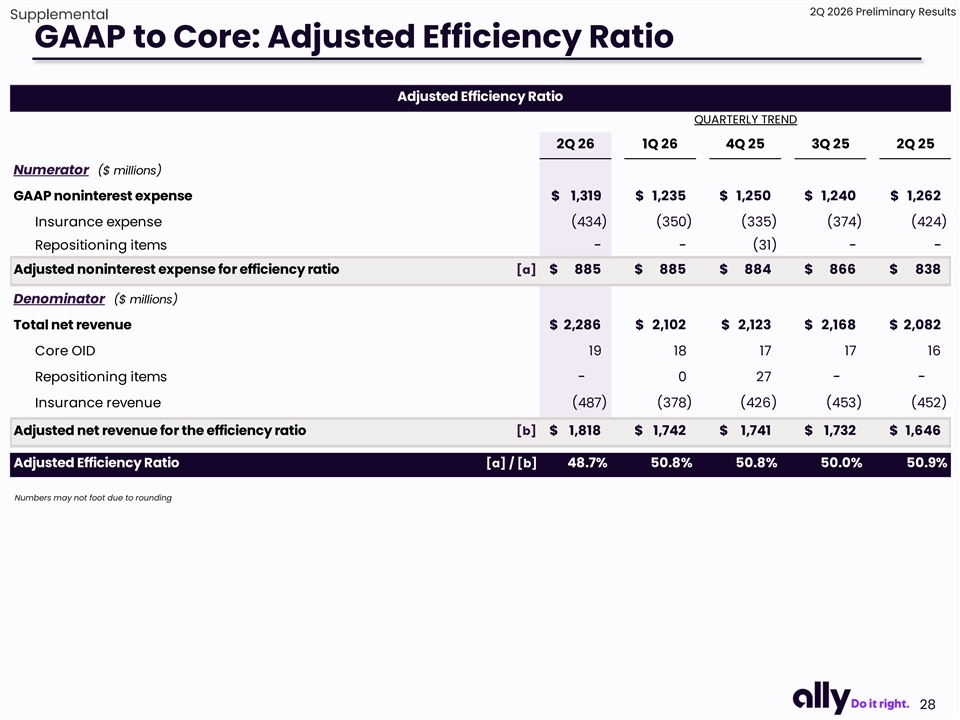
Great question, Jeff. Thank you. Thank you very much. Yeah, as you pointed out, you know, expenses in the quarter were very much as expected. I think it's also important to point out the positive operating rate is up roughly 5%, but revenue is up 10%.
And it is, you know, I think you're – And just as my follow-up, you know, the share repurchase trend, you've kept that now at about $150 million a quarter, the last few quarters. Is this sort of the right cadence you're thinking about from here? Or are you maybe waiting for more final confirmation around the new capital rules before you, you know, sort of reevaluate that trend? And maybe just remind us, you know, is the right target post-capital rules to be thinking about here still the 9% level that you thought about historically? Or just kind of help us understand what you're thinking about on the capital return path from here.
Right. Well, I'd say maybe start off, we're pleased with the capital bill that we've executed on over the last couple of years. You know, obviously, the proposals are still proposals that are being commented on. You know, we don't have the timeline for implementation, and obviously, they haven't been finalized yet. But as we look at RSA on a fully face-in basis, we're north of 9%, which is the management target that we've talked about for a number of years. That positions us really well. So, you know, from our perspective, a heavy lifting on the capital field is largely behind us. And we're positioned now to execute on our story of and, not or. And where our expectation is we'll continue – you'll continue to see a lot of what you've seen the first half of this year. Strong emphasis on providing capital to grow our businesses in an creative way. and also a focus on capital return to our shareholders, both through our dividends as well as repurchases. And a capital ratio that, again, we expect to drift higher over time, but obviously with the heavy lifting since the capital goes, what's really behind us. So we think we're really well positioned to execute on this story of hands here. to support the growth of our business and also return capital of the shareholder. We're not going to make any particular promises or guidance in terms of the volume of share repurchases. You know, as we progress through the quarter, it's got to say that, you know, we're not going for growth state. You know, we're growing where we believe it's a freedom and added it to the business. And from our perspective, you know, share repurchases are, you know, in a fact-based plot. there for what we do after we care.
Okay, great. Thank you, Russ.
Operator
Our next question comes from Ben Gurlier with Citi.
Hi, good morning. I just want to quickly follow up on the deposit funding side. Russ, you kind of alluded to not a lot more juice to go lower. When I look at your OSA rates, it seems like you cut them twice in the quarter, and then CD rates roll on and roll off are roughly the same. So, to think like maybe 3Q, are you anticipating 3Q is kind of the floor, mainly just from the averages on that end of the OSI rate specifically?
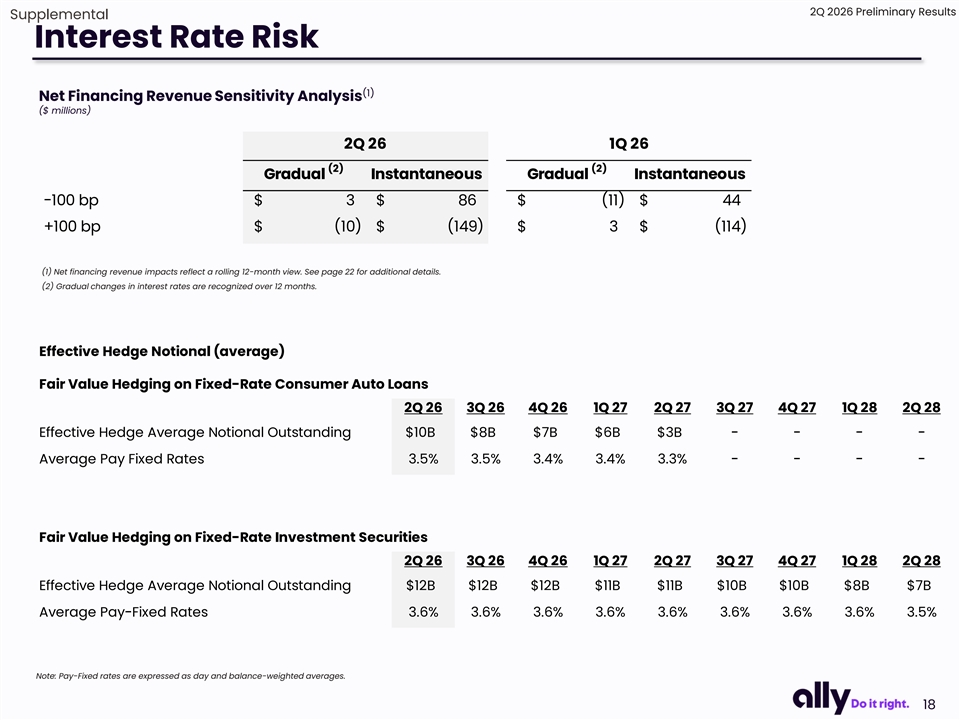
Yeah. Well, I'd say, look, on the cut during the quarter, we will have the benefit in third quarter from having those cuts in place for the full duration of the quarter. And so, there's still some juice left in overall deposit costs from that in the third quarter. On the TD roll-on, to roll off. You know, a lot of our CDs actually when they roll off, the customers roll them into OSA and so we still expect to see some benefit from CDs rolling off in the OSA if you progress through third and fourth quarter. So, we continue to have those benefits that roll in. So, in terms of the broader economics of deposits, you know, part of that depends on kind of what we see in terms of that fund. Our current expectation, you know, we used the forward curve as of June 30th, I think it was, and so we had one hike in place, I think it's September of this year, then another hike early next year. You know, and so obviously, hikes affect the path for us. They affect the net interest margin that we print in any given quarter. They don't affect our destination in that our deposit pricing turns to – our deposit pricing in our asset of our balance sheet tend to react over time. And so our destination in terms of a high-free YAM that we've been talking about for quite some time remains unchanged. But obviously, in any given quarter, you could see some movement in terms of the path we take there.
So, for us, I mean, the ebbs and flows, but – Gotcha.
Yeah, no, that's – It's going to get kind of cute here with the timing and modeling over the next six months. But when you guys think also just average earning asset mix, like your securities are obviously like a lower yielding than your loans. Is this mix appropriate or can you think loans can be a little bit bigger in terms of average earning assets? I guess it's more of a cash flow, but I'm just trying to think like longer term, where that direction of travel is, it could be a better mix from here.
So, I think in terms of, yeah, I think in terms of mix, maybe I'd start with the mortgage loan. That portfolio is in runoff, and so that runoff will benefit us. The yield on the mortgage loan is about the same as the securities portfolio. So, that kind of rolls off. And then, you know, we've been growing our retail auto loans and corporate finance at a pace quicker than our earning assets overall. And so, you'd expect, basically, mortgage loans to run off, retail auto loans, and corporate finance loans growing and contributing to new expansion. The securities portfolio is a little bit more complicated because we've got within that portfolio a legacy of lower-yielding securities that we continue to run off. But at the same time, we are reinvesting in that portfolio because we do need to maintain liquidity for a whole bunch of different reasons. And so within that portfolio, you do have a runoff of older, lower-yielding mortgage-backed securities and then a roll-on of investments, albeit in a shorter-duration targeted portfolio, but a roll-on of securities at a higher yield given the current interest rate environment. And so that one's a little bit different. In terms of the overall size of the investment portfolio, I wouldn't anticipate any major.
We do have to care for the pricing.
Operator
This is from Rick Shane with J.P. Morgan.
Hey, guys. Thanks for taking my question. Look, one of the things we've observed historically, and I'm not convinced it's as pronounced these days, is that when gas prices spike, consumers substitute types of vehicles, and it creates distortions in terms of used car prices. I think over the last decade, U.S. consumers have become pretty sanguine about driving big SUVs, and that's been one of the things that's contributed to price stability of used car prices. I'm curious if there is anything that you guys are seeing right now in terms of auction prices by vehicle type that we should be thinking about or anything interesting in terms of consumer behavior, in terms of vehicle substitution.
Yeah, no, it's a good question. And, you know, obviously there's always a lot going on. There's vehicle type. Yeah, there's the gains that various manufacturers have been making in terms of fuel economy, even for some of their larger vehicles. Yeah, there's some of the issues that individual OEMs have been dealing with from time to time in terms of recalls and other issues. So there's a lot that we could kind of go into there. You know, kind of maybe just to get directly at your question, and I think, you know, kind of one area to look at is EVs. And we have seen, you know, kind of more interest in EVs and hybrid electric vehicles as we've seen elevated gas prices. You know, again, there's always a lot going on, and in some cases that's overwhelmed by issues that are going on with particular OEMs. But I'd say on the margin, there's probably incrementally more interest in those vehicles and, you know, but also in kind of more fuel-efficient vehicles generally.
And is that dampening some of the sort of accelerated depreciation and quicker obsolescence of those newer types of vehicles that we've experienced over the last few years?
I wouldn't say that. And, again, there's always a lot going on. And, broadly speaking, used vehicle prices have been strong. And so that has been helpful to us as we see, you know, as we see, you know, cars coming back from lease, as well as we've seen kind of resolution on re-suggestion. So overall speaking, used vehicle pricing has been, you know, again, you know, there are always individual issues with particular models. Some of that we've talked about with respect to our lease portfolio historically and has led to changes in how we think about depreciation rates. But I characterize those as more targeted to specific OEMs and models.
Got it. Always interesting. I appreciate it very much, guys.
Thank you. And do we have any more questions? I'd like to just take a moment, and we still have maybe two minutes. First of all, thank everyone for joining the call. The second, just provide some reflections here. The reflection is really upon the quarter and kind of where we are in our path. And I think this quarter really provides some wonderful evidence to our strategy. For a while now, we've outlined our path to higher returns. It's dependent upon three drivers, lower auto losses, higher NIM, and disciplined expense and capital management. And I think you can see we're making progress, very good progress on all three. And it's showing up in the business. And, you know, the combination of, you know, earnings up 20-plus percent year over year for this quarter, And we're doing that and growing our core business. We have auto originations up 20%, corporate finance 20%, consumer bank have a 7%. These are very strong. And definitely see them. So thanks for joining the call and appreciate the support.
If anyone has any additional questions.
Operator
This concludes today's conference call. Thank you for participating. You may now disconnect.