Operator
Good morning, and welcome to the Our House fourth quarter and full year 2025 Earnings Conference Call. Please note that this call is being recorded and the reproduction of any part of this call is not permitted without written authorization from the company. I will now turn the call over to your host, Tara Atwood-Sajah, Vice President of Investor Relations. Please go ahead.
Good morning, and thank you for joining us for the Our House fourth quarter and full year 2025 Earnings Call. Joining me on today's call for prepared remarks are John Reed, our founder, chairman, and chief executive officer, and Michael Lee, our chief financial officer. Jennifer Porter, our chief marketing and e-commerce officer, will join us for the Q&A portion of the call. We issued our earnings press release in Form 10-K for the year ended December 31, 2025, before the market opened today. Those documents are available on our Investor Relations website at ir.ourhouse.com. A replay of the call will be available on our website within 24 hours. I would like to remind everyone that our remarks today concerning future expectations, events, objectives, strategies, targets, trends, or results constitute forward-looking statements. Actual results or events may differ materially due to a number of risks and uncertainties. For a summary of these risks, factors, and additional information, please refer to this morning's press release and the cautionary statements and risk factors described in our most recent annual report on Form 10-K and subsequent 10-Qs, as such factors may be updated from time to time in our filing with the SEC. The forward-looking statements are made as of today's date, and except as may be required by law, the company undertakes no obligation to update or revise these statements. We will also refer to certain non-GAAP financial measures, and this morning's press release includes the relevant non-GAAP reconciliations. Now I will turn the call over to John. John, over to you.
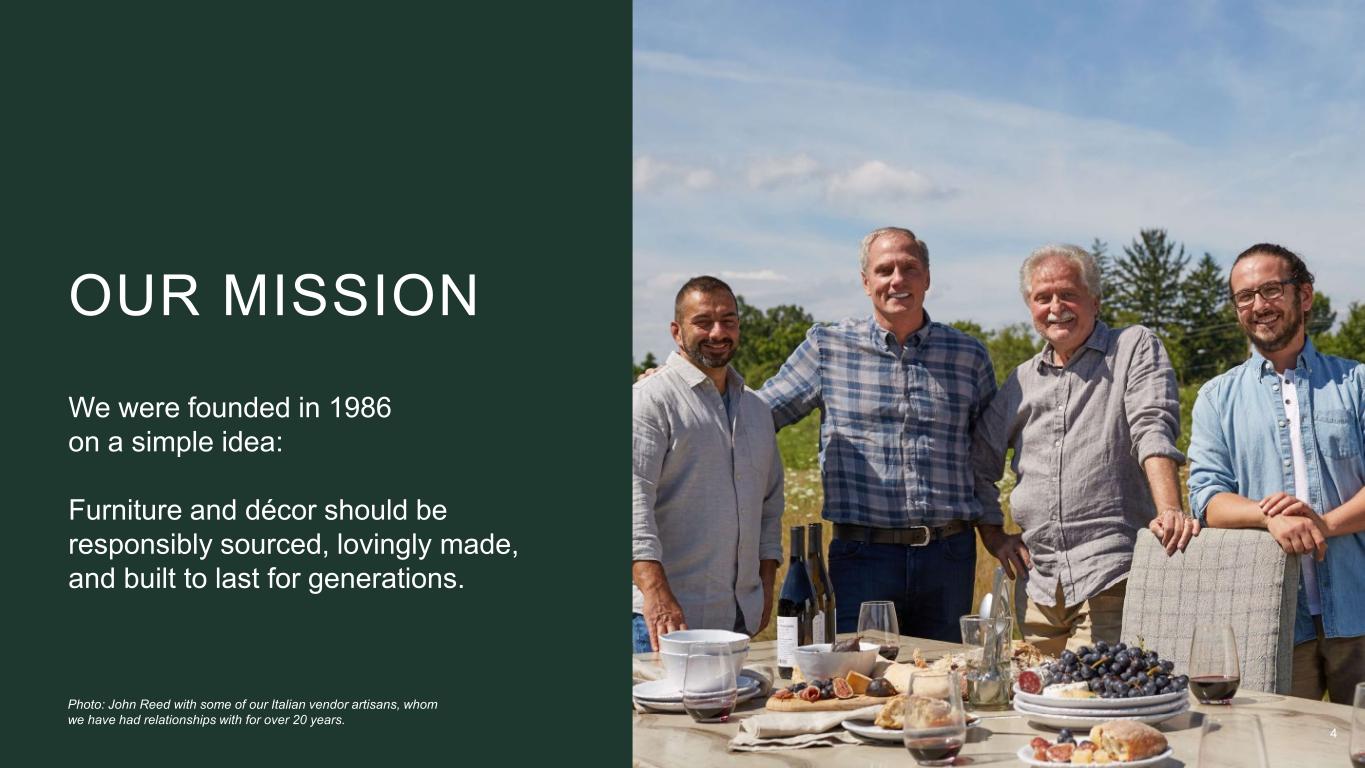
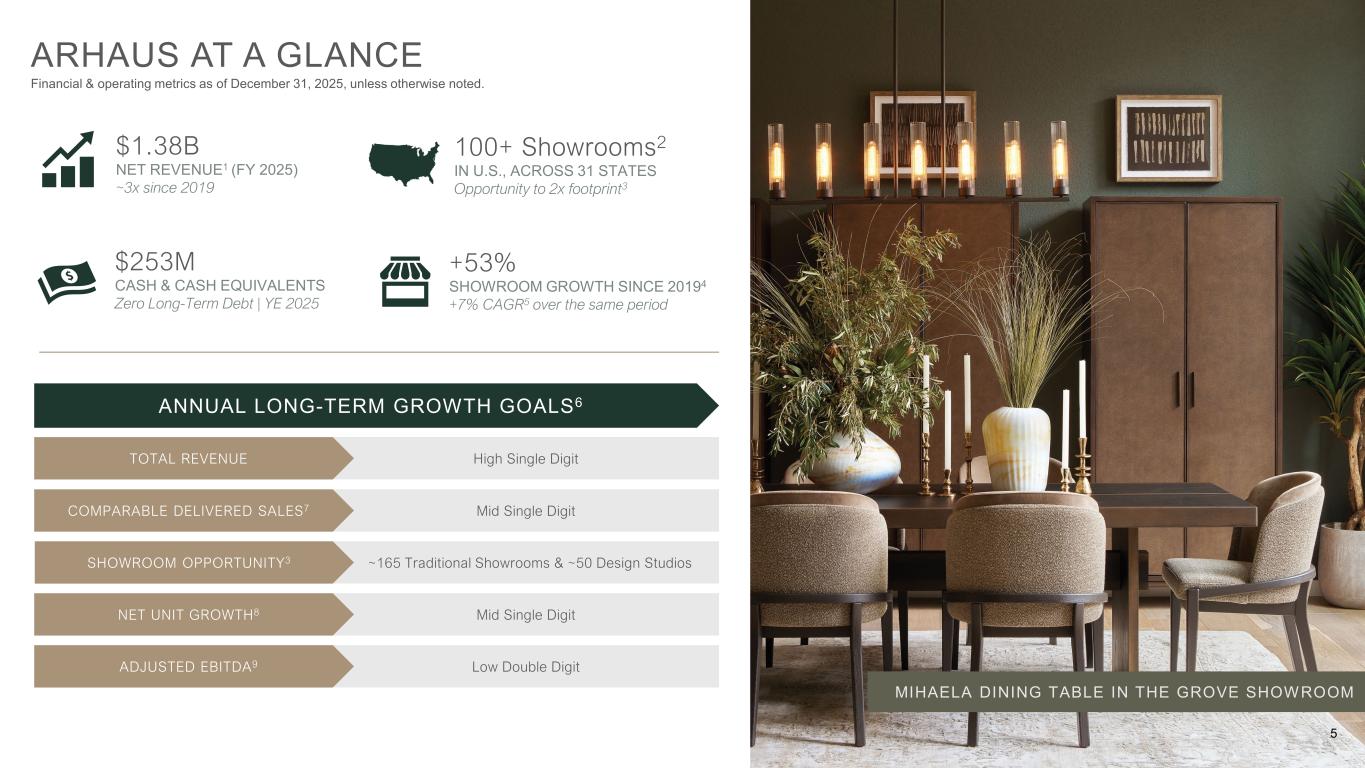
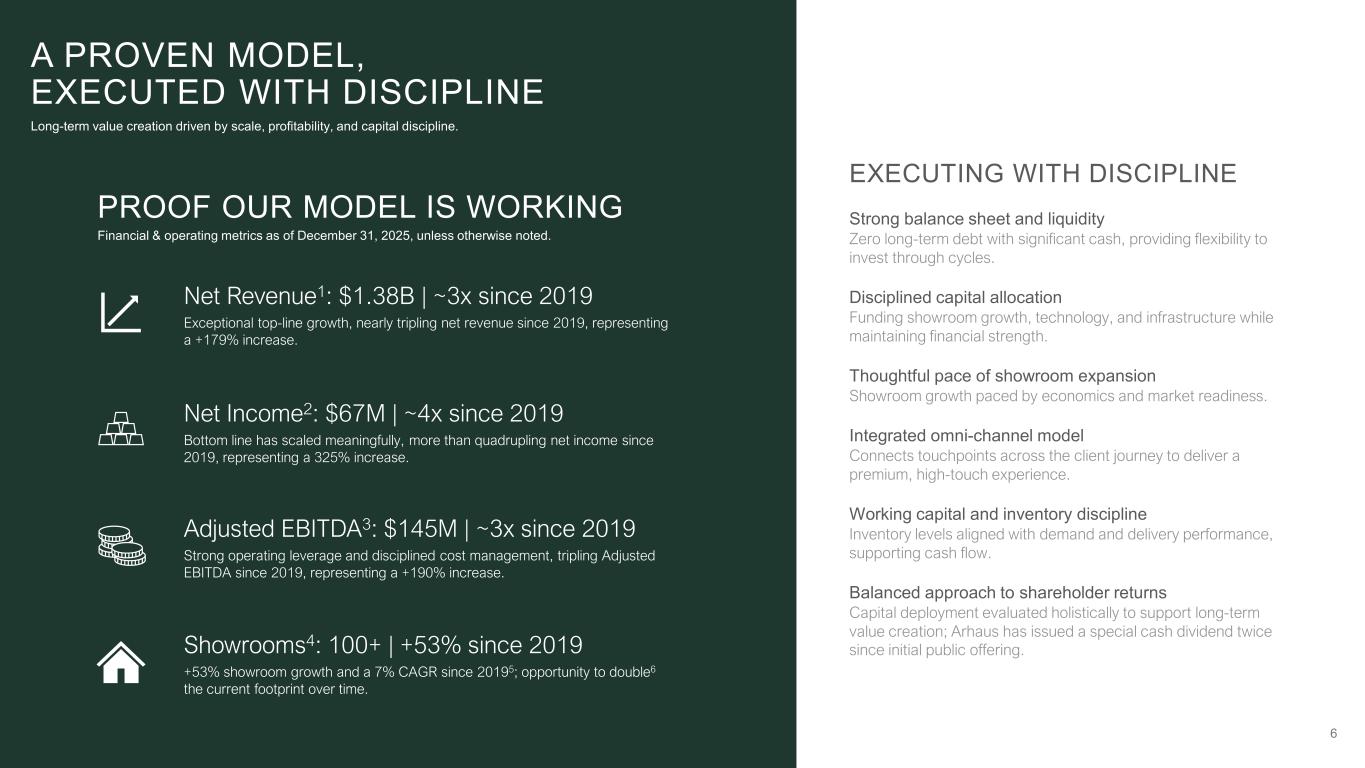
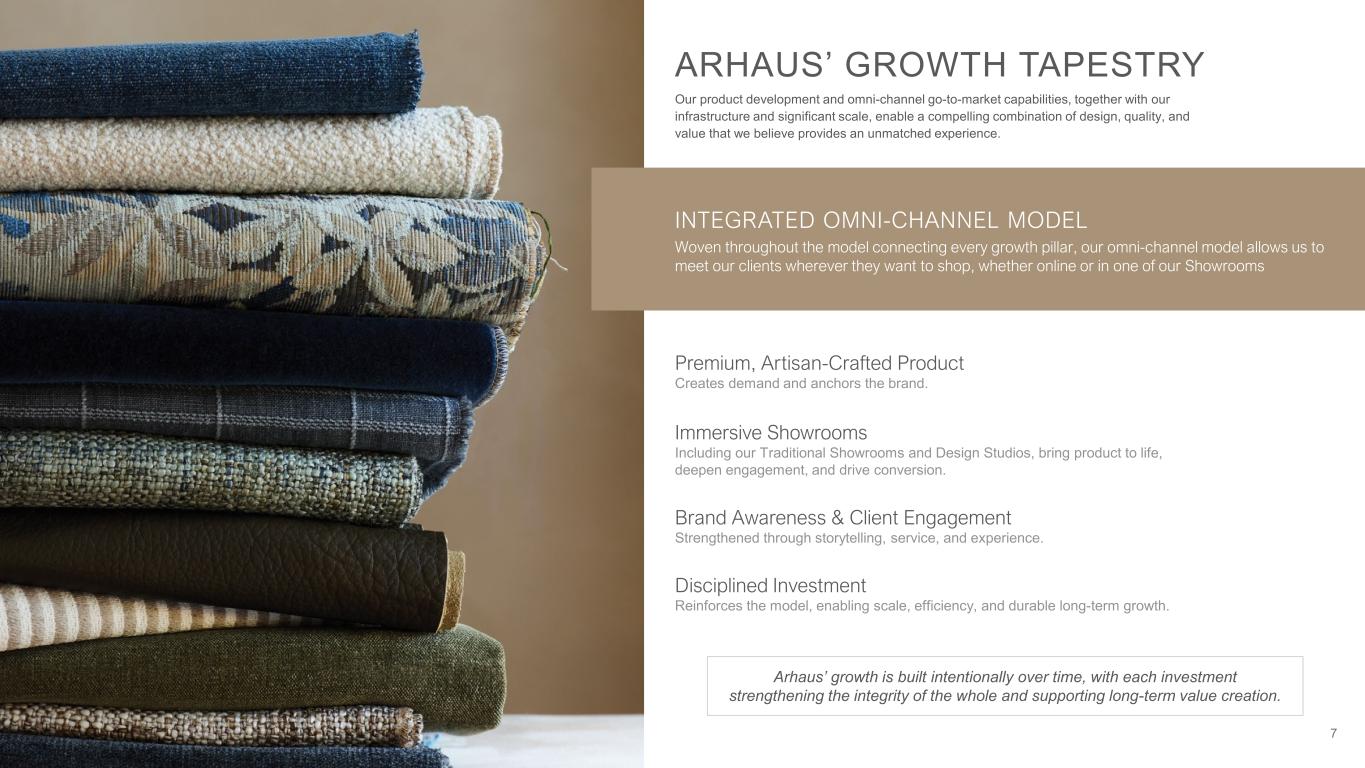
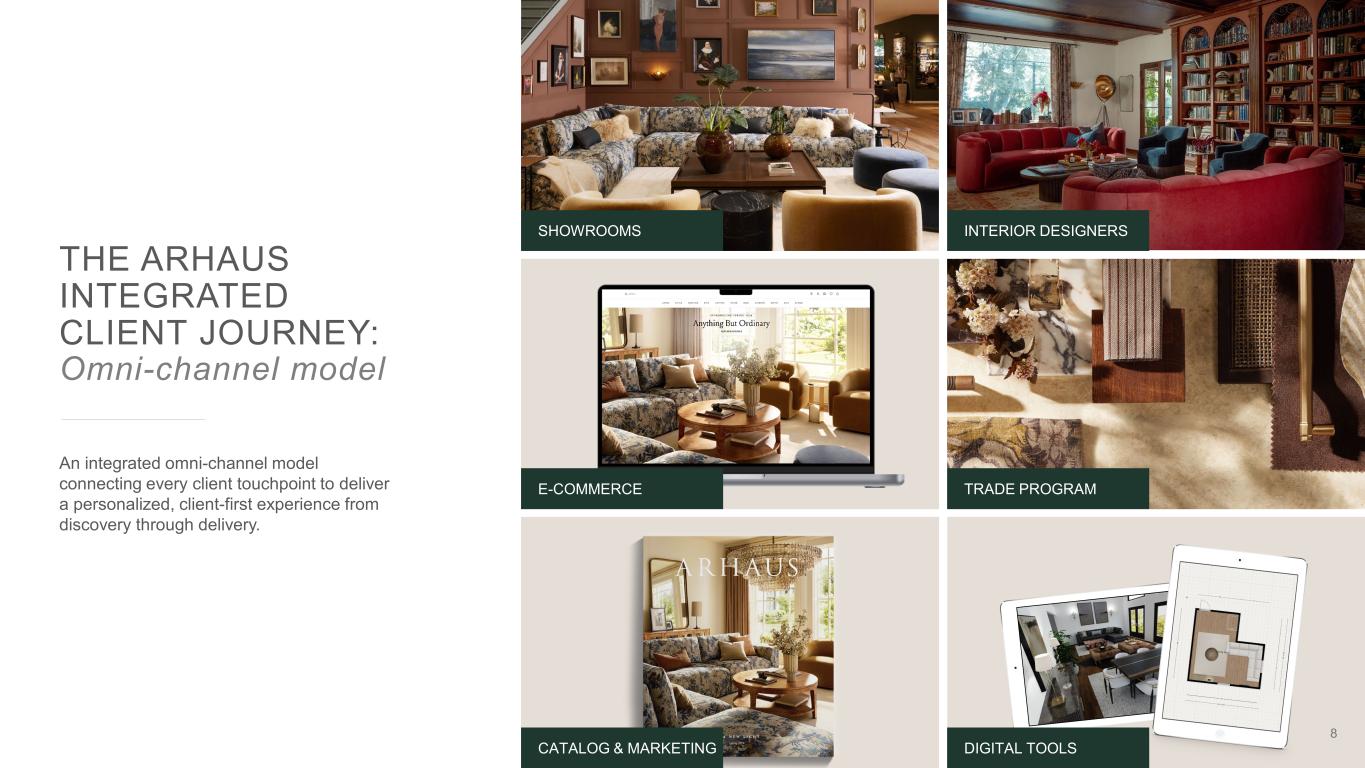
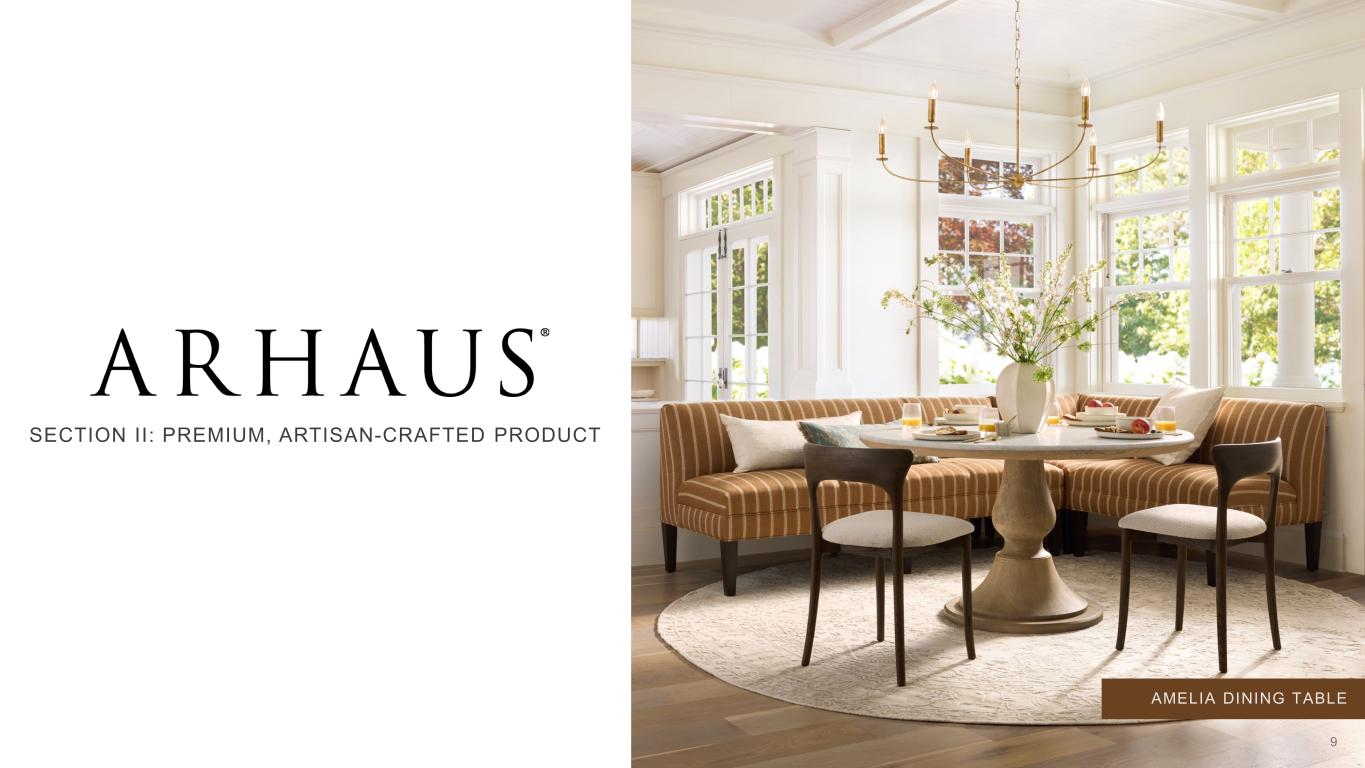
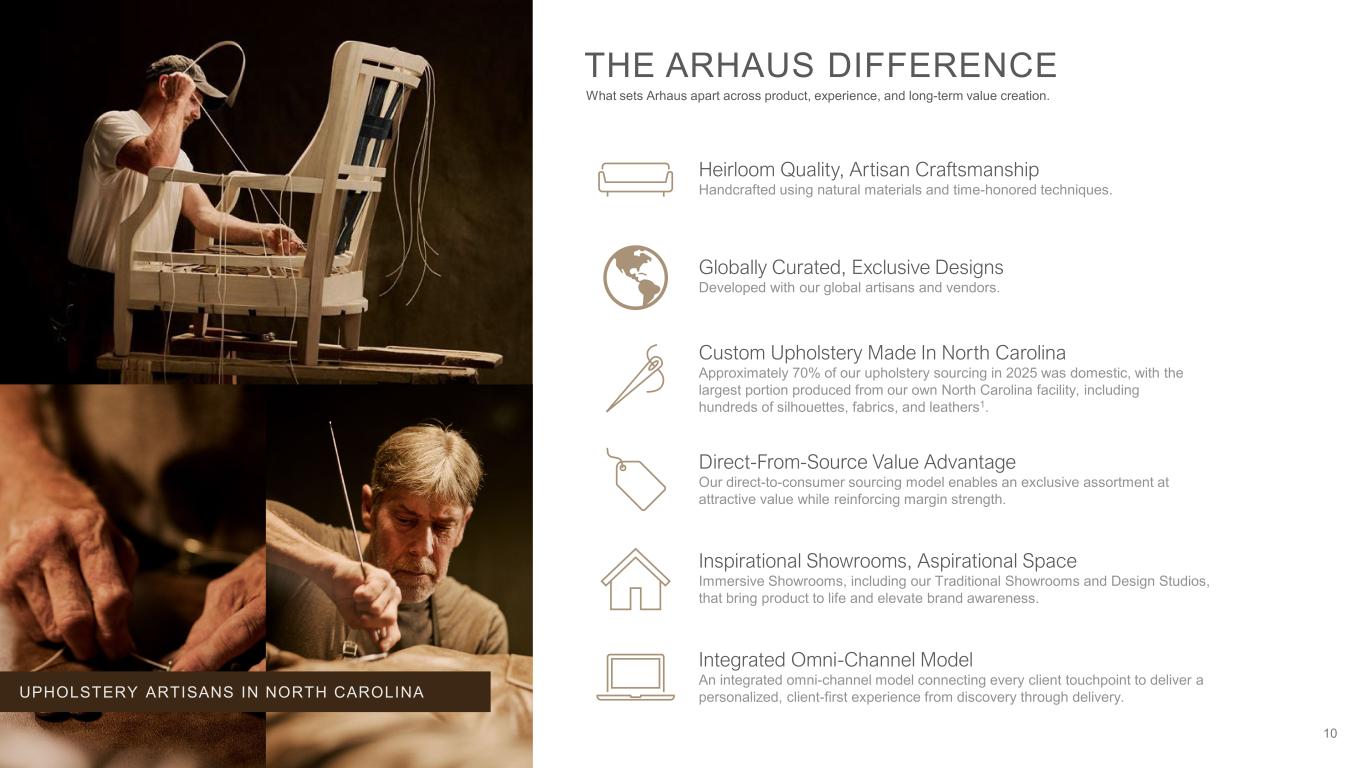
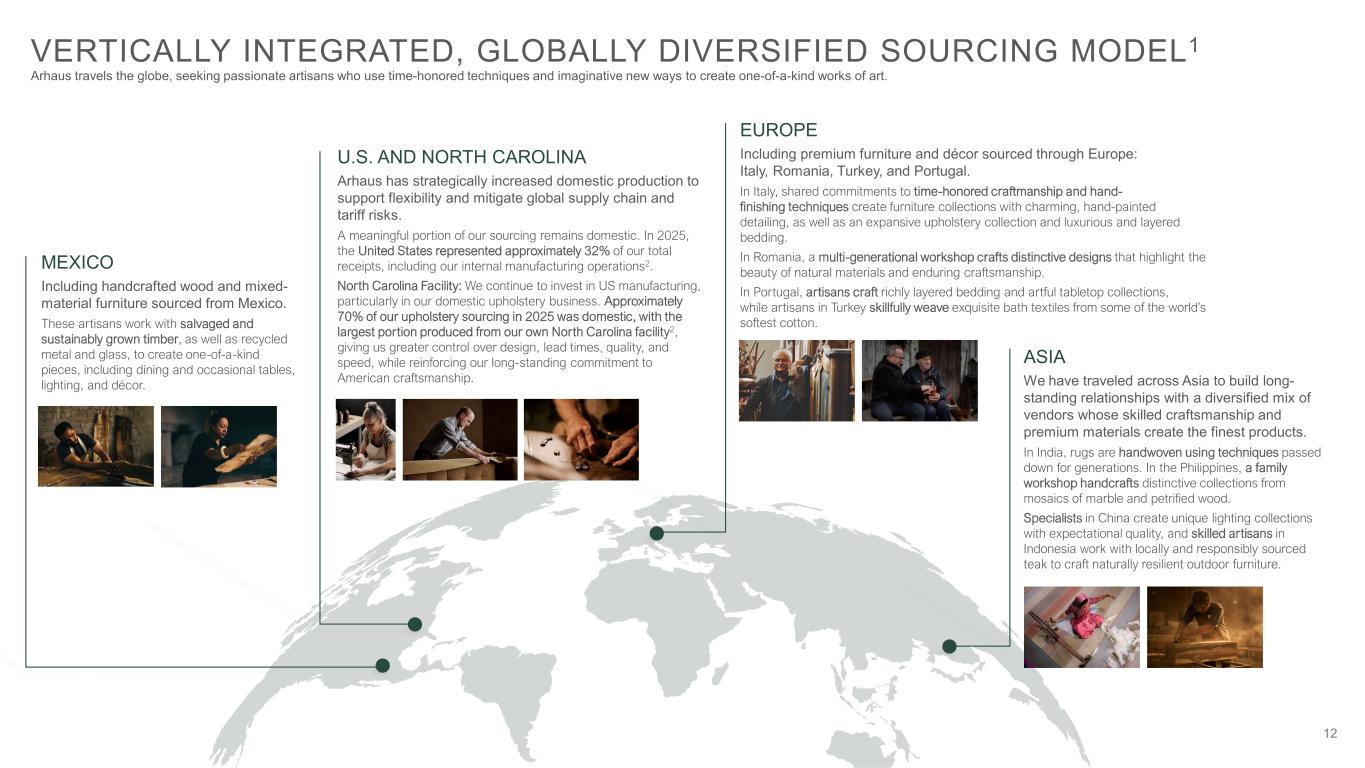
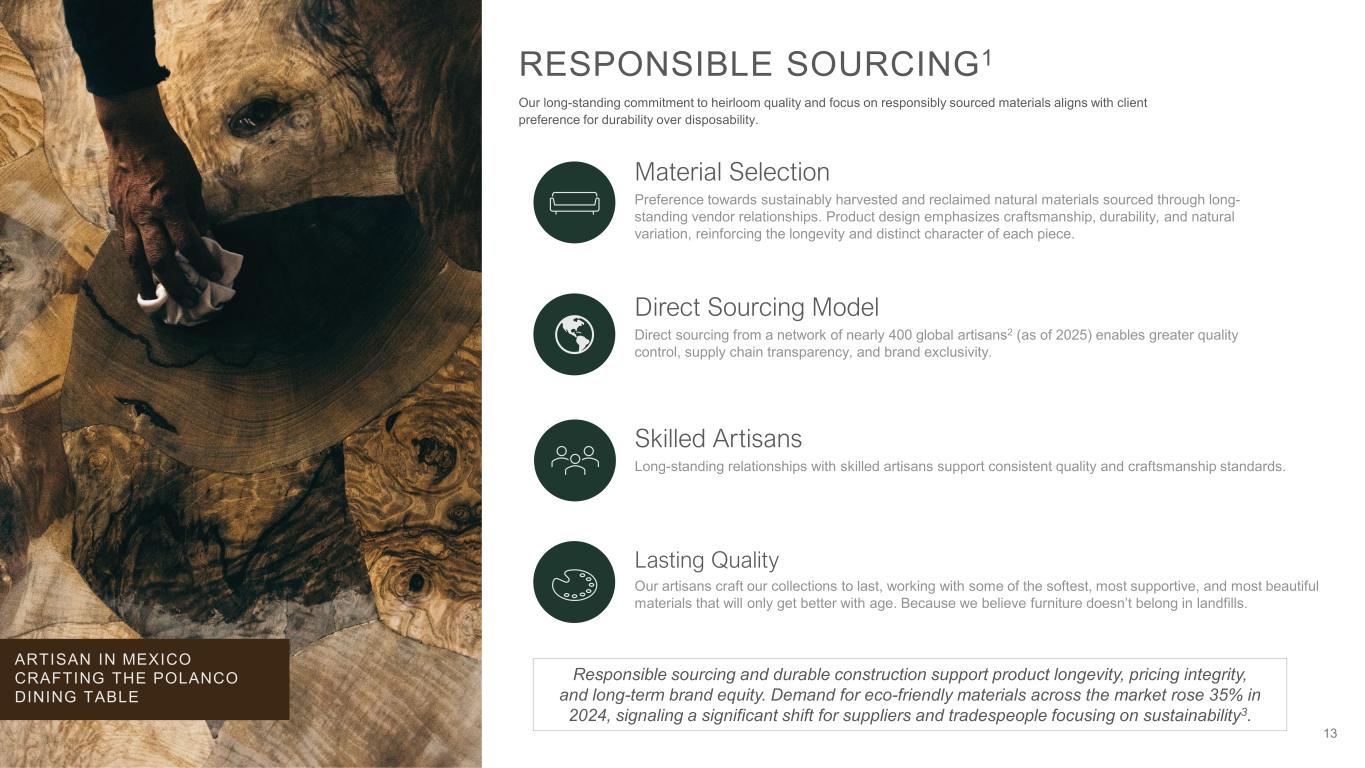
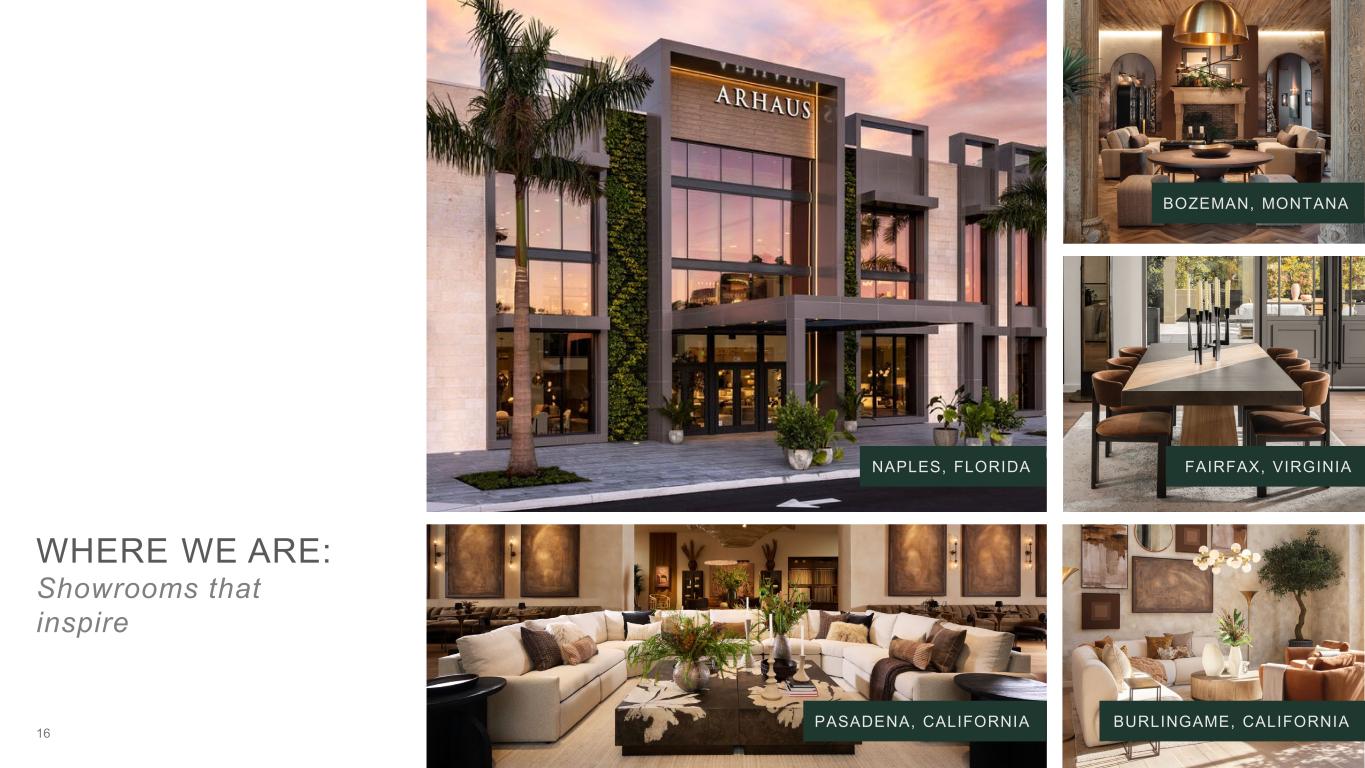
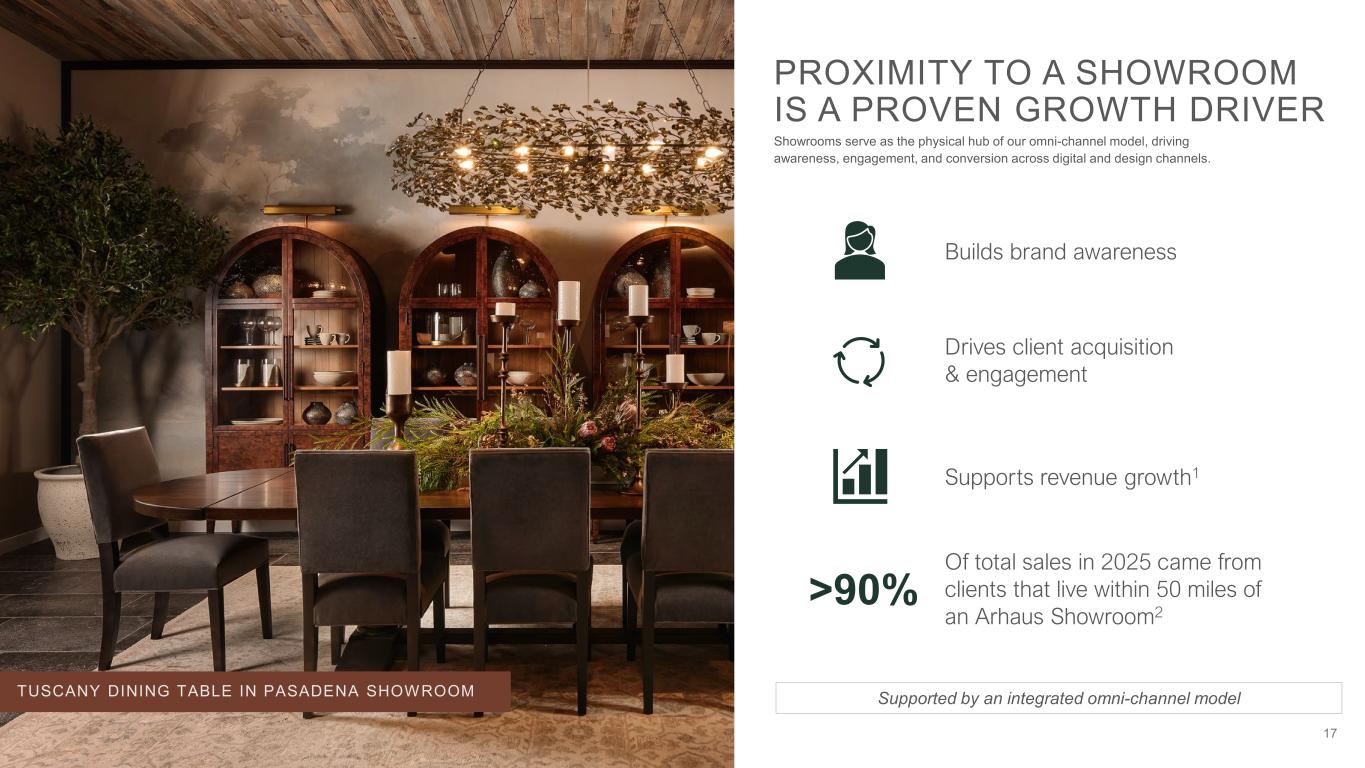
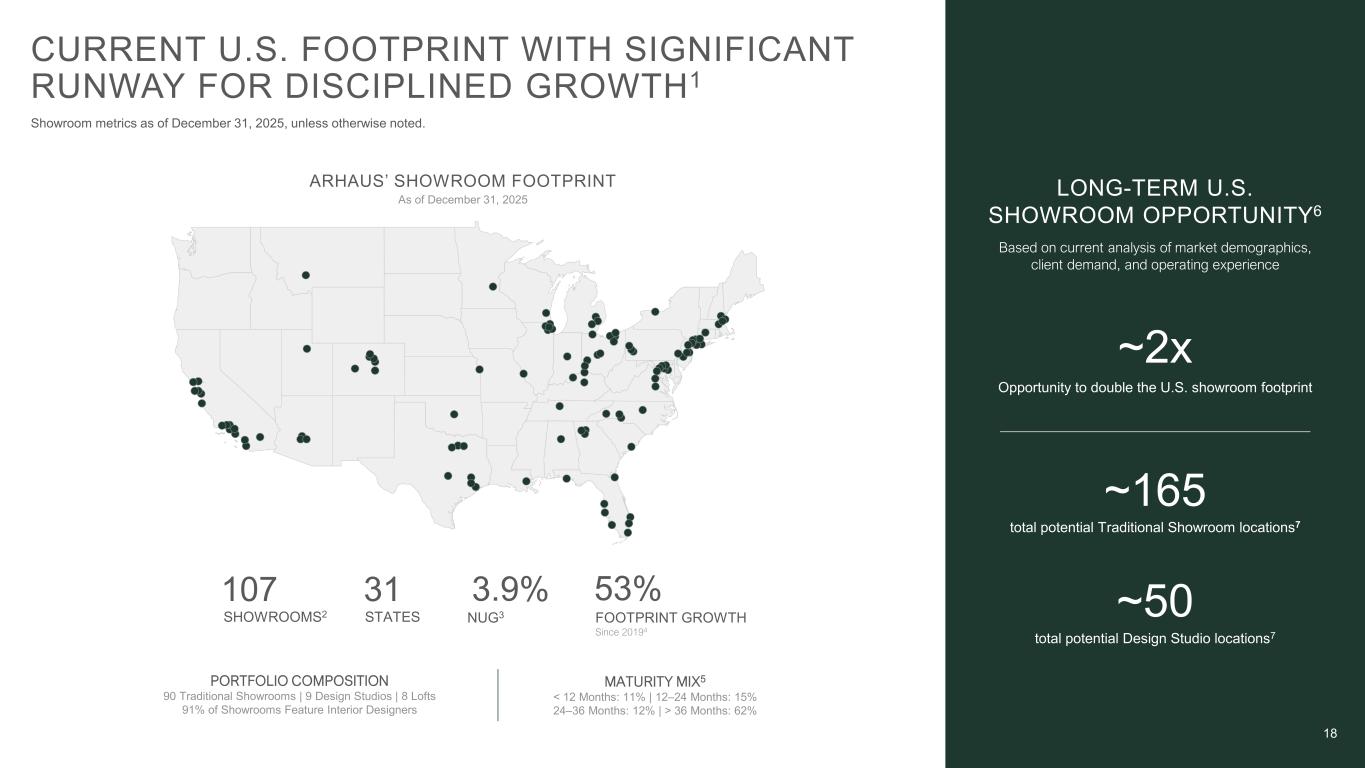
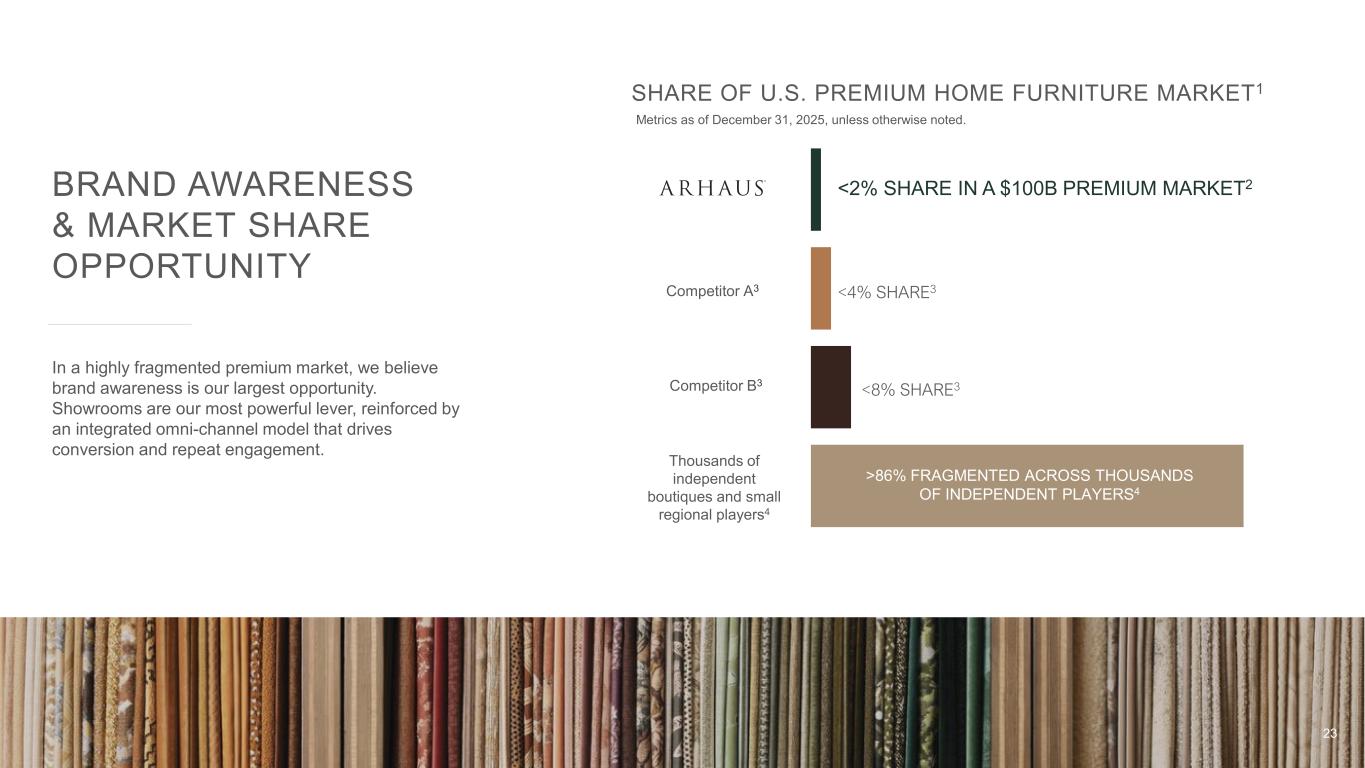
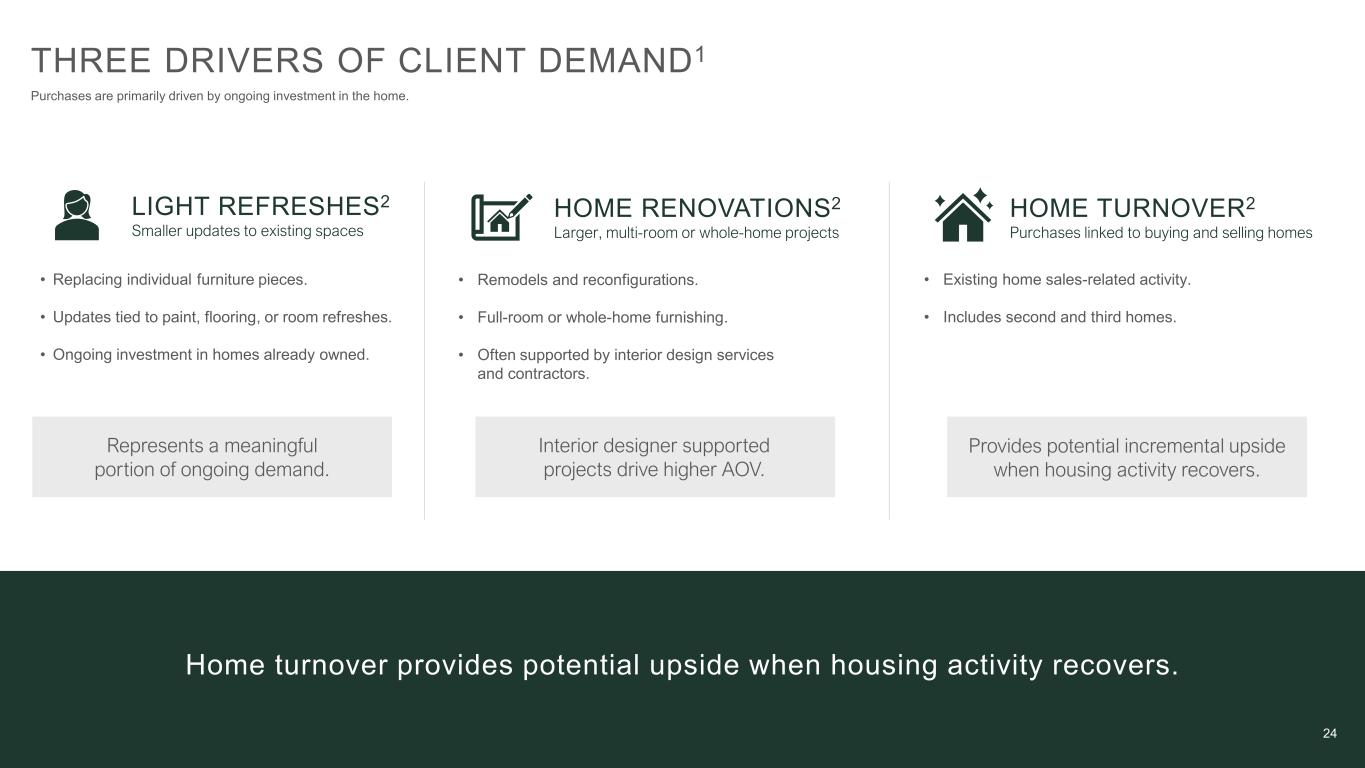
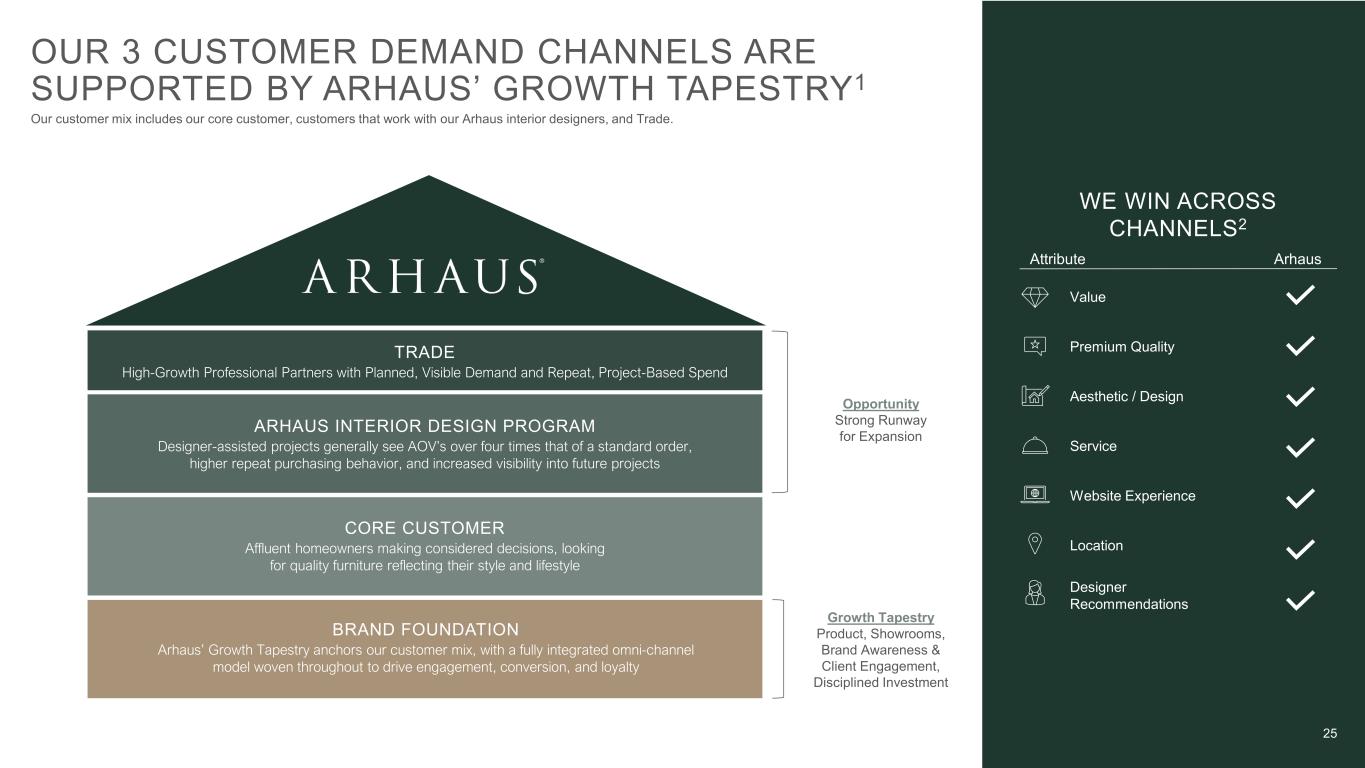
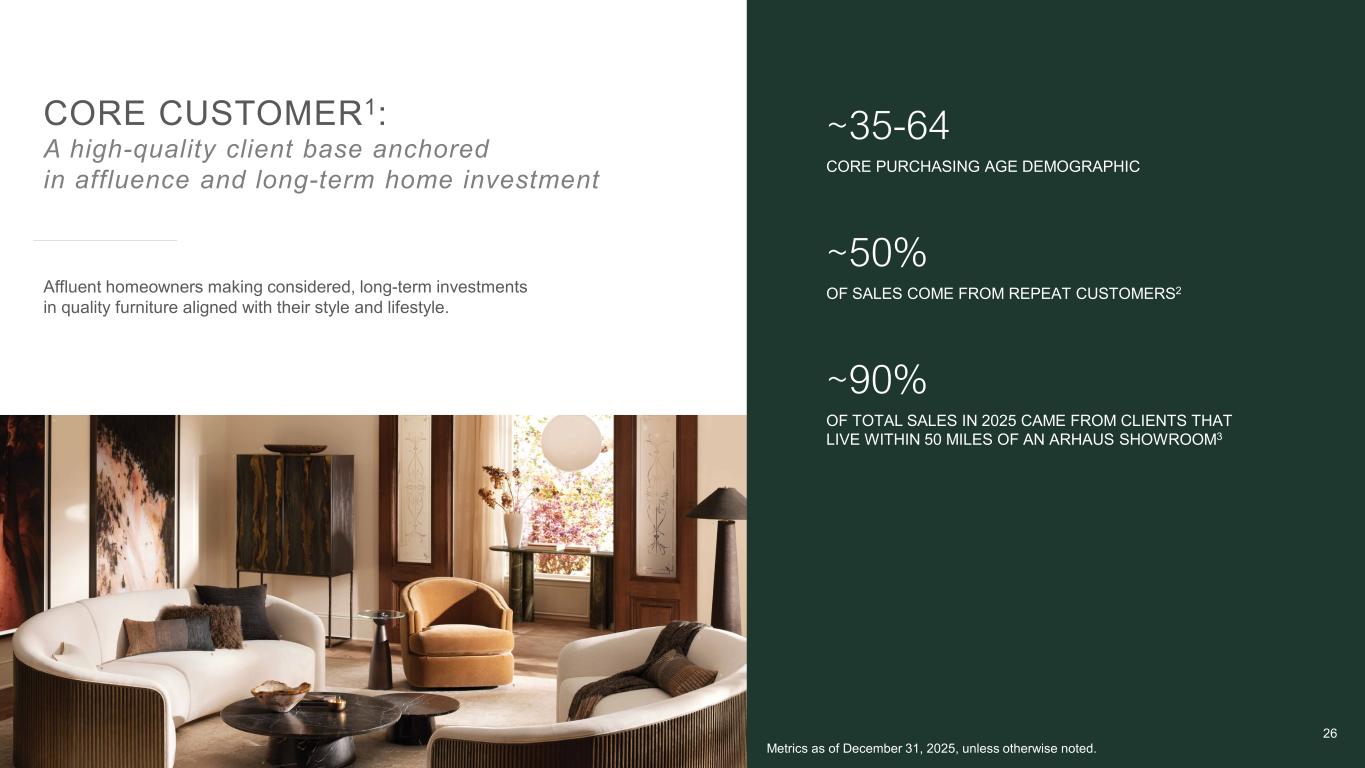
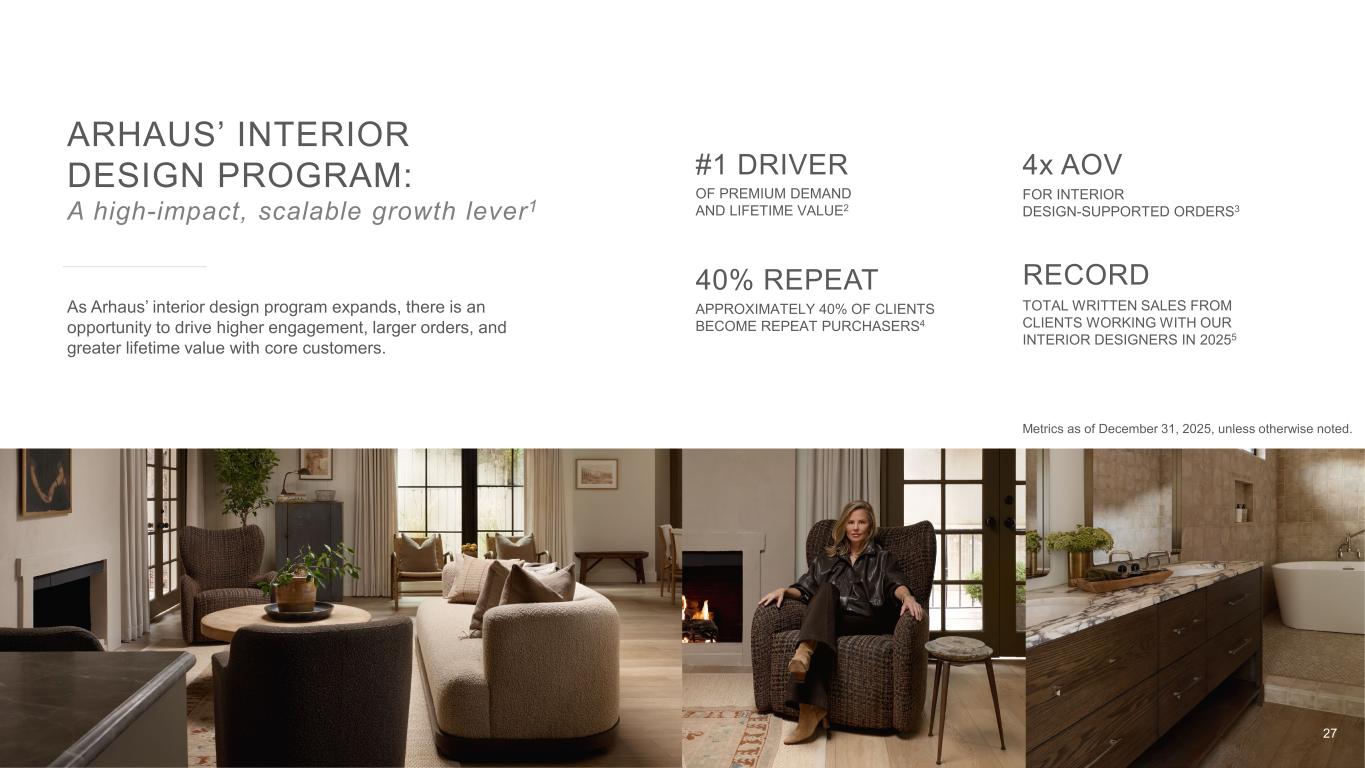
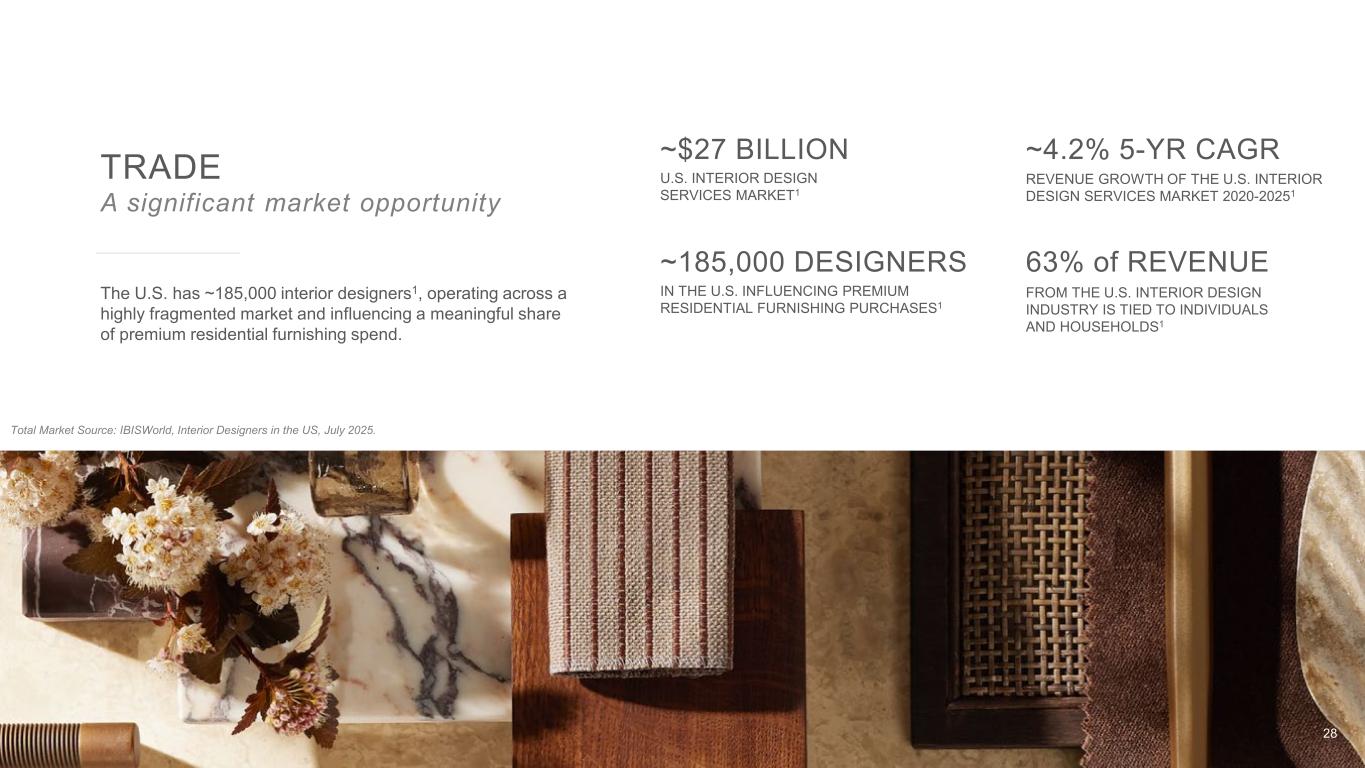
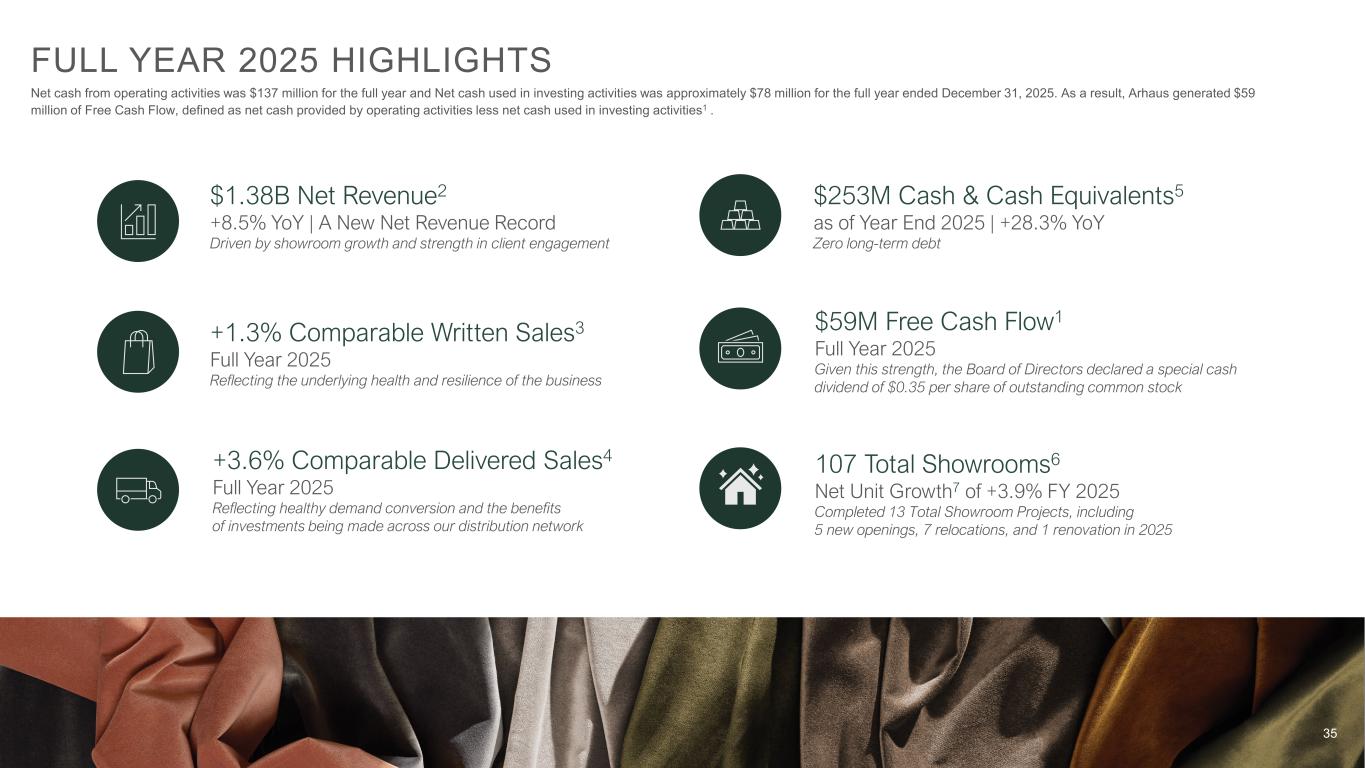
Thanks, Tara. Good morning, everyone, and thank you for joining us. As we close out 2025, I'm proud of what we delivered. But more importantly, I'm energized by what I'm seeing firsthand across our showrooms, our design teams, our artisans around the world. I founded our house 40 years ago on a simple idea, that furniture and decor should be responsibly sourced, lovingly made, and built to last for generations. That philosophy hasn't changed. It continues to guide many of the decisions we make today. We're building our house for the long term, and that begins with talent. I'm excited to welcome Michael Rangel as our new Chief Merchandising Officer. Michael is a proven merchant leader and operator with deep expertise in product strategy, assortment, architecture, and building assortments that resonate with our customers. As we continue to build on our differentiated model rooted in artisan craftsmanship, timeless design, and a highly personalized service experience, Michael will be instrumental in strengthening cross-functional collaboration, elevating our products, and shaping the next chapter of our growth. across our house our team remains our secret sauce the our house family is a key competitive advantage one that consists consistently sets us apart the fourth quarter marked a strong finish to 2025 and a strong year of execution across the business reflecting the power of our brand the strength of our product offerings and our discipline strategy i want to spend a moment putting 2025 in context. Because when I look at this year, I don't just see results. I see a business that has proven its resilience across cycles. Having led our house through multiple cycles over the last four decades, perspective matters. If we go back to 2019, a more normalized pre-pandemic baseline, our house was a very different company, smaller in scale and earlier in our growth journey. Over the past six years, we've grown dramatically. We've navigated extraordinary one-time events from pandemic-driven demand surges to normalization as customers shifted spending between products and experiences. And more recently, in a period of macro volatility driven by softer housing turnover, tariffs, and broader uncertainty. Throughout all of this, We've remained true to the values and craftsmanship that we have defined Our House right from the start. What matters to me as a founder and CEO isn't short-term volatility. It's whether the long-term thesis is working. And what we see today is very clear. Our model is working. In 2025, the R-House team delivered record net revenue of $1.38 billion, up 8.5% year-over-year. Since 2019, our net revenue has nearly tripled, underscoring the strength and durability of our model rooted in artisan craftsmanship and heirloom quality design. I want to spend a few minutes sharing what we see firsthand with our high-end clients. Throughout the year, headlines suggested that the consumer was under pressure and discretionary spending was challenged. What we experience in our business tells a more nuanced and encouraging story, particularly at the high end of the market. Our clients' purchases are highly considered. They are intentional investments in the home, and our high-end clients continue to invest. They are choosing high-quality pieces. They are investing in custom order, specialized pieces that we make just for them. They are refreshing rooms and renovating entire homes. They are designing spaces that feel meaningful and personal. They are prioritizing quality, craftsmanship, and longevity. And this plays direct to our house strengths. My perspective comes from the daily interaction across our showrooms, our interior design services, and our trade network. This real-time engagement gives us a clearer view than generalized macro commentary. When uncertainty arises, written sales are typically deferred, not lost. and we see that dynamic in 2025. Engagement remained healthy, and as confidence improved, projects moved forward. We marked strong performance in 2025 across several important areas of our business. Record total written sales supported by the growth of our showroom footprint and continued demand of our products. Upholstery had the highest total written sales in our history, a testament of our meticulous craftsmanship and assortment of hundreds of fabrics and leathers. Customization continued to gain momentum, reaching very impressive written sales growth. Over the past several years, we have meaningfully expanded our custom capabilities, and we also achieved record written sales from clients working with our interior designers. These are not signs of a pullback. Instead, they are signs of intentional investment in our house products. When demand becomes more considered, differentiation matters most. And when clients invest in intention, they invest in quality. That is where we always win. It is also important to understand what drives our written sales. When clients come to our showrooms, it's typically for one of the following reasons. First, a light refresh, replacing individual pieces and updating existing spaces. Second, home renovations, multi-rooms, or entire home projects, often supported by interior designers and trade relationships. Home turnover, which provides incremental upside as the housing activity normalizes, particularly as conditions improve across higher-end markets. This mix reinforces the durability of our model. We serve clients across three primary demand channels. First, our core customer, a fluent homeowner making considered long-term investments. Second, customers that work with our house interior designers. A high-impact growth lever, interior designers assisted projects generating average order values more than four times that of the standard orders. And approximately 40% of our customers become repeat purchases. Third, our trade channel, meaningfully long-term opportunity. The United States interior design market is approximately $27 billion, and we see significant opportunity to expand our reach within this channel. While macro commentary can shift quickly, our confidence is grounded, the resilience and purchasing power of our high-end clients. Record engagement in products, customization, upholstery, and interior design services. A written sales mix anchored in refreshes and renovations, not solely home turnover. And a premium brand position for intentional spending environments. 2025 reinforced that when demand becomes more considered, our differentiations become more powerful. We believe our house is exceptionally well-positioned for the years ahead. Turning to product. At our house, product is the foundation of everything we do. It inspires engagement, drives differentiations, and ultimately allows us to capture market share. Home is where life unfolds, and our pieces are designed to support these moments. From the beginning, I believe the home should feel personal and truly lived in. That belief continues to guide our design process. 2025 drove one of the strongest periods of product-run innovation in our history, resonating with clients through thoughtful design, natural materials, and warm, timeless silhouettes. Newness, customization, and interior design-led projects contributed meaningfully to engagement and written sales throughout the year. What excites me most is how our clients are evolving statistically. While neutral remains important, we are seeing a clear shift towards richer colors, pattern, and texture. We're leaning farther into the more traditional aesthetic with pieces that feel collected over time, rooted in craftsmanship, and layered with character. You see it in deeper finishes, richer colors, and distinctive textiles. Silhouettes are traditional in origin, yet thoughtfully refined for today. There is a warm and a sense of patina, almost a subtle gilded quality, that evokes nostalgia and makes each piece feel storied rather than simply new. Clients are embracing these more expressive pieces, colored through upholstery patterned ottoman statement rugs and sculpture chairs. They are designing with intention, creating homes that feel personal and distinctive. Our client does not want the same furniture that the neighbors have. And they are increasingly leading into our highly customization model, selecting from hundreds of fabrics, leathers, finishes, and silhouettes to create something unique for their own, supported by expanded domestic upholstery capabilities in our North Carolina manufacturing facility. Customization remains a core differentiator. Our exclusivity comes from designing at the materials, construction, and silhouette level. Time and time again when I hear from our clients, after five, ten years, they still love their product, the incredible quality that only gets better over time. Our clients want furnishings they can live in, collect, and ultimately pass down generation to generation. Looking ahead, 2026 represents some of the most innovative and expressive designs to date. Confident use of color, pattern, and architectural silhouettes. Refining detailing, including tailored trim and fringe, and a continued focus on responsibly sourced materials and elevated finishes. Our outdoor collection is a great example. We believe it is the largest launch in our history, featuring premium teak and artisans crafted all-weather materials, developed exclusively for our house while delivering exceptional durability. These pieces are traditional and inviting in design, yet built for modern performance. Equally important is how we present our products, is our showrooms. We are curating traditional, traditional-inspired rooms that feel layered and aspirational. Clients don't just see a new sofa. They feel transported into a home that feels their own. Digitally, we are enhancing the same storytelling through richer imagery and content that highlights craftsmanship, texture, and finish, ensuring the emotional experience carries seamlessly across channels. This philosophy was recently brought to life through our Defy the Ordinary campaign, a reflection of how our product showrooms and digital platform work together to create something intimate, personal, and inspiring. Ordinary has never been our goal, and it never will be. This is how we design, how we source, and how we build enduring relationships with the artisans around the world. We are reaching new clients, deepening engagement with existing clients, and empowering our interior designers and showroom teams to bring these collections to life in meaningful ways. Turning to our artisans. We source from artisans across North America, Europe, and Asia, with many relationships spanning decades. allowing us to innovate, maintain quality, and adapt as materials, costs, and clients' preferences evolve. No single country defines our sourcing strategy, providing flexibility and resilience in a volatile trade environment. A meaningful portion of our sourcing remains domestic. In 2025, the United States represents approximately 32% of all our total receipts, including our internal manufacturing operations. We continue to invest in our U.S. manufacturing, particularly in our domestic upholstery business. Approximately 70% of our upholstery sourcing in 2025 was domestic, with the largest portion produced in our own North Carolina facility, giving us greater control over design, lead times, quality, and speed, while reinforcing our longstanding commitment to American craftsmanship. Our artisans are central to everything we do at our house. I spend meaningful time with them, both in the United States and abroad, because quality, innovation, and long-term value are built in workshops. In December, I spent time in Vietnam and India. It was one of the most productive trips I've had in many years. We reviewed work and development, explored new techniques and materials, shaped early concepts, and for future assortments. What stood out was the level of craftsmanship and pride. with artisans refining finishes and designing in real time with a shared focus on responsibly sourced, lovingly made pieces built to last. Our differentiated assortment comes to life through our showrooms, experience in our interior designers and design consultants. Together, they convert inspiration into engagement and deepened client relationships. That is how we capture share of the $100 billion premium home furnishings business. We operate in a highly fragmented category where proximity matters. In 2025, approximately 90% of our total sales came from clients that live within 50 miles of one of our house showrooms. Our showrooms are the front door to our omni-channel experience, immersive environments where clients fully engage with our brand, our product, and our interior designers. Since 2019, we've grown our showroom footprint by more than 50%, and we see opportunity to expand further. In 2025, we completed 13 total showroom projects and ended the year with 107 showrooms. I personally spent time in many of these new locations, from Winter Park to Bozeman to San Diego to Pasadena. These spaces are carefully chosen, thoughtfully designed, and intentionally built to bring the full Our House experience. As we head into 2026, the macro environment may continue to shift, but what we see firsthand gives us confidence. Being with clients every day across our showrooms and in their homes and alongside interior and trade designers means we rely on real insights, not secondhand signals. We see clients investing thoughtfully in their homes, trade designers choosing our house as a trusted partner, and artisans and vendors delivering products that are increasingly well-made and exclusive to our house. I want to thank our teams across our house for the year they delivered in 2025. This was a year that required focus, creativity, and discipline execution. It's your work that brings the Our House brand to life. Forty years in, and in many ways, we're just getting started. With that, I'll turn it over to Mike to walk through the financials.
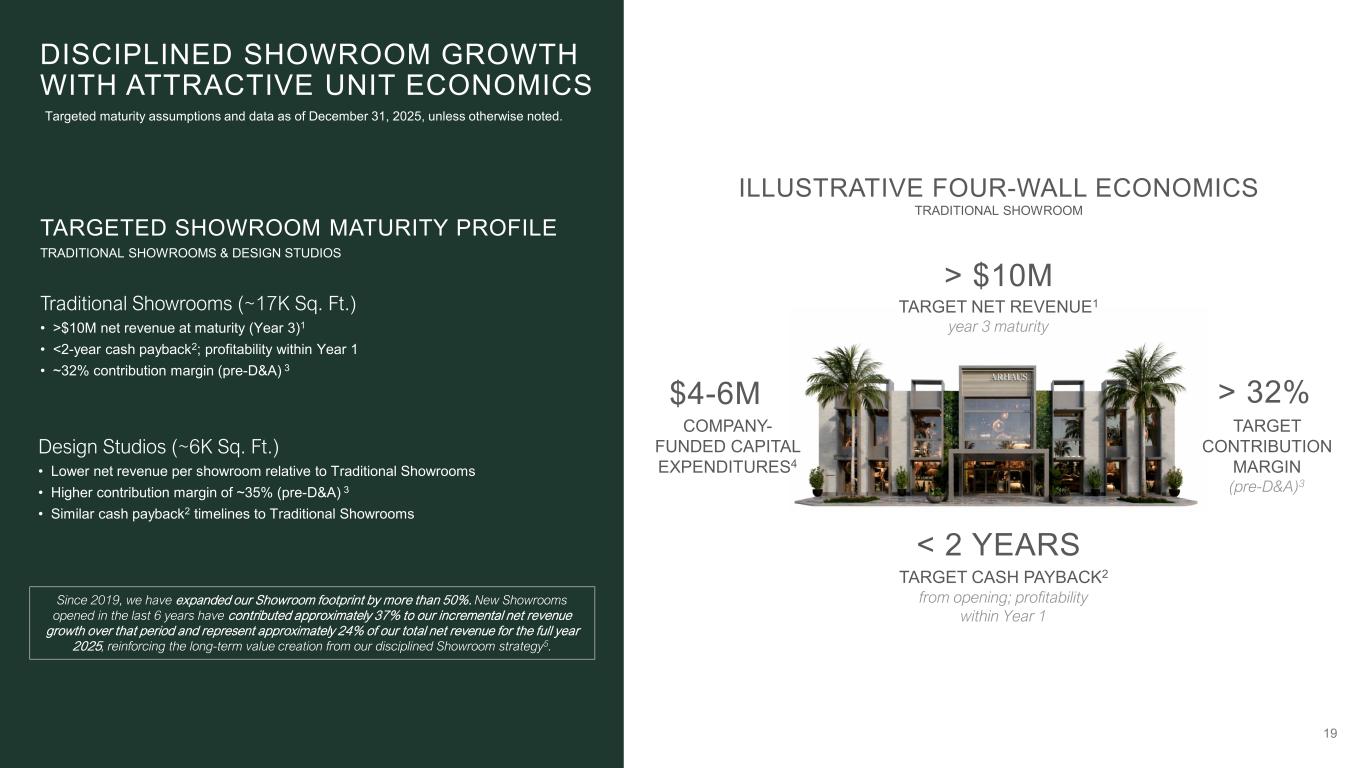
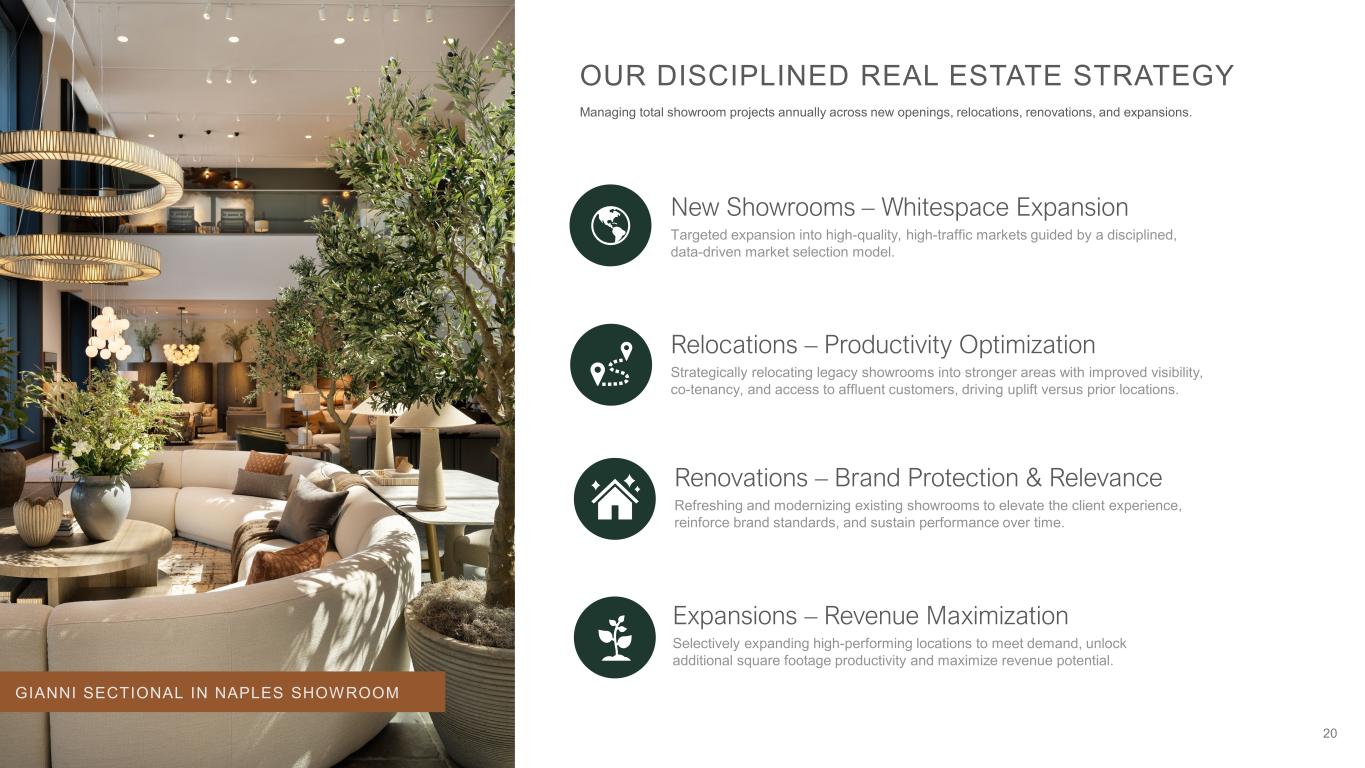
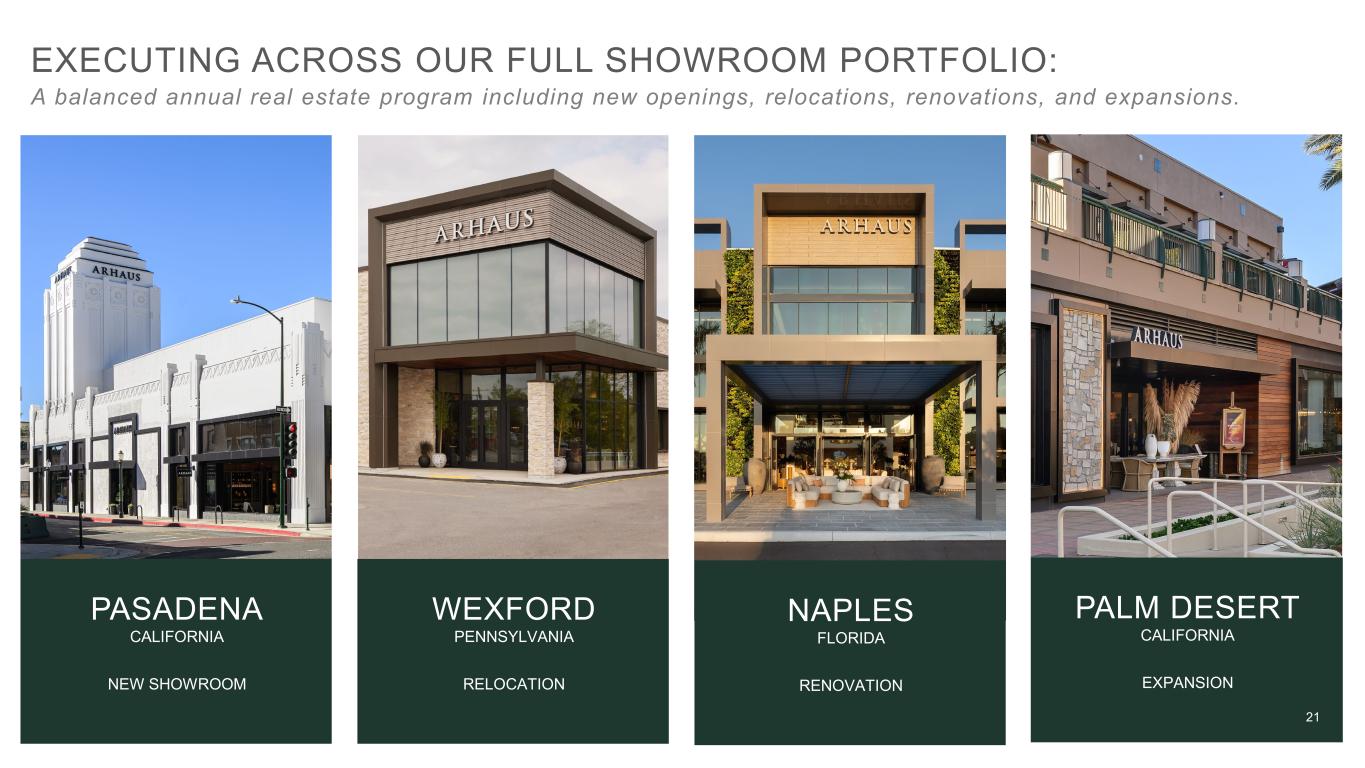
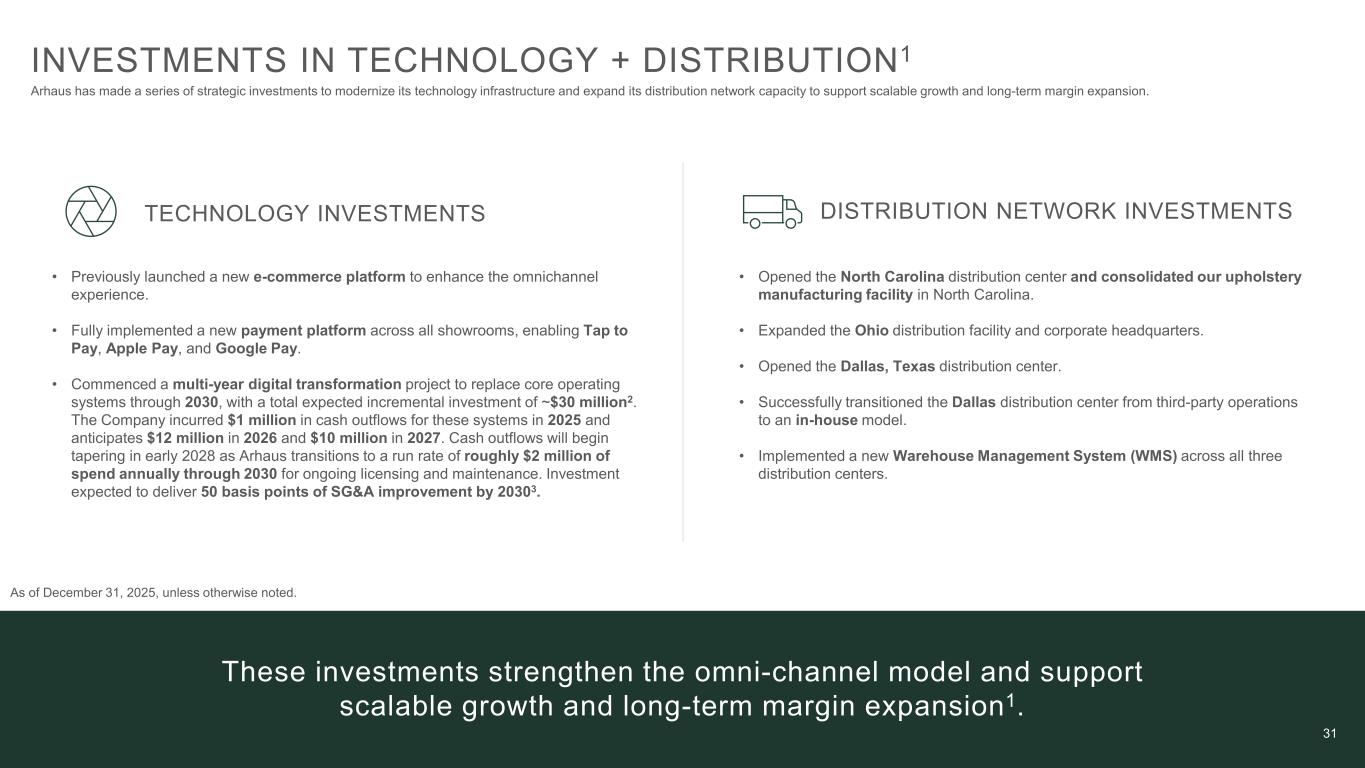
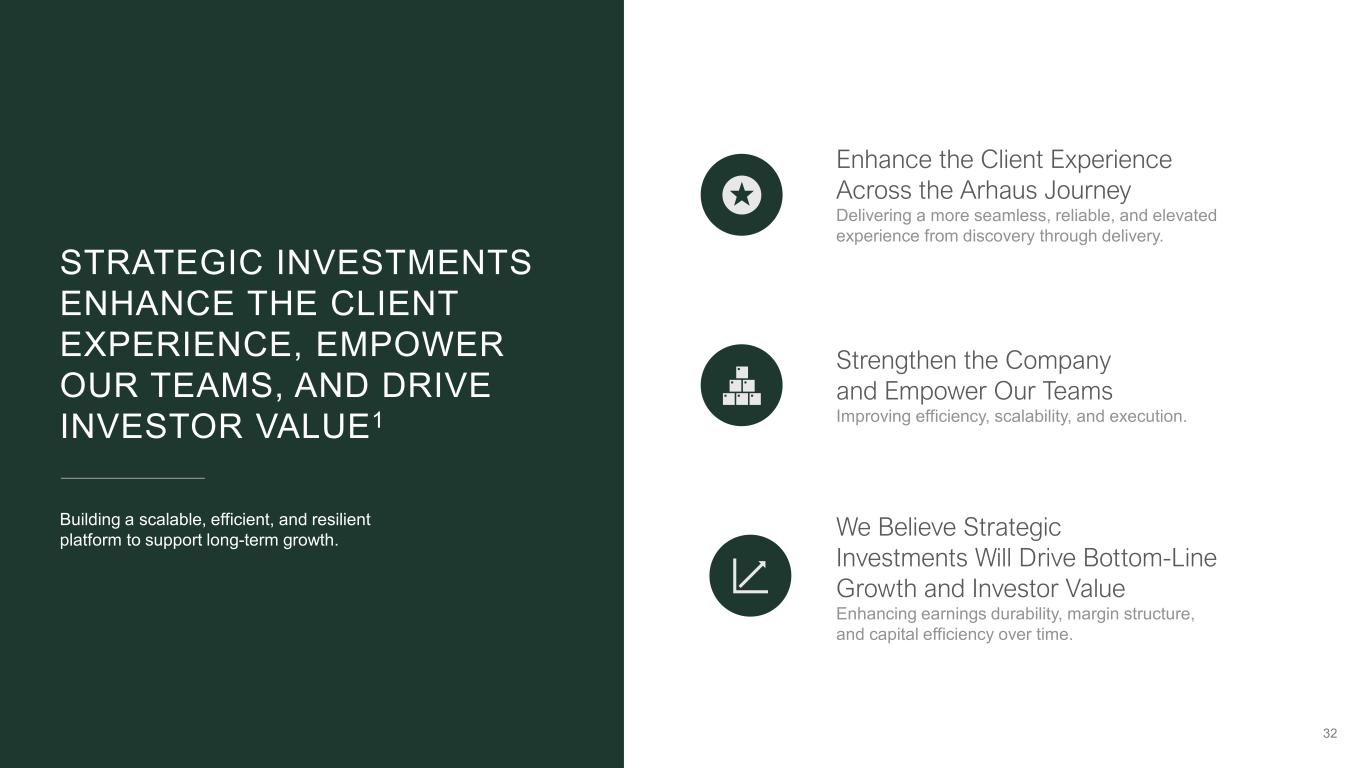
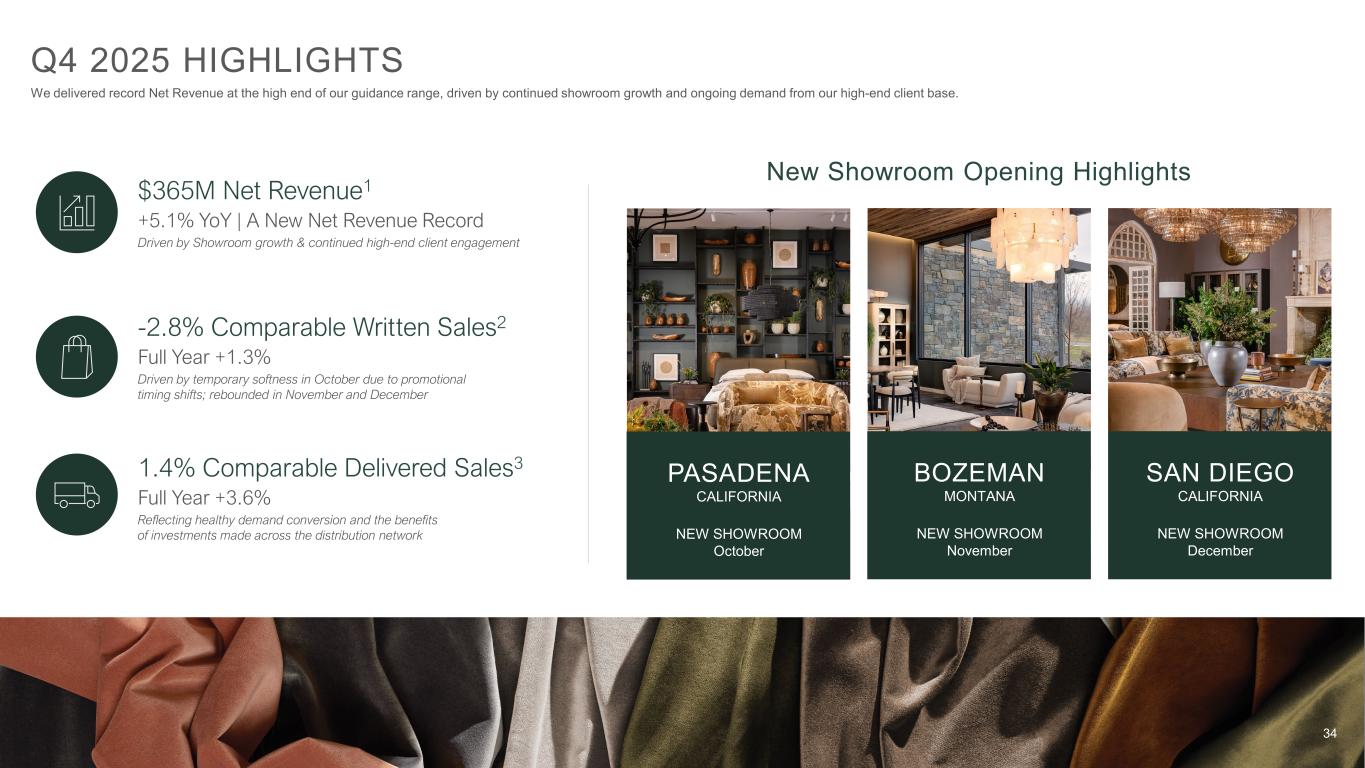
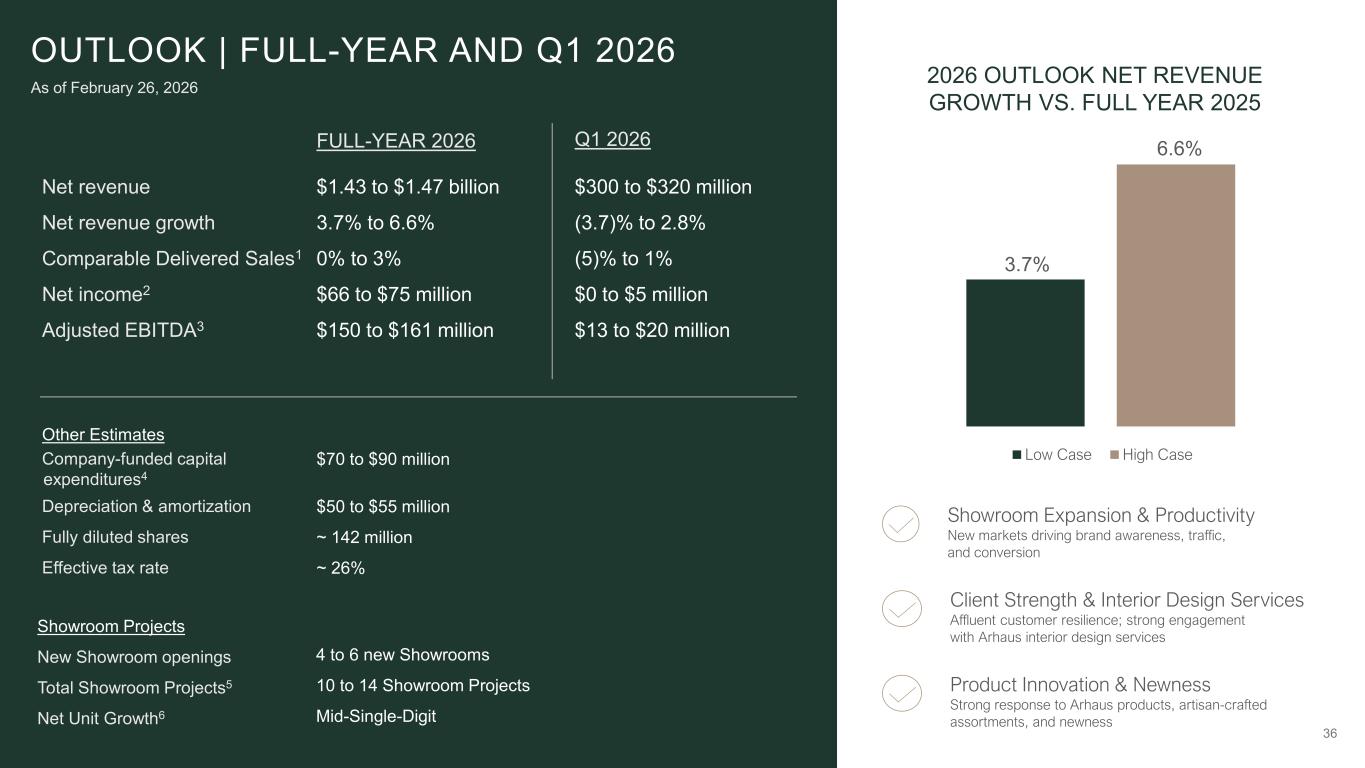
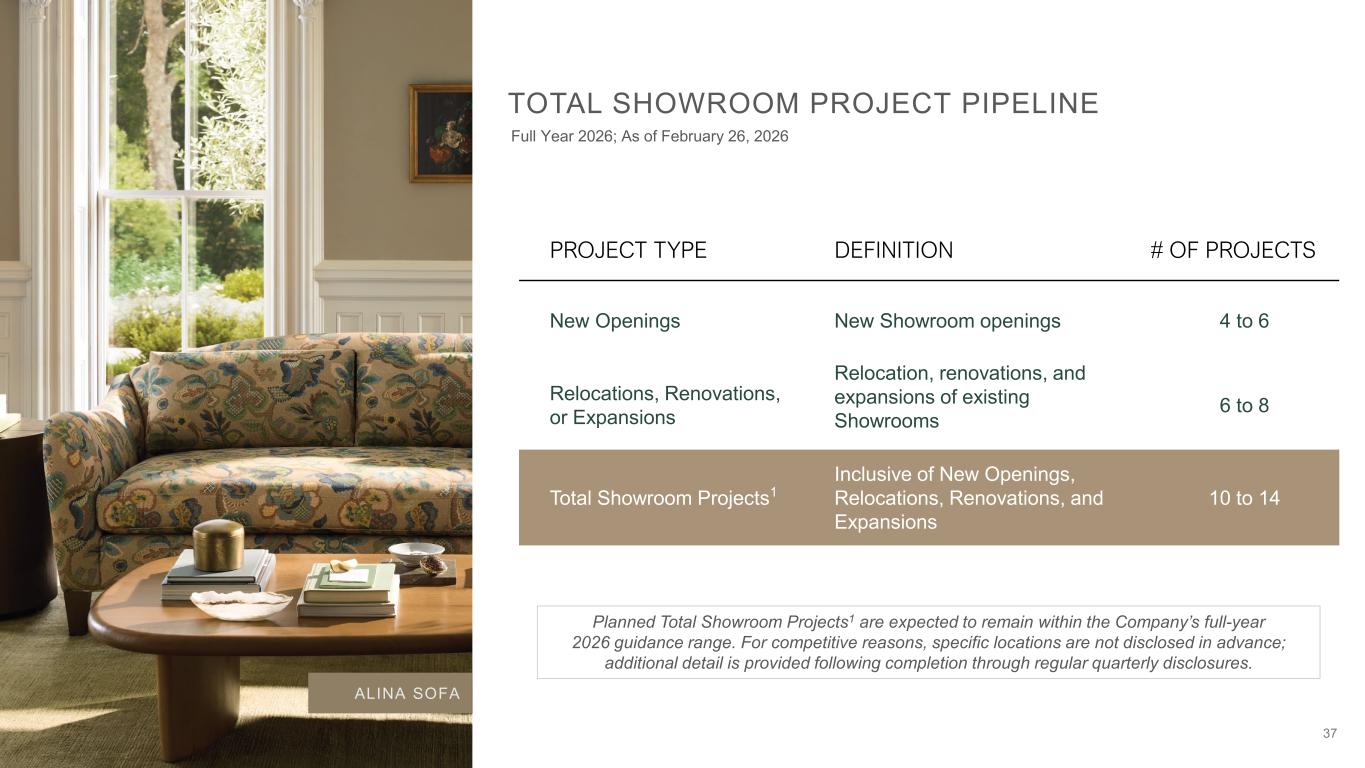
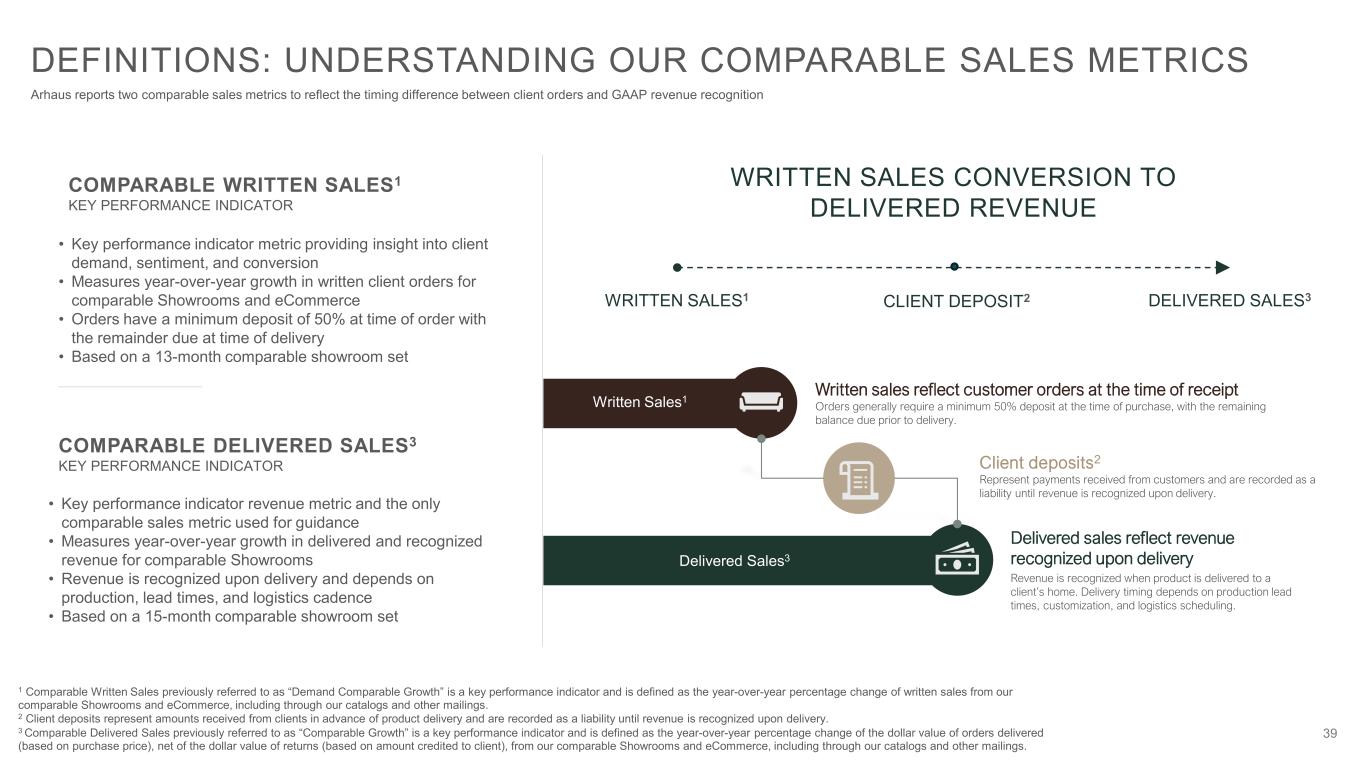
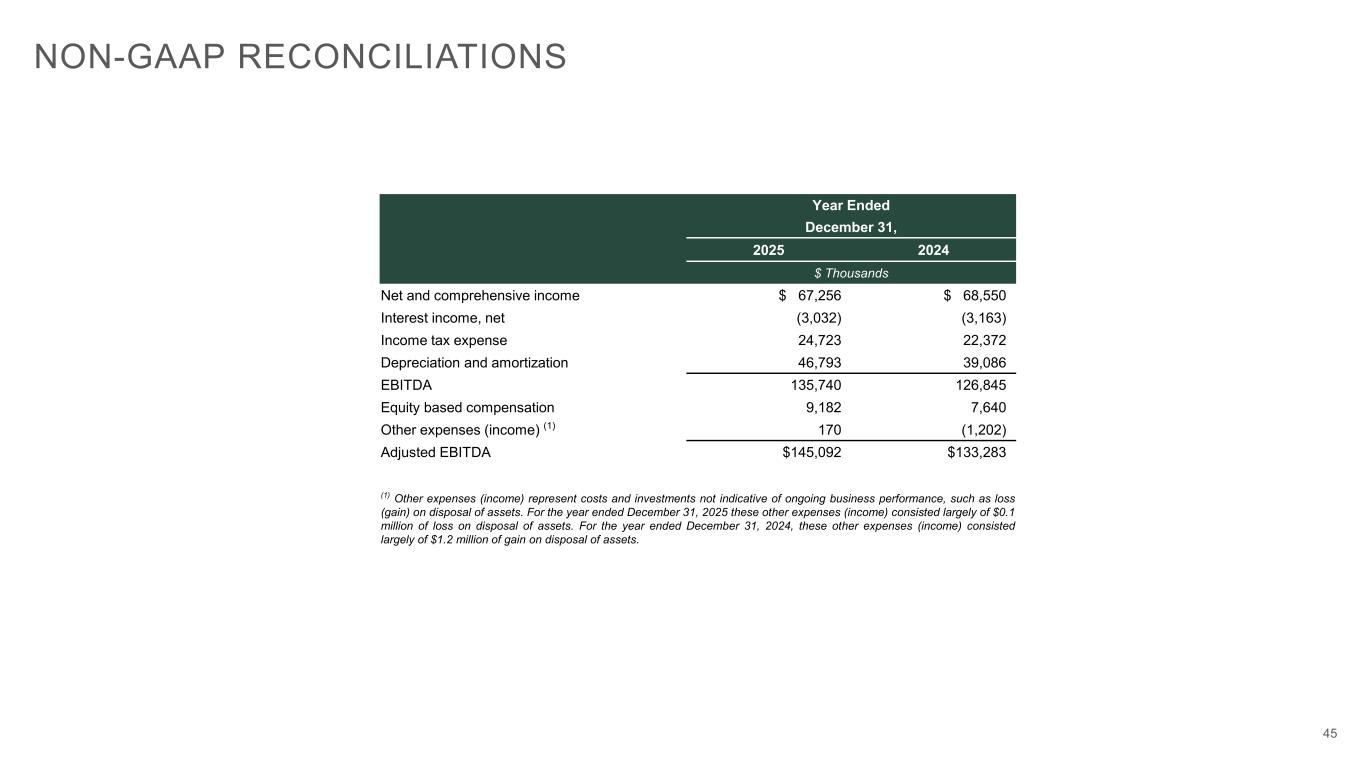
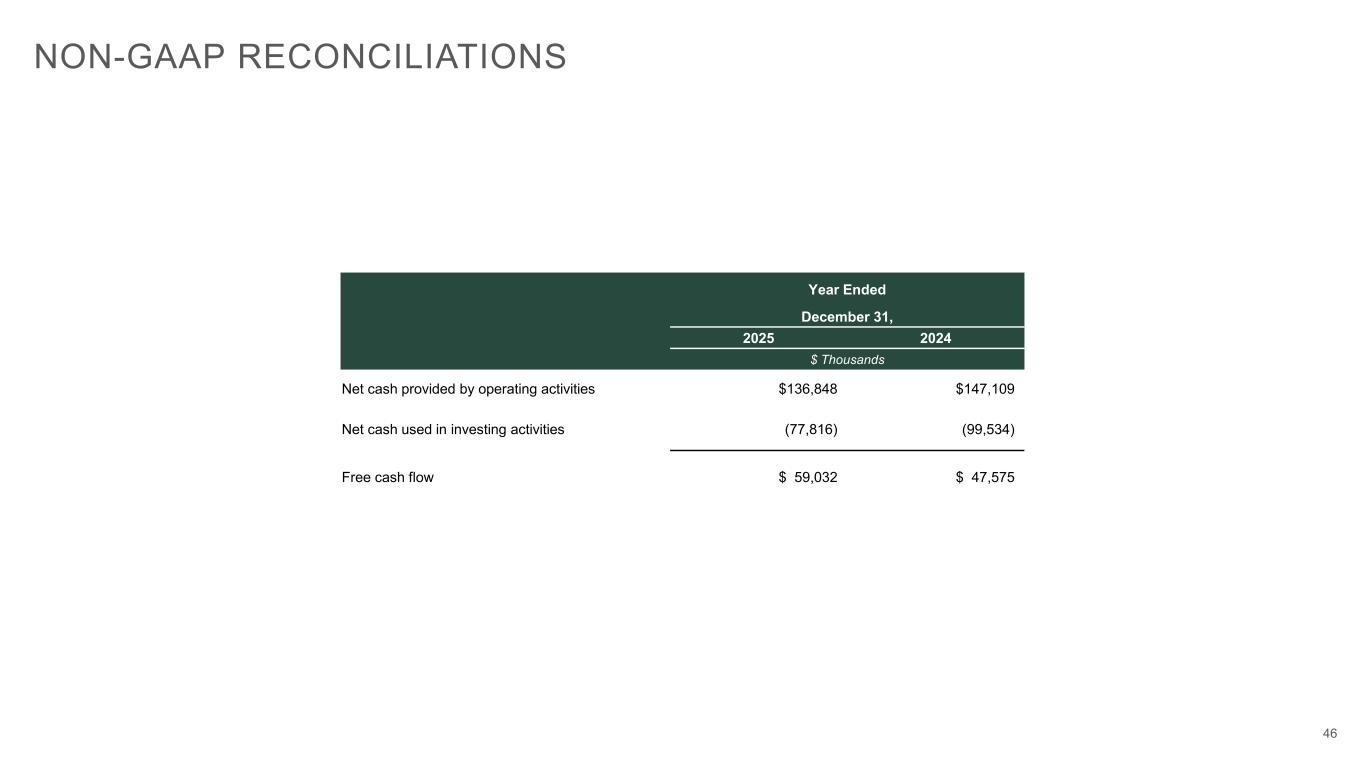
Thanks, John, and good morning, everyone. 2025 was a year of strong execution and continued progress against our long-term strategic priorities. Let me begin with the full year. In 2025, we delivered record net revenue of $1.38 billion, up 8.5% year-over-year, and at the high end of our guidance range. This record net revenue reflects the strength of our model and the continued effectiveness of our showroom growth strategy and differentiated product offerings. Gross profit was $536 million, up 7% versus last year, primarily driven by higher net revenue. Gross margin decreased 50 basis points to 38.9% of net revenue in 2025, primarily driven by higher showroom occupancy costs associated with our continued expansion. Selling, general, and administrative expenses increased 7.7% to $447 million. The increase was primarily driven by higher corporate expenses and strategic investments to support and drive the growth of the business, including supply chain, technology, and warehouse-related investments, as well as higher selling expenses related to new showrooms. SG&A load decreased 30 basis points to 32.4% of net revenue, reflecting a modest improvement in operating leverage. Net income was $67 million, a decrease of 1.9% versus last year. This decrease primarily reflects our showroom expansion and our continued investment in the business. Importantly, adjusted EBITDA was $145 million, an increase of 8.9% versus last year, and adjusted EBITDA margin was flat versus last year at 10.5%, demonstrating disciplined expense management and healthy operating performance as we invest for the long term. During the fourth quarter, we delivered net revenue of $365 million, up 5.1% year over year and at the high end of our guidance range. This performance reflects continued execution of our showroom growth strategy and the strength of our differentiated product offerings. Gross profit was $139 million, up 0.3% versus last year and gross margin was 38.1% down 190 basis points year over year. The decrease in gross margin was primarily driven by an increase in inventory reserves of 160 basis points related to obsolete inventory, higher showroom occupancy costs of 110 basis points associated with our continued expansion, and partially offset by improved delivery efficiencies of 100 basis points tied to our ongoing focus on productivity improvements. Selling general and administrative expenses increased 6.8% to $119 million. As a result, SG&A load increased approximately 50 basis points year over year, primarily attributed to strategic investments in technology. Additionally, in the quarter, we had higher selling expenses tied to new showrooms and higher corporate expenses to support scale. While net incoming Q4 decreased 29.1% to $15 million and adjusted EBITDA declined 15.1% to $35 million versus last year, it's important to note that this performance primarily reflects an increase in our inventory reserves related to obsolete inventory identified during the quarter, higher showroom occupancy costs associated with our continued expansion, and strategic investments in technology to support the growth of our business. As a reminder, we are in a reinvestment phase that we believe supports sustainable growth and long-term value creation, and as these investments mature, we expect them to improve operating leverage over time. Importantly, our outlook for 2026 contemplates continued revenue and profit growth while also funding these strategic investments. Turning to our comparable metrics, as part of our ongoing efforts to improve clarity, we are renaming our comparable metrics to more intuitively reflect how sales are generated and recognized. Additional details provided in our earnings release and investor relations presentation. Comparable written sales, previously referred to as demand comparable growth, increased 1.3% for the full year, reflecting the underlying health and resilience of our business. In the fourth quarter, comparable written sales declined 2.8%, primarily driven by temporary softness in October. October comps were down 14.8%, largely due to promotional timing shifts. In 2025, our semiannual sale concluded at the end of September, whereas in the prior year, it extended into early October. And this timing difference pulled written sales forward into September, creating a headwind in October. Importantly, written sales rebounded in November and December with comparable written sales up 2.3% and 2.6% respectively. On the delivered side, comparable delivered sales, previously referred to as comparable growth, was up 3.6% for the full year and 1.4% in the fourth quarter, reflecting healthy demand conversion and the benefits of investments we've made across our distribution network. work. Lastly, beginning in 2026, we will report comparable written sales on a quarterly and year-to-date basis and no longer report this metric on a monthly basis. Turning to our balance sheet and liquidity, as of December 31, 2025, cash and cash equivalents totaled $253 million, up 28.3% year over year, further enhancing our financial flexibility. We had net merchandising inventory of $339 million, up 14.1% year-over-year, and this increase primarily reflects incremental tariff impacts of $14 million, investments in best sellers and new product introductions, and inventory to support new showroom openings and relocations. Excluding the incremental tariff impact of $14 million, net merchandising inventory was up approximately 9.3% year-over-year, largely in line with our sales growth. Net operating cash flow was $137 million, and net cash used in investing activities was $78 million for the full year ended December 31, 2025. free cash flow defined as operating cash flow less net cash used in investing activities was 59 million for the year and given the strength of our free cash flow our board of directors declared a special cash dividend of 35 cents per share of outstanding common stock this marks the second time we have issued a special dividend since our IPO and reflects our disciplined capital allocation strategy, balancing investments in showroom growth, technology, and distribution infrastructure while returning excess capital to our shareholders. Importantly, following this distribution, we remain debt-free with substantial liquidity, which we believe will support our long-term growth strategy. As we enter 2026, we remain focused on driving profitable growth, maintaining financial strength, and delivering sustainable long-term value for our shareholders. Turning to showroom growth and real estate, we are enhancing our disclosures to provide clearer and more consistent insight into how showroom expansion drives long-term growth in returns. As part of this effort, we are introducing net unit growth as a standardized measure of showroom expansion while continuing to disclose total showroom projects inclusive of new showrooms, relocations, renovations, and expansions. In 2025, we completed 13 total showroom projects, including five new openings, seven relocations, and one renovation, consistent with our full-year guide. These actions resulted in net unit growth of 3.9% year-over-year, bringing our showroom count to 107 showroom locations at year-end. Looking ahead to 2026, we expect to complete approximately 10 to 14 total showroom projects in 2026, consisting of four to six new openings and six to eight relocations, renovations, or expansions. In addition, moving forward, we will consistently provide targets for the following. Our showroom maturity ramp, our targeted aggregate four-wall economics of maturity, as well as providing enhanced disclosures on our showroom maturity mix and expanding detail on revenue contribution of new showrooms. Importantly, these disclosures reflect enhanced presentation and clarity and do not represent any change to the underlying economics, strategy, or disciplined approach to showroom investment. Details are provided in our earnings release and our investor relations presentation. Turning to strategic investments. In 2025, we made meaningful progress across initiatives focused on modernizing our distribution network and our technology infrastructure. These investments are tightly aligned with our long-term strategy and are designed to improve operational efficiency, enhance our clients' experience, strengthen our internal controls, and support profitability over time. Starting with distribution, a key milestone in 2025 was our decision to bring distribution management of our Dallas facility in-house. This transition was executed successfully and ramped ahead of schedule. We also continued to evaluate opportunities to optimize our distribution footprint and processes with a focus on improving speed, reliability, and consistency across the network. Turning to technology. As shared last quarter, we are in the early stages of a multi-year digital transformation to replace our legacy finance and operations systems with a modern, fully integrated technology platform. As a reminder, the total program investment is approximately $30 million, including implementation, staffing, and licensing fees through 2030. We expect approximately $12 million of cash investment in 2026 and approximately $10 million of cash investment in 2027. Cash outflows will begin tapering in 2028 as we transition to a steady state run rate of roughly $2 million annually through 2030 for ongoing licensing and maintenance. We view our strategic investments as foundational to our next phase of growth, and we will continue to provide updates as we make progress. Moving to sourcing and tariffs. Trade policy remains fluid, particularly following the recent Supreme Court ruling related to certain global and country-specific tariffs. We are actively evaluating the implications. Given the evolving environment, we believe it is prudent to maintain a disciplined planning posture until there is greater clarity. But importantly, our diversified sourcing model and our domestic manufacturing positions us well across multiple policy scenarios. For 2025, incremental tariff impacts were partially offset through sourcing shifts, vendor negotiations, and pricing actions implemented in the fall, reflecting the flexibility of our sourcing model. In 2026, based on tariff policy following the Supreme Court ruling, we estimate tariff impacts to be in the range of $30 to $40 million. This tariff impact reflects some benefits from vendor negotiations and sourcing shifts and operational efficiencies. We will continue to assess pricing over the coming months and quarters and plan to respond quickly and thoughtfully as conditions evolve with the intention of protecting margins and providing value. Turning now to our outlook, we are providing full year 2026 and first quarter 2026 guidance. Our outlook reflects confidence in the resilience of our model and the embedded growth opportunity within our showrooms while maintaining a measured stance given the ongoing macro uncertainty. We believe this balanced approach appropriately reflects both the near-term environment and our long-term growth trajectory. For the full year, we expect net revenue between $1.43 billion and $1.47 billion for a year-over-year growth rate of plus 3.7% to plus 6.6%. Comparable delivered sales of flat to plus 3%, net income of $66 to $75 million, and adjusted EBITDA of $150 to $161 million. For the first quarter, 2026, we expect net revenue between $300 million and $320 million for a year-over-year growth rate of down 3.7% to plus 2.8%, comparable delivered sales of down 5% to plus 1%, and net income of $0 to $5 million and adjusted EBITDA of $13 million to $20 million. In closing, 2025 was a strong year of execution across our business, and as we look ahead, we continue to remain focused on executing our strategy to deliver profitable growth and long-term value creation, driving industry-leading top-line growth, navigating tariffs, protecting margins, improving profitability while continuing to transform our business through strategic investments that support scalable growth and long-term performance. We enter 2026 from a position of strength with a debt-free balance sheet, strong liquidity, and a proven ability to execute through varying market conditions. Thank you to our teams across the company for your creativity, your passion, and your execution, and to our shareholders for your continued confidence in our house. With that, I'll turn it over to the operator for questions.
Operator
Thank you. At this time, we will be conducting a question and answer session. If you would like to ask a question, please press star 1 on your telephone keypad. A confirmation tone will indicate your line is in the question queue. For participants using speaker equipment, it may be necessary to pick up your handset before pressing the star keys. One moment, please, as we poll for questions. Our first question is from Simeon Goodman with Morgan Stanley.
Good morning. This is Pedro Gill on for Simeon. Nice quarter. Thanks for taking our question. My first question is on guidance. You've guided a portfolio EBITDA margin leverage of about 20 basis points, which is remarkable given some of the still tariff headwinds and some of the strategic investment that you're undertaking. I'd be curious to know what are the key drivers of leverage going into next year? Is it coming more from rush margin? Is it ramping of the new showrooms? And also for the first quarter guidance, it's a bit weaker than the rest of the year, both in constant margin. Is there anything specific in the first quarter, perhaps some noise from the storms that you're seeing? And then I have a follow-up.
All right, great. Thanks, Pedro. Look, I would start with just a quick overview of our Q1 guide just to give you some perspective. You know, really three things that I would highlight. Number one, our Q1 guides really anchored on how we finished the year. We came in very strong on deliveries in December. And, you know, that obviously has a spillover impact into January, February as it relates to deliveries. But additionally, and more importantly, January did affect us in terms of weather. We saw some softness that we believe was really driven by the weather. We had a number of store closures during that January, early February time period, and that really led to low traffic during these peak winter events. I would say that we also had some delays on the issuance of our spring catalog mailing. It was isolated and it only affected certain markets, but we did have some production delays that I think further exacerbated the softness. So in response to that, we did issue some, you know, some incremental promotions in the month of February is somewhat of a remedy to get people back into stores and to re-engage. But we see the softness is, you know, demand deferred. John says it all the time. Clients are still engaged. You know, we're still confident in our full year guide. Our full-year guide really is anchored on growing the business between 3.7% and 6.6%, and that's with EBITDA growth of between 3.2% and 10.9%, and that's while supporting all of the strategic investments that we've highlighted previously. So Pedro, to get to the bottom of your question on the full year guide in terms of, you know, what the drags and drivers are, you know, generally we are looking to expand margins and we continue to push on delivery efficiencies and operating effectiveness, continuing to improve product mix. Every time we introduce newness, that's an opportunity to, you know, really further premiumize the portfolio and focus on margins. In terms of SG&A load during the year, we're not counting on a lot of deficiencies there, largely because we are funding some of the strategic investments. If you peeled that away and looked at it apples and apples, you would see some SG&A leverage. but we are funding these investments somewhat through the P&L, somewhat through the CapEx. When you look at fiscal 26, our guide on strategic investments for the digital enablements, $12 million in cash, around 30% to 40% of that will be P&L expense during the year. So that's something to keep in mind. Our marketing spend is growing in line with revenue. That's an area that we continue to, you know, remain very fluid on. As we, you know, see opportunities in the market, we will spend more. And then in other areas where there's softness, we'll pull back. But I would say that the marketing line on the P&L is very much in line with historical averages in terms of percentage of revenue. So those would be the big drivers and drags. And I would highlight that when you look at our business from an EBITDA margin perspective, our guide implies a range of 10.5% to 11%, with that low end being in line with where we ended fiscal 25, with the investments included in that. So we are showing, I think, improved operating margin resilience over time. We've just got to get through this investment phase over the next 12 to 24 months.
Okay, fantastic. Thank you, Michael. And then my second question is on tariffs and pricing. It's nice to see you making further progress in mitigating some of the tariff headwinds. You mentioned last quarter you had taken a bit of pricing, targeted selectively in October. You mentioned again on the call earlier today. So I'd be curious to know a little bit how much pricing was in effect throughout the fourth quarter and how you are thinking about price inflation into 2020.
Yeah, Peter, thanks for the question. I know it's top of mind. I just want to start off by taking a moment just to recognize the tremendous support from the entire extended Our House team over the past year as we've navigated through the tariff policies. And, you know, this goes all the way back to the beginning of our supply chain with our vendors and sourcing agents overseas, to our logistics and sales teams across the U.S., and to even our headquarter teams that have helped us to navigate through this very challenging year of continuous policy changes. But, you know, as it relates to tariffs itself, we've been clear on our objectives from day one, which is really to protect our margins, to maintain deep relationships with our suppliers, and to be nimble. And if you take a step back and think about that, like from a margin perspective, we're exiting this year with solid margin performance. Our largest headwind on gross margins for the year really was elevated occupancy costs related to our showroom expansion. And when you peel that away, I think we did a tremendous job of managing margins through this dynamic situation. So I would call that a win for our organization. And then looking at the suppliers, you know, we continue to invest in these relationships, either through speeding up new product development or figuring out how to streamline our ways of working. We're certainly collaborating, you know, with all of our suppliers, but particularly, you know, the top tier. And given some of our commercial highlights that John highlighted in his remarks, this wouldn't be possible without the vendor partners, you know, across the world continuing to support us through this dynamic situation. So I'd say that's also a win. But, you know, in the end, one of the things I'm most proud of in the organization for the past year is we have demonstrated incredible nimbleness. And it comes back to your question, Pedro. We've been very nimble through our price and promotions. We did take pricing in October. We haven't disclosed details around the quantum of that. But we did take some pricing in keeping with our goal of protecting margins. And we've also used promotions as another lever to protect margins and make sure that we're striking the right balance between top line growth and margin management. But as you think about the latest on tariffs, in my remarks, I talked about the latest development. That new range is down from what we quoted at our last call. The current high end of the range at 40 million is close to the low end of the old range. And just for absolute clarity, the high end of our current range is based on the ability of the administration to increase the global tariffs from the 10% to the 15%, which they haven't announced yet, but they could at any time. They have announced the 10%, which I'm sure all of you are keeping a close eye on, and that's what's really driving the bottom end of our range. But we don't see anything in the new tariff policy that would suggest a massive change to our current strategy. We think our strategy is working. We'll continue to be nimble, and things will ebb and flow, but we really do think it's Okay, great.
Thank you, Michael. That's helpful. Good luck.
All right. Thank you, Pedro.
Operator
Our next question is from Jonathan Medezuski with Jeffries.
Great. Good morning, and thanks for all the color this morning. One question and one follow-up. The first question, Michael, can you just add some more color on the reference to obsolete inventory, just any more context there, the rationale, and how you would assess the health of the inventory base after those actions? that's my first question. Thanks.
Yeah, sure. How are you doing, Jonathan? Look, as you guys know, I'm fairly new in this business and continuing to get up to speed every single day. We made a lot of investments in our warehouse management systems over the last couple of years, and that has provided us with increasingly beneficial insights into every SKU across our network. And we knew coming into Q4 that we had some areas in inventory that were, you know, really on the border of being sellable through our clearance centers versus really just being obsolete. And given our strategy with the clearance centers, we made the business decision to really take the loss and move on and focus our clearance centers on other items. So that's what drove the Q4 impairment callout. When you look at overall inventory, and businesses like this, you always have challenges, right? You never have enough of what you want. You always have a little bit too much of what you don't want. But when we look at the overall health of our inventory, we're in quite a good spot. When you look at it almost on every measure, whether it's inventory turnover or inventory as a percentage of sales. We continue to work on further improving the health of inventory, but overall, you know, we're in, you know, pretty good shape. You know, ultimately, our job is to make sure that, you know, we're marking that inventory at its lower cost of market, that we're, you know, keeping our inventory valuation in line with, you know, net realizable value, making sure that we have a good handle on shrink. And I can tell you that as part of all our focus on SOPS controls and operating controls across the company, we've never had a better handle on inventory than we do today. And it's really through the work of, you know, dozens and dozens of people across the organization, whether it's how we do physical inventories at the end of the year or how we're doing cycle counts and how we're monitoring skew velocity and things like that. We're better than we've ever been. So, as CFO here with my first 10K just going out the door, you know, I'm very comfortable with where we are. That being said, we can always do better, and our goal is to continue to optimize. In terms of the rest of the noise in the Q4 margin, hopefully it's clear, but occupancy played a role there, just year-over-year increased occupancy costs, and that's really just a function of our showroom pipeline as they start to ramp, and we've highlighted in our remarks our expectations for the upcoming year in terms of pipeline. You know, in terms of, you know, thinking through some of the big headwinds and tailwinds for next year as you think about gross margin and modeling, I would offer, you know, just a few things to think about because I know you guys are all looking at your models and what expectations are for next year. I do expect us to continue to improve efficiencies from a delivery perspective next year. You know, some of this is driven just through economies of scale that we get, and some of this is through some of the technology investments that we're making. I would point you back to one of the deliverables in our digital transformation is the transportation management system that we're rolling out here in a few months, and that's going to give us lots of opportunity to drive savings across our network from a freight and transportation perspective. So I think there's 60 to 70 basis points of margin improvement year over year as a result of those transportation costs and efficiencies. I do see continued improvement in our product margin, looking just at product cost. And that's a function of continuing to premiumize the portfolio. John's talked about how much newness that we have in the market. And every time we introduce new SKUs, we're looking at ways to further enhance margins. So that's a big opportunity for us. We think there's 30 to 40 basis points of opportunity in our margin from that. And then, you know, I would say that, you know, even though we don't guide on margin itself, you know, I would factor in 30 to 40 basis points of headwind for the continued build out of showrooms and just the occupancy costs that come along with that. But if you sort of put that all together and net it out, you know, we are counting on some modest margin improvement for the upcoming year.
That's really helpful. And then a quick follow-up just on trade, you know, it seems like a major growth platform for 26. You're stepping on the gas here. So what's embedded in the total sales guide for, you know, your efforts there and how how will the new trade program incentivize external designers to devote more of their clients' budgets to our house going forward? Thank you.
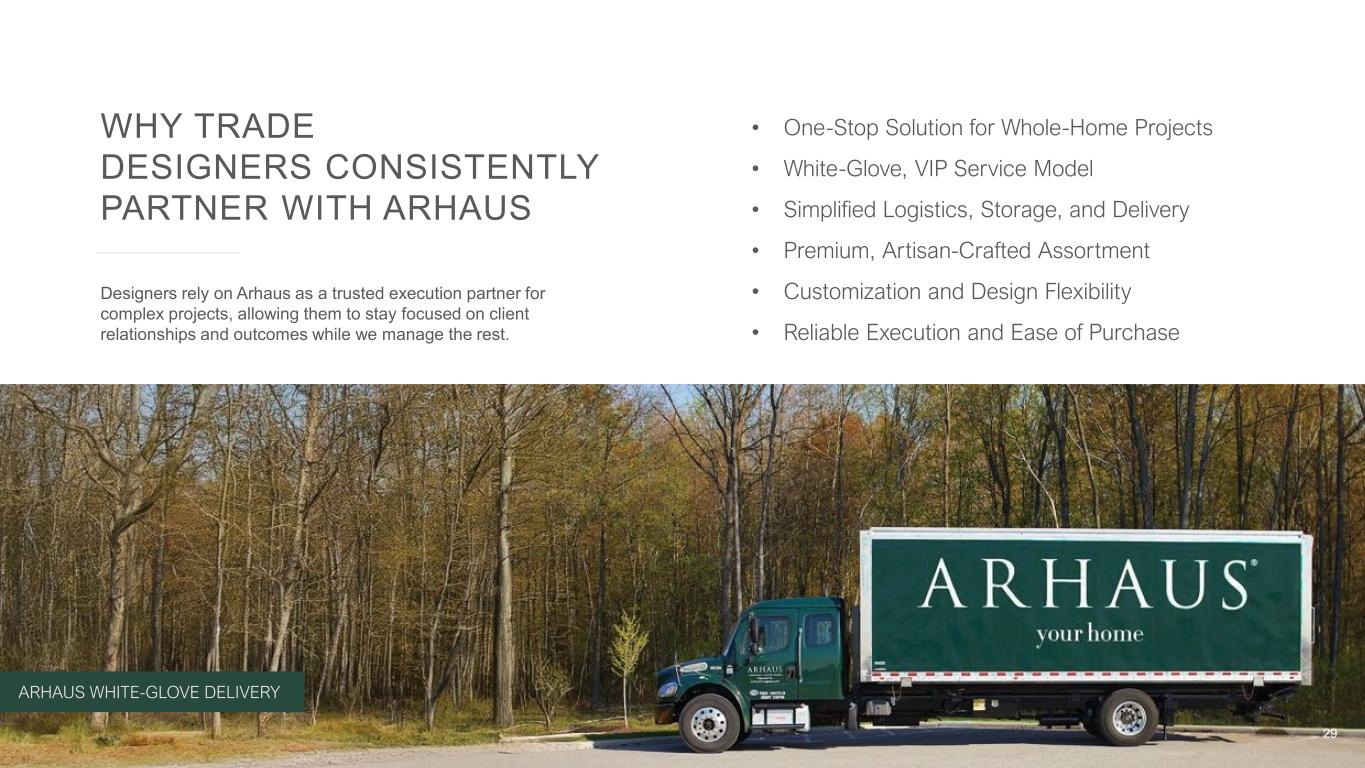
Sure. Yeah, the trade business is one that, as you all know, we're focusing on to grow. It's a massive business. I don't know how many billions of dollars it is, There's $27 billion out there in the United States. And, you know, our customer is a luxury customer. When they are redoing a room or a home or moving, they want help. And we have our own interior designers, which have done an incredible job and have been growing like crazy. but there's also the exterior trade folks who have their own businesses who need a place to shop for furniture. And what's so great about us is it's kind of a one-stop shop for them. Instead of them having to go somewhere to buy the lamp, somewhere else to buy the rug, somewhere else to buy the sofa, somewhere else to buy the coffee table, somewhere else to buy the prints, we can do it all for them, and we do all the service for them as well. So we know we're in the right area here, and as we're changing, adjusting, you know, how we're compensating them and so forth, we're really going after building a new team. We think this is a big growth area. We shall see how much it grows, but we know it's going to grow, and we're going to be very successful at it. we've already proven that. And we have a lot of trade members who just love working with us and adding more literally every day.
Operator
Our next question is from Steve Forbes with Guggenheim.
Good morning, everyone. John, I wanted to talk about the real estate strategy here. So this is sort of a two-part first question here. One, given the recent opening of the 40,000 square foot in store in Pasadena, California. I'm curious if the development of that gallery has changed your perspective around the most ideal showroom size. And if you could sort of maybe talk through, you know, what, you know, what, if any, learnings you sort of are looking to gather, right, from operating a bigger box like that.
Yeah. Yeah, Steve, you know, that box was what it was. It was an old Sacksteth Avenue, and it was that size. It wasn't, you know, our ideal size from a, you know, standard box location. But we were able to do a lot of fun things in there that we've never been able to do before. So we're testing a heck out of it. It's rather new. Response has been phenomenal so far. but you know we've been able to put in more design centers more little offices for designers to work out of we're able to display a lot of our decor and accessories in a much much bigger way than we did we were able to put in a lot more really edgy furniture test you know sectionals with large patterns on them, things like that that we had never done before. And then that same sectional, which certainly is the best seller for us, will duplicate in a more neutral fabric somewhere else on the floor. So we're learning a lot. We have no strategy to go to only 40,000 square foot stores in the future, but more to come on that. It's been fun to learn. The whole team's been out there going through what's working, what isn't. And so, yeah, it's working well. And then, you know, we've opened up smaller stores as well that have been doing well. We did one, a little store in Bozeman, Montana, which is, you know, 100,000 people just killing it there. And that store, I think, is 14,000 square feet. So, again, we're so flexible. And depending on the markets, you know, we can go from 14,000 to 40,000, and they all work, and they're all profitable. So we love our model. It's not just here's your standard box that has to be this big sort of thing. And so we're learning a lot from both ends, the smaller size and the large ones.
That's good to hear. And then just a quick follow-up for Mike. If we back out the inventory reserve, 160 basis points in the fourth quarter, fourth quarter gross margin I think exceeded expectations and improved pretty nicely sequentially. You gave us a nice sort of building blocks for next year. It seems like you're expecting further gross margin expansion. But maybe we could just focus on the fourth quarter. Like, what happened in the fourth quarter that allowed you to outperform on gross? At the core?
Yeah, I think the – yep, yep. No, that's clear. Look, I would come back to some of the fundamentals in the business. AOV continues to improve. When you break down AOV, both price mix improved as well as units per transaction, I see a lot of that ties into the trade channel focus and the interior designer focus and really partnering with clients that are doing home refreshes and remodels, and that continues to drive bigger and bigger transactions. When you look at Q4, we also saw, you know, strong contributions from upholstery and decor, which tend to be margin accretive to the P&L. And SPO, special order, was also quite strong during the quarter. So just, you know, a lot of things firing on all cylinders in that regard. And I think it's, you know, really what's the underpinning behind our 2026 guide as well as the investments that we're making to really build out this trade channel. because it's just a massive opportunity for us.
Operator
Our next question is from Seth Stigman with Barclays.
Hey, good morning, everyone. Nice progress. I wanted to ask about written sales, which were up over 1% over the last 12 months. I think November and December exited better than that. So the question is, do you think you're starting to see an inflection in the business? And how are you thinking about demand and written sales for 26 embedded in the Outlook?
Yeah, I can kind of start a big picture. You know, as always, our clients buy from us because we have unique product, incredibly quality, credible design, and a very, very reasonable price for what it is. And we have innovated more in the last six, eight months than we've ever done. So I am just thrilled with the new product rolling out. It's such a fun time in the business right now because customers' tastes are changing. It came out of COVID. Everything was kind of monotone. First of all, everything was gray, kind of plain, simple, and things have gotten much warmer. Warmer woods, more character in the woods, prints, fringes, and it's just an amazing time right now. So the folks that are on top of the trends are going to win. And I know we are on top of the trends more than anybody. I haven't seen anybody roll out anything anywhere close to what we're doing. So, you know, we're going to win. So we're very bullish on business because our product is unbelievable. And it's going to be getting better and better as the year goes up. Mike, do you want to add anything to that question?
No, I think that was comprehensive. And so the only thing I would say is the softness in January clouds the picture a little bit just from some of that softness. But, you know, we are we are pretty confident in our full year guide. I completely echo John's remarks around the momentum that we're building in the business. Is this is this a hard reflection point or not? Hard to say, but it certainly feels like we're building momentum.
Right. OK, that's very helpful.
And then my follow-up is around the long-term outlook for a low double-digit EBITDA growth. So 2025, EBITDA was up 9%. This year, you're guiding 3% to 11%. So the high end does capture that. But to get to that run rate consistently, is it really just a matter of sales growth accelerating, or how are you thinking about those other margin levers that could kick How do we think about the timing of some of those unlocks?
Yeah, it's a good question. And, you know, the way we're thinking about it is over the next five years, we do see leverage coming from a couple areas in the P&L, namely SG&A costs, where we've struggled to get significant economies of scale as we've grown because of the digital platform that we're operating with today. And this is one of the biggest pillars in the digital transformation when we think about the ROI is, you know, we should be able to grow this company in, you know, mid single digit top line growth and get economies of scale and leverage out of our SG&A. And that's a big part of our business case is improving SG&A load over time. I think we said in our last quarter that, you know, in the wake of this digital transformation, with the leverage that we put out there, that should be worth $10 million a year to the P&L. We also think there's tremendous opportunity in our distribution network over time as we continue to achieve economies of scale and really thinking about and even reinventing in some regards how we get to our customers that you, you know, things that you can do at a larger scale that you can't do necessarily when you're still an early growth company. So we've built in some expectations. We have a roadmap around these initiatives, but I think some of it's the transportation management system and getting economies of scale there. It's continuing to evolve our footprint to get closer to the customer and further optimize transportation costs and is continuing to improve inventory turns to make sure that we're operating with the right square footage across the system. But we see margins over time creeping into the, you know, mid-40s, but 42, 43% range, coupled with some SG&A leverage. This business should be operating at, you know, So 16%, 17%, 18% EBITDA margin versus where we are today. So that's the thing that I'm on the hook to deliver is how do we deliver the growth we're talking about over the next four to five years, but also have flow through to the point where we can deliver what we would view to be competitive margins in this space from an EBITDA margin perspective. So that 16%, 17%, 18% target is really out there for us to go and get.
Operator
Great. Thank you. Ladies and gentlemen, we have reached the end of the question and answer session. Now we turn the call back over to Tara Atwood for closing comments.
Thanks, everyone, for your participation on our call and interest in our house. Have a great day.
Operator
Take care. Thank you. This concludes today's conference. You may dissect your lines at this time. Have a wonderful day.