Operator
Good morning. My name is Rob and I will be your conference operator today. At this time, I would like to welcome everyone to the AdCorp's third quarter fiscal year 2025 earnings conference call. All lines have been placed in a listen-only mode. After the speaker's remarks, there will be a question and answer session. If you would like to ask a question during this time, simply press star followed by the number 1 on your telephone keypad. If you would like to withdraw your question, again, press star 1. As a reminder, this conference is being recorded. Thank you. I would now like to turn the conference over to your host, Matt Klein, Vice President of Treasury and Investor Relations. Thank you. You may begin.
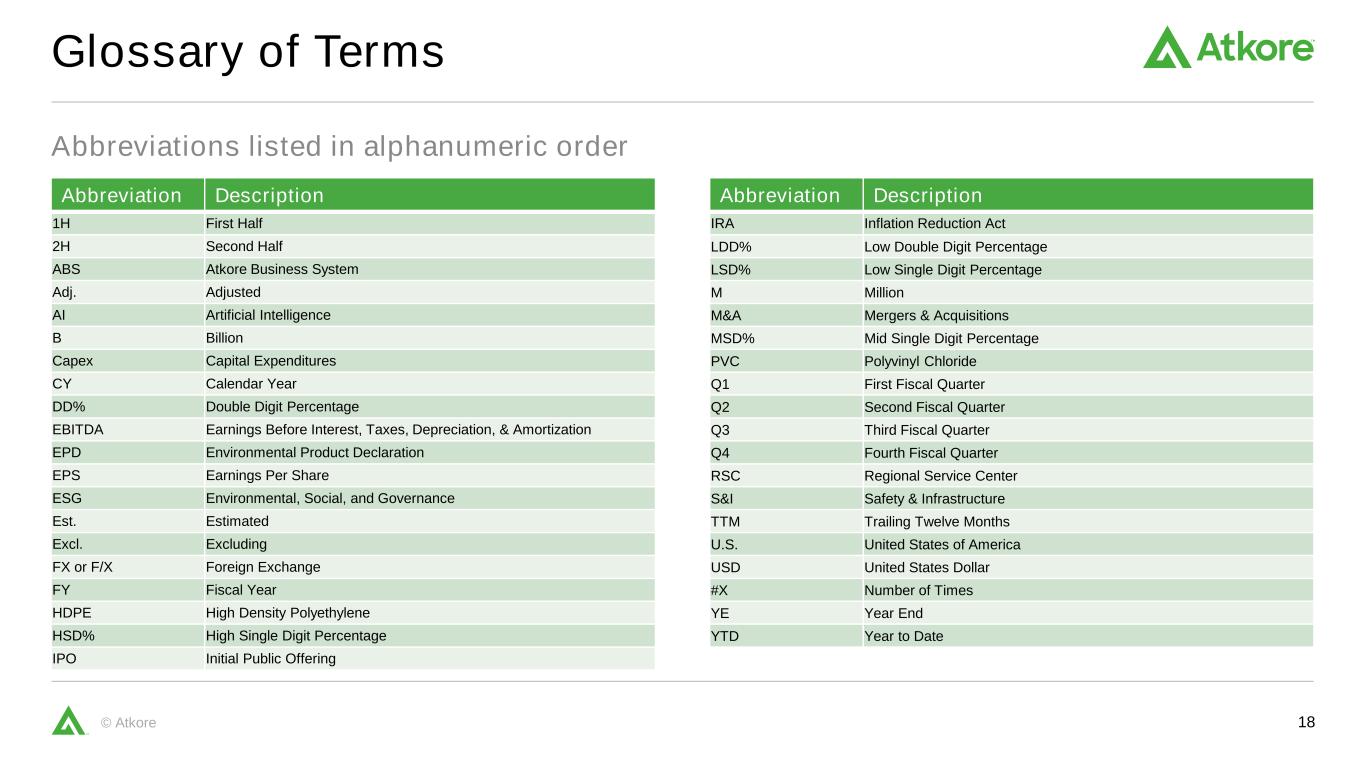
Thank you and good morning everyone. I'm joined today by Bill Walsh, President and CEO, John Deitzer, Chief Financial Officer, and John Pergenzer, Chief Operating Officer and President of Electrical. We will take questions at the conclusion of the call. I would like to remind everyone that during this call, we may make projections or forward-looking statements regarding future events or from financial performance of the company. Such statements involve risks and uncertainties, such that actual results may differ materially. Please refer to our SEC filings and today's press releases which identify important factors that could cause actual results to differ materially from those contained in our projections or forward-looking statements. In addition, any reference in our discussion today to EBITDA means adjusted EBITDA, and any reference to EPS or adjusted EPS means adjusted diluted earnings per share. Adjusted EBITDA and adjusted diluted earnings per share are non-GAAP measures. Reconciliations of non-GAAP measures and a presentation of the most comparable GAAP measures are available in the appendix to today's presentation. With that, I'll turn it over to Bill.
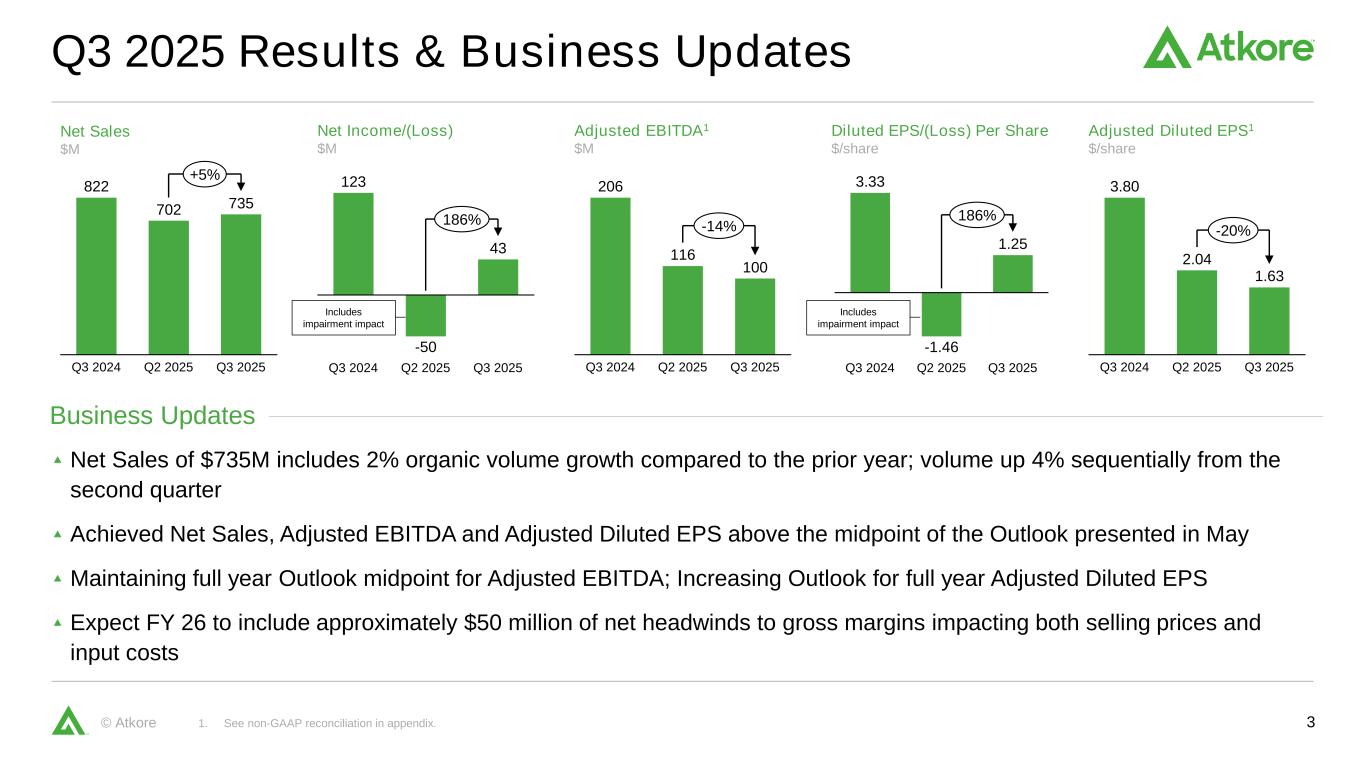
Thanks, Matt, and good morning everyone. Thank you for joining us today for our fiscal 2025 third quarter earnings call. Before I address our third quarter results, I want to discuss the announcement made earlier today. I've informed the board of my decision to retire from ACOR. After much reflection, I know that now is the time to start a new phase of my life with my family. I've had the privilege of spending 12 years with ACOR, including seven as CEO, as part of a 40-year career. I'm proud of all the accomplishments the team has achieved. Although the work is never fully complete, it is time for the board to engage their succession planning process. The board supports me in this decision. I am focused on a seamless transition and plan to lead ACOR in my current role until a successor is appointed. Our strength as a company has always come from our strategy, process, and most importantly, our people, and that will not change. Our at-court business system is about the team, and I have the utmost confidence in what our teams can achieve going forward. While we are making this announcement today, I am committed as ever to our strategy, our nearly 5,600 employees, and our shareholders until the next CEO is appointed. With that, I'll turn to our third quarter results, starting on slide three. We delivered strong performance in the quarter, achieving net sales, adjusted EBITDA, and adjusted EPS toward the top end of the ranges we presented in May. Our net sales of $735 million included 2% organic volume growth. Beyond our volume growth, results were supported by continued productivity gains, particularly in our S&I segment. Year-over-year declines in average selling prices were in line with our expectations, and we are pleased to see a second consecutive quarter of sequential pricing improvement in our steel conduit products. As we started our third quarter this past April, we were just beginning to operate in a new tariff environment. Over the last 90 days, the environment has continued to evolve with multiple modifications to initial tariffs and the introduction of new ones. Notably, imported steel conduit and PVC conduit volumes have both declined year over year in the third quarter compared to the prior year. As we started the third quarter, the Dodge Momentum Index indicated a slowdown in planning activity across several non-residential categories. Since then, construction sentiment has been mixed. We've observed pockets of strength in certain verticals, while other key sectors have been more subdued. Tariffs are influencing not just input costs, but also market pricing dynamics and broader demand patterns. Taking all this into account, we are maintaining our full-year adjusted EBITDA midpoint of $400 million and are raising the midpoint of our adjusted EPS to $6.50, reflecting improved visibility and stronger earnings leverage. Looking ahead to FY26, Sixth, we continue to refine our estimates. We anticipate several headwinds, some of which have been previously communicated, such as the expected year-over-year impact from lower selling prices. Others, like the broader tariff effects, which have both direct and indirect elements, have emerged more recently and introduced greater complexity. We expect these pressures to persist into next year, and we are actively evaluating various levers to help mitigate their impact. In closing, I want to thank our teams across the organization for their continued execution and discipline. Their dedication to the ACBOR business system remains central to how we deliver value to our customers and shareholders. With that, I'll turn the call over to John Deitzer to talk through the results from the quarter and our full year outlook.
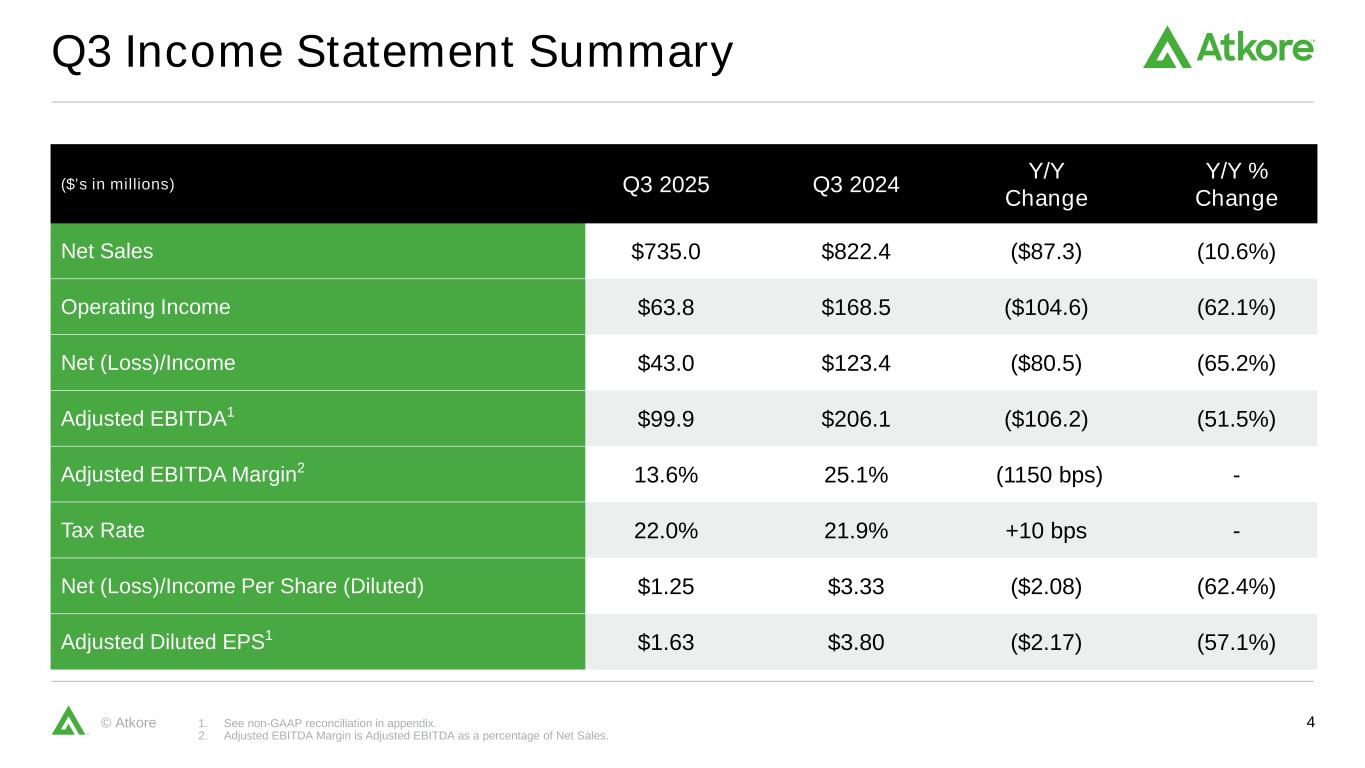
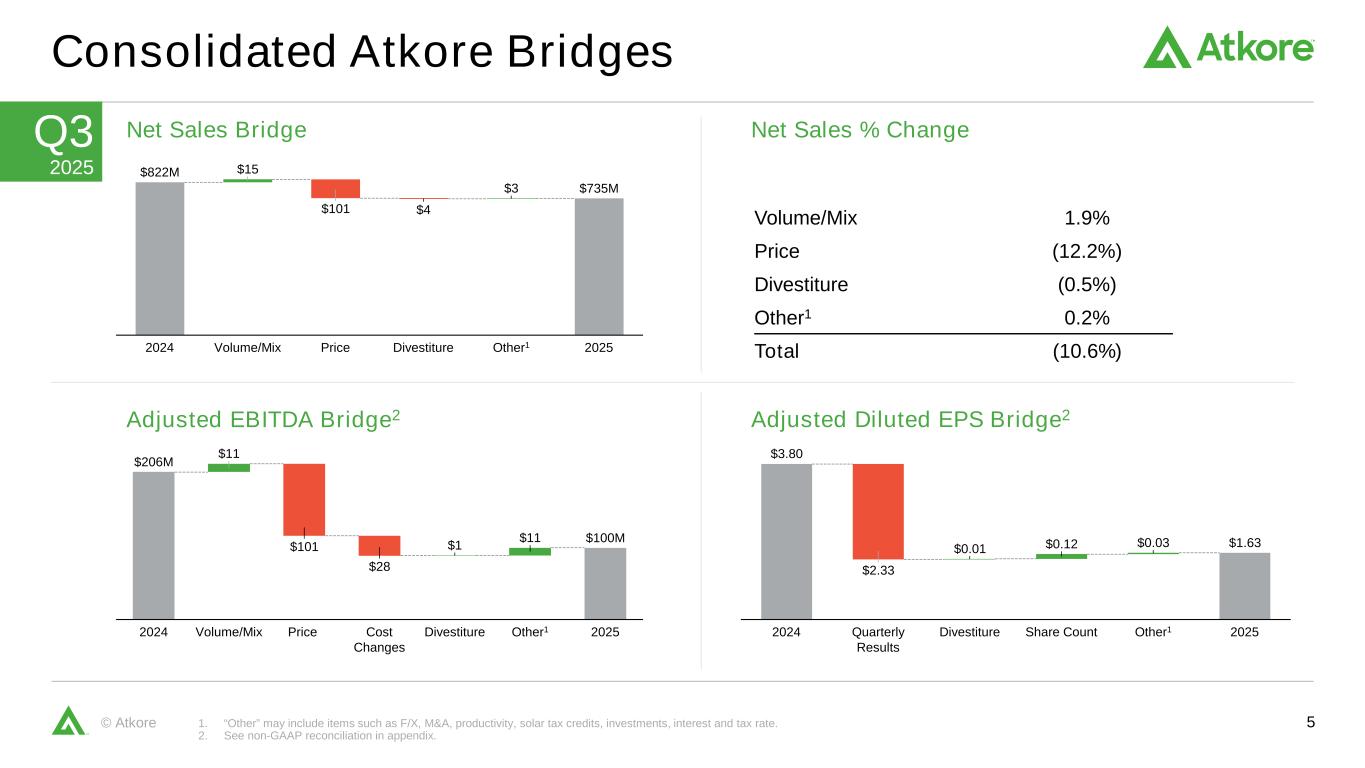
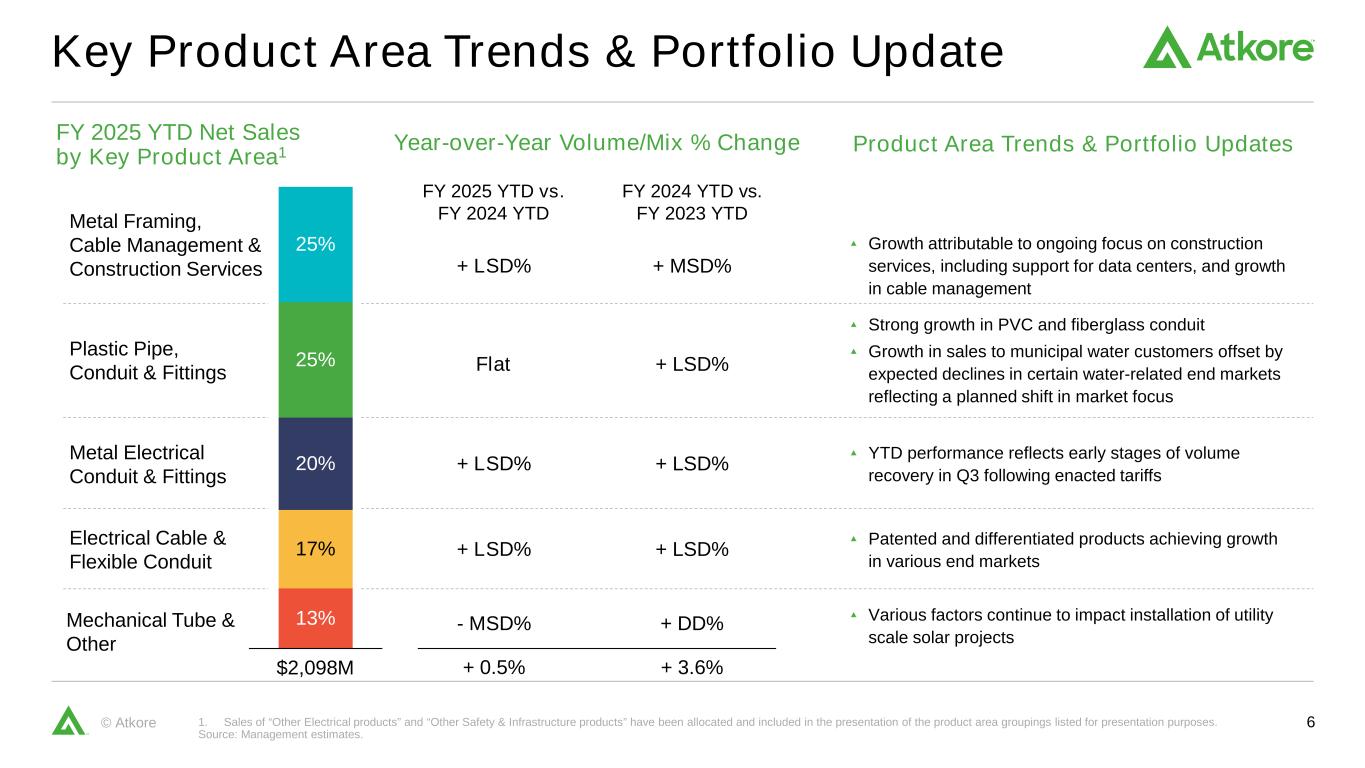
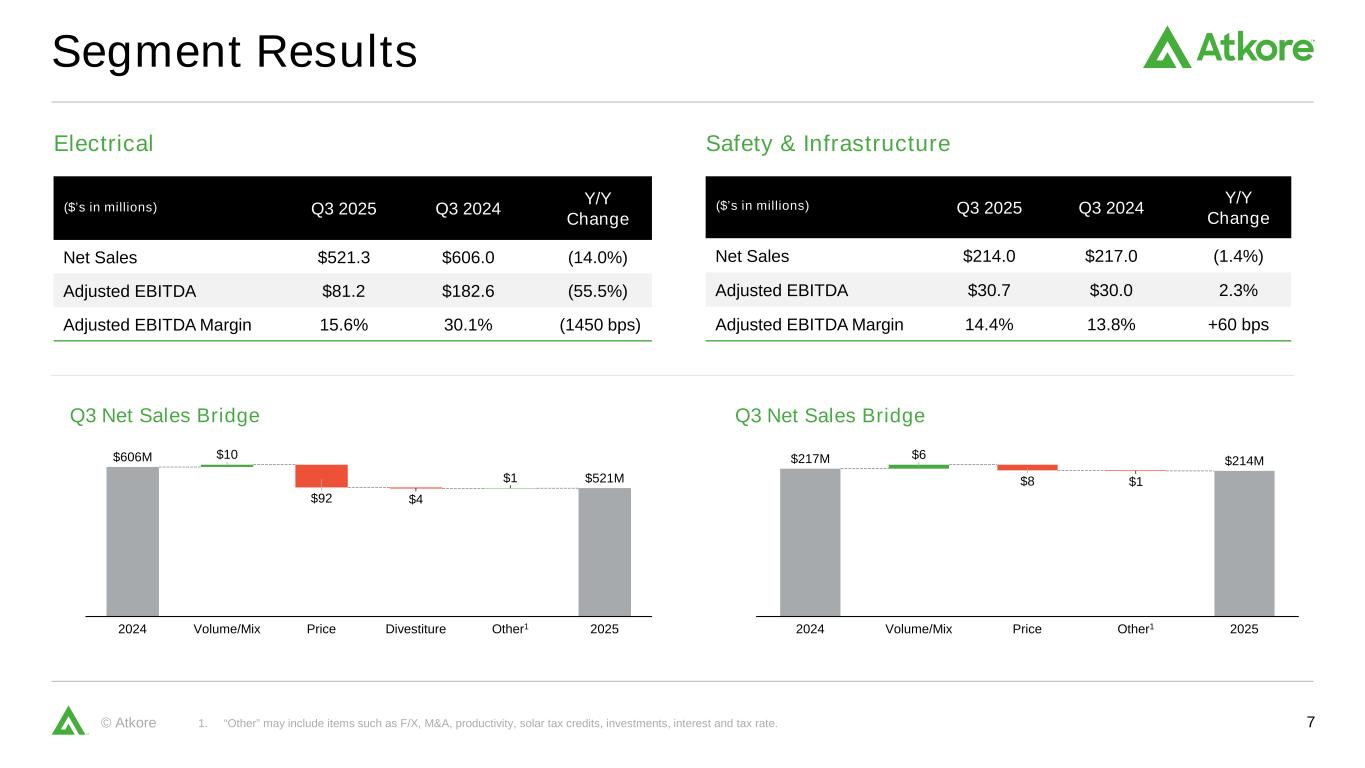
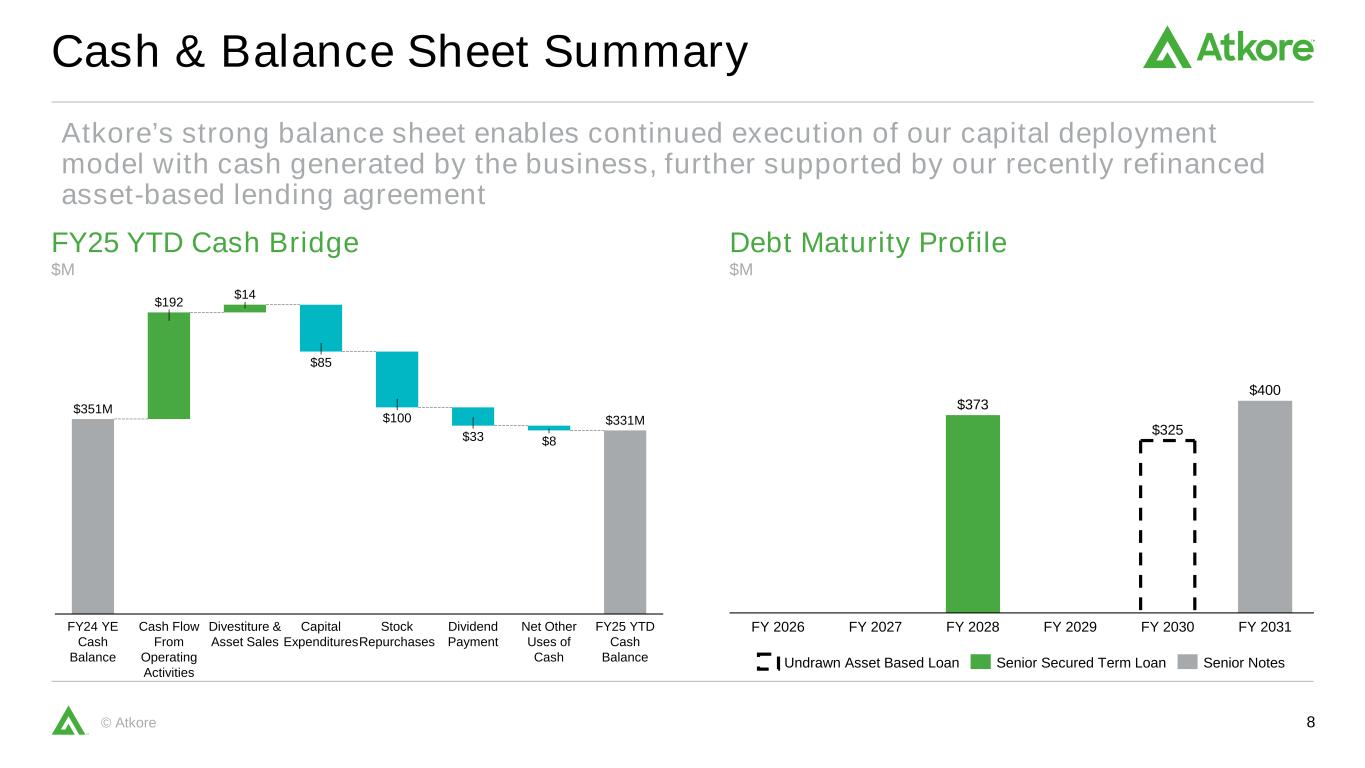
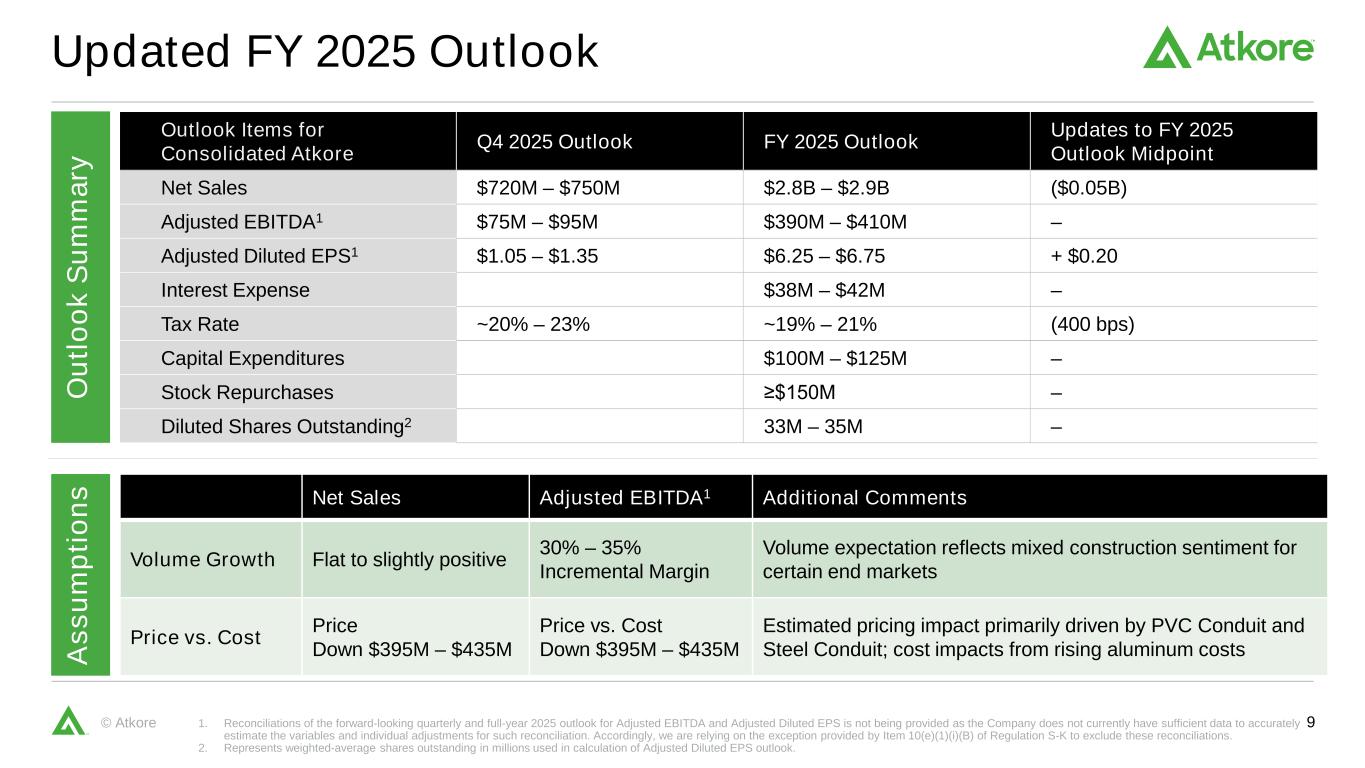
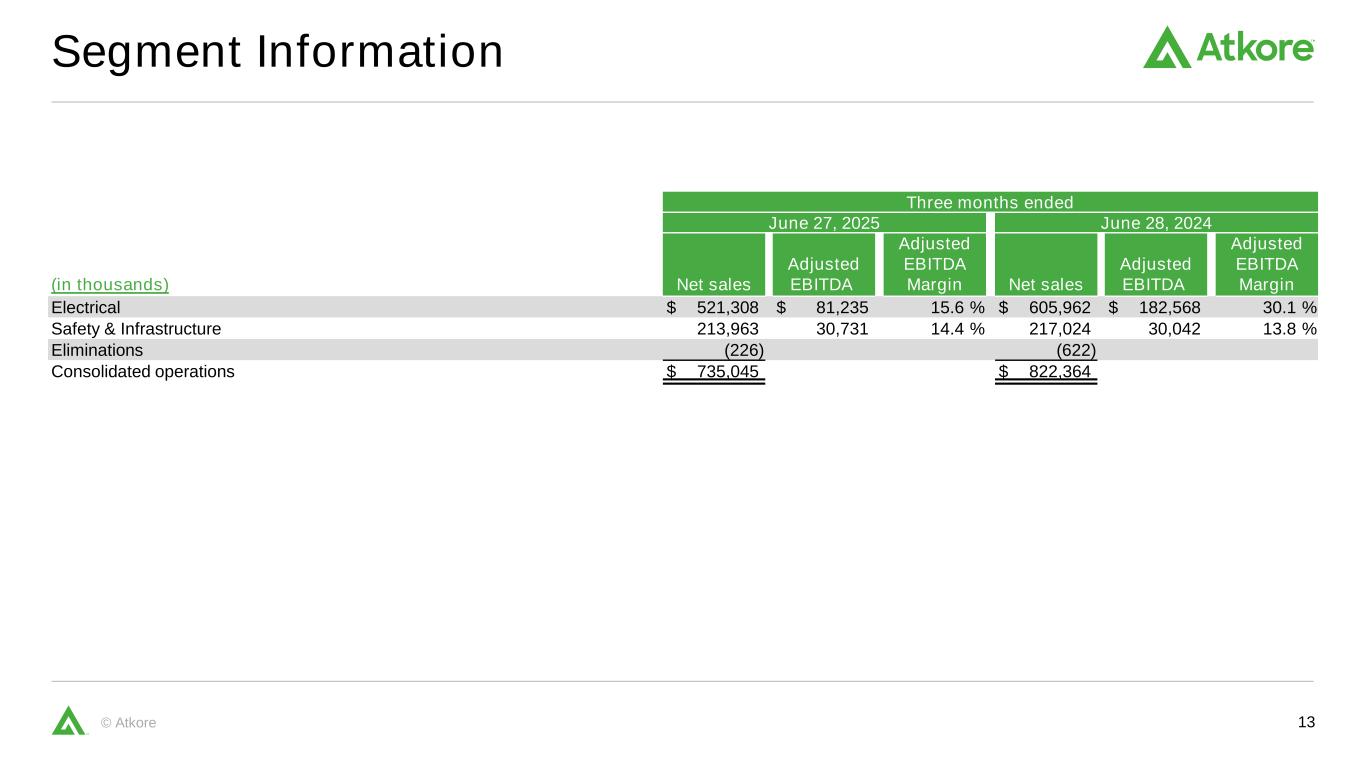
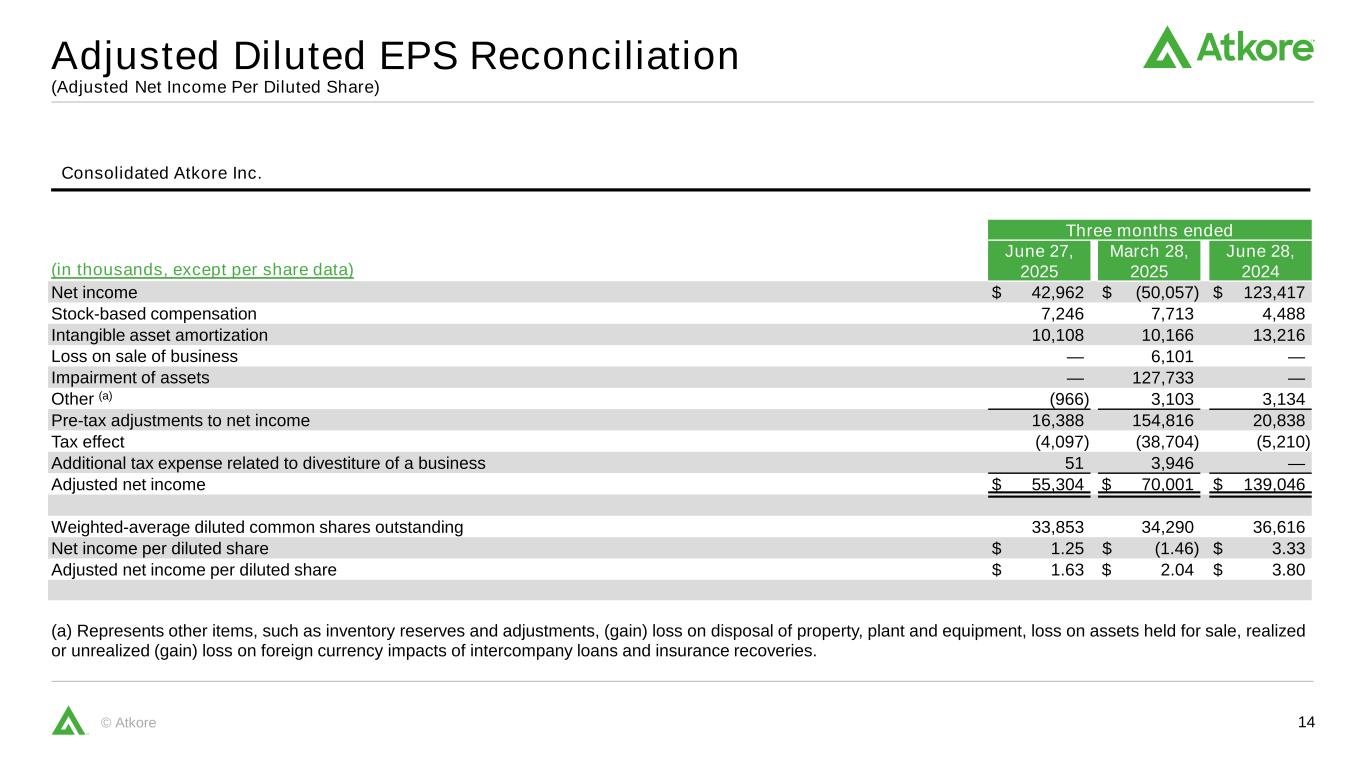
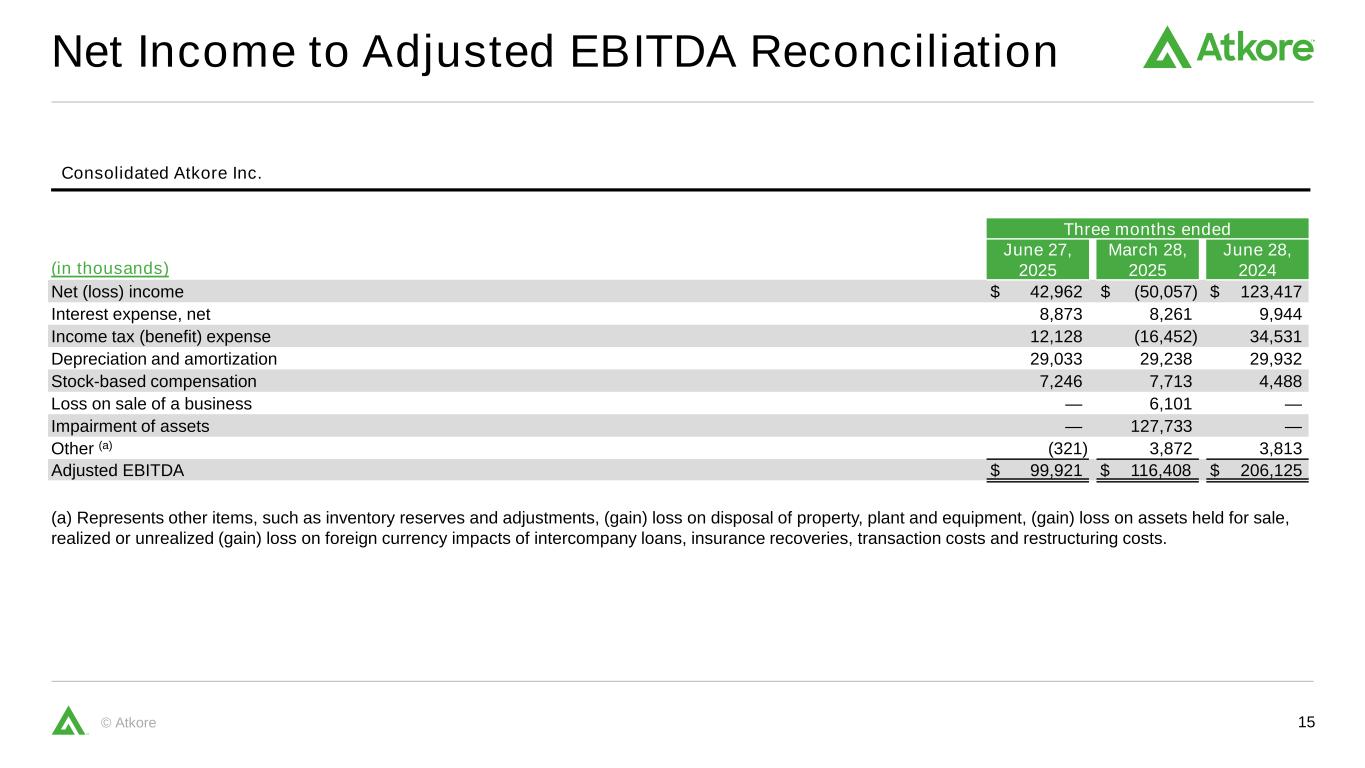
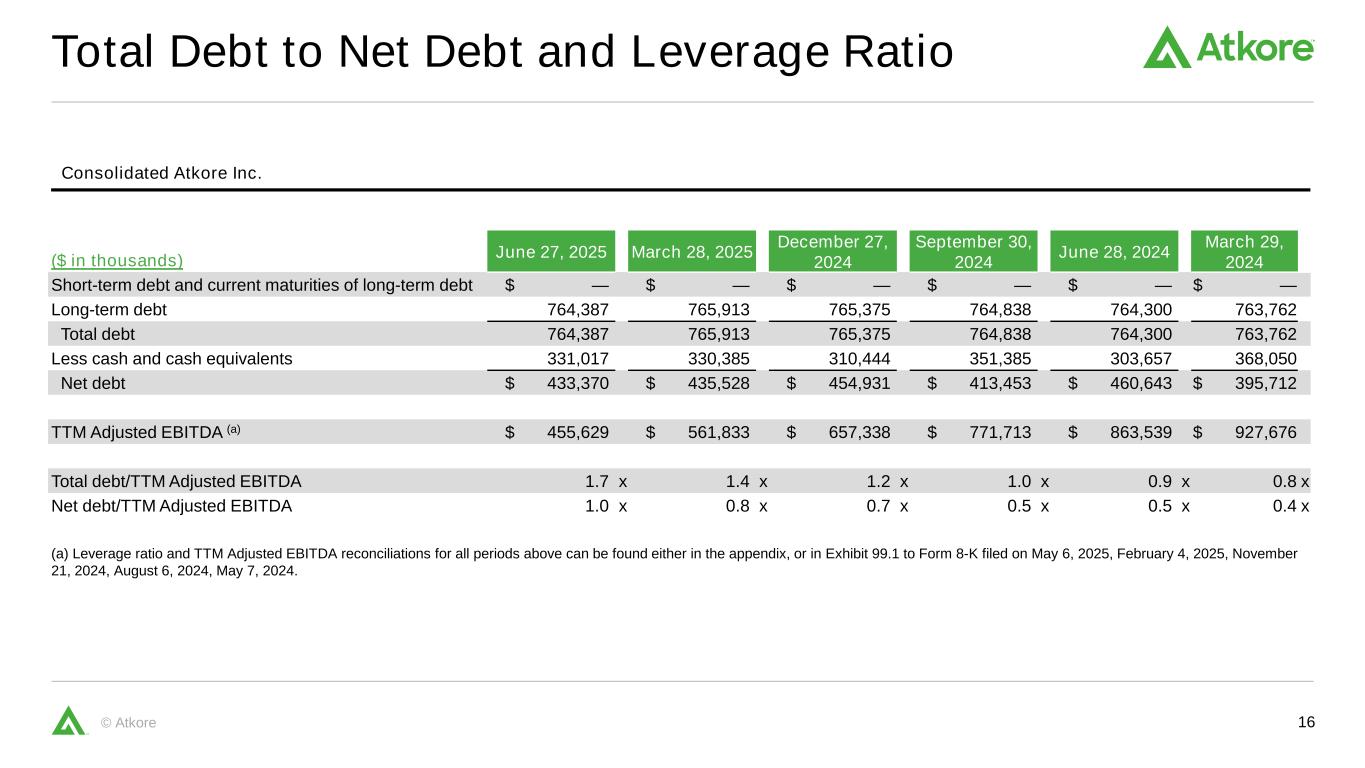
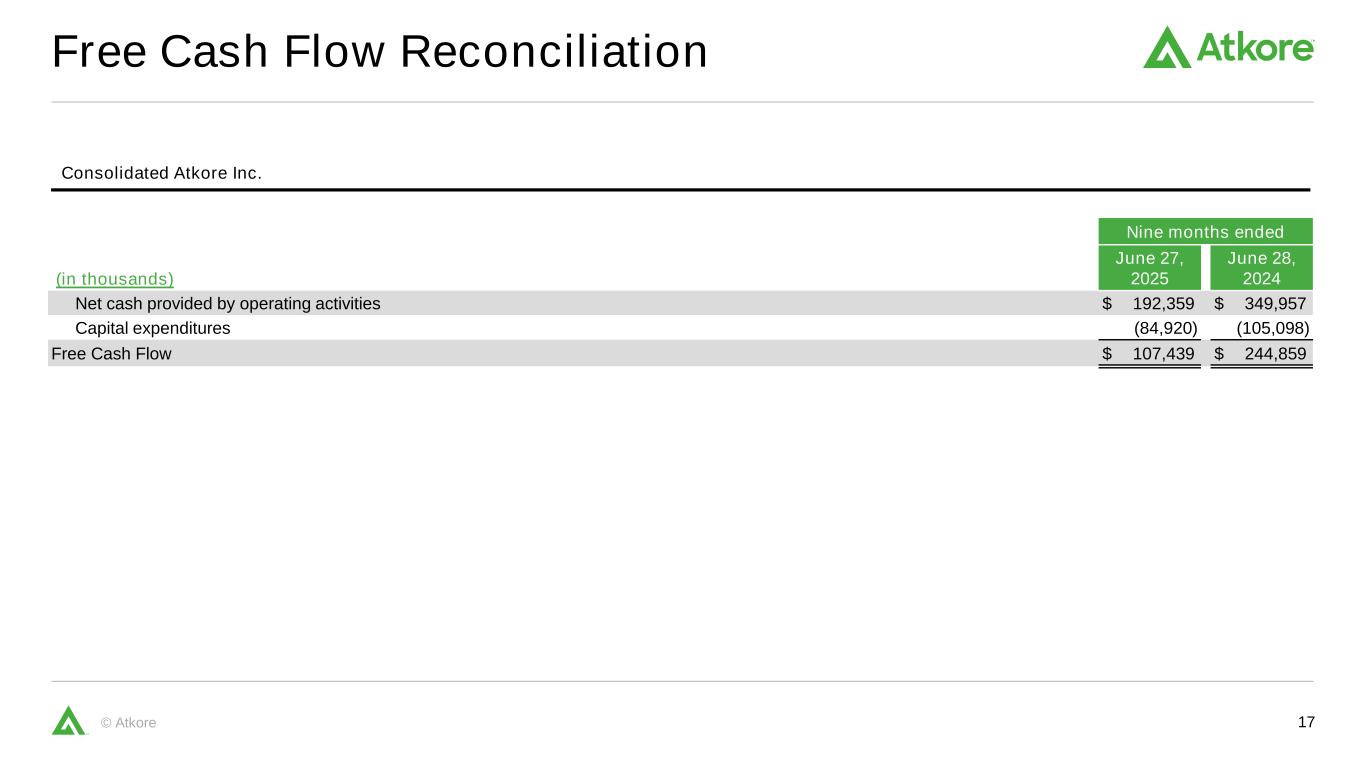
John Deitzer Thank you, Bill, and good morning, everyone. Moving to our consolidated results on slide four. In the third quarter, we achieved net sales of $735 million and adjusted EBITDA of $100 million. Adjusted EPS was $1.63. cents. Turning to slide five and our consolidated bridges. Organic volumes increased 2% compared to the third quarter of fiscal 2024. Average selling prices declined 12% year-over-year, driven primarily by our PVC conduit and steel conduit products. These year-over-year price declines for both product categories were expected, and as Bill mentioned, we are pleased to report the second consecutive quarter of sequential pricing improvement in our steel conduit products we also saw sequential pricing improvement across the enterprise including for electrical cable and flexible conduit mechanical and metal framing products however pricing has not kept pace with raw material cost increases this has been particularly true with respect to copper which has seen cost volatility for most of the quarter moving to slide six year to date our volume is now up slightly having been flat for the first six months compared to the prior year our year-to-date volume reflects growth across three product areas our metal framing cable management and construction services has grown low single digits year to date driven by our ongoing focus on construction services as well as cable management. Year-to-date, our plastic pipe conduit and fittings category is now flat year-over-year, having overcome a mid-single-digit decline in the first half of fiscal 25. Growth in the third quarter came from our PVC and fiberglass conduit products. Our metal electrical conduit and fittings product area has grown low single digits year to date having overcome flat volume performance in the first half we estimate that demand for domestically made steel conduit has increased due to enacted tariffs on imported steel our electrical cable and flexible conduit category also continues to grow up low single digits year to date which we believe is in part due to the success of our differentiated products turning to slide seven adjusted EBITDA margins compressed year over year in our electrical segment, primarily due to pricing declines related to our PVC and steel conduit products. Adjusted EBITDA margins improved in our S&I segment year-over-year, driven by volume growth and overall better productivity. The productivity gains were primarily due to better cost management in our North American operations. Turning to slide eight, year-to-date, our business has generated $192 million in cash flow from operations and we've received $14 million in proceeds this year from a previously announced divestiture of the Northwest Polymers business and the sale of some excess equipment. We remain committed to executing a balanced capital deployment model with an emphasis on returning cash to shareholders. Our balance sheet is in a strong position with no maturity repayments required until 2028 and a recently refinanced asset-based lending agreement remains undrawn, contributing to a net leverage ratio of approximately one time. Next, on slide nine, we are maintaining the full-year outlook midpoint for adjusted EBITDA. However, with better line of sight to the fourth quarter, we have narrowed the range and expect full-year adjusted EBITDA between $390 to $410 million. dollars. We are also pleased to be increasing the midpoint of our full-year outlook for adjusted EPS and now expect to achieve adjusted EPS within the range of $6.25 and $6.75. With this, we expect our fourth quarter adjusted EBITDA to be in the range of $75 to $95 million. Our adjusted EPS is expected to be in the range of $1.05 and $1.35. We are also adjusting our outlook for our full year tax rate. As a reminder, the impairment recorded in the second quarter will reduce our full year tax rate, which we now expect to be in the range of 19 to 21%. This means we'd expect our tax rate in the fourth quarter to be within a range of 20 to 23%. As we mentioned earlier, the forward-looking sentiment on construction activity appears mixed, depending on the end market. Through our first nine months, we have grown just under 1%. For the full year, we would expect our volume to be flat to slightly positive. With that, I'll turn it over to John Progenzer.
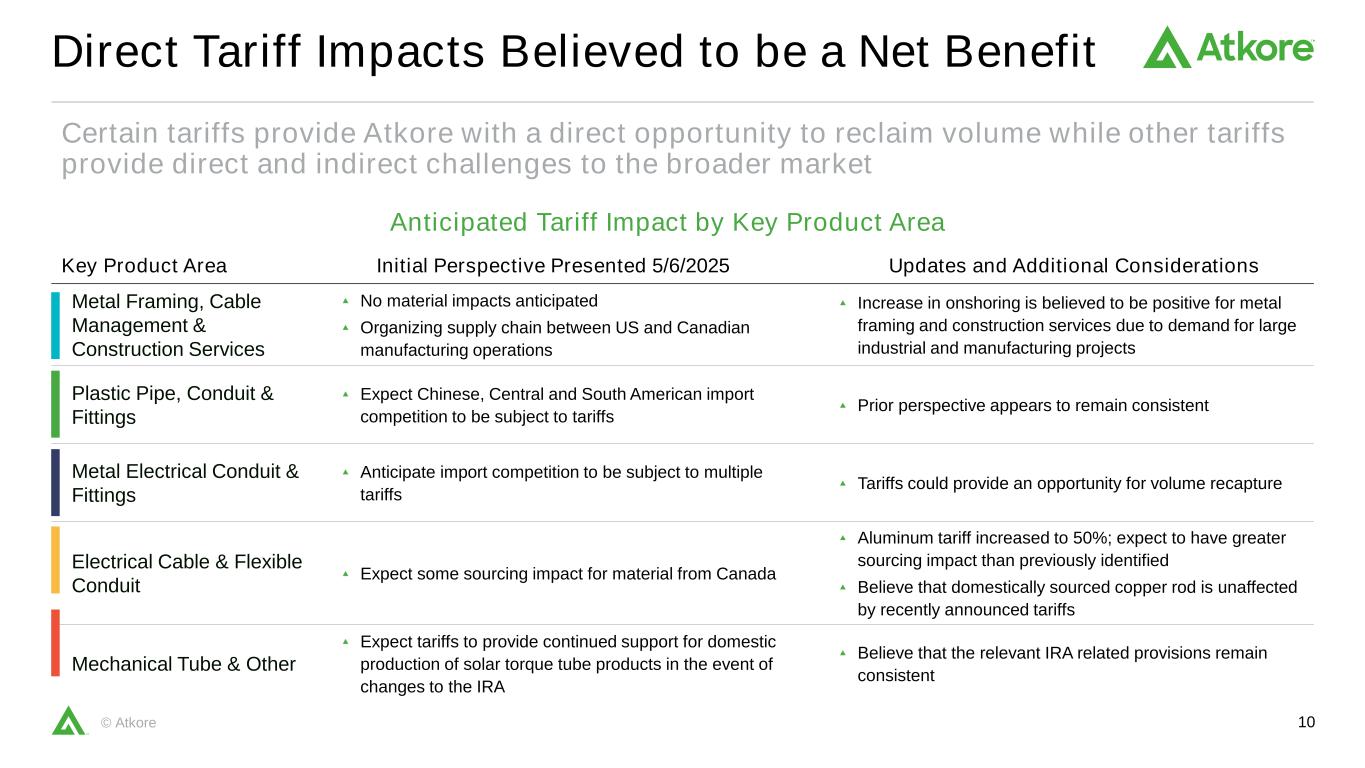
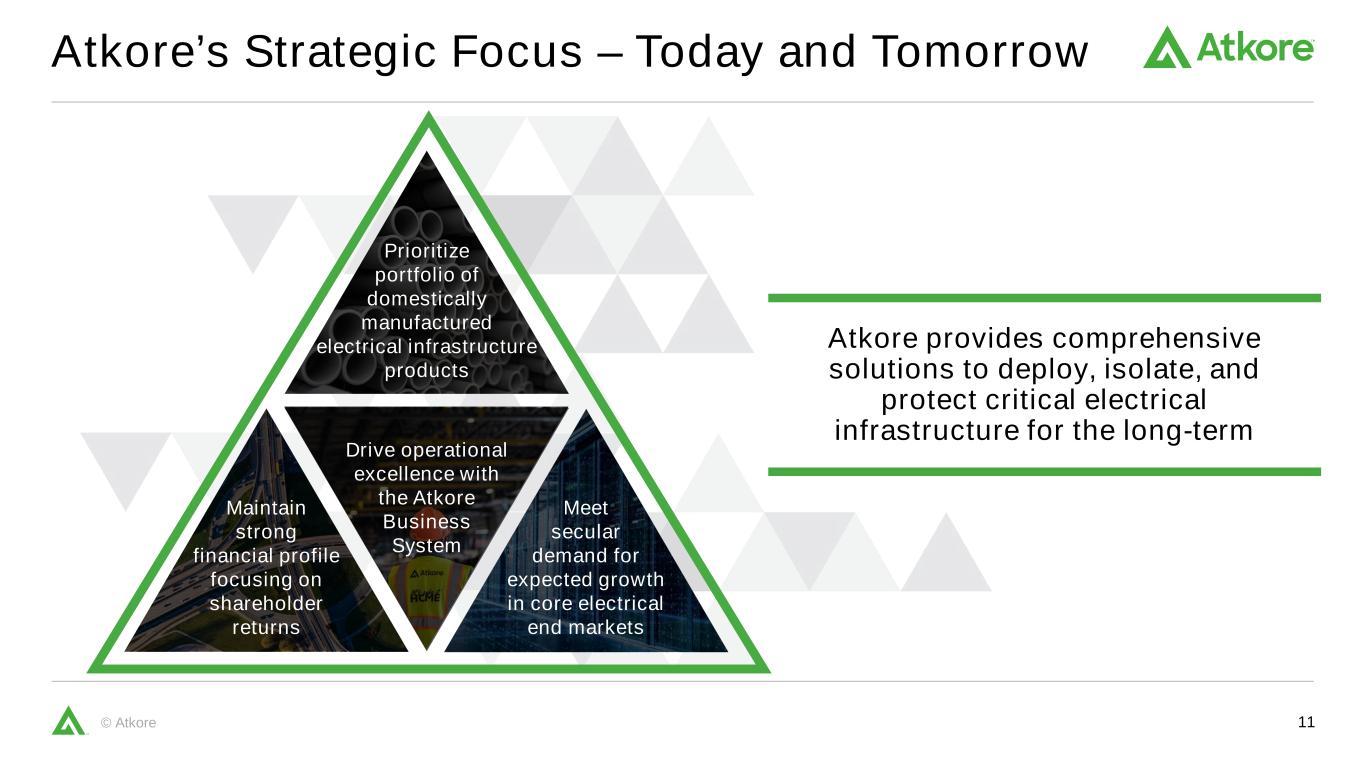
Thank you, John. Moving to slide 10, as Bill touched on in the beginning of the call, the topic of tariffs remains fluid with no definitive certainty on their duration or size. As we manage the business, we recognize that tariffs have both a direct and indirect impact on our company. A central theme supporting tariffs is an increase in onshoring of manufacturing across the U.S. There have been positive indicators that onshoring investment momentum is starting to pick up. However, these efforts take time, with various factors impacting the rate of change. A potential direct benefit from tariffs for ATCOR primarily centers on our ability to recapture lost market share from imports for certain product categories over time. This is especially true for our steel conduit products. We believe this will occur over time as market demand shifts back toward more domestically sourced products. Since last quarter, the administration announced several changes to existing tariffs and new tariffs. The most relevant change for Atcor was the increase to the original steel and aluminum tariff on Mexico and Canada from 25 percent to 50 percent. The recently announced 50 percent tariff on imported copper that became effective on August 1st is not expected to negatively impact Atcor due to our domestic supply partners. As we look beyond FY25 to FY26, we are estimating various factors that are likely to impact us. As we have previously communicated, due to the rate of change in our average selling prices for our PVC conduit products in FY25, we expect to experience a year-over-year headwind into FY26. We expect that unfavorable impact to occur throughout the duration of the year starting with our exit rate in fy25 but having a lesser impact as the year progresses the recently expanded aluminum tariffs from 25 to 50 percent creates a new cost challenge for the market which could also slow demand activity for our products the combination of these factors suggests there are approximately 50 million dollars of unmitigated headwinds in fy26 Although we have not finalized our full-year guidance for FY26, we are actively working to offset the effects of these anticipated headwinds. Now, turning to slide 11, as we've often said, the electrical industry is a great place to be. Our strategy addresses items that we are focused on today while also looking toward the future. We remain committed to maintaining a strong balance sheet and financial profile that enables us to return capital to shareholders while also pursuing strategic actions that enhance our portfolio of domestically manufactured electrical products. Our teams continue to drive operational excellence through the AdCorp business system, our disciplined, data-driven approach to managing growth, productivity, and customer value. Despite near-term challenges, our positioning in key electrical end markets gives us confidence in our ability to grow volume over the mid- to long-term. Today and in the future, AtGore is providing comprehensive solutions to deploy, isolate, and protect critical electrical infrastructure over the long-term, while on a mission to be the customer's first choice by providing unmatched quality, delivery, and value to help our customers achieve their goals. with that we sincerely thank you for joining our call and for your interest in our company now we'll turn it to the operator to open the line for questions at this time i would like to remind everyone in order to ask a question press star then the number one on your telephone keypad your first question today comes from the line of andy kaplowitz from city your line is open
Good morning, guys. This is Piyush on behalf of Andy.
Good morning, Piyush. Congrats, Bill, on the retirement announcement. Well deserved.
Well, thank you, Piyush, and look forward to still talking with you for a while here, but enjoy.
Absolutely. So I just wanted to touch on volume growth. It seems that forecasting volumes has been a little bit challenging, and I understand it's been a dynamic macro environment, but based on your conversations with your customers and the mega projects and the mega trends that you have talked about, do you have enough visibility on demand trends to provide some puts and takes on your volume expectations for 26?
John, do you want, like I have a feel, let me do it this way. So end markets like data centers are exploding. So that should be good from a vertical. And also specifically for us, and this is difference between, let's say, fiscal Q2, fiscal Q3, when we get into what we call global megaprojects, working specifically with a customer, that's lumpier. So like timing of jobs for the last quarter, Tuesday, wrap up jobs and start another large projects have been a little slower from year-over-year comp, but us talking to, I'll just say, very well-known global data center-driven data companies, we're optimistic for the future there. Solar, same thing. You can go check with the people we sell to, and they're optimistic. And I think from there, other than residential, reasonable markets going forward. So we can get into our quarter and so forth. But Paiush, we're not giving estimates for next year. That's when I first mentioned John Dicer, but it should be reasonable growth going into next year.
Yeah, I totally agree with Bill here. I think we had a little bit of choppiness in our international business from some of the mega projects rolling off and new ones starting potentially as we look forward. So I think we felt good there. I mean, we've called that out before. But in the North American business, I think, you know, that's performed as we expected, or, you know, somewhat in line with some expectations at the end market level, but the timing of it has been a little bit choppy here between some of the months. So, but looking forward, I think we're pretty, you know, that low single digit type environment seems to be pretty reasonable.
Got it. Helpful. And just like touching on your water and market, I think you have talked about increasing focus on water, but seems that the water and markets are a bit mixed here. Maybe expand on the demand trends that you are seeing across the end market, and is water still a vertical way you're planning on investing?
Yeah, well, I'd say at this stage, a majority. There's always a couple of things to finish, but the investments have been made. Now it's just growing within customers, and that seems to be going on pace. Again, as we called out in previous quarters, whatever word you want to use, fired may be too strong a word, but specific customers that were resellers or retail-oriented and plumbing and things like that tied to residentials down. But where we're focused, the municipal is picking up. We're filling that void year over year, and I think it should be a reasonable market for us going forward.
Gotcha. One last one. On HDPE, I think last quarter you mentioned potential for increase in competition from satellites. How has that dynamic evolved so far, and how is the current inventory in the channel? And if you have started to see these money making its way into the projects.
Yeah, so I'll start. If anybody jump in here again, I should probably turn it over to our COO that's closer to these things. So to last quarter, I don't think with the one big beautiful bill and everything else that, you know, is still the option to use satellites. Somebody can give me more details on the specific, you know, parts of what laws, but, you know, the states are required to do the most effective thing out there. So that hasn't changed one way or the other. I'm not aware, but maybe it's my knowledge of specific jobs we won with the BEADS Act. But I do think you can triangulate this with, you know, again, other people in the industry. that overall fiber is starting to go up because of the data center growth and things like that. So, long-winded answer, Pius, that nothing's really changed from our last quarter guidance other than we are starting to see the business volumes pick up as we go forward. So, again, another should be good thing over the longer term. Very helpful. Thank you, guys. Thank you, Pius.
Operator
Your next question comes from a line of Dean Dre from RBC Capital Markets. Your line is open.
Thank you. Good morning, everyone.
Hey, Bill. I also had my congrats on the announcement. I know you're still in the seat, but I appreciate everything you've done here and congrats.
Dean, thank you. And yeah, I'm still in the seat and nothing changes. But yeah, working with you, obviously, through ACOR and previous careers, it's been a great relationship.
Absolutely. So can we start with, you've given some good updates here on the tariff kind of from a high level. Can you take us down to the ground level, especially on the steel conduit imports from Mexico. So how has that changed, you know, with the introduction of the tariffs? You know, has that stopped the flow of Mexican steel conduit? And then same question for the PVC that was coming in from Latin America. Just has that stopped or can you size any of that for us, please?
Yeah, so I'll do both here. Again, I think I should look over John, if any of us could answer these questions. But I'll mix the two together to go overall for the year. And I'm using fiscal year just to even go back farther through October. For the year to date for both, they're either flat to maybe up 2% or like noise level that I would call flat. But again, before someone says, oh, the one was up 2%. Now, the key thing to your point, and I'll give caveat, Steen, is in this last fiscal quarter, both were down significant double digits. So what does that mean? I would say well over 20%, maybe getting up to 30% down for the quarter. Only caveat to that is what no one would know is obviously I think the tariffs are working, but also in the beginning of the year when after President Trump was elected and we talked, did some people buy up and they're burning through inventories and so forth so how much is tariff how much is pre-buy but either way um the tariffs i think especially with steel conduit as john frigginzer mentioned in his opening our opening remarks of 50 percent is having an impact pbc at 10 for most countries and you got to realize or my perception that what people claim for um their imported value can be subjective. So, you know, is that having, like, let's call it a 5% CEO math here impact. But both are down, and tariffs in those areas, especially steel, seem to be affected.
Got it. And then second question, can you take us through and update us on your demand visibility as it stands today? At one time, there was a meaningful backlog. That has all been burned off, I would presume. So are you down to like a two-week visibility? Just kind of give us a sense there, because I know that that shortened timeframe adds more volatility, and you have to gauge what's going on on the construction markets. But just frame for us the earnings visibility in any dimension that you could.
Yeah, I'll try to. And again, team, jump in here if need be. But again, Dean, our backlog is two weeks or so, give or take. Because again, we aspire to ship in four days. So by definition, if we're, you know, now there's some make-to-order products and so forth. That really hasn't changed much. Out with the customers, again, we do, this is more anecdotal, but talking to all of our customer base. Inventories are average with distributors to slightly lower, and there's lots of reasons for that. One is we've commented in our prepared remarks, things like PBC pricing has dropped. So distributors on thinner margins don't want to be buying a product at a high price, lower margin, try to pass that on. So logical there. um and then the last month has been pretty chaotic in the copper market when i think it was july 7th july 8th that president trump announced he was planning on a tariff copper don't lock me into these prices but copper just trumped from the mid-fours let's say to almost six dollars a pound maybe not quite there but you know probably wise contractors wise distributors waited to hold off And that's just what's announced on what the Copper Terrace were on last week on August 1. So, you know, there they're probably holding a lighter inventory. And the last data insight talking from customers. And again, each customer may have a slightly different view of this. But in the utility market, my perception is that the end demand has been good. In other words, contractors installing. but at least some of our distributors have mentioned, you know, they were still burning off inventory that's now throughout. So, you know, again, slight more optimism for us in the utility market as we go forward from this day, but the market at a manufacturer or distributor may have been slightly less.
Okay, that's helpful. And just last one, a lot of good detail is always on pricing. And can you just step back and give us a perspective of any surprises in the quarter on how pricing played out? It was actually both for PVC and steel a little bit better than what we had been estimating. And now you've got two quarters of better steel pricing. But just from your perspective, what has surprised you, if anything, about how pricing is playing out from here.
Yeah, so I'll start with Dean and kind of echo your comments with a little bit more color. To your point, since, you know, our, and again, team correct, but since our January earnings call, you know, the price guide, price versus cost has been right in the middle of our estimates. So no surprises. It ties with our numbers and reaffirming guide and raising EPS and everything else there. To your point, metal conduit probably slightly better than we expected. PVC maybe is slightly better than we expected. But then as John Perginzer in the earnings announcements here earlier, some of the aluminum at 50%, we import aluminum from Canada. So that has kind of hit us there purely because of the fact that, you know, we're paying the tariff and at least today we have not seen, there's a lot of chaos, as I just mentioned with both copper and aluminum, but we don't feel, it's hard to measure this to go, which is what or what the market's on, but we don't feel like we're able to recoup the aluminum costs today.
Thanks, Dean. your next question comes from the line of david tarantino from key bank capital markets your line is open good morning everyone and uh bill congrats on the upcoming retirement cool thanks david um maybe to put a finer point on the fiscal 2026 comments could you walk us through generally how you're thinking about the underlying assumptions within the 50 million dollar headwind maybe walk through PVC steel and what looks to be bubbling up aluminum headwinds? And what do you think the mitigating actions would look like? I think you mentioned that this was unmitigated.
Yeah. Great question, David, obviously. And then I'll start in John Deitzer if there's any, again, the key caveat here is we wanted to give some feel for next year now versus waiting to November as we talk to different shareholders and models to go, hey, let's at least think through some of this, but we're not here to give guidance that we would or specificity in November. So that said, as we've called out literally in our November guide of last year, our January guide, that we should, shareholders in the company, expect year-over-year headwinds for things like PVC purely because this pricing dropped this year. It's a much lower starting off point, even if PBC pricing held for all of next year. So rough numbers without breaking out, unless John Deitser wants to get this level of specificity, but I doubt it, is we're probably, and these are estimates here, but they're probably looking, let's say, at $70 million of year over year, just mathematically, as pricing's dropped this year without calling out which commodity. You kind of called out, though, PBC down, steel conduit is still down at the moment. But with two quarters and we're expecting three quarters, you know, this quarter here is sequential improvement. That could be a slight uptick as we go into next year. Beyond that, getting so specific. And then at this stage to go, you know, hey, John Progenzer mentioned 50 million or, you know, in page two of the deck or whatever page I spoke to, you know, had a 50 million there. It's assuming normal productivity, normal, as John Deitzer and I just mentioned, normal, you know, 2%, 3% volume growth for next year. Now, as we also mentioned, you know, obviously we're working hard now on every and any facet of how do we get more productivity, how do you get more volume, what other cost controls we could do. Obviously, we're analyzing things like, yeah, we sold one or two small businesses this year and going, is there other things we can do to create more shareholder value? So at this stage, though, David, as much as we can dimensionalize something to comments even John Ferginzer made, it's hard in this current environment, tariffs changing all around up and down to be any more precise than that.
Yeah, I'm totally aligned here with Bill, David. There's a lot of volatility on certain items, whether we've seen that even just play out here in the month recently with copper, where it spiked close to $6 a pound and dropped pretty significantly. So the net headwinds we're expecting are right around $50 million, but that includes some level of our normal productivity improvement and volume expectation to get us back to that net 50. We probably, to Bill's point, we have a variety of headwinds in excess of that. And so there are the normal measures here to kind of get us back to the net 50 is the expectation into next year. So we wanted to try to get ahead of that communication if we could.
Okay, great. Thank you. That's helpful. And then maybe just to dig into steel just a little bit more, it sounds like the import pressures are beginning to relax and pricing is improving sequentially. So what would give you the confidence that pricing trends are bottoming out and heading to more sustainable improvement?
Well, let's do it this way, David. Let me maybe correct you. You're correct with steel conduit. And as I mentioned with, I think it was Dean's question, PVC imports seem to be down, but on the same hand, whether it's, again, it's hard to always factor what's driving things, but with domestic competition and so forth, PVC pricing, you know, we're still looking forward to its estimates, but we'll continue to go down here, at least through the end of the year, and probably some into next year. Again, we're not at that level. So I just want to level set that. Now, for the products, yeah, it's not rapidly going up with steel, but steel can do it. You know, we had two quarters of sequential increases in our, you know, margins, and we're thinking that margins will go up again. you know what we've seen so far for the first month of july so hopefully i answered your question david if yeah yeah that's helpful and then maybe if i could sneak one more in could you just refresh us and how we should be thinking about capital allocation just particularly around the share buyback pause uh this quarter both near and in long term yeah so um to our guide here the 150 you know we didn't nothing's really changed let's put it this way we spent a hundred million we somebody could debate should we have done 25 million in the last quarter 25 million in the next quarter or spent i say spent it all but got to 150 or done more but um we without there's no commitment to anything but our guide still is to spend 150 million this year and beyond that we have not met with the board i mean i would think stock buyback will always be a strong part of our thing, but we just haven't done a capital allocation for next year to give a range for next year yet.
Yeah, a line there. I think in terms of the framework, though, I mean, we've talked about this for a while. You know, the capital expenditures are a key part of the, you know, from a capital allocation perspective there, the dividend share purchases and M&A. I mean, those have always kind of been the four pillars of our capital allocation model. As we get to November and moving on we'll probably give an update on you know how those expectations look for 26 but but those have been the key components of our capital allocation framework David okay great thanks guys yeah thank you David your next question comes from a line of Chris Dankert from Loop Capital your line is open hey good morning and uh just echo the congratulations again here bill.
I guess this first question here, as far as the impact of the lost IRA tax credits on kind of next 12-month earnings, I know it's fairly small, but is that included in the $50 million headwind?
You were breaking up there for a second, Chris. Can you mention that again?
Yeah, apologies. Just on the IRA tax credit, you know, that's going away, I believe, here. Is that headwind included in that $50 million you call out of headwinds for 26?
Yeah, I'll take a step back. I mean, I think we try to dimension that on one of the slides. I think from our perspective on the relevant portions of the Inflation Reduction Act, I think are maintaining, at least here in the near to midterm, there might be some longer term dynamics around accelerating into the late 2020s and things like that or 2030s. But I think the near to midterm, our understanding or current operating assumption is that the tax credits for the solar torque tubes are largely intact here in the near to midterm. So we had some modest headwinds. I think the dynamics more from our volume with that market this year around, you know, where solar credits had a modest, you know, slight impact. I think we called out on one of the volume bridges along the way this year. But the operating plan, I think, is by and large the same with that one.
Yeah, or I know your question was specifically, Chris, around that, or at least I perceive that, or to tax credit. But again, if I didn't mention one of the earlier questions, for the market itself, it's always spotty job by job. I don't want to be speaking for our customers, but with or without the recent different bills and legislation, our voice of customers, solar, without even tax credits, is optimistic. I'm speaking for them, so to speak, but just from the standpoint of they do have good backlogs, there's a lot of stats they can tell you that still they can start up a new energy source quicker than any other form of energy. And obviously, I don't think anybody hopefully in the U.S. is debating the extreme need for energy as we continue to drive data centers and things like that. So my personal view from talking with customers and so forth is that solar, like almost any form of energy, will grow well above GDP going forward.
Got it. Thank you for that. I guess the only other question I'd have on that particular point is, if the market's still growing nicely, how do the margins in that business look for at-core? Is that still an attractive market going forward after adjusting for all the moving parts here?
Yeah, I think so, especially going forward. What we talked about, which I hesitate to bring up again, but it's more about productivity in our factories running well. So as we look, again, I don't want to get down to each customer, but as customers have talked to us about 2026 and so forth, our productivity is good, our throughput, our scrap is good. So it's those type of things that I think are in our control, Chris. And, you know, the volume comes like we expected. It should be a good market or good vertical, however you want to say it for us going forward. Got it.
Well, thanks so much for the color.
Yeah, thank you. your next question comes from the line of chris moore from cgs securities your line is open hi this is will in for chris uh can you just add any color talk about any puts and takes to free cash flow generation in fy25 versus fy24 thanks yeah absolutely so good question well we had a little bit of dynamics ending on the 27th here uh versus the 28th and we have some uh ar that that comes through so i think you kind of noticed that i think someone else had kind of called that out from a free cash flow so a little bit weaker that being said um you know we do anticipate uh inventories have been coming down slightly that's probably an opportunity as we look forward to continue to make sure that that we can optimize our inventory we've been trying to add whether it's to support the service centers or some of these other initiatives um you know selectively over the past, you know, it's called 18 months, but that's probably an opportunity as we look forward into 2026 that we can continue to improve pre-cash flow generation. But, you know, some of those AR dynamics that we showed up ending on the June 27th have largely kind of played themselves out into July and August and I'm pretty pleased here. So I think, you know, we just had a little bit of a timing element here right at the end of the June, but I think we'll be back on track with some of the expectations of the free cash flow generation or the cash from ops generation really as we look forward into the fourth quarter.
Operator
Thank you very much.
Operator
Your next question comes from a line of Justin Clare from Roth Capital Partners. Your line is open.
Thanks for taking the questions here. So I wanted to ask about the headwind that you had mentioned moving into fiscal 26 here, wondering if you could just speak to how much of that headwind is really a function of just the pricing decline that you've already experienced in fiscal 25 versus the anticipation of further price declines in 26. And then I know raw materials and the increased cost in aluminum is also a factor there. So wondering if you could just maybe elaborate on the different factors?
Yeah, so a great question, Justin, obviously. I'm going to dimensionalize to just a small degree because, again, we'll give more specifics in November, but I think the majority, now whether that's 51% or 85%, I'm not dimensionalizing, is the year over year. In other words, to go, hey, if we ended flat in September, we would still have a large number. And again, that hopefully should not be news to anybody going back to November or January discussions. But from there, we haven't dimensionalized to go, hey, could some products still go down more? Or to your point, calling out the aluminum tariff, that specific niche doesn't seem to be working for us. But at this stage, again, without it's not november and give me next year's guide i would think steel conduit should be up year over year and again all these things are qualified with you know with the administration what they do do they change tariffs they give a quota before tariffs so that's why it's like we want to give as much guide or feelings as we can but it's just it's as you can appreciate things change maybe weekly with administration and so forth. But hopefully it answers, I think, a lot is the impact we've always seen this year.
Got it. No, that's helpful. And then just wanted to follow up on steel here. So import volumes have declined. Wondering if you could speak to the potential you see to recapture some market share in steel conduit and, you know, how much that affects your volume assumptions going forward here.
Yeah, I think there's, Justin, spot on. I do think, and again, it's not going to be crazy. It's the steel conduit other than somewhat driven by maybe data centers is one of our more steady GDP-ish product lines compared to things like metal framing or what we're doing with specific initiatives and so forth. But, yeah, I would hope over time, aspire, whatever word you want to use, that we as assuming that the importers continue to do a couple of things, one, just less volume coming in or less ability to undercut because they are paying that markup with margins, no matter what they claim is an imported value, will help us continue to see the margins that we just spoke about and share go up. as we move forward. So, yes. Okay. Okay. Appreciate it. Thank you. Thank you, Justin.
Operator
And this concludes the question and answer session. I would now like to turn the call back over to Bill Waltz for closing remarks.
Thank you. Let me take a moment to summarize my three key takeaways from today's discussion. First, ACOR had a solid third quarter of financial performance. Second, we are maintaining our full year 2025 outlook midpoint for adjusted EBITDA and raising our outlook for adjusted EPS. Finally, it has been and continues to be my honor to serve in this role, and I look forward to supporting ACOR during this time of transition over the upcoming months. With that, thank you for your support and interest in our company. This concludes the call for today.
Operator
This concludes today's conference call. Thank you for joining.