BBT $28.00 +0.32%
BBT logo
BBT · Beacon Financial Corp
Track BBT — free
Market Cap
$2.38B
Shares
83.82M
All earnings calls

Earnings call · FY2026 Q2

Beacon Financial Corp (BBT) Q2 2026 Earnings Call

Concluded Jul 30, 2026
Jul 30, 2026 0 turns
Period
FY2026 Q2
Runtime
—
Sources
3 artifacts

Executive readout · one minute

What matters this quarter

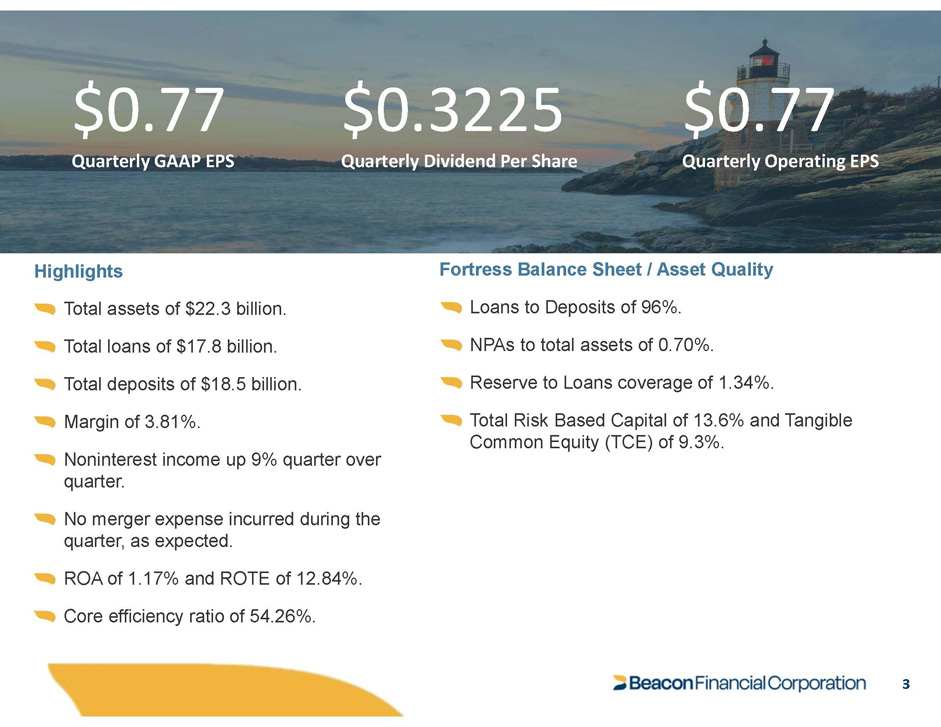
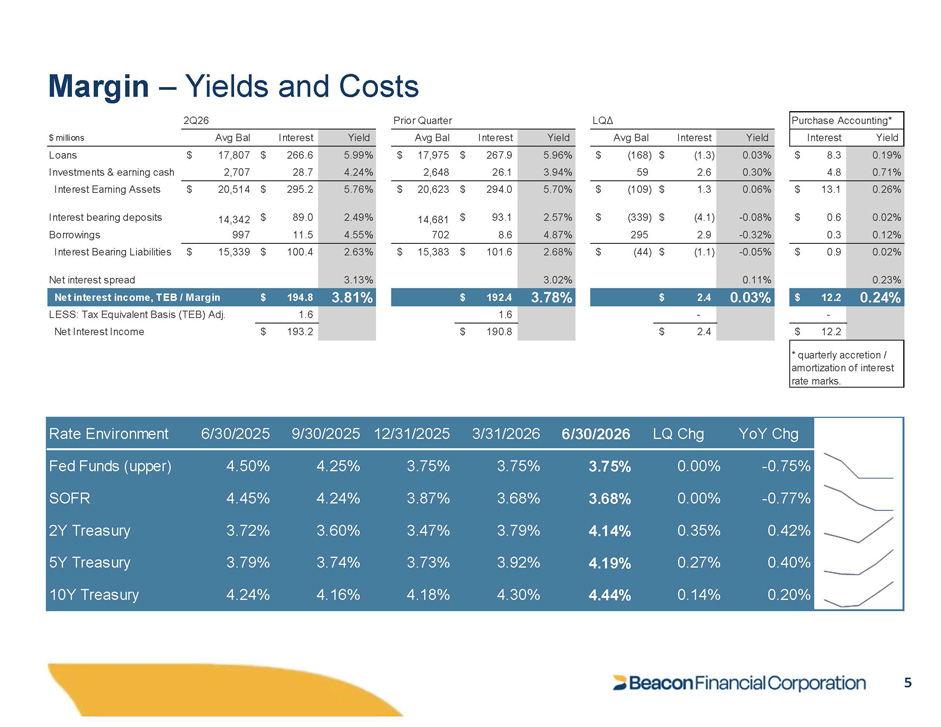
Beacon Financial reported Q2 2026 GAAP EPS of $0.77 versus $0.55 prior quarter, with net interest margin expanding to 3.81% and core efficiency at 54.26% as merger integration completed. The company reaffirmed forward guidance including NIM of 3.80%–3.85%, quarterly credit costs of $5–9 million, low-single-digit loan growth, and mid-single-digit fee growth, with no further merger charges anticipated.

Deposit franchise including payroll deposits 13 Capital, dividends, and shareholder returns 10 Merger integration completion and operating momentum 9 Loan portfolio and pipeline 8 Profitability and earnings improvement 8 Net interest margin and funding costs 6

Management tone

Confident

Net tone +62 · low hedging

Grounding quotes
  • “Our second quarter results reflect improved operating momentum and solid execution across the organization”
  • “These results underscore the value of our diversified business model and the resilience of our funding base”
  • “credit performance remains manageable and generally in line with our expectations”
  • “With the merger integration completed and expense synergies fully realized, we believe we are well positioned to continue building earnings momentum through the remainder of 2026”

Forward guidance

2 guided metrics

Management's latest ranges and targets are included below.

Research coverage

3 live sources

Open each available source without leaving this research workspace.

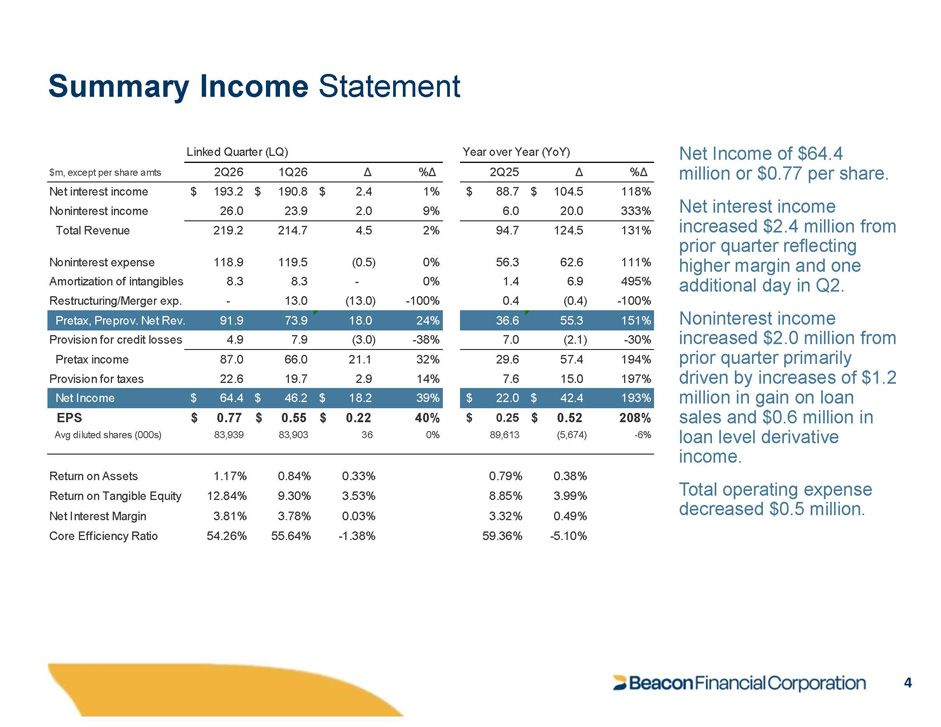
Diluted EPS $0.77 +208% YoY
Net income $64.43M +192.5% YoY

Research materials

Open the source you need; every reader stays inside this workspace.

Key takeaways

What improved, and what deserves a closer read.

↑ Constructive signals

  • Core efficiency ratio improved to 54.26% with merger synergies fully realized and no further merger charges anticipated
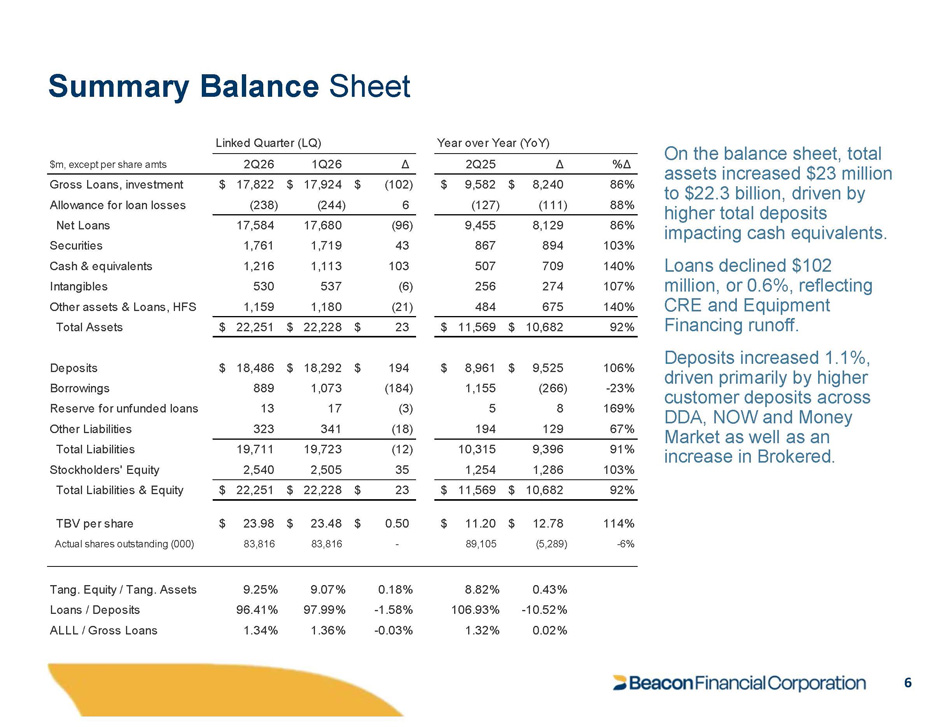
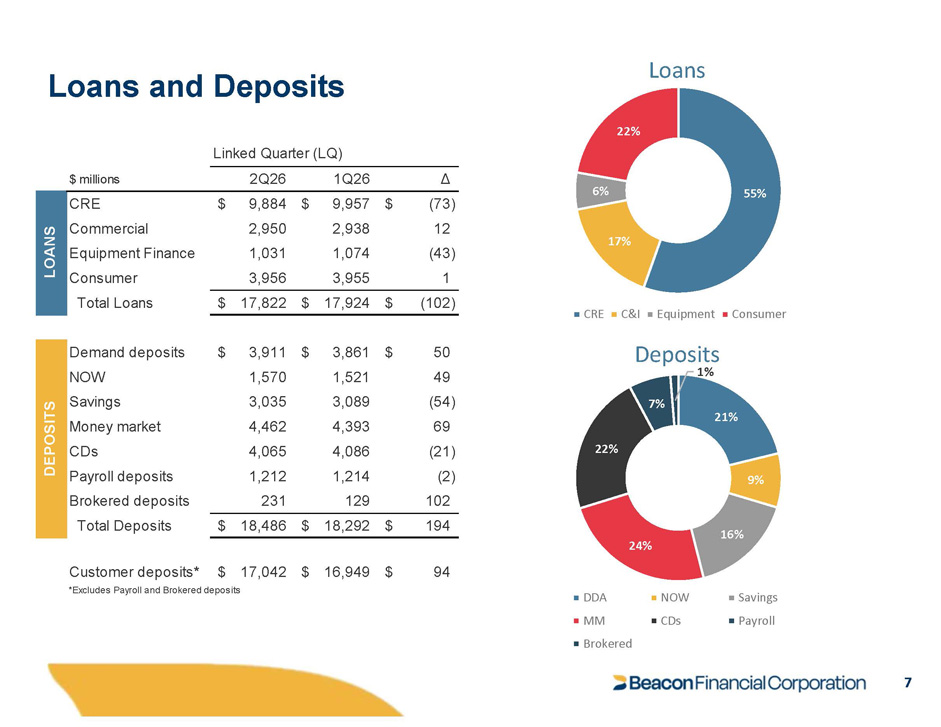
  • Deposit growth resumed with total deposits up $193.6 million, including $92.8 million in customer deposits
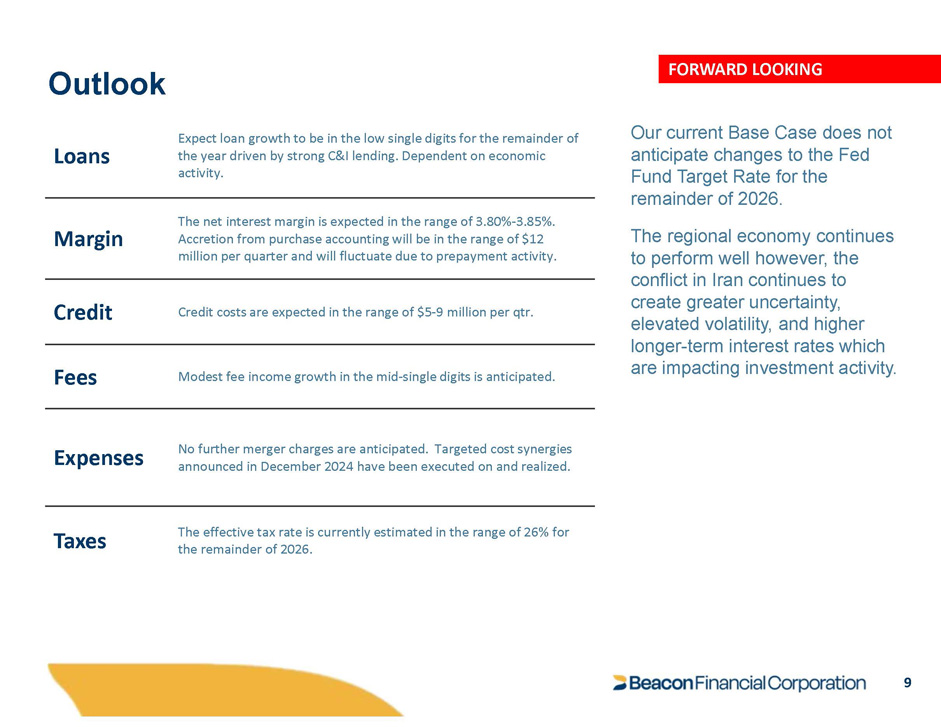
  • Forward outlook calls for low-single-digit loan growth driven by C&I, mid-single-digit fee growth, and quarterly credit costs of $5–9 million
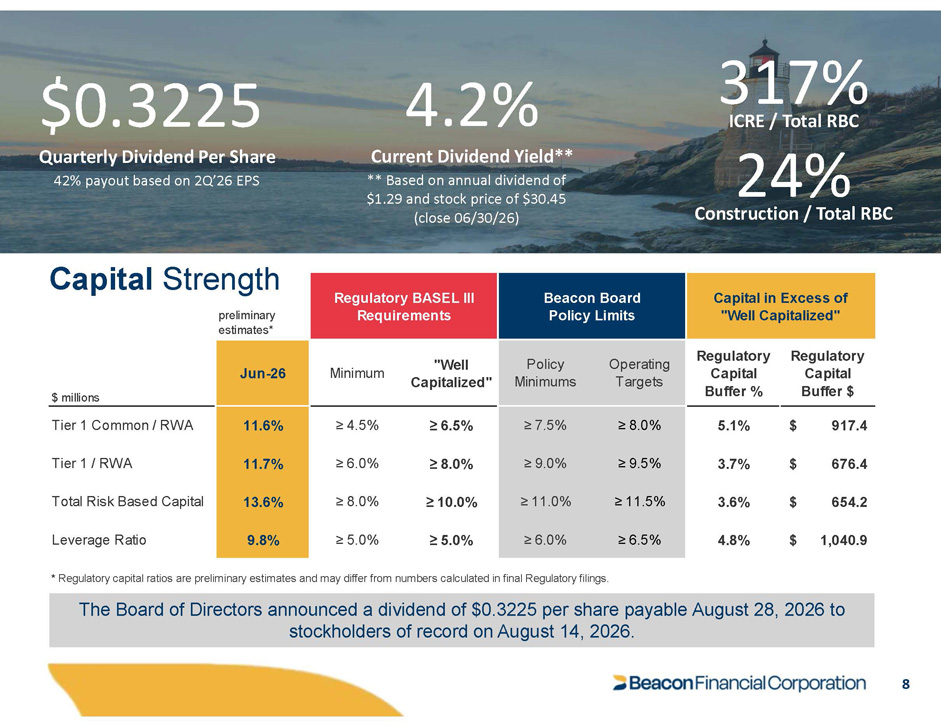
  • Capital strengthened with tangible common equity rising to 9.25% and TBV per share up $0.50 to $23.98

↓ Risks & pressure points

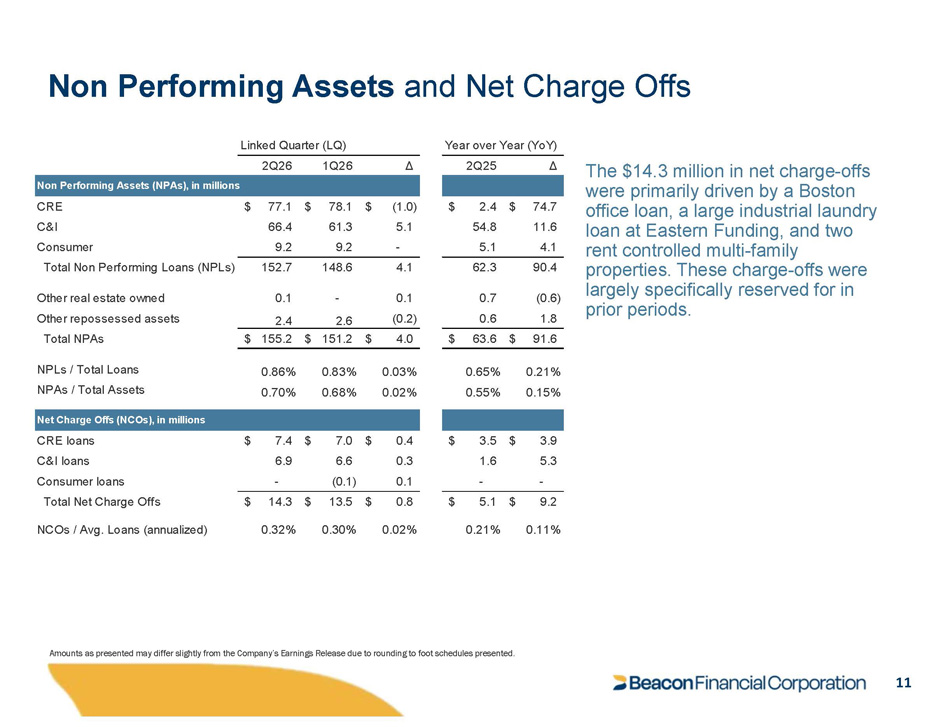
  • Loans declined $101.9 million sequentially as CRE and equipment finance runoff outpaced growth elsewhere
  • Management expects charge-offs to remain elevated and provisioning to be moderate as specific reserves are worked through
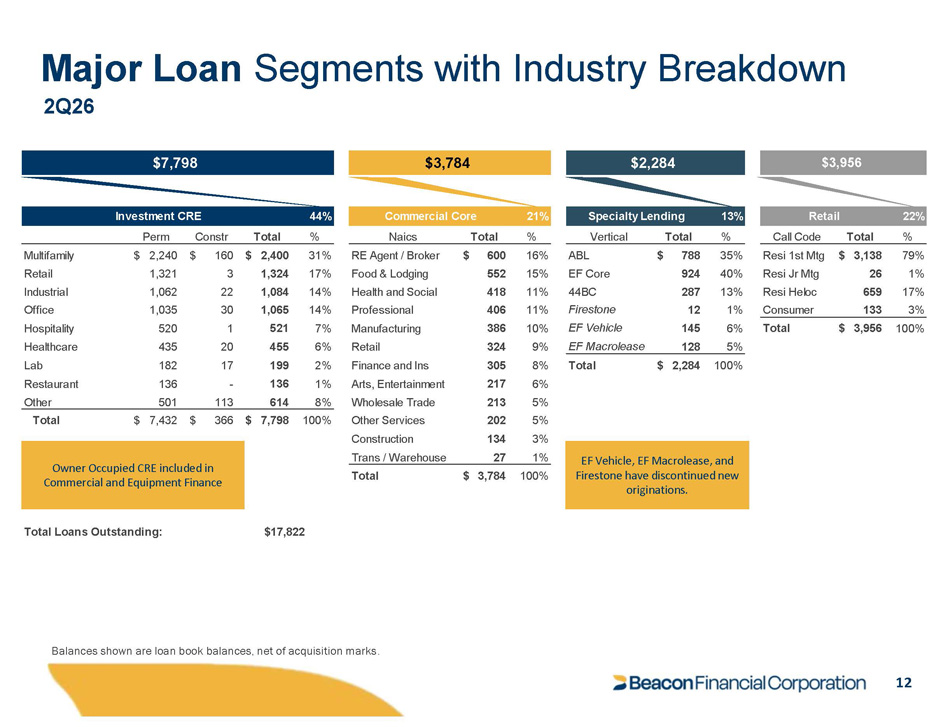
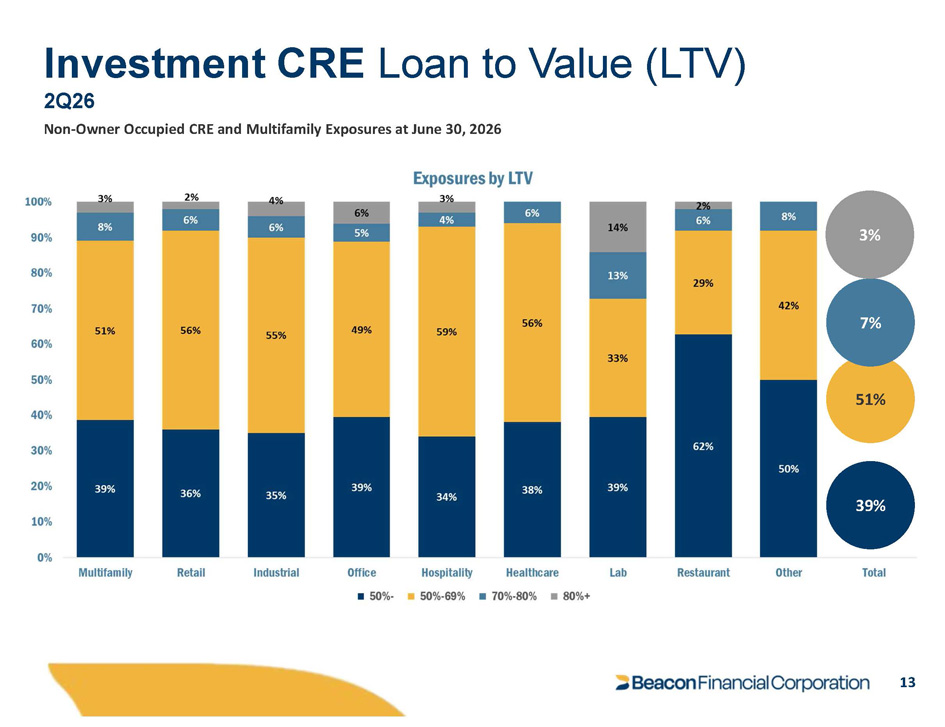
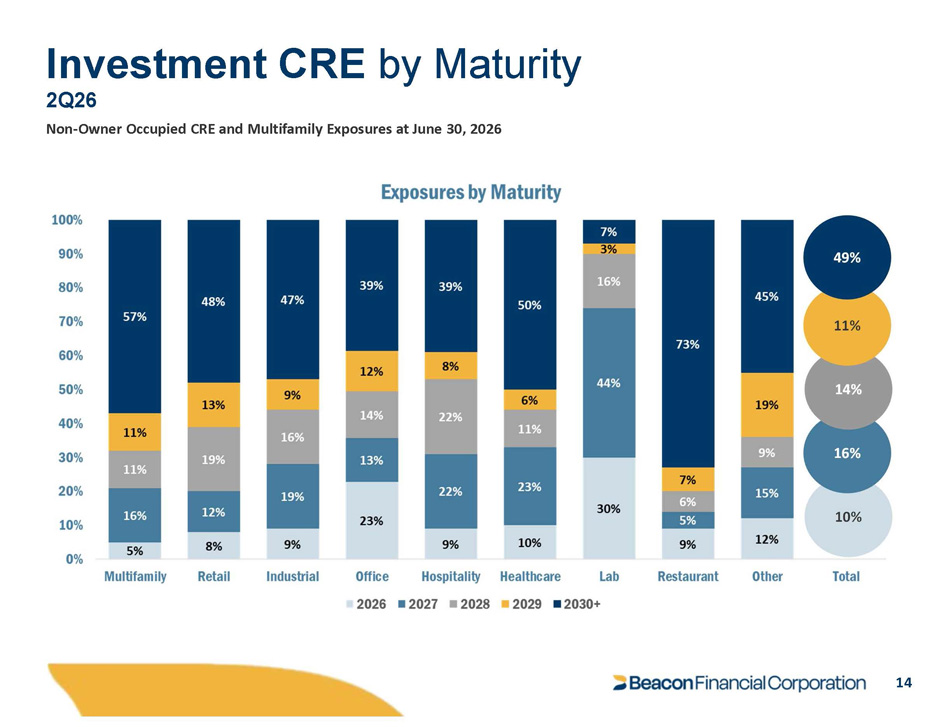
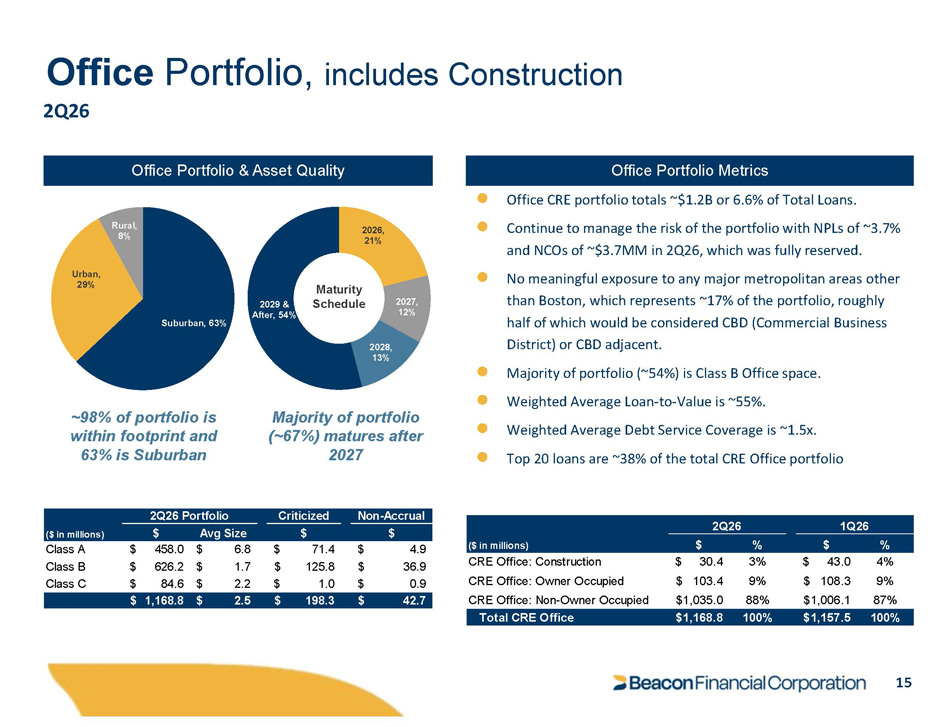
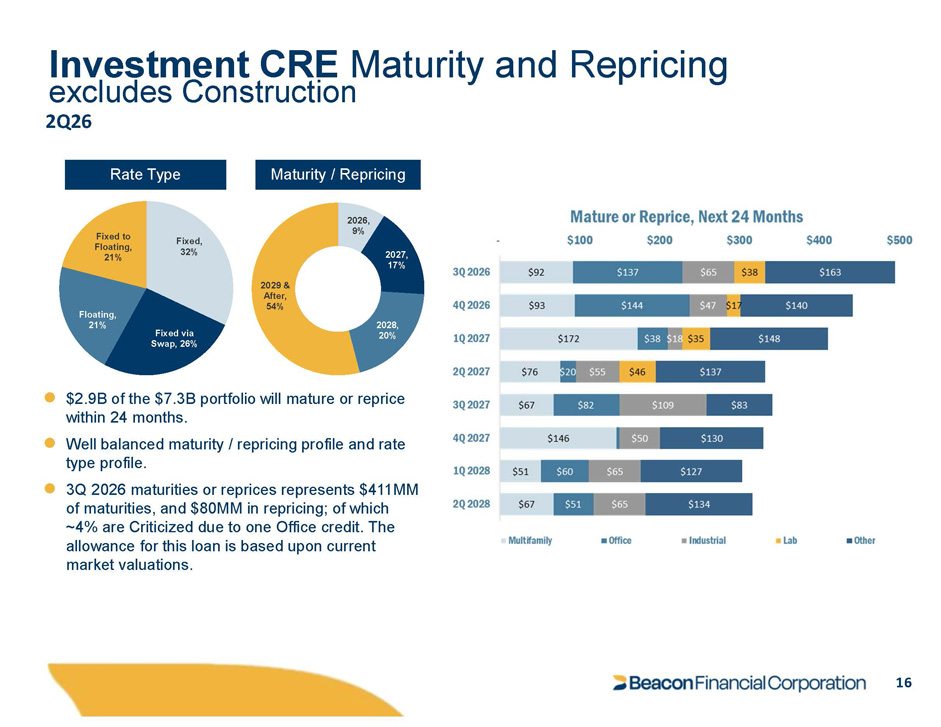
  • CRE concentration remains a stated risk, with $7.3B portfolio including $1.2B office exposure at 3.7% NPLs

Key moments

Read the management remarks selected from the transcript.

“While loan growth was somewhat constrained by market conditions and client caution, our pipelines are robust, and we continue to expect modest loan growth in Q3 with acceleration into Q4 with integration activities behind us a strong capital position and continued progress on our strategic initiatives we believe the franchise is well positioned to continue generating improved financial performance and shareholder value in the coming quarters” Carl Carlson, CFO

Forward guidance

From the 8-K filed Jul 29, 2026.

Metric Guided
Net interest margin
remainder of the year
3.8% – 3.85%
Credit costs
per quarter
$5M – $9M

Quarter detail

How the reported period landed and where the business moved.

Revenue · products & services

Deposit Account$8.51M +244.3% YoY
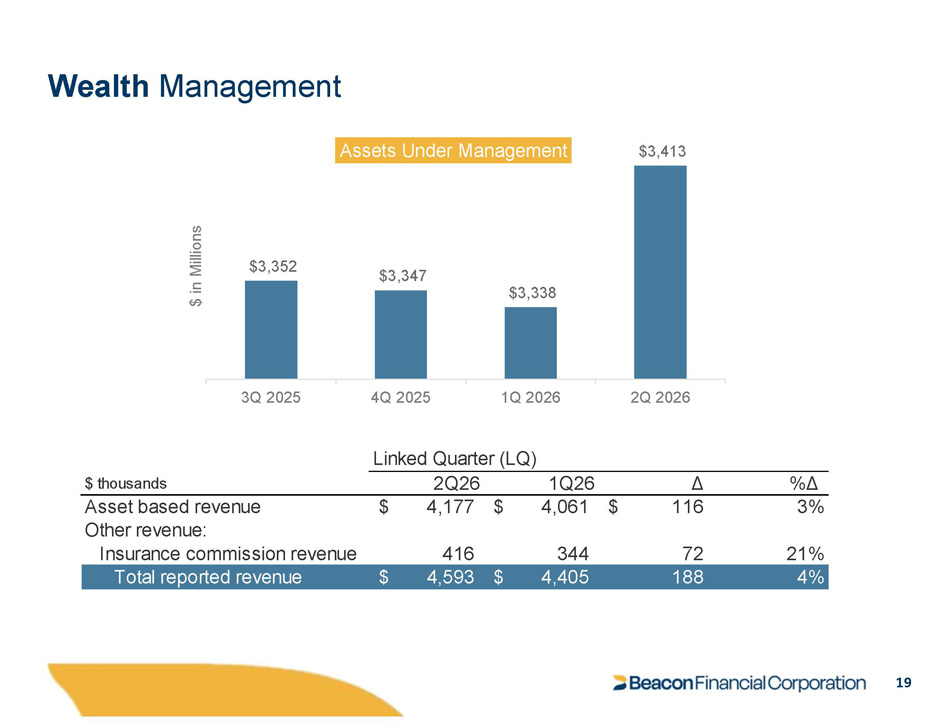
Wealth Management Fees$4.86M +242% YoY
Financial Service Other$2.62M +454.9% YoY
Full-screen source Call document