Operator
Greetings and welcome to the Bright Horizons Family Solutions First Quarter 2026 Earnings Call. At this time, all participants are in a listen-only mode. A question and answer session will follow the formal presentation. If anyone should require operator assistance, please press star zero on your telephone keypad. As a reminder, this conference is being recorded. It is now my pleasure to introduce Michael Flanagan, Group Vice President, Strategic Finance. Please go ahead.
Thank you, Stacey, and welcome to Bright Horizons' first quarter earnings call. Before we begin, please note that today's call is being webcast and a recording will be available under the Investor Relations section of our website, investors.brightverisons.com. As a reminder to participants, any forward-looking statements made on this call, including building regarding future business, financial performance, and outlook are subject to the State Harbor Statement included in our earnings release. Forward-looking statements inherently involve risk and uncertainties that may cause actual operating financial results are defer materially and should be considered in conjunction with the cautionary statements that are disclosed in detail in our earnings release, our 2025 Form 10-K and other SEC filings. Any forward-looking statement speaks only as of the data which is made, and we undertake no obligation to update any forward-looking statements. Today, we'll also refer to non-GAAP financial measures, which are detailed and reconciled to their GAAP counterparts in our earnings release, which is available on the IR section of our website at investors.brighthorizons.com. along with today's earnings release we have posted an updated investor presentation to our website which we will reference during tonight's call and here joining me on the call is our chief executive officer steven kramer and our chief financial officer elizabeth bolin steven will start by reviewing our results and provide an update on the business and elizabeth will follow with more detailed review of the numbers before we open up to your questions with that let me turn the call over to steven thanks mike and good evening everyone 2026 is off to a positive start
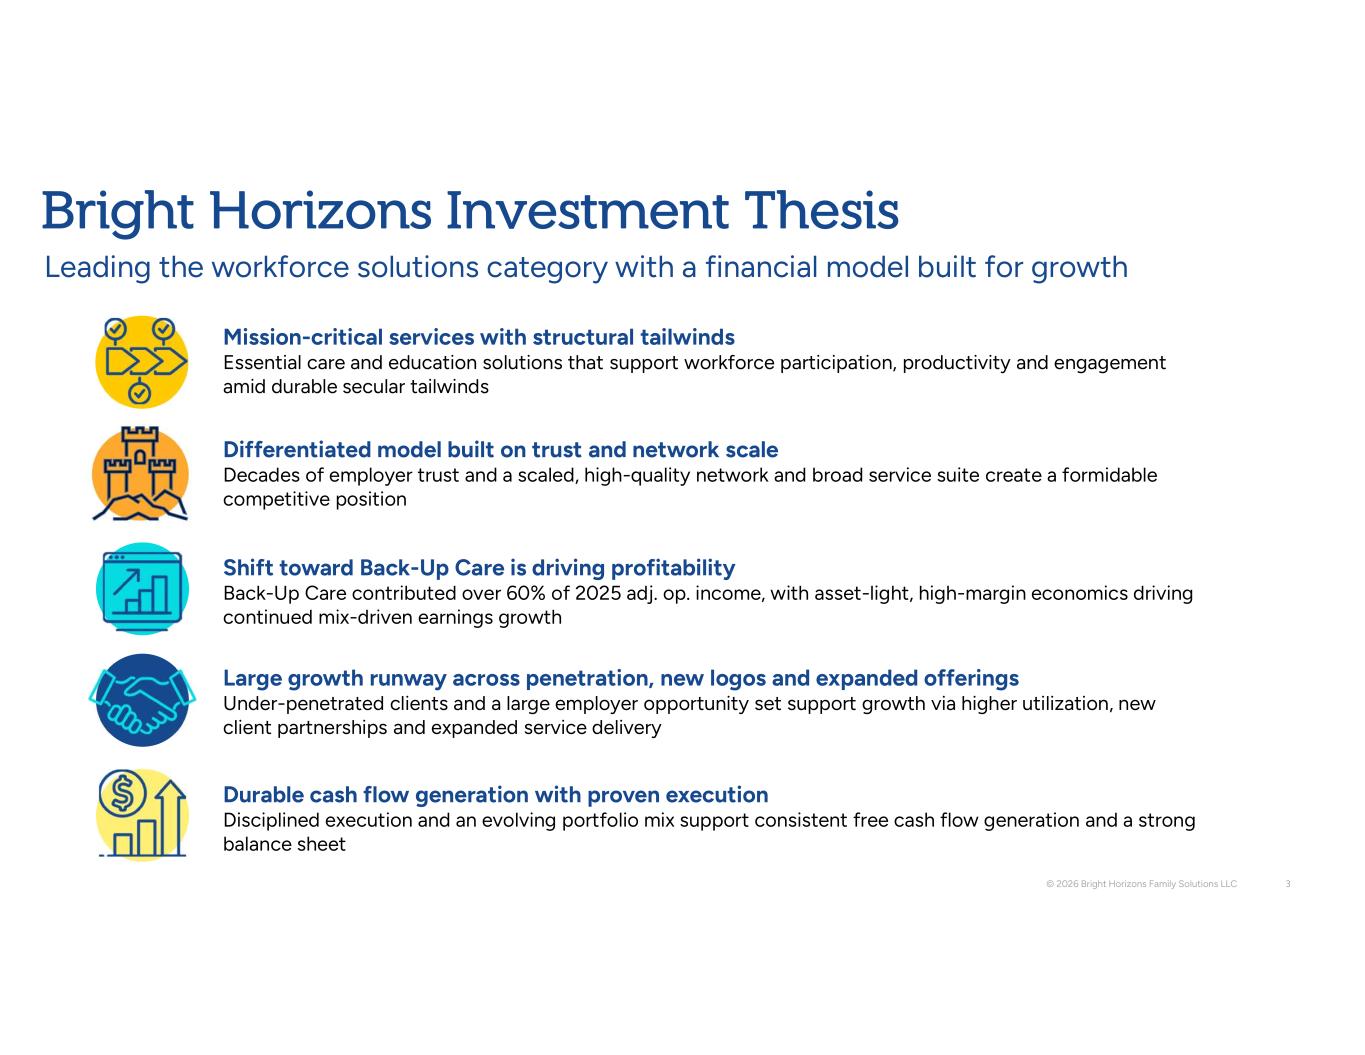
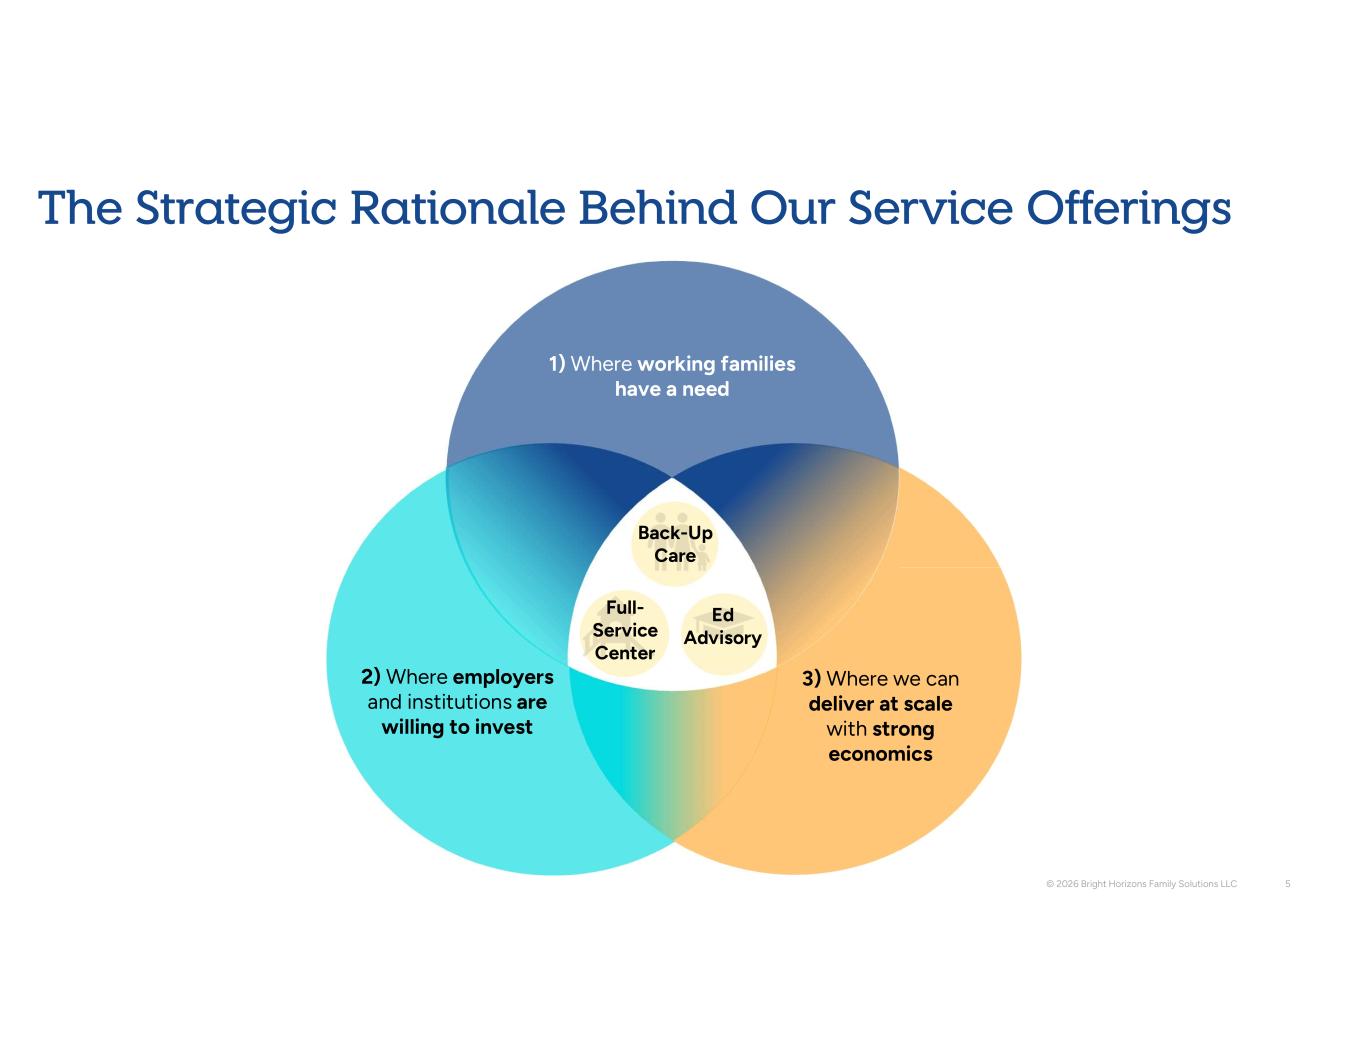
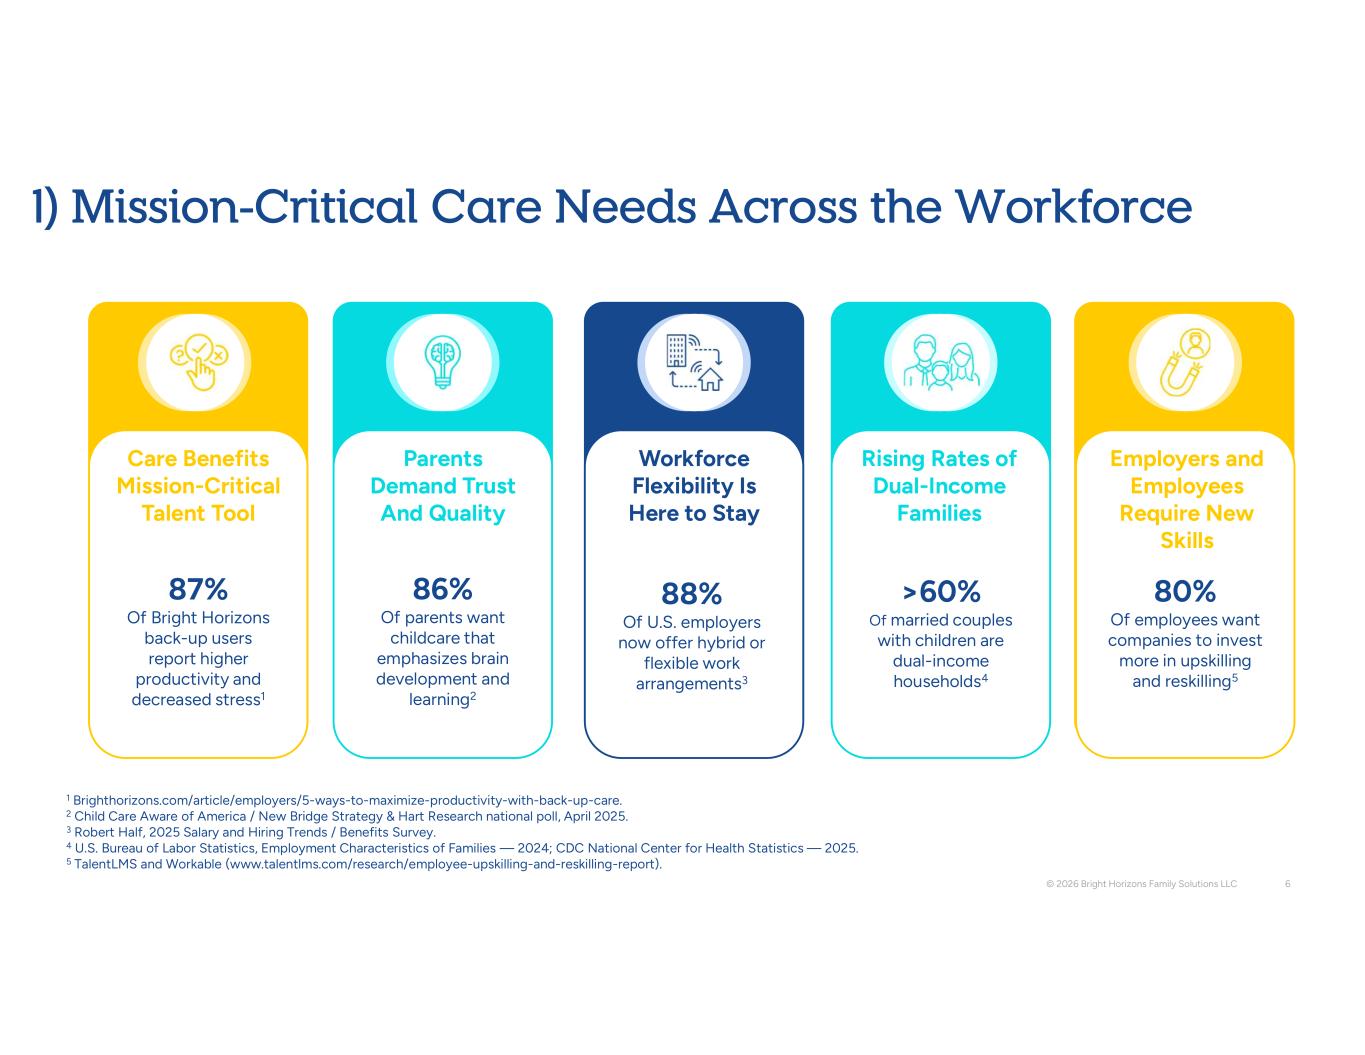
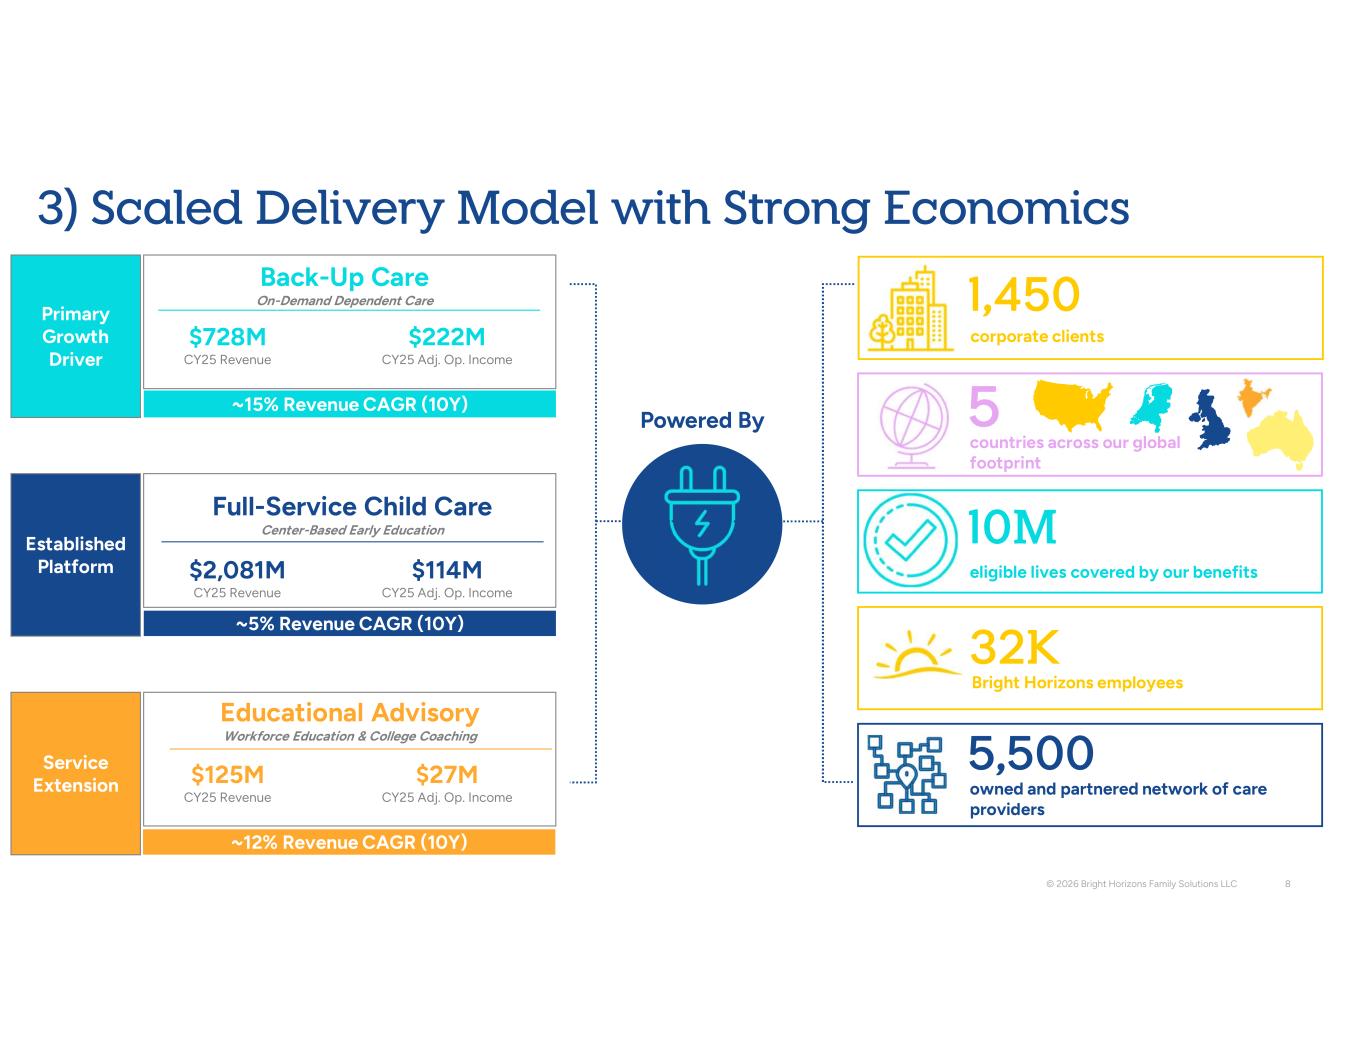
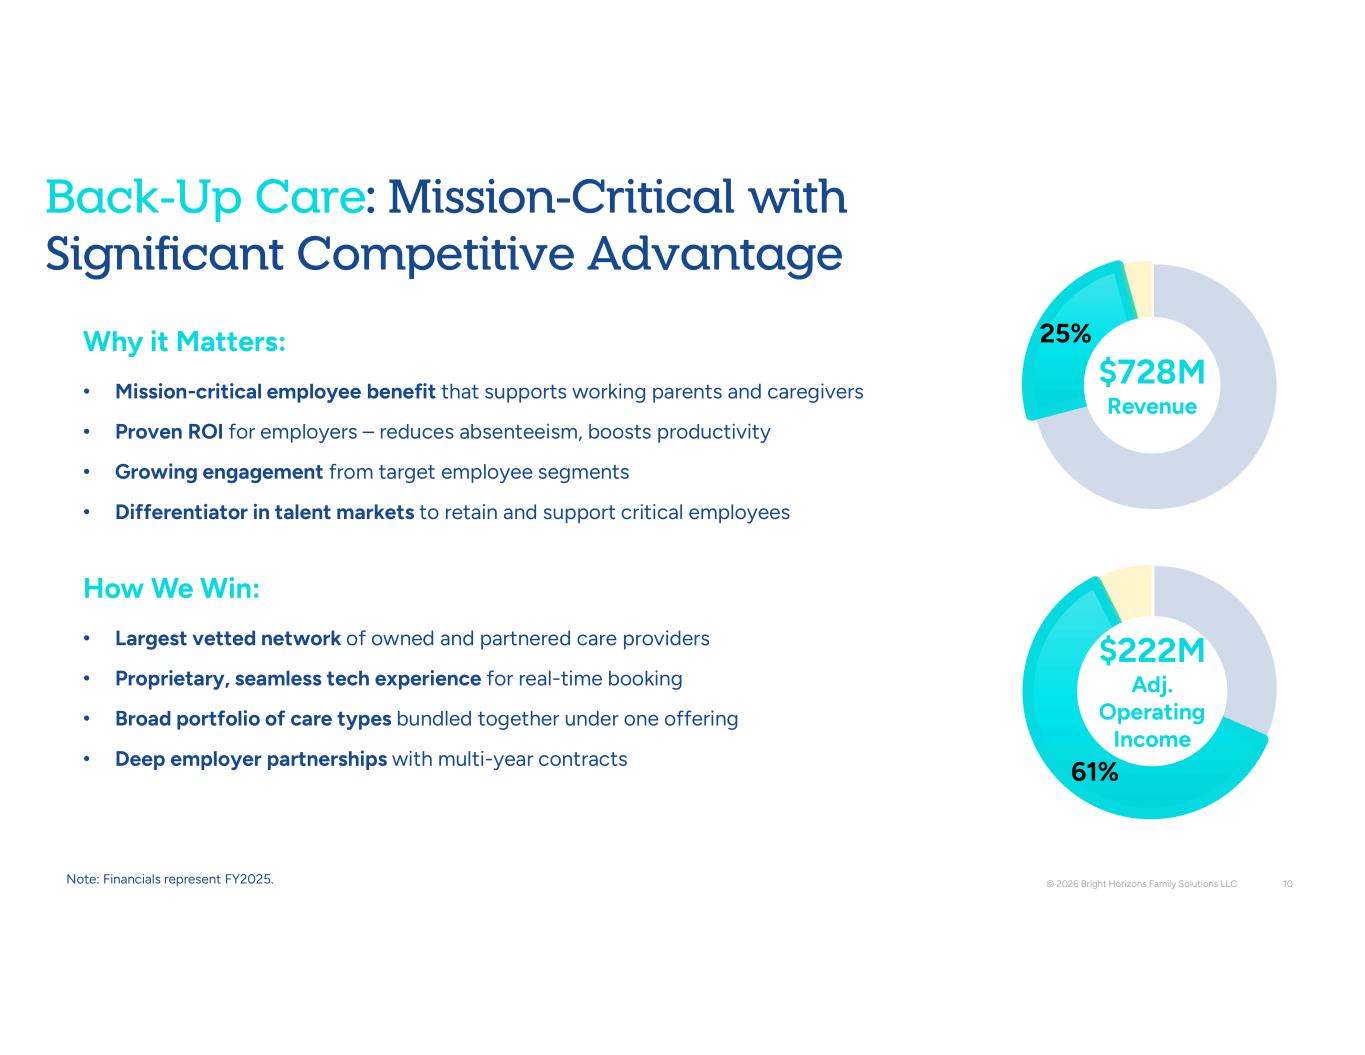
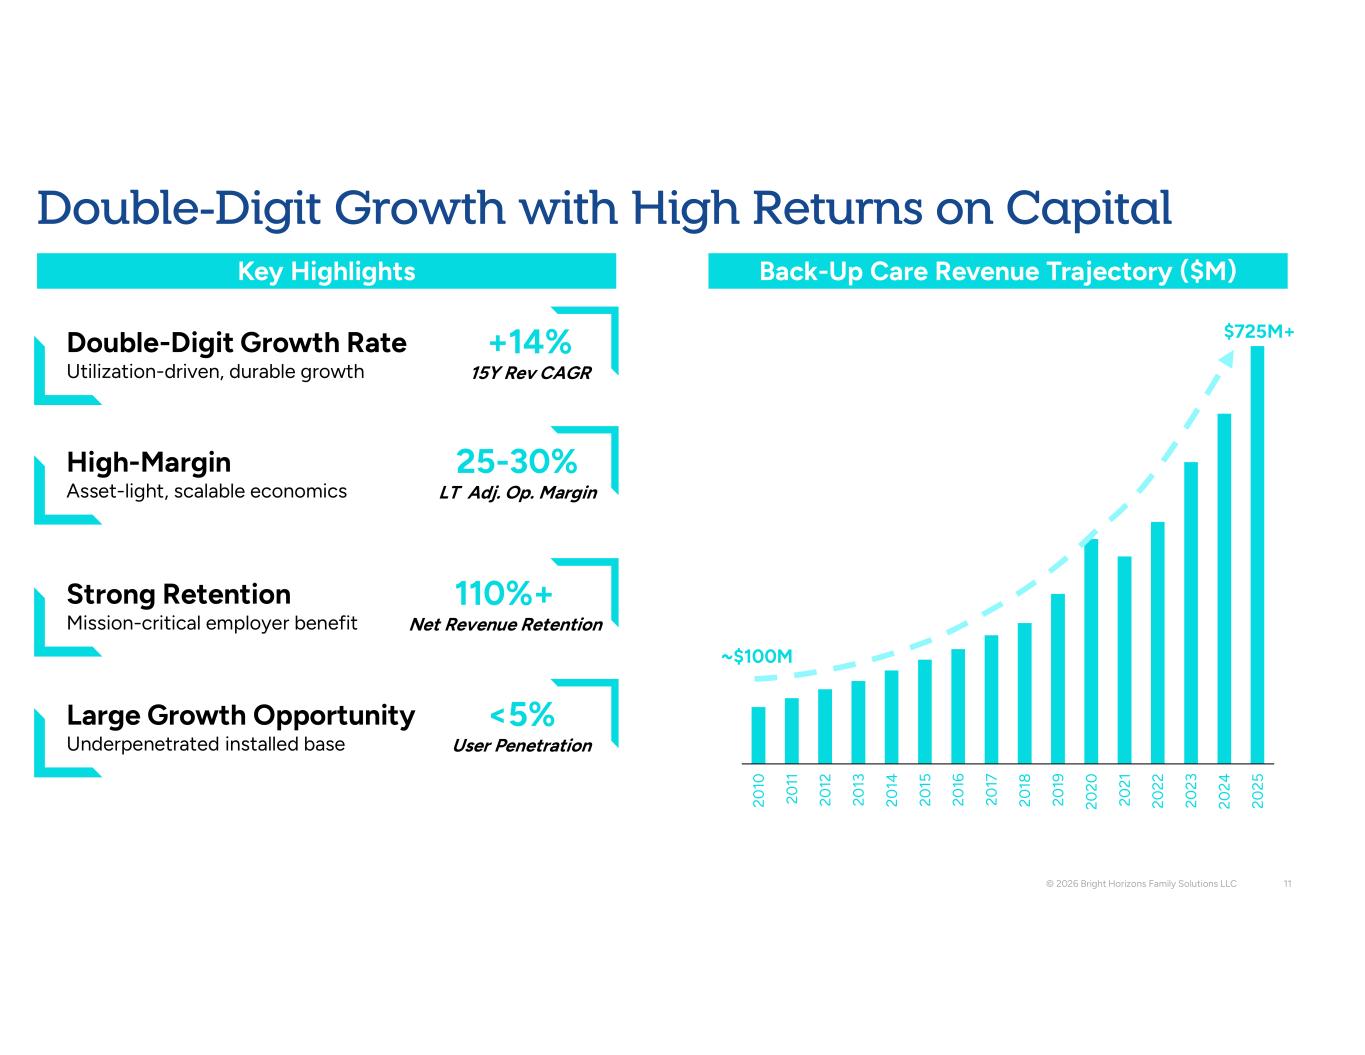
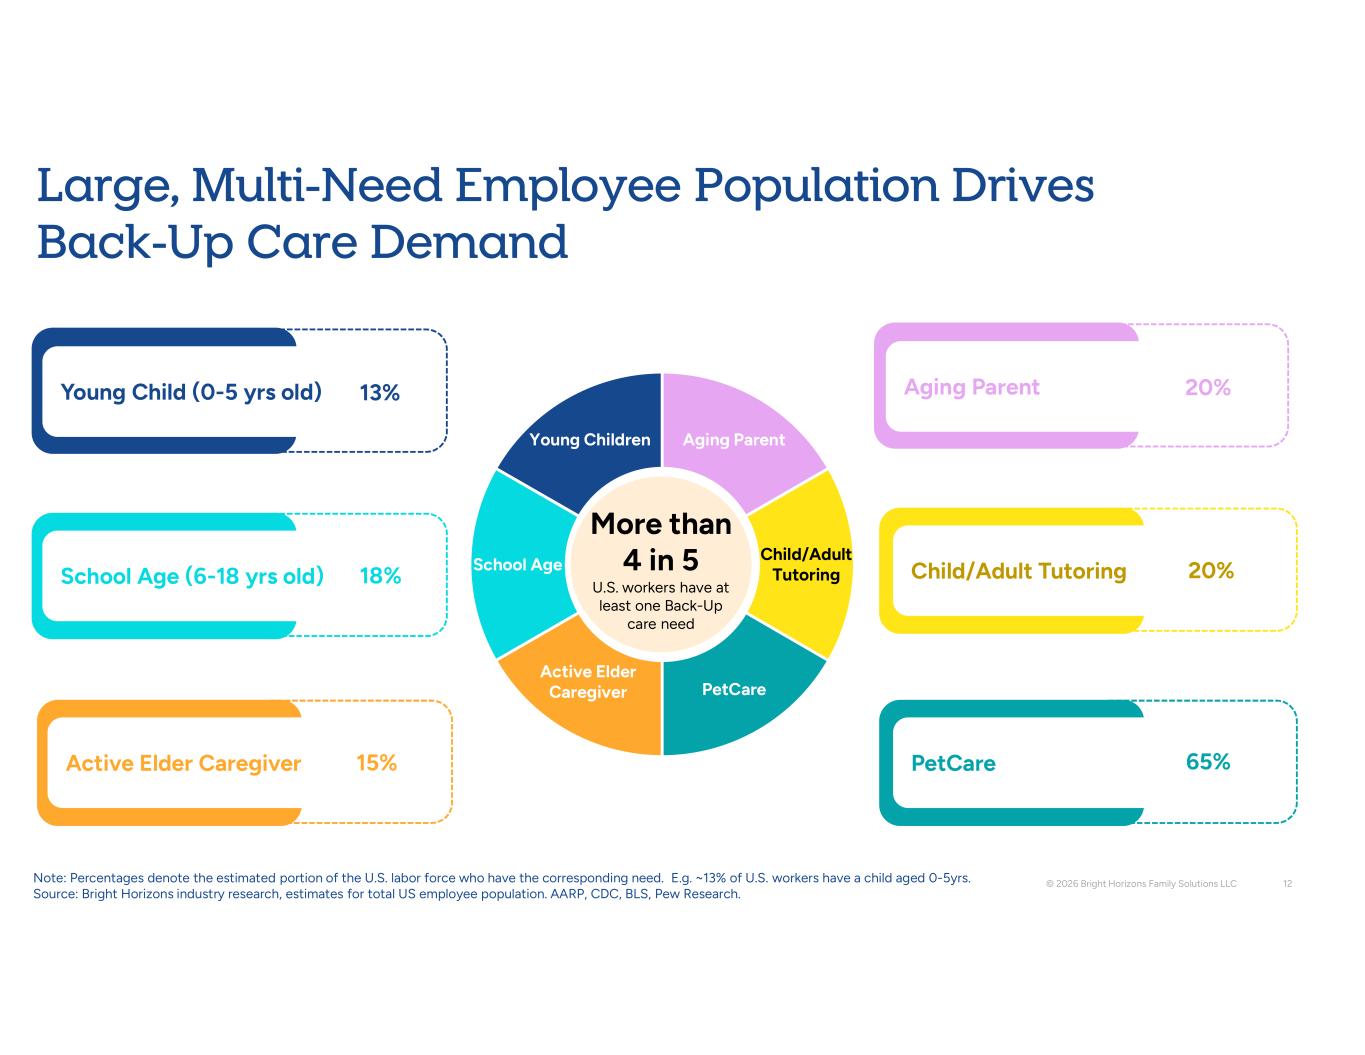
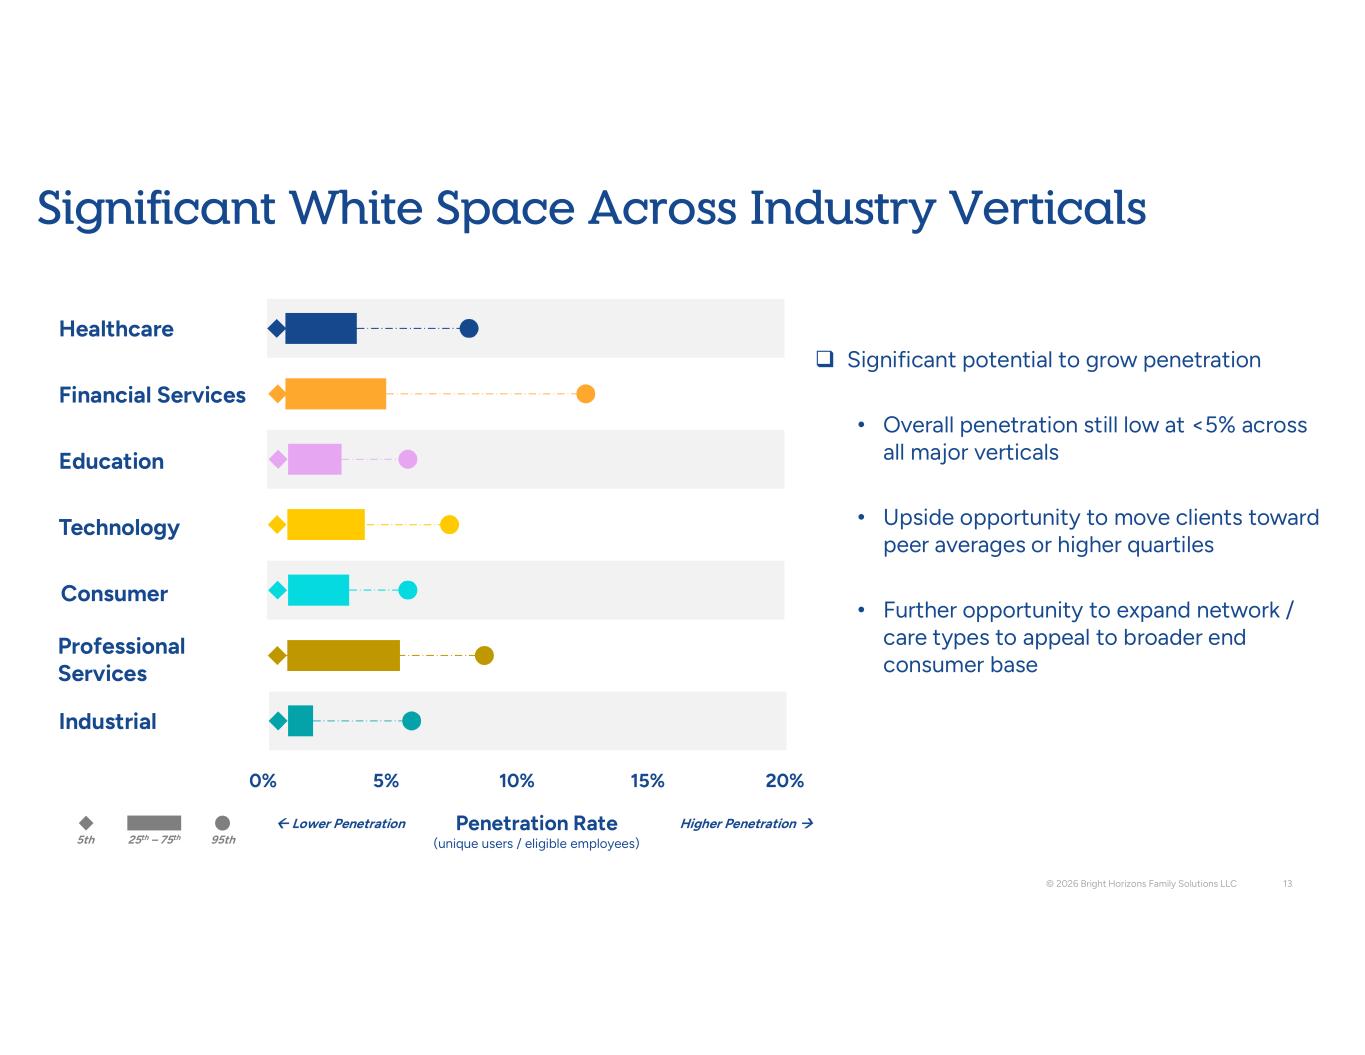
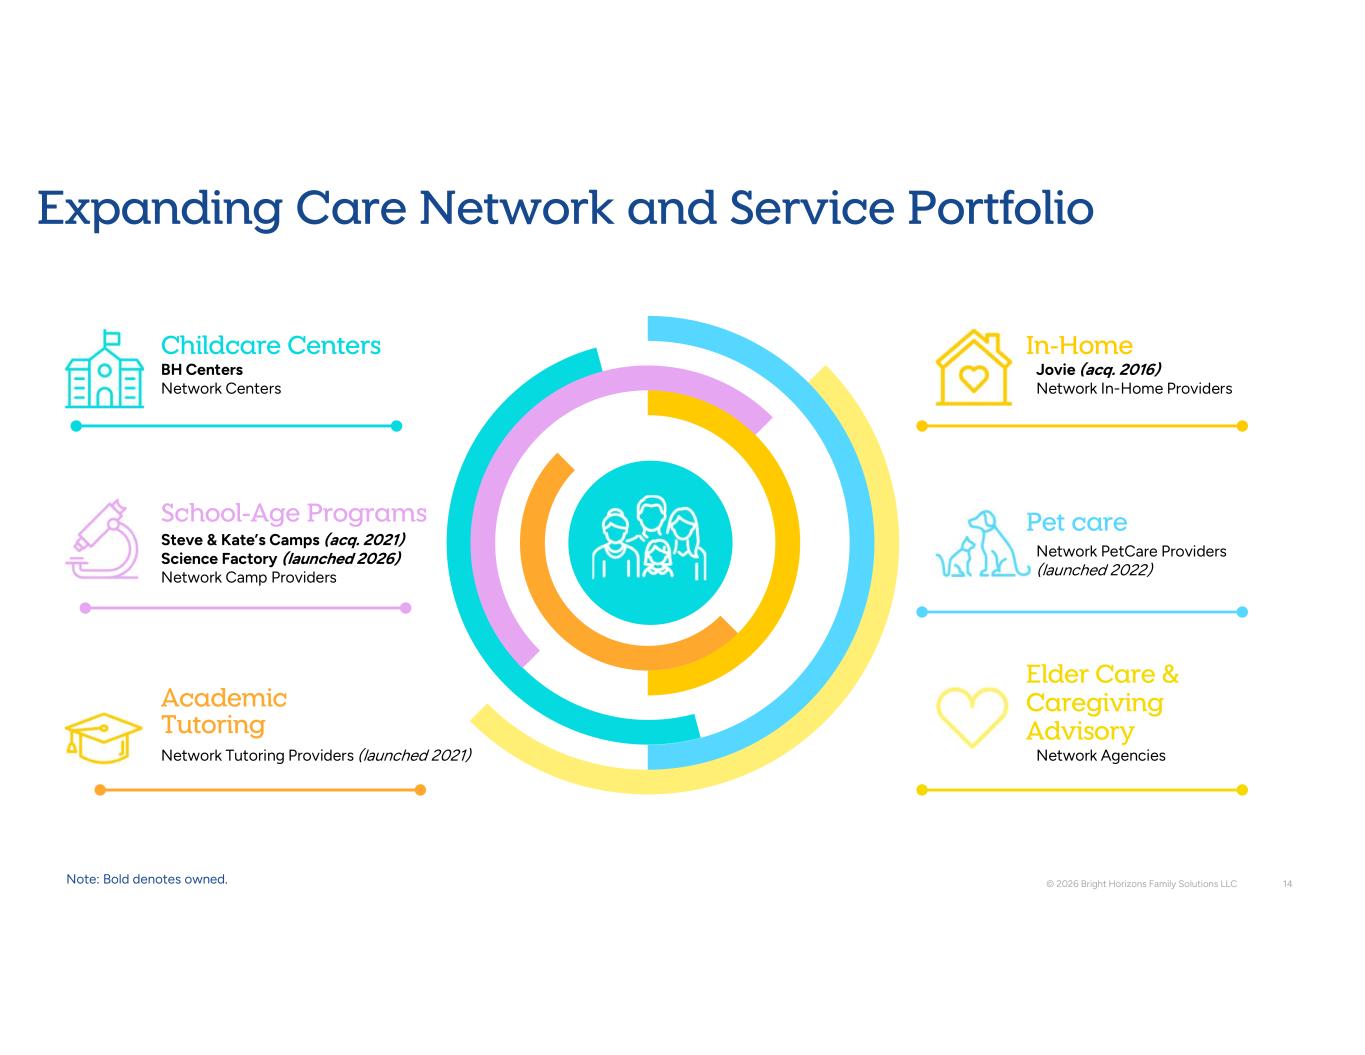
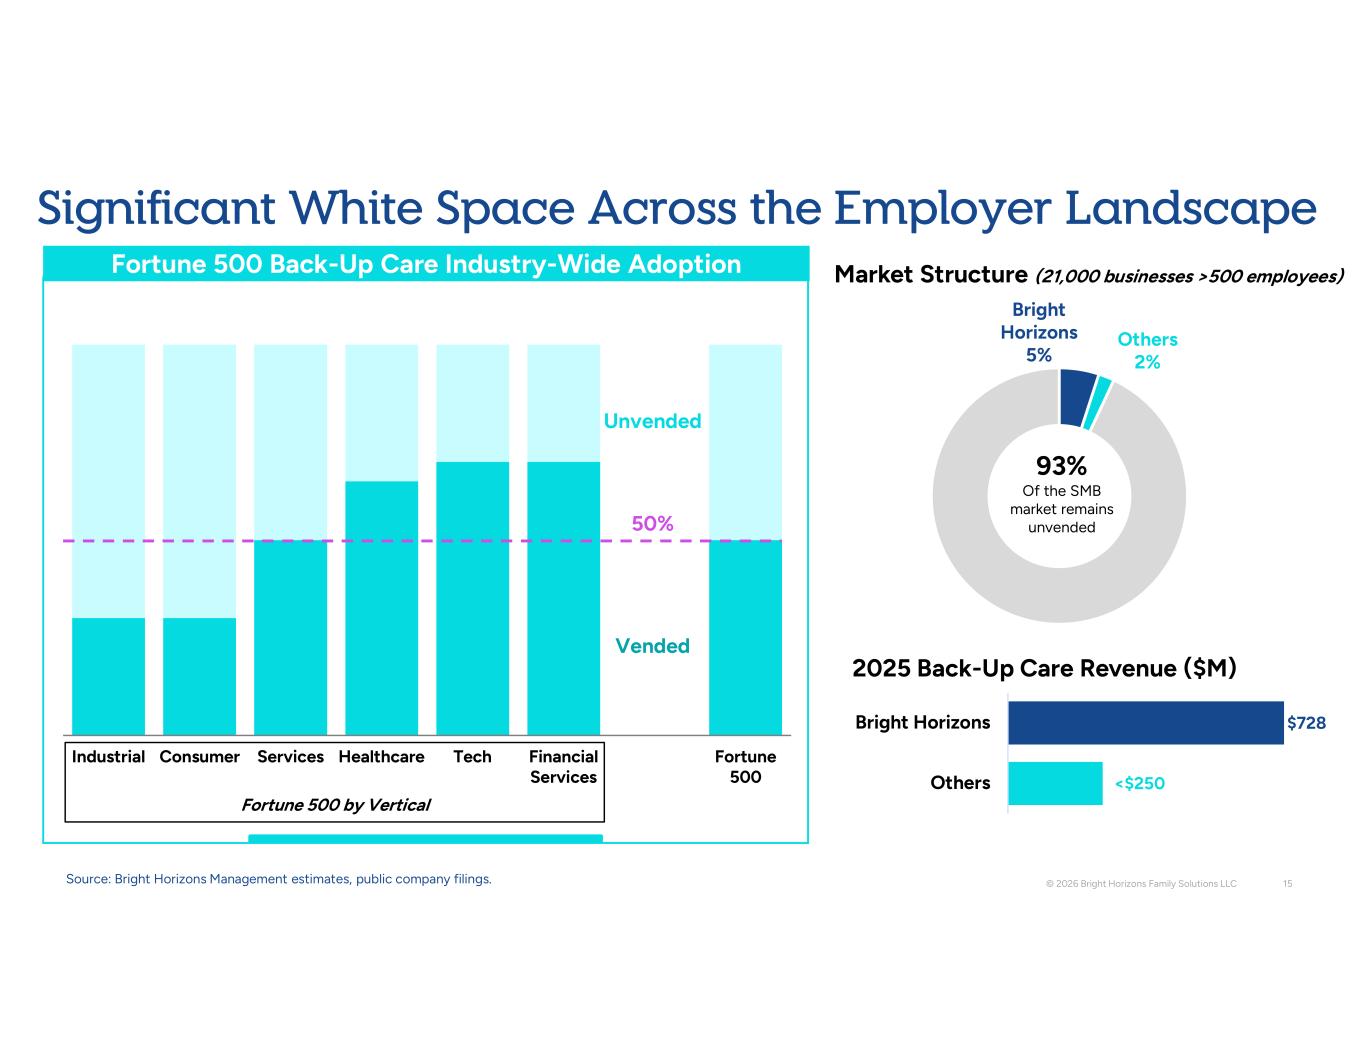
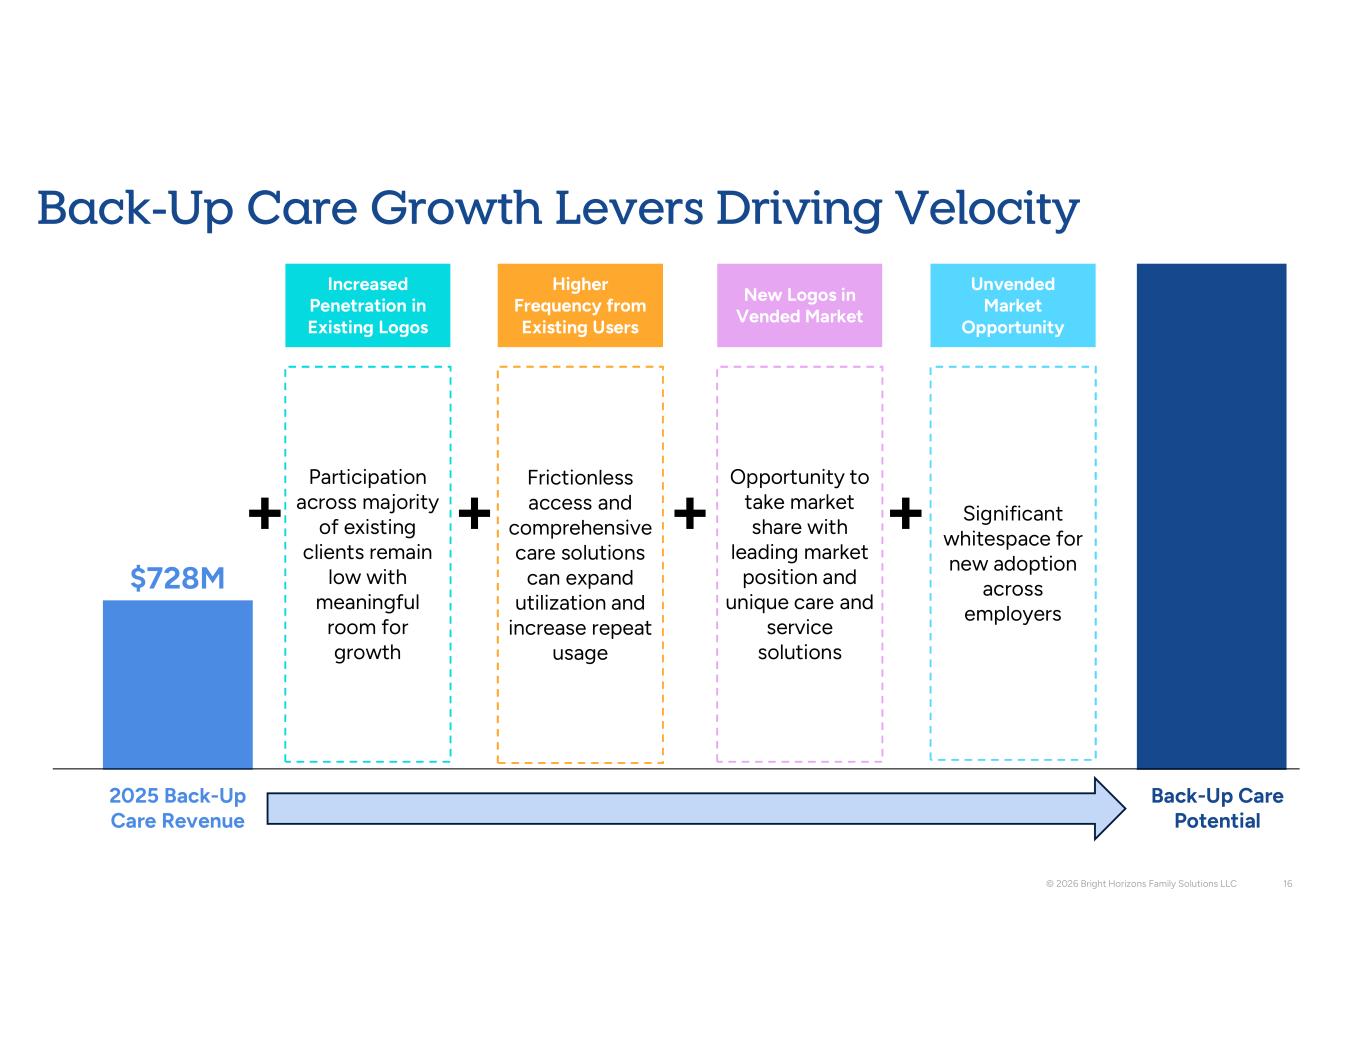
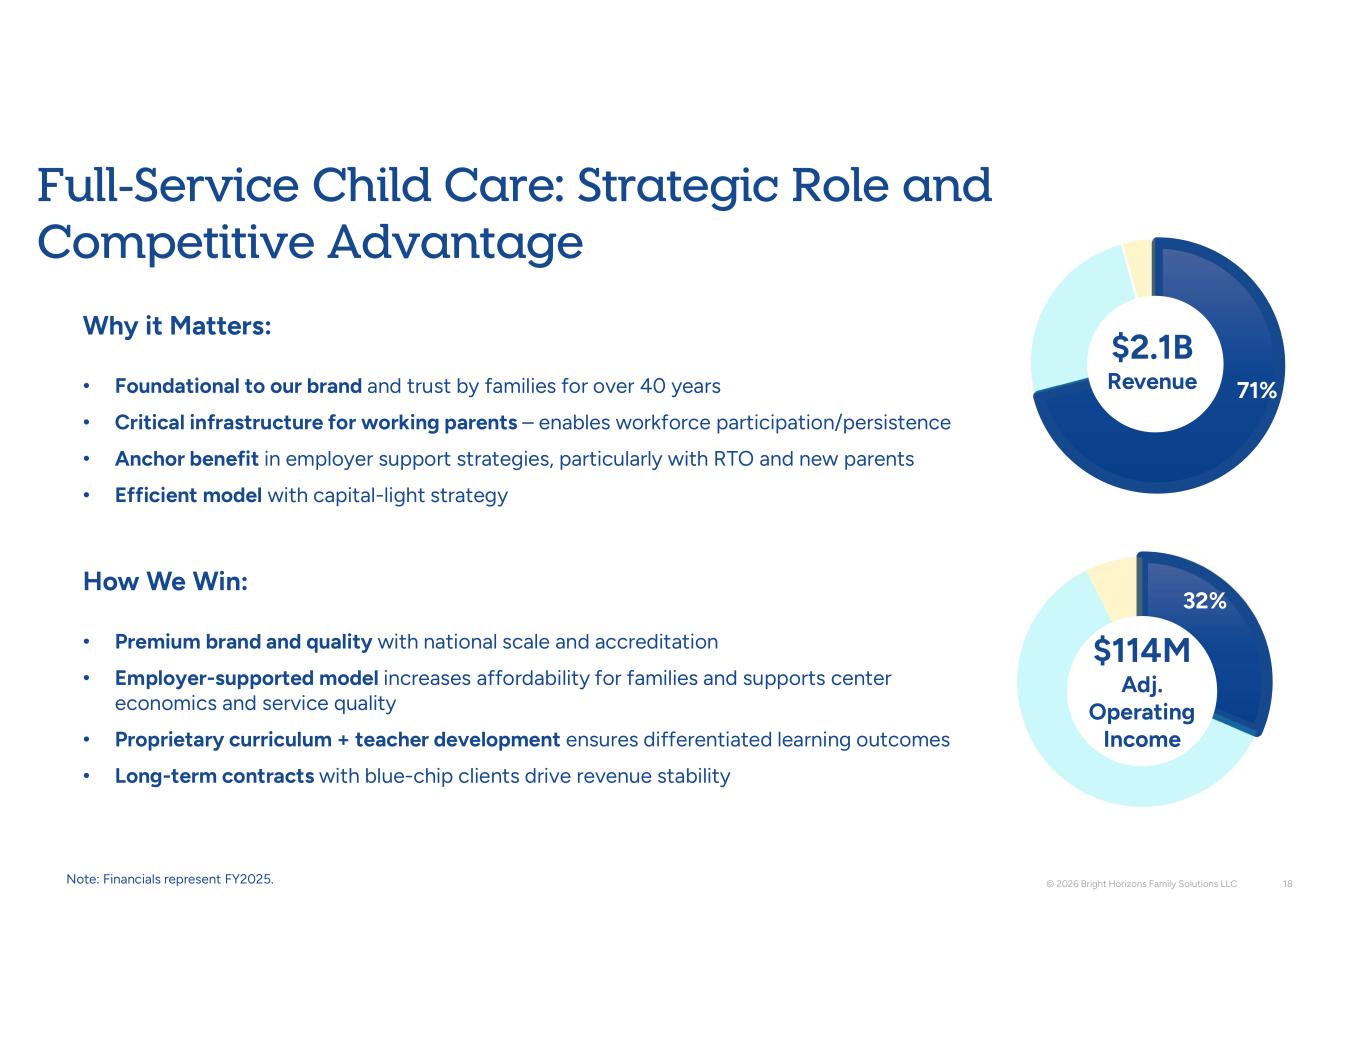
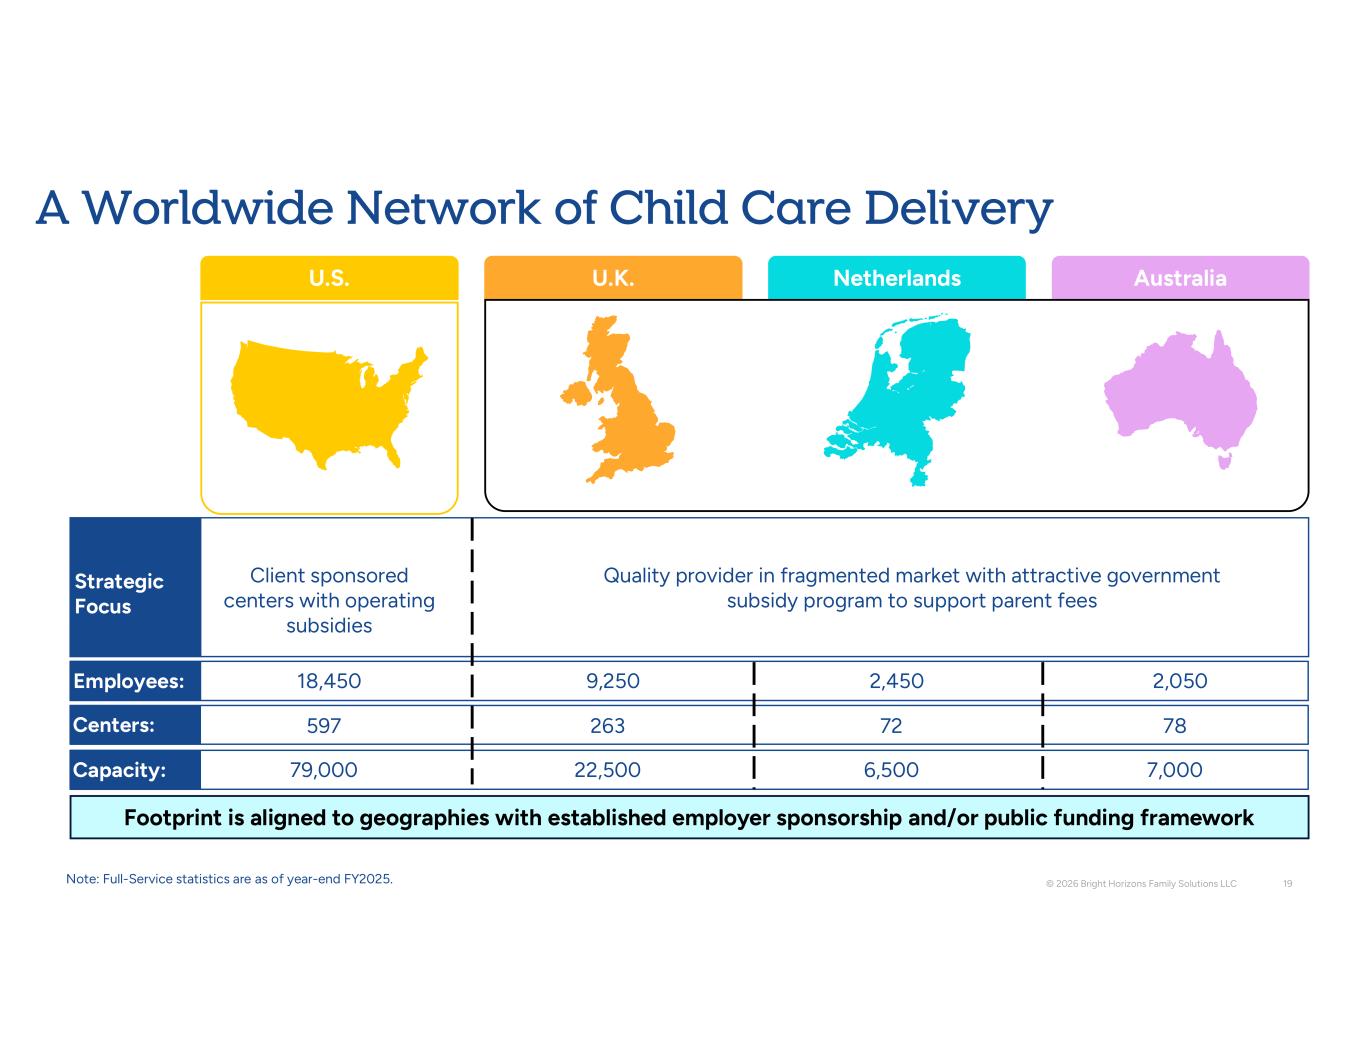
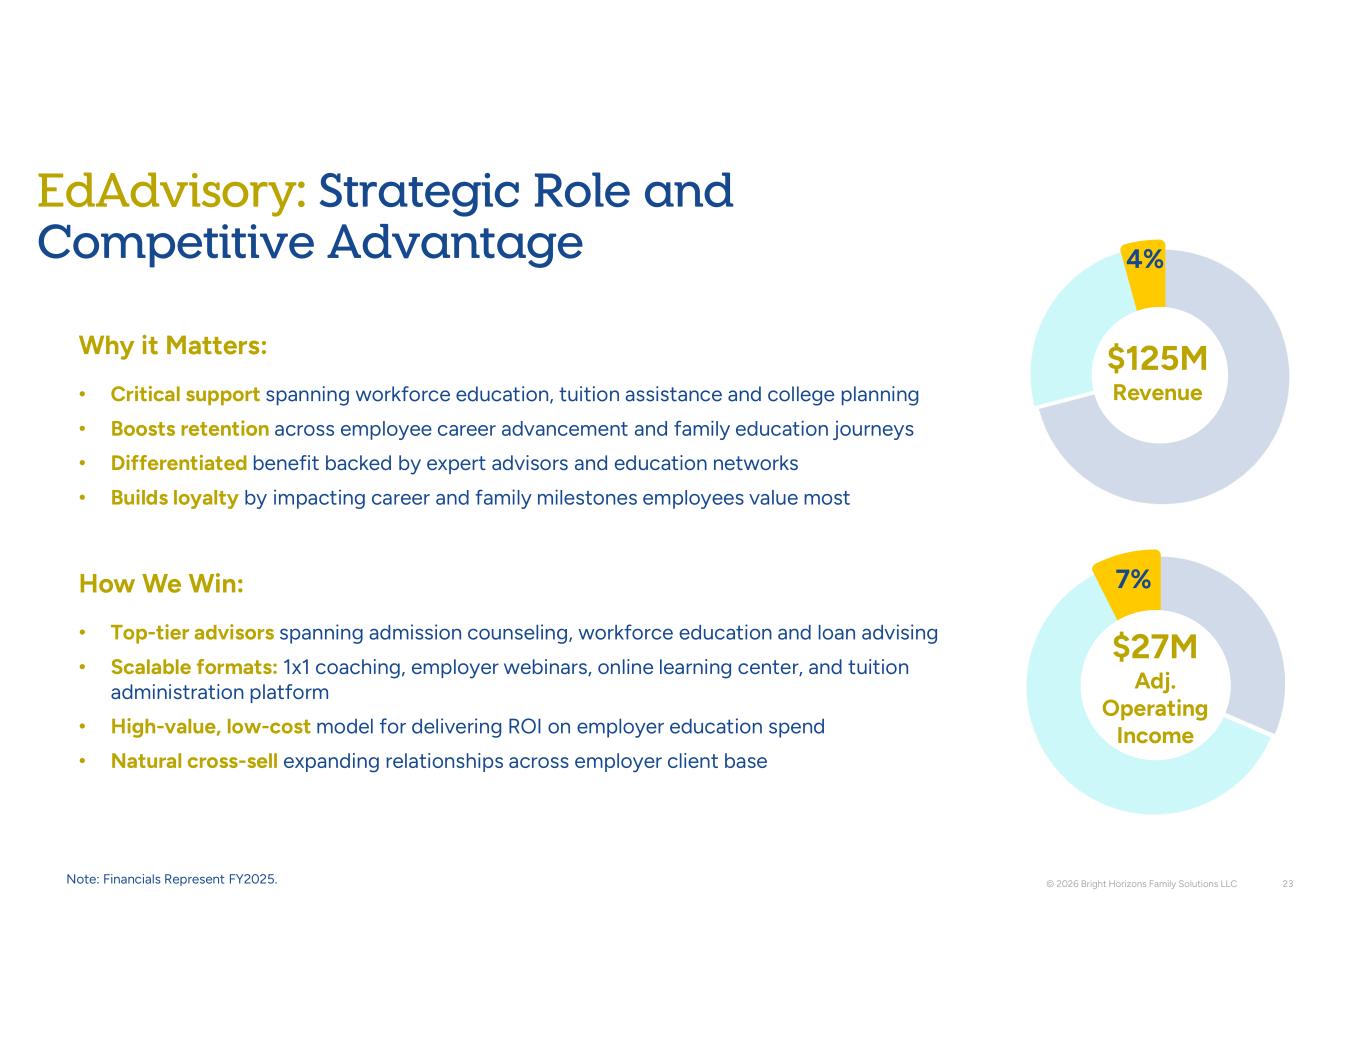
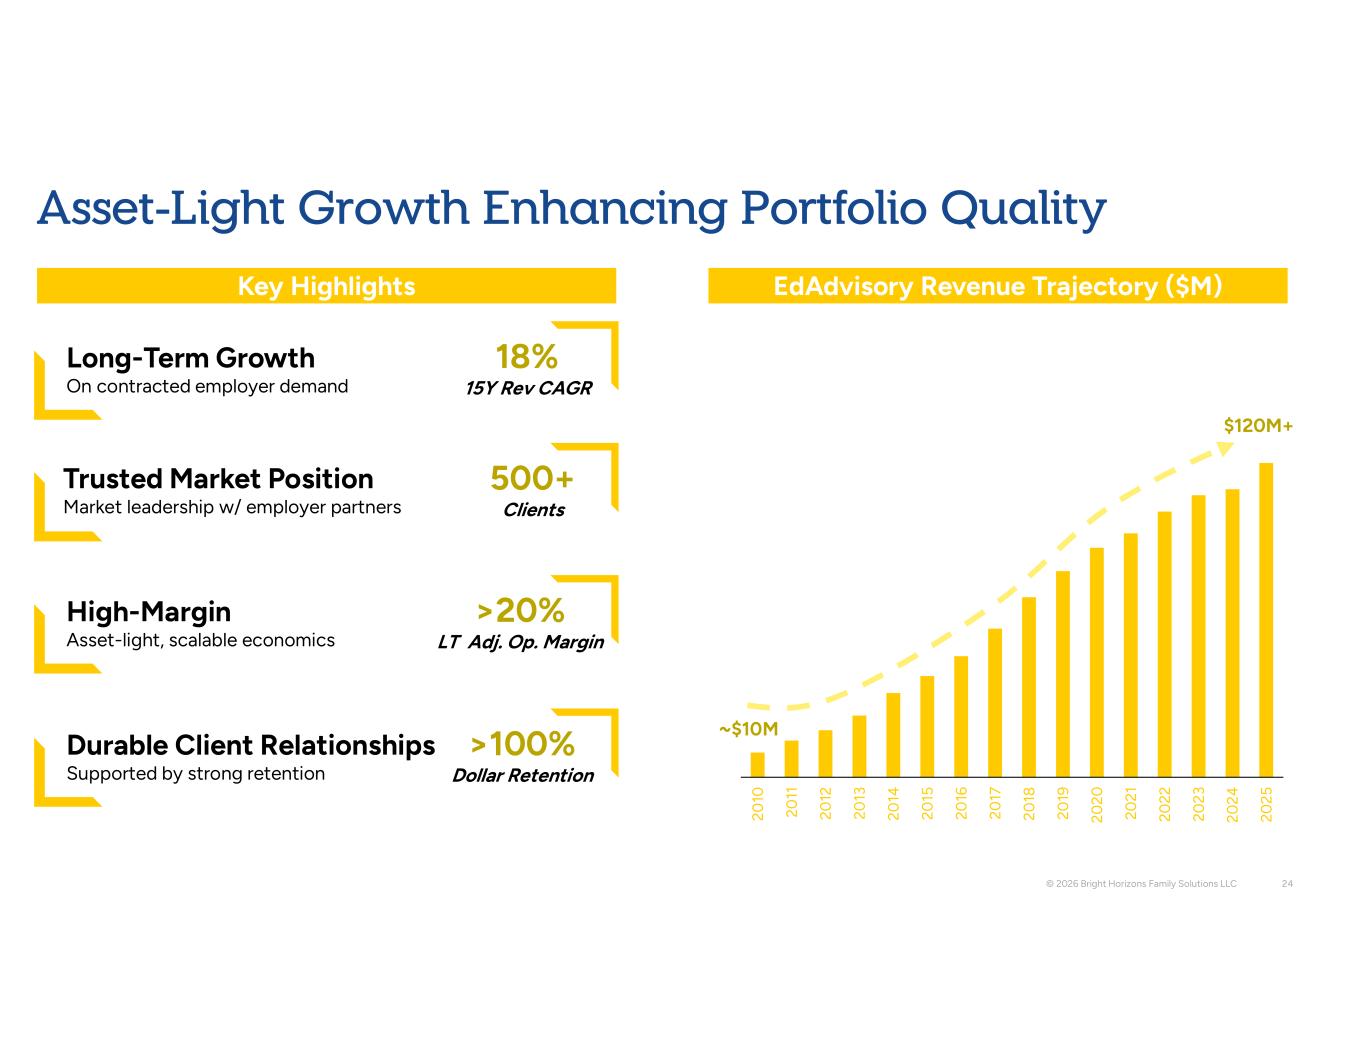
revenue grew 7% in the first quarter in line with our expectations, and earnings came in slightly ahead, reflecting continued execution across our business segments. In Q1, we delivered double-digit revenue growth and backup, expanded operating margins in full service, and made progress on transforming our education advisory business. Taken together, these results reflect the diversity and strength of our model and the enduring demand from working families and learners for the services that we provide, along with the employers who support them. Before I get into the segment results for the quarter, I want to take a different approach tonight and start by addressing the thoughtful questions we have received from analysts and investors in recent quarters. Specifically, I want to take a few minutes to highlight how our strategy post-COVID is focused on delivering long-term growth and earnings performance while increasing our impact on those we serve. Bright Horizon's unique business model centers around partnering with employers to deliver high-quality solutions that support client employees across critical life and career stages while delivering a compelling ROI for our employer clients. Over time, we have expanded our education and care offerings and more recently have sharpened our focus on the integration of our full suite of services for the benefit of our clients and their employees. To that end, we have taken steps to unify our go-to-market strategy, executed by a singular sales force and integrated account management team, and underpinned by new resources and tools. In parallel, we are developing a fully connected continuum of service, delivered through both our owned assets and trusted partners. To make that work at scale, we are strengthening our foundational capabilities Specifically, a common client-employee credit model across our offerings, an integrated CRM and consumer data platform, and ultimately a more consistent and seamless customer experience. As Mike mentioned, alongside tonight's earnings release, we've included an updated investor deck that outlines our client-centric business model, our competitive advantages, and illustrates the scope of the growth opportunity. As one example, I'll use Backup Care, our largest segment by earnings contribution. Using slides 12 through 15 in our new investor presentation, I will walk through the growth framework. Penetration within existing clients, expansion of our care and education ecosystem, and winning new logos. Starting with penetration on slide 12. User penetration is less than 5% across our client base, which highlights the significant opportunity ahead. The latent demand is substantial. More than four in five working U.S. adults have at least one care need that our backup care offering addresses. Over the last several years, we have thoughtfully listened to clients and broadened our capabilities to include an even wider range of care types, increasing relevance across employee populations. This, in turn, enables our employer partners to meet their strategic objectives of fewer vendors delivering broader and deeper value, directly aligned with our approach. We also break down penetration by industry and illustrate the dispersion within each sector on slide 13. The takeaway is clear. Penetration is low across all industries, and even within the same sector, there is wide variation, demonstrating that the opportunity is less about maturity and more about how the benefit is deployed within each client. To highlight one example, healthcare, the median client penetration is below 2%, which increases to more than 7% at the 95th percentile and exceeds 10% among our most highly utilized healthcare clients. Next, on slide 14, we illustrate that a key driver of growing utilization is the breadth of our care network. We have built an ecosystem that spans traditional child care centers, in-home care providers, school-age programs, academic tutoring, pet care, and elder care through a mix of owned assets and a vetted network of partners. Expanding that network helps us to meet more employee needs, which support adoption and retention among both new and existing users. Finally, turning to slide 15, new logos are another meaningful growth channel and backup. We estimate that 90 plus percent of the SMB market remains unvended today and roughly half of the Fortune 500 does not have a backup care solution in place. What positions us exceptionally well to capitalize on this opportunity is our ability to deliver high quality care across care types, geographies, and employee needs with flexibility, scale, and trust that are difficult to replicate. We believe this advantage becomes even more important as employer adoption continues to grow. I highlighted backup care as the example because it reflects the broader playbook across Bright Horizons. Drive deeper client and user adoption, expand the range of needs we can serve, and deliver a more connected experience for families. By way of a real-time example, we put this strategy into action this past week at our On the Horizon Summit. We hosted more than 100 clients, including HR and benefits leaders from Bank of America, Comcast, and Cone Health, to name a few. The discussion encompassed the future of employer-sponsored education and care and modern ways to deliver a unified experience for employees and their families. We received tremendous feedback from clients about the event and the innovations that we introduced. We look forward to sharing more over time, and at this point, I would like to turn back to our first quarter segment results. In backup care, revenue increased 12.5% to $145 million in the quarter, and adjusted operating margins were 18%, both in line with our expectations. Growth was driven by continued expansion in unique users with solid use across all care types. And looking ahead to the summer months and peak utilization for school-age programs, we are encouraged by continued user growth and the visibility of use through early reservations for the second and third quarters. Turning to full service, revenue grew 6% to $541 million in line with our expectations. Growth was driven by a combination of tuition increases and a tailwind from foreign exchange, partially offset by center closures as we continue to rationalize the portfolio. We opened two centers in the first quarter, one in the Netherlands and our third location for Toyota here in the United States. Occupancy averaged in the mid-60% range in Q1, improving sequentially from the fourth quarter and the prior year. Enrollment growth in centers open for the last year was modestly positive in the first quarter. This included approximately 100 basis points of headwind from our Australia operations, where we experience an elevated enrollment decline in this group of 78 centers. In contrast to our other geographies, our Australia portfolio's occupancy has drifted lower in the years following the pandemic. And this quarter, the enrollment contraction was much more significant than prior year's school year transition cycle. With the broader Australian ECE industry also experiencing meaningful weakness in 2026, we expect a more challenged enrollment picture and overall performance profile as we look to the rest of the year. More broadly, we remain encouraged by the sequential improvement in occupancy across our network of centers, the continued recovery across our middle and lower cohorts, and the improved operating margin we drove this quarter, despite a headwind from Australia. Our focus remains on expanding our enrollment with improved consumer experience and quality value, achieving improved operating leverage and operating efficiency, and rationalizing the center portfolio where appropriate. As previewed on our call in February, we closed 24 centers this quarter as we continue to position our portfolio to serve employees of our client partners and working parents where they live and work. Our education advisory business delivered revenue of $27 million in the quarter and increased 2% over the prior year. Notable new client launches in the quarter included NXP Semiconductors, Visa, and Huntington Bank. And we continue to be focused on driving participant growth and use across our college coach and ed-assist services. So to close, our Q1 results demonstrate solid demand and execution across the business. We remain encouraged by the progress we are making in our core operations while maintaining financial and operational discipline. As such, we are reaffirming our 2026 full-year revenue guidance range of $3.075 billion to $3.125 billion and our adjusted EPS guidance range of $4.90 to $5.10 per share. With that, I'll turn the call over to Elizabeth, who will dive into the quarterly numbers and share more details around our outlook.
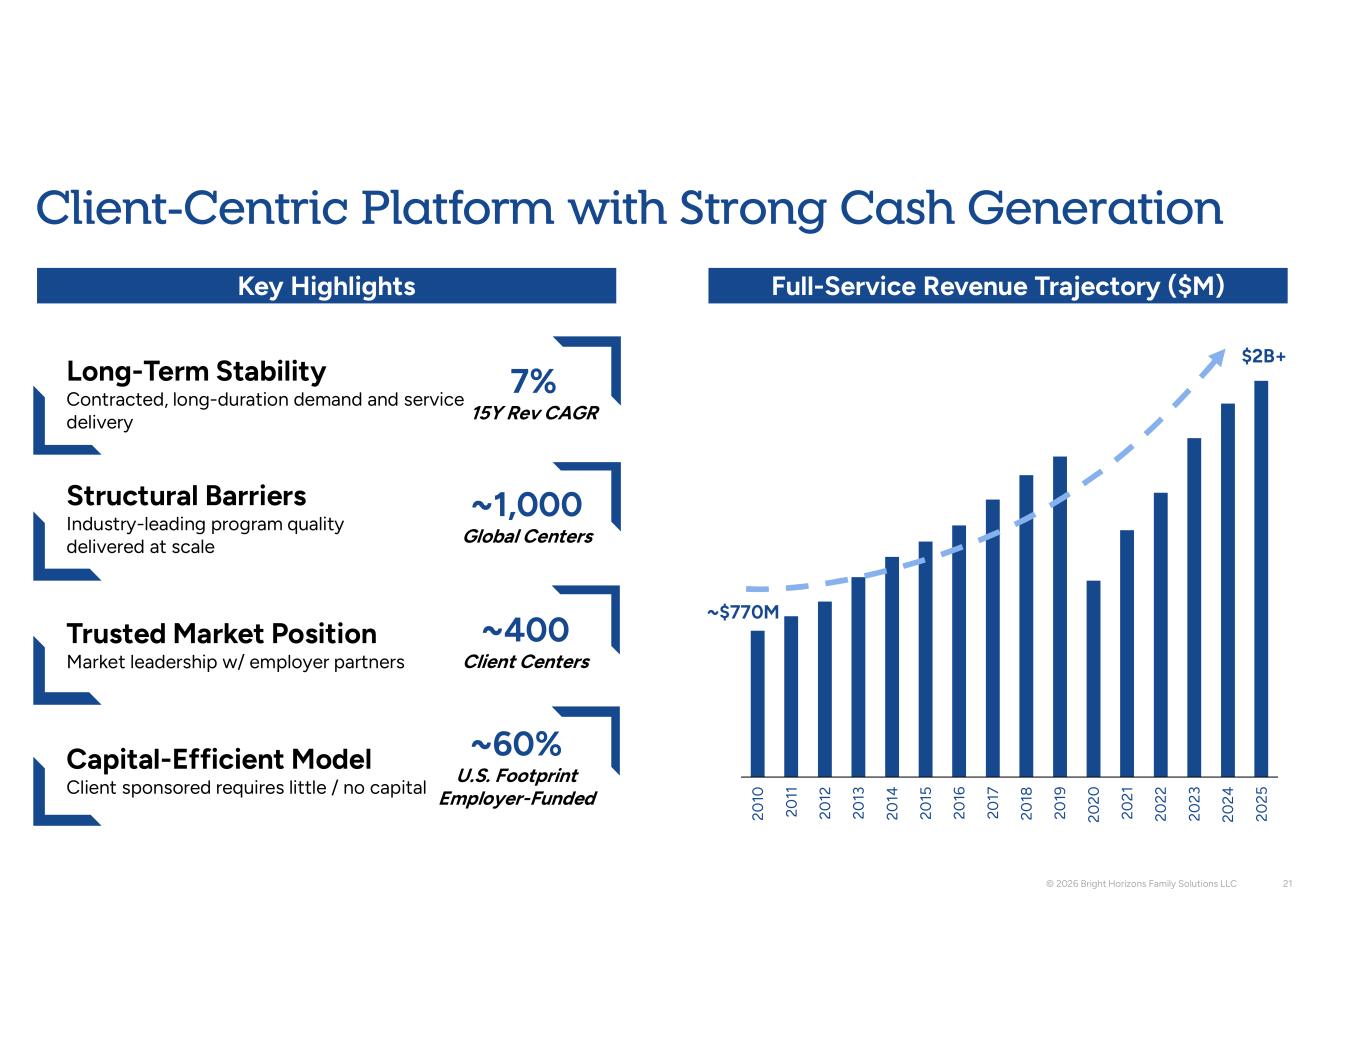
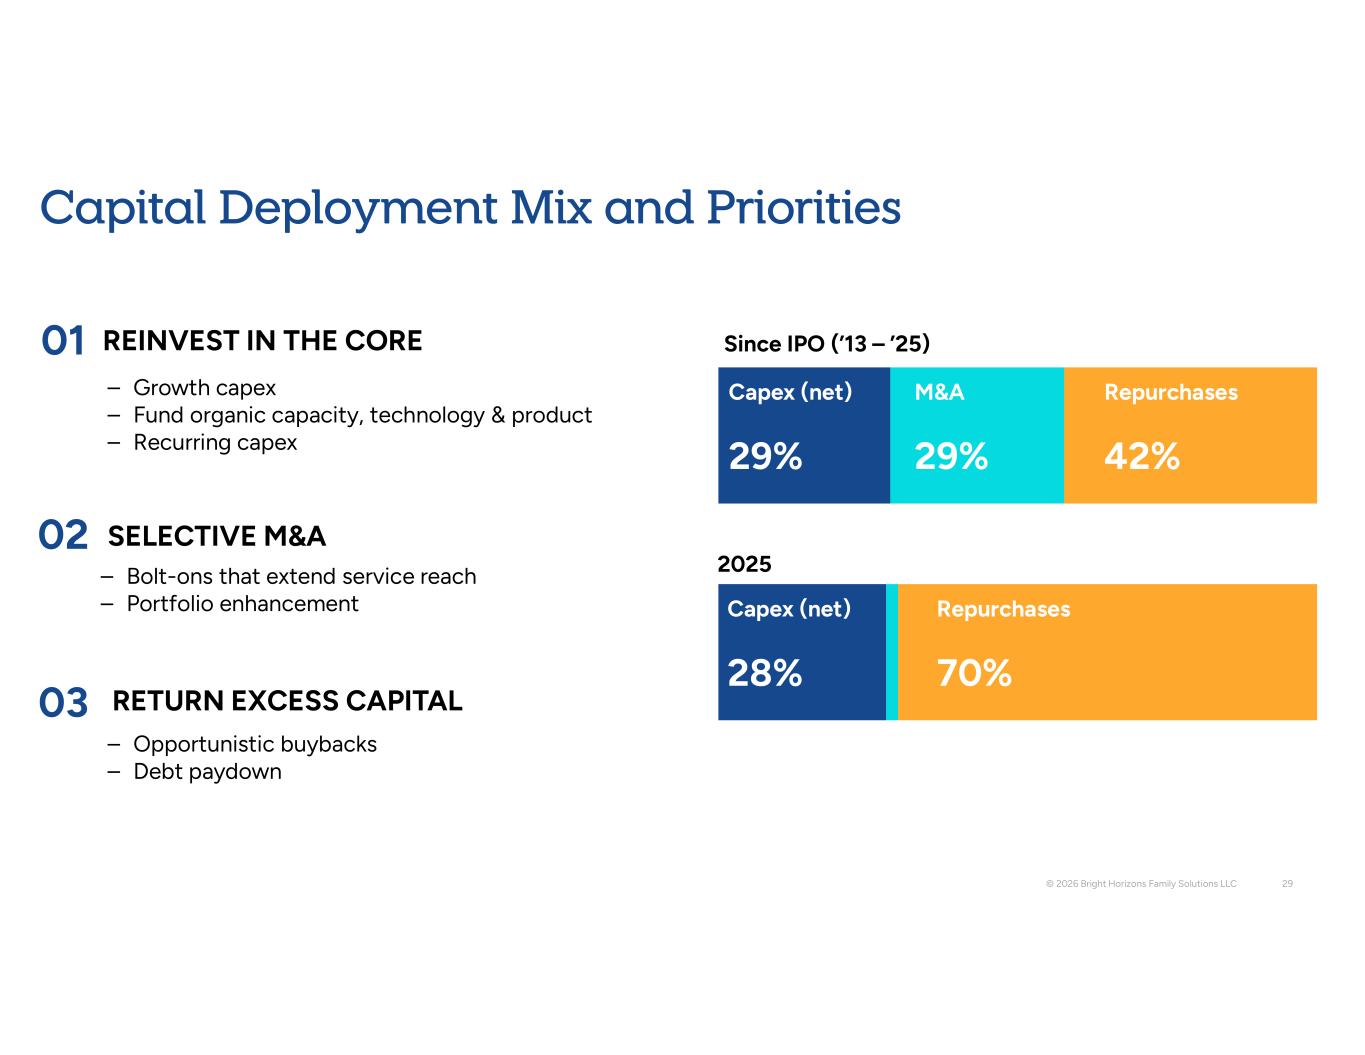
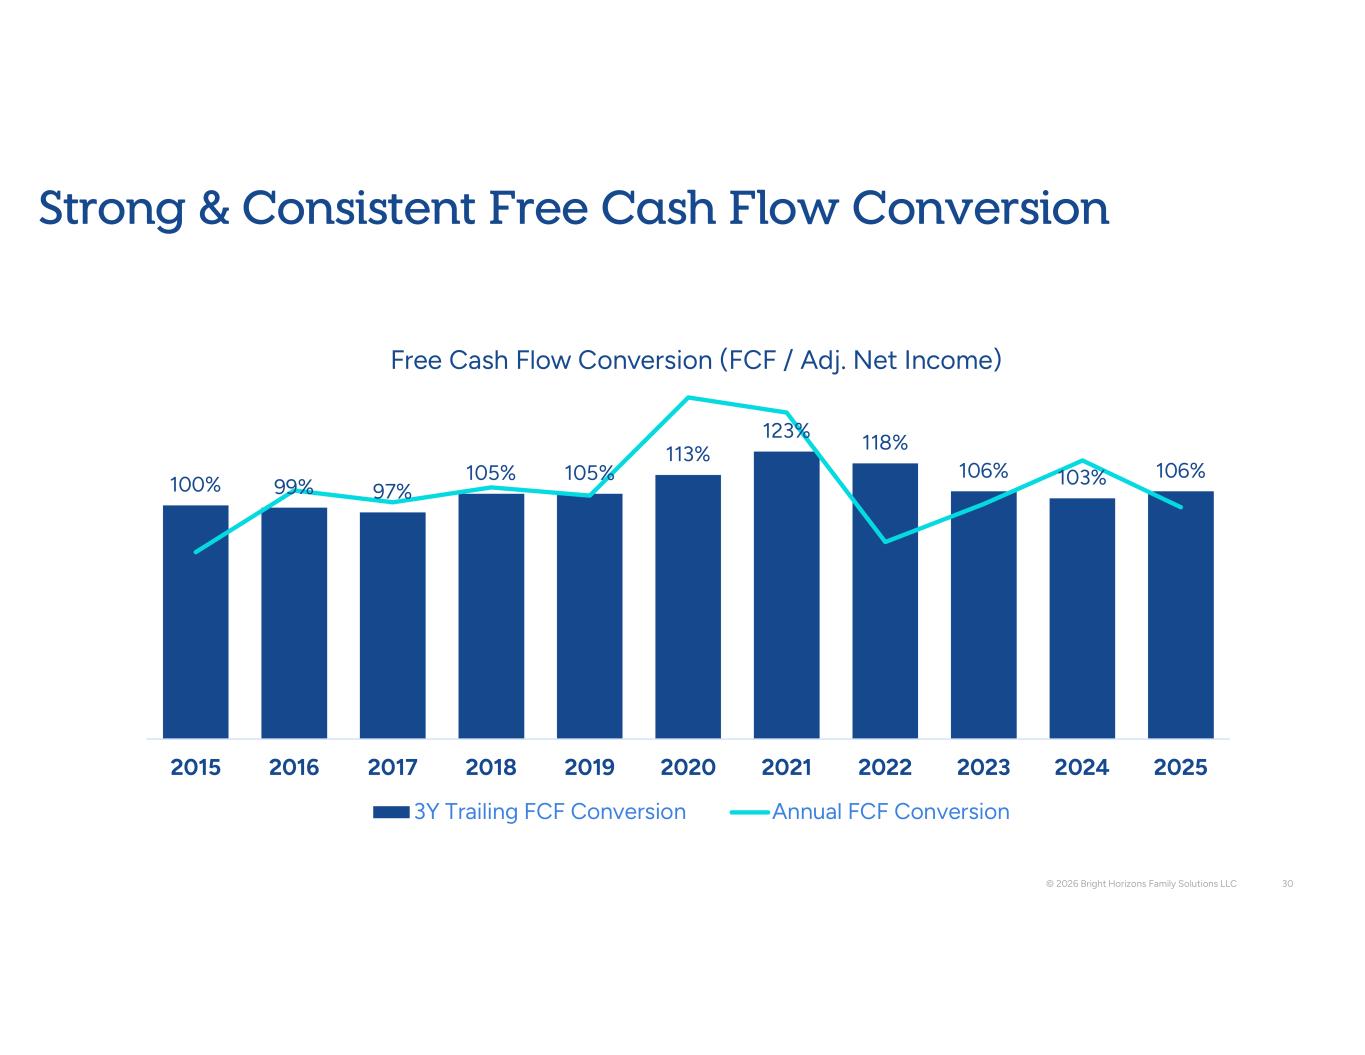
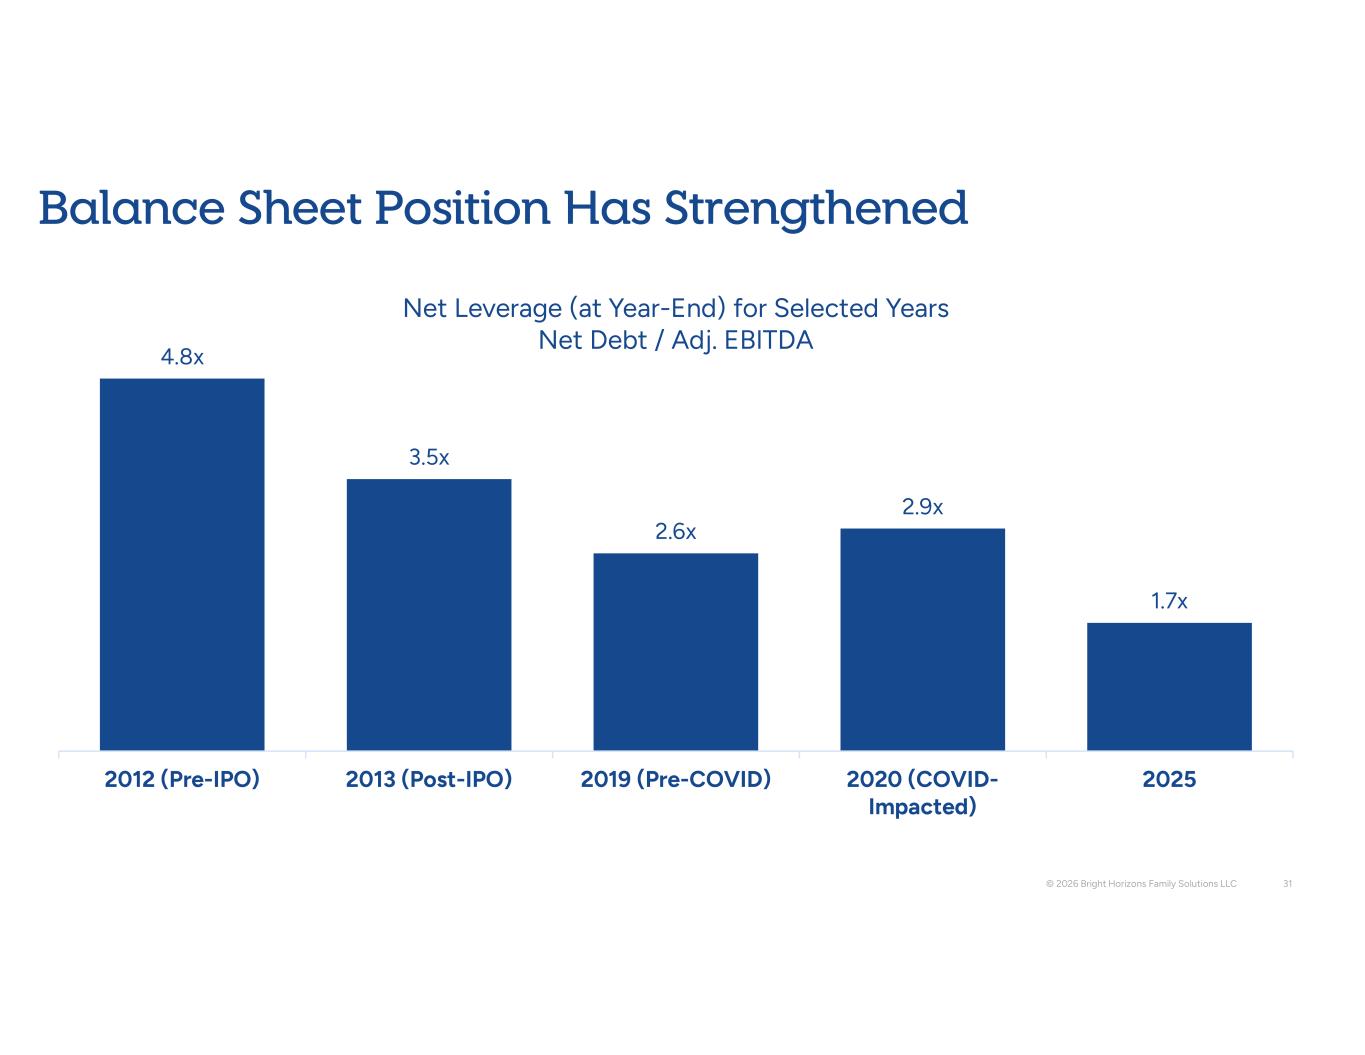
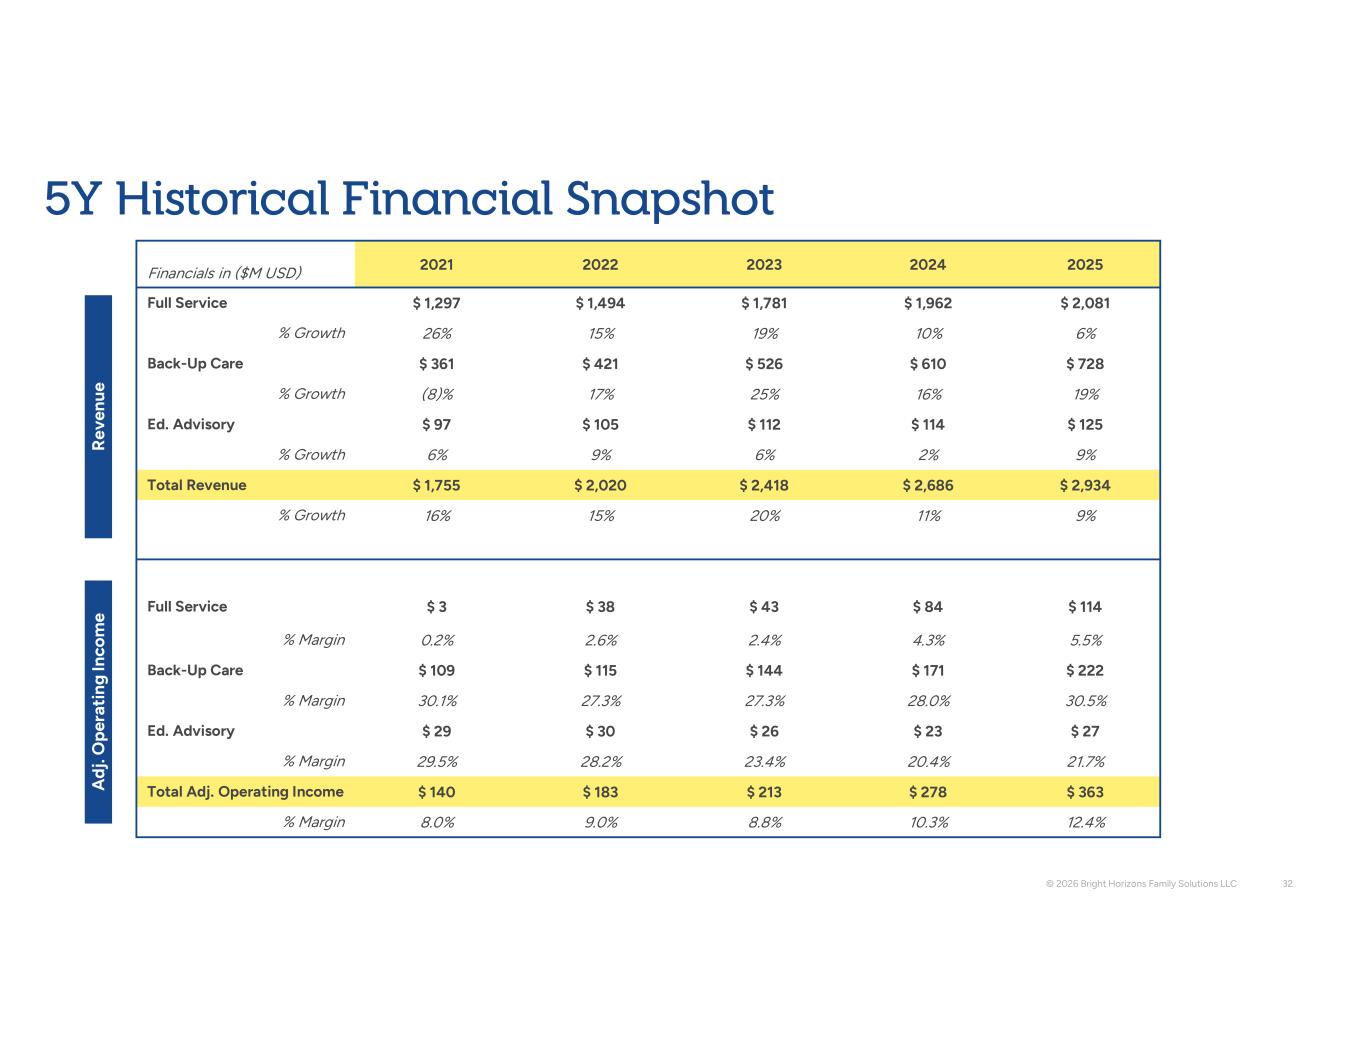
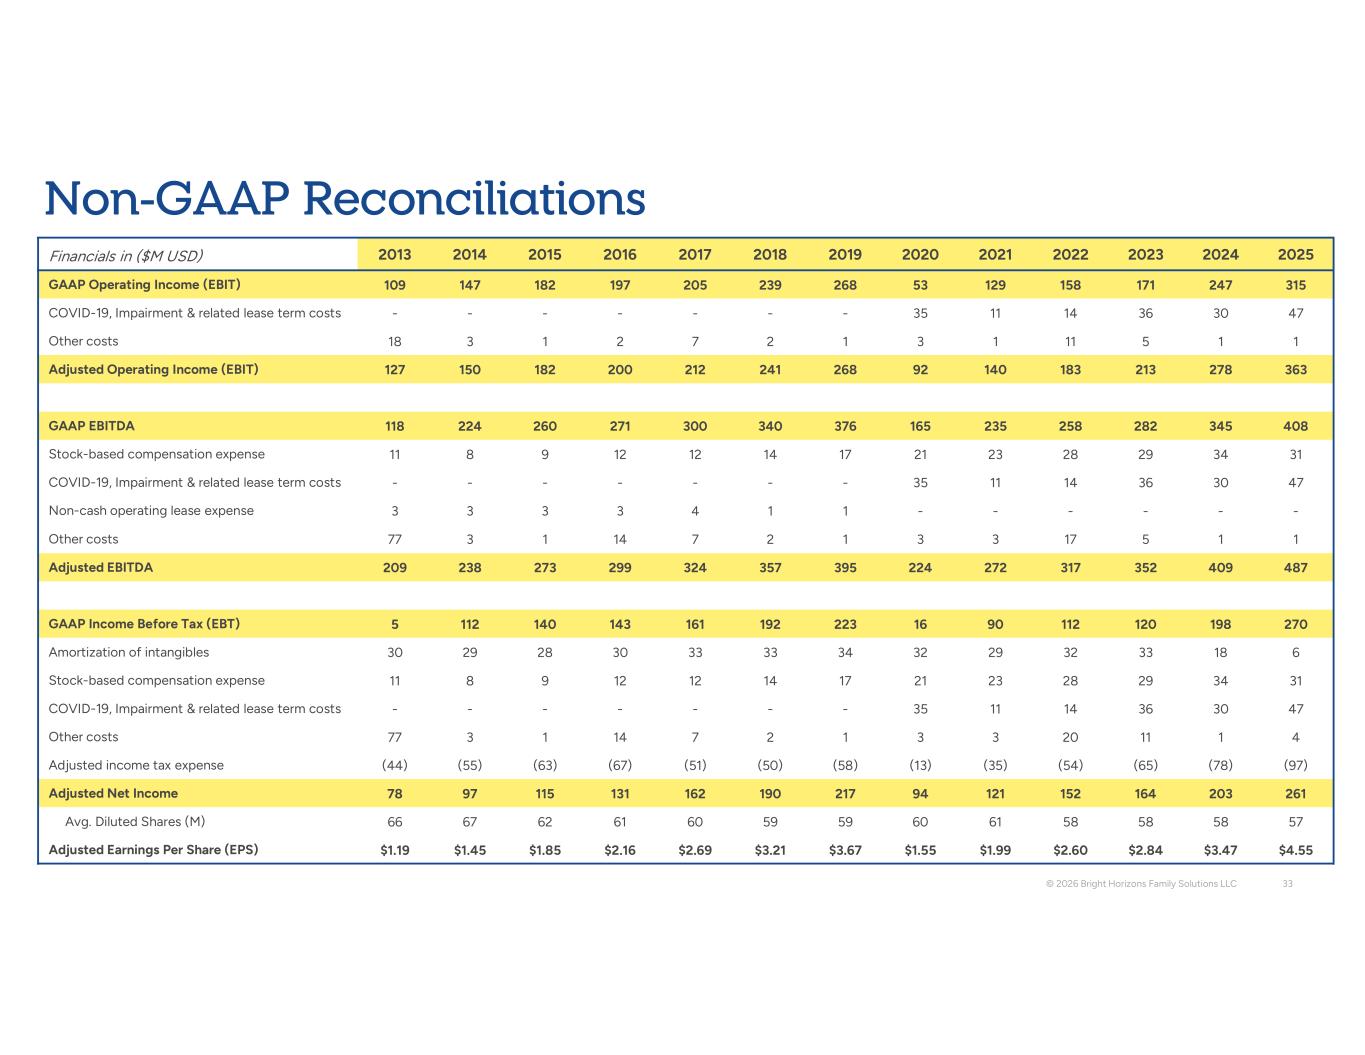
Thanks, Stephen, and hello to everyone who's joined the call. I'll start with our financial highlights. Revenue in the first quarter was $712 million, representing 7% growth year over year and in line with our expectations. Adjusted operating income of $65 million increased 4% over the prior year quarter and represented 9.1% of revenue. Adjusted EBITDA of $96 million also grew 4% and came in at 13.4% of revenue. Adjusted EPS of $0.82 a share rose 6% over the prior year quarter and finished slightly ahead of our guidance set at $0.75 to $0.80. Taking a closer look at each of our three business lines, backup revenue grew 12.5% in the first quarter to $145 million. Increased users and expanded use within existing clients continues to drive the majority of the growth. And Q1 marked the 16th consecutive quarter of double-digit top-line growth. adjusted operating margins were 18 percent in the quarter which we expect at this time of year when use is seasonally lower as we move into the higher use quarters over the rest of the year we gain operating leverage and we continue to expect to see margins achieve our full year target of 28 to 30 percent turning to full service revenue of 541 million expanded six percent over the prior year quarter, driven primarily by tuition increases, enrollment gains, and a tailwind from foreign exchange, which were all partially offset by an approximately 250 basis point headwind from the impact of closed centers over the past year, and to a lesser extent, to enrollment declines in Australia. During the quarter, we had net closures of 22, resulting in a center count at quarter end of 988 centers. As Stephen mentioned, enrollment in centers open for the last year was modestly positive in the first quarter, although it would have increased roughly 100 basis points without the enrollment contraction we experienced in Australia. Occupancy averaged in the mid-60s range, increasing from both the fourth quarter of 2025 and the prior year period. With respect to the center cohorts we've discussed on prior calls, we also continue to see improvement over the prior year. Our top performing cohort, that is seven centers that are above 70% occupancy, improved from 47% of these centers in the first quarter of 2025 to 48% in the first quarter of 26. And more notably, our bottom cohort, centers below 40% occupancy, has now fallen below 10% of these centers, improving from 13% in the prior year to 8% this quarter, reflecting both enrollment progress and the results of our focus on closing underperforming centers. Adjusted operating income of $37 million in full service increased $4 million over the prior year and represented 6.8% of revenue, an expansion of 30 basis points. Tuition increases ahead of average wage costs and continued progress in our UK operations drove the margin expansion. That said, reported margin improvement was meaningfully constrained by the enrollment and operating challenges in Australia. Excluding this effect in Australia, margin expansion would have been more than 50 basis points over the prior year. Given the current operating performance and outlook for the rest of this year, we expect Australia to remain a larger headwind to reported margin of performance than we had originally expected. Our educational advising segment had revenue of $27 million, an increase of 2% from the prior year quarter, and adjusted operating margins of 9%, which were broadly consistent with the prior year quarter. Interest expense rose to $12 million in Q1, up from $10 million in the prior year quarter due to higher average interest rates as well as higher average borrowings on elevated share repurchases in the quarter. The structural effective tax rate on adjusted net income was also 27.5%, consistent with Q1 of 2025. According to the cash flow statement, we generated $108 million in cash from operations and made net fixed asset investments of $20 million, resulting in free cash flow of $88 million. Over the last 12 months, free cash flow was $276 million, representing a 106% conversion relative to adjusted net income. As mentioned, in Q1, we opportunistically repurchased $225 million of stock, funding the buybacks with free cash flow and incremental revolver borrowings. As of the end of the quarter, $577 million remains on the new repurchase authorization that we announced in March. Lastly, we ended Q1 with $133 million of cash and a leverage ratio of 1.9 times net debt to adjusted EBITDA.
Operator
Now moving on to our 2026 outlook.
We are reaffirming our 2026 full year guidance for revenue in the range of $3.075 to $3.125 billion and adjusted EPS to be in the range of $4.90 to $5.10. Our guidance does not include the effects of any additional share repurchases on either interest expense or on the share count. If we look at a segment level, in full service, we expect reported revenue to grow in the range of 2.5% to 3.5% on enrollment gains and tuition increases, offset by approximately 200 basis points of headwind from net center closings and approximately 100 basis points on reduced expected performance from our Australia operations. In backup care, we now expect reported revenue to increase 12 to 14 percent, driven by the continued expansion of use. And lastly, in ed advisory, we expect to grow in the mid-single digits. Lastly, on the full-year guidance, we are now estimating full-year interest expense of $50 to $52 million and an adjusted effective tax rate of 28 to 28.5 percent, up approximately 100 basis points from our prior guide. As we look specifically to Q2, our outlook is for total top-line growth in the range of 5.25% to 6.5%. Breaking that down by segments would be full-service reported revenue growth of 2.5% to 3.5%, backup growth of 15% to 17%, and ed advisory in the low single digits. In terms of earnings for Q2, we are expecting adjusted EPS in the range of $1.17 to $1.22. So with that, Stacey, we are ready to go to Q&A.
Operator
Thank you. We will now be conducting a question and answer session. If you would like to ask a question, please press star 1 on your telephone keypad. A confirmation tone will indicate your line is in the question queue. You may press star 2 to remove yourself from the queue. For participants using speaker equipment, it may be necessary to pick up your handset before pressing the star keys. Your first question comes from Jeff Mueller with Baird. Please go ahead.
Yeah, thank you. I think you raised the backup care annual revenue guidance. Correct me if I'm wrong, but was that on the back of or driven by the early backup care reservations for Q2 or Q3, or what was it, and just how much visibility at this point do you have, I guess, into summer usage?
Sure. Thank you for the question, Jeff. So, we certainly raised the guidance, right? So, the previous guidance was from 11 to 13 percent for the year. Now, we're at 12 to 14 percent for the year, and it's really based on our conviction around the momentum that we have around active users as well as their use patterns. As you rightly noted, we have a large swath of our clients that have extended windows for reservations going into the summer. And so we do have good visibility around those reservations. And based on our historical trends, we believe that it was prudent to increase the guidance.
Got it. And then just help us understand the fundamental issue in Australia, if it's supply demand or immigration or affordability and alternatives, just what's the issue? And is there any reason to think it's cyclical versus kind of the front end of a more structural headwind?
Sure. So happy to talk a little bit about the Australia piece, which is, look, I think that the first thing that is important to start is that we entered that market back in 2022, and we were attracted to the market given the third-party funding support that existed. And in the case of Australia, it was really around government. And at the time, we had the opportunity to acquire a high-quality leader in Only About Children. At the time, they enjoyed and we enjoyed high occupancy rates. And in fact, the sector in general enjoyed high occupancy rates, and the challenge that we were looking to ameliorate at that time was really one around the workforce and labor, specifically around quantity of labor as well as the costs. We expected that that would ameliorate over time. That hasn't ameliorated as well over time. And the enrollment since 2022 has been on a slow degradation path over that time period. And what I would say, Jeff, is that different from other geographies, we saw pretty steady increases in supply in the post-COVID period, right? So, in that market, There was an acceleration of supply that came into the market, and so certainly would highlight the fact that the saturation rates of child care got higher, especially in the key markets in which we operate. And so then, you know, we turned to Q1, and the enrollment degradation was sharper in Q1 than we would have expected. It's certainly a time of year in Australia where families typically transition to school and new enrollments backfill. But ultimately, we had quite a typical lever dynamic, but we didn't see the level of new starters. And so hopefully that encapsulates the challenges that we see, and we really do see them as different from other geographies in which we operate. Got it.
Operator
Next question, Andrew Slainerman with J.P. Morgan. Please go ahead.
You're keeping the guide in line with your...
So, yes, to answer the question, we had a pretty significant share repurchase cadencing Q1, and so that is adding a tailwind to the earnings results, although with the offset, we do have a bit higher interest expense because of the financing of it in the near term, But it will continue to be accretive over time. But this year, it would be contributing, you know, on the high single digits, call it, you know, sort of 8% net of the, or 8 cents, sorry, net of the interest expense that we've incurred. So, that's a positive to the business that is also contributing. I think that the other factor besides Australia's performance or besides the operating performance is that because the position in Australia is one of loss making, we have a non-deductibility of all those losses. So it has a more amplified effect in the year. So compared to our previous guide, it's close to 20 cents of an impact just from Australia between the operations and the tax impact.
Well, the share repurchase is adding, call it, $0.08 or so.
Operator
Next question, Jeff Silver with BMO Capital Markets. Please go ahead.
Thank you so much. You mentioned that backup care margins tend to be a little bit softer in the first quarter, but they were still down on a year-over-year basis. Is there something specific that happened this quarter relative to last year?
No, not really. It's somewhat mix-dependent, Jeff. It is a relatively low-use quarter, and so it's dependent on the, you know, more days out and school vacation week rather than the intensity of school-age care that we see over the summer. So depending on the center in-home, you know, different care types mix of that different provider network. So it's just down to that mix.
Okay. If I could shift over to a full-service center, I know it's a bit early, but can we get any gut color on how signups are for the fall enrollment period?
Yeah, I think it's fair to say that we're seeing a sort of similar cadence to how we closed out last year. And so as we look through this year, we really do see that opportunity to enroll at a similar rate as we saw in the second half of last year. We have that, you know, in terms of completed tours, which for us is a really important indicator in terms of forward bookings, and so feel good that that's the outlook that we have.
Okay, great. Thanks so much. Thank you.
Operator
Next question, Tony Kaplan with Morgan Stanley.
Please proceed. Thanks so much. I know you were expecting a bunch of closures in the beginning of the year, And we did see that in the numbers. I guess, are you still expecting that 25 to 30 net to be the decrease in centers for the full year? And I guess when you're opening new centers, you're going to open a bunch, I guess, in the remaining part of the year. I guess when's the best time to open new centers, just trying to understand the seasonality there?
Yeah, well, and if we could control the timetable of the opening, Stoney, you're right, we would certainly be opening probably early in the middle to being ready to be available in the fall season. So opening July, August, and so you can enroll for the fall is probably the optimal time, but it ends up being center construction cycles end up governing more of that opening cadence. The next best time would be to be opening right before the new year turns over, because that's often when families are enrolling. We do think that we will be in that neighborhood of 25 to 30 net reduction, net contraction of centers for the full year, despite the outsized first quarter, because we do have some openings that we've already done this quarter, and we see in the pipeline to be open. They, of course, are governed by this timetable, but we have the closures pretty well circled up, and that's the quantity that we're looking at.
Yep, got it. And then, I guess, when I think about backup, and you did some nice slides there. You talked about the backup penetration being under 5%. I guess, what do you attribute that to? Because is it that employees just aren't aware of the programs? And like, I guess, what are the ways that you can sort of drive that higher?
Sure. So I think that the reality is the employee benefit space is noisy, right? So employers offer a lot and employees' ability to understand all that they have on offer is challenged in that noisy environment. What I would say is that when we think about sort of standing out within that context in some of the actions that we had talked about in the prepared remarks, right? So the onus is really on our account management team that we have really repositioned against our client base to build deeper partnerships, create more opportunities for us to get awareness out within the client base, and then to ultimately have our account management team partnering even and more with our marketing apparatus to ensure that we are getting good communication and good messaging out so that people receive the information at times where they might naturally need the service. So a lot of what we've talked about in prior calls is around this idea of personalization and really trying to get messaging that is personalized to the individual that helps to highlight what needs they may have and then how we can help to solve against those needs.
Operator
Thank you. Thank you. Next question, George Tom with Goldman Sachs. Please go ahead.
Hi, thanks. Good afternoon. You're currently focused on a unified approach to client engagement and service adoption. Can you talk about whether there are additional steps with the sales force or sales process you still have to implement in order to fully realize this vision?
Sure. So I'll talk about some of the recent actions that we've taken that obviously are not sort of yet bearing fruit, but will start to have impact over the coming quarters and years. So the first thing we did most recently was really separate out our enterprise approach from our geographic approach. And so we now have individuals that are squarely focused on the largest and most complex sales opportunities, both new logos as well as within our existing client base. And then we have another set of individuals that are focused on the best opportunities outside of enterprise within geographic territory. So the first is structural. The second is that we really have deployed new sales training and tools to allow them to be more effective against this unified message. Because, again, we used to have individuals that would be selling individual products, and now the expectation is that our singular unified sales team will be going out and talking about the full totality of the Bright Horizon sets of offerings and then tailoring the solution to the needs of individual clients. So I put that into sort of category one. That is a new piece of it that we are now deploying into the market. I would say the second is that as we think about how we are unifying and going after the opportunities, we're really doing that at the user level as well. And so really starting to think about those employers who today offer more than one service, how do we help employees to understand and value services that may be across what are the silos within Bright Horizons to really enable additional use patterns? And so I'll give you an example of that. A client that may offer college coach and also through its backup line of service offer tutoring and helping to cross pollinate college coach users to leverage a tutoring offering and tutoring users to take advantage of the college coach offering. And so that's sort of the multi-level example of how we're thinking about it, which is first at the enterprise level and then secondly at the individual user level.
That's very helpful. And then on backup care, you mentioned you've seen 16 consecutive quarters of double-digit growth. Given that extended history of strong double-digit growth, are you ready to update your longer-term target for backup care growth at this point?
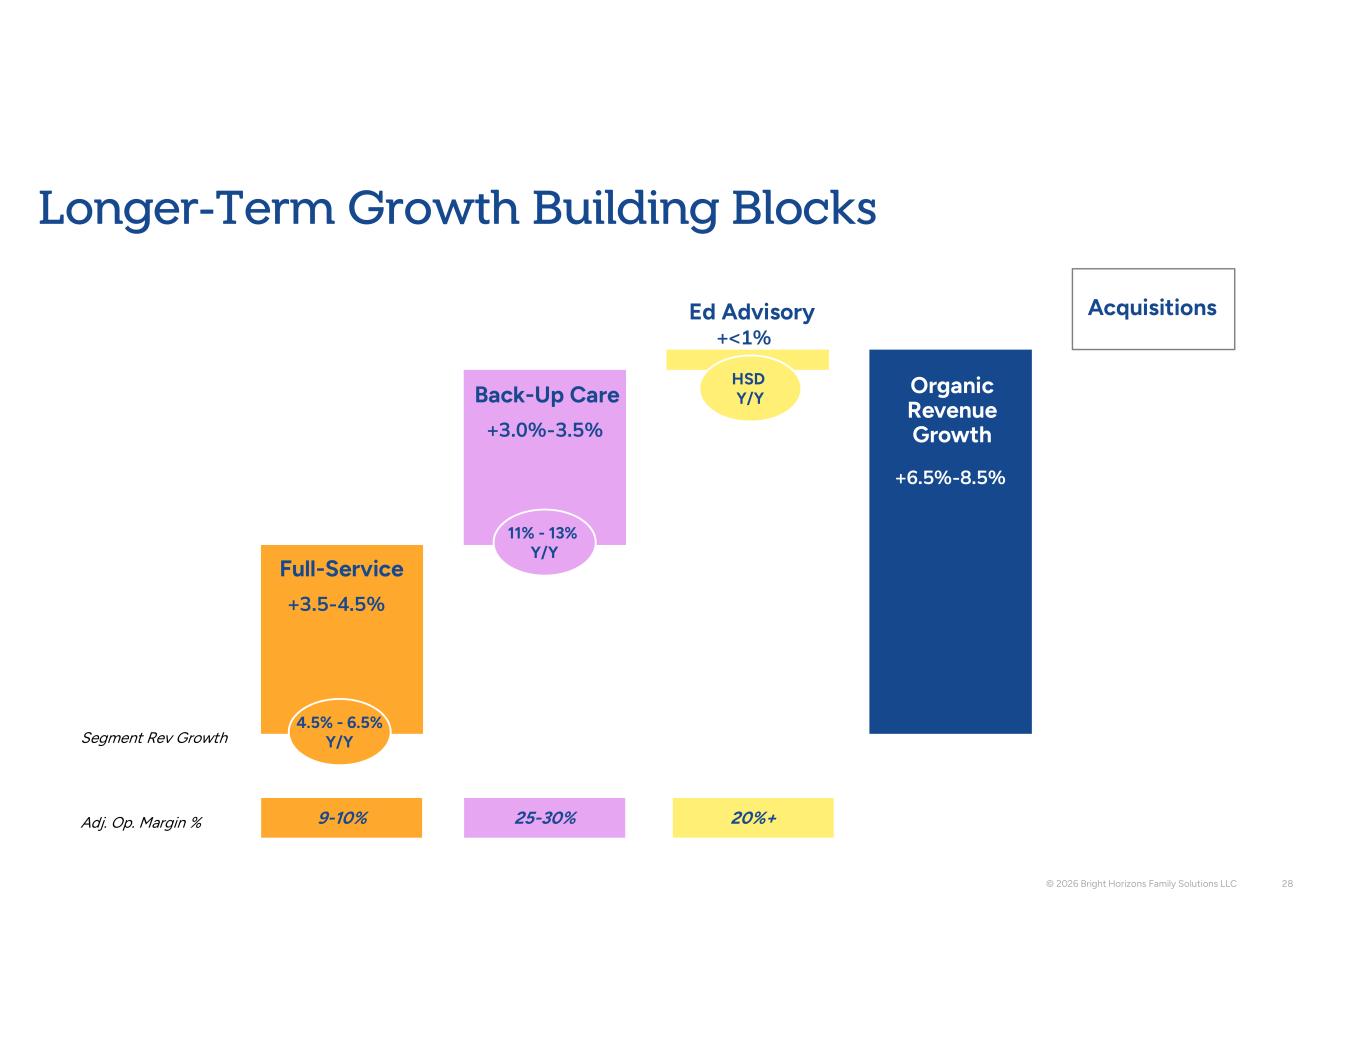
Yeah, so I think that, again, you will have just received the presentation, but I will draw your attention to slide 28, where we do update the backup care building block within our growth algorithm and are really calling at this point for a longer-term growth algorithm of 11% to 13%, which is an upgrade from what you will have seen historically.
Got it. Very helpful. Thank you. Thank you.
Operator
Once again, if you would like to ask a question, please press star 1 on your telephone keypad. Your next question comes from Josh Chan with UBS. Please proceed.
Hi. Good afternoon, Stephen and Elizabeth. Thanks for taking my questions.
I guess, hi, on the backup care penetration slide that you showed, I guess, you know, what in your mind causes the difference in penetration? Obviously, the slide suggests that industry has some, you know, factor to it, but then, you know, is tenure, is it geographic location? What causes some of the employers to have higher versus lower penetration?
Sure. So, first I'll talk about what the differences are between industries, and then we can talk about within industry. Between industry, part of the differential comes down to employee demographics, right? And so you'll see within financial services and professional services where we tend to have the strongest penetration, we're talking about demographics and a work style that really does comport very well to when there is a breakdown in care arrangement. that employee really needing and valuing having a replacement care arrangement, and so therefore we'll see higher utilization in those kinds of industries. In a place like industrial, where perhaps, you know, these are manufacturing plants or other traditionally male-dominated kinds of industries, we've seen less take up. But I think the more interesting part of this chart, even more so than between industries, is within industries. And you see that there is quite a bit of disparity between those that are on the least penetrated to those that are on the most in companies and organizations that should have similar traits. And so we are really undertaking, first and foremost, studying our most highly utilized clients and our least utilized. We are really, through our changes on the account management side, working very diligently to try to work towards having our less penetrated clients look more like our more highly penetrated clients and continuing to extend the growth of those that are more highly penetrated, understanding that on average, we still have a modest penetration. And so, between the work we're doing on the analytical side and by aligning the account management function and marketing functions, we believe we have the ability to continue to show good progress on this.
Thank you. That's really helpful, Carla, on the backup care. And then on the full service side, you did outline a 4.5% to 6.5% growth over the long I was just wondering what underpins that, you know, including tuition and center openings, et cetera, in terms of the full-service drivers.
Yeah, I mean, over time, those are the building blocks. It would be price increases and then enrollment in the earlier question about adding centers. So as we return to more of a cadence of at least neutral, hopefully next year, neutral net openings to positive again, that ramping in, the ramp up of centers in their enrollment, and then that just modest enrollment gains would be a contributor to that over time. So unit growth to some degree, and then enrollment growth would be the other components in that, you know, besides a, you know, call it a 3% to 4% or so price increase, and then the other pieces would be enrollment in new centers.
Great. Thank you both for your time.
Operator
Thank you. Next question, Faisa Alway with Deutsche Bank. Please go ahead.
Yes, hi, thank you. I wanted to follow up just on the full service margin side. So a couple of related questions. One was just, could you help us frame the impact from Australia to margin specifically? Apologies if I missed this, but I know you gave us a top-line impact, but just curious if you still expect to see 25 to 50 basis points this year and, you know, if there's any offsets to the impact from Australia. And related to that, just, you know, as part of the long-term building blocks, I see the a 9% to 10%, I guess I can call it target. So just curious, you know, when you expect to sort of get there.
Sure. I think I got the gist of the question, so if I didn't, please circle back. But I think the question is around what are the full service margins considering this impact of Australia? And I think there's two ways that may be helpful to answer that. One is, what is the impact with Australia and the results? And then what is the actual headwind, just talking about Australia in totality? And so we had guided to the year to have 25 to 50 basis points of margin expansion. And given the headwind of this, the revenue degradation, which is, you know, in the 100 basis point range of the enrollments, 100 basis points, it's call it $20 million or so. So the margin degradation is even more than that. And so we have an element of, call it flat margin growth or so this year, but it would be 25 to 50 basis points without the effect of Australia. So that's the impact of it being included. If we think about Australia just standing alone, it has a full-year revenue profile that's in the neighborhood of around $140 million of revenue, and with losses in the $20 to $25 million range in total, it's about 150 basis points of overall headwind to the full-service business. So, we talked about how much the question earlier came in about what is the impact on the guide? Are there puts and takes within the guide for Australia? And so, we did have to absorb some of the underperformance this year. But, again, just standing alone, Australia, with the tax impact and that kind of a loss profile is close to 40 cents of overall headwind to the earnings performance.
Great. That's super helpful. And then I guess the second part of my question was just around the long-term building blocks, the 9% to 10%. I know we've been asking this question for some time, really, since COVID, so just curious how, you know, your views have evolved.
Yeah, and so, you know, from the standpoint of if we just look at the base we started this year, we ended last year, I should say, with 5.5%. If we have 150 basis points of headwind from Australia and we are able to be gaining 25 to 50 basis points a year, we would, all things being equal, be at 7. We would be adding 25 to 50 BIPs a year as we continue to gain enrollment. We have also a number of the centers that we have closed, which we have talked about on prior calls that have some tail of operating costs as we work to completely exit those leases. Some of them have run-dark costs that we are incurring. So that's another, call it, 50 basis points or so that will taper out of the margin in the next couple of years. And so we are well on our way to that 9% to 10% with continued improvement, and we still have some centers to exit from the portfolio. So that combination, along with operating leverage and efficiency from enrollment gains year over year, we think we are certainly within striking distance. And we see that in our best performing centers. But some of these outliers are putting a pretty severe headwind on the reported margin at the moment.
Understood. Thank you. And then just a quick follow-up. I'm curious if you're seeing, you know, any benefits even sort of as you're talking to clients from the 45F OBBA impact that increased the annual cap for tax credits. I know this had come up sort of last year, but just curious of how, you know, your conversations have trended on this topic.
Sure. So, look, I think that the quick answer on that is that 45F hasn't had much of an impact in terms of the conversations or in the adoption by our client base. And so I think that while it can be an interesting talking point in a way into new client conversations, I would say that it certainly, from our perspective, is not one that is moving the needle as it relates to ultimately getting clients over the line and or seeing it much as something that's being adopted by our current clients.
Got it. Thank you so much. Thank you.
Operator
Next question. Stephanie Moore with Jeffries. Please go ahead. Stephanie, your line is live.
My apologies. Sorry, everybody. I guess just maybe circling back to the backup care, can you talk a little bit about, you know, of your clients that use more than one service within the backup care services? I think that might be helpful.
Sure. So, I guess I'll take a step back and say that, you know, how backup care used to be defined in the earliest days was around providing care in-center and then ultimately got extended to in-home. And over time, right, we have extended that to include school-age programs. We have extended that to include elder care. We've extended that into academic tutoring and pet care. And what I would say is that almost universally, our clients offer the in-center and in-home for both children and aging adults. I would say that we have very strong majority-type take-up as it relates to academic tutoring. And then I would say that the lowest adopted of the offerings is pet care, although from a user perspective, that happens to be quite a popular part of the offering. And so, again, part of it is what's being offered, which I shared a fair characterization, and the other is how it is adopted by the end user. But that's how I would characterize it. All offer it in-center, in-home, adult and child. Most offer it for tutoring and then to a lesser extent the pet care.
Got it. That's really helpful. And maybe just, I don't think anyone has asked so far in just the UK business. I think a lot of progress has been made on that front of the last year or so. So maybe how we should think about just the improvement in operating income and general performance there. Thank you.
Yeah, so I appreciate the reminder because certainly the UK business has been on a journey and we're very pleased to see both the sequential, the quarter-to-quarter progress, the year-over-year progress. And so, as a reminder, last year, the U.K. had turned the corner and was positive from an operating performance, operating income contribution standpoint. Still a headwind to the overall full service margins in the low single digits rather than the 5.5% overall that we were reporting. And this year, continue to see both between the enrollment gains and just the continued operating execution, that that has continued to improve. It's still, it's making progress to the overall average, still is a little bit of a headwind, but it's a big contributor in terms of the turnaround. It's just not at the, the velocity of the improvement contributes to our overall leverage, but it's just at a little bit lower pace than it was in 2025.
Okay. Well, thank you, everybody, for your time, as always. Thank you.
Thanks, Stephanie. Wonderful. Well, thank you all very much for joining us on the call and wishing you a great night.
Operator
Thanks, everyone. This concludes today's teleconference. You may disconnect your lines at this time, and thank you for your participation.