Operator
Hello, everyone. Thank you for joining us and welcome to C&O Financial Group First Quarter 2026 Earnings Results. After today's prepared remarks, we will host a question and answer session. If you would like to ask a question, please press star 1 on your telephone keypad. To withdraw your question, let's star 1 again. I will now hand the call over to Adam Avil, VP of Investor Relations, for opening remarks. Please go ahead.
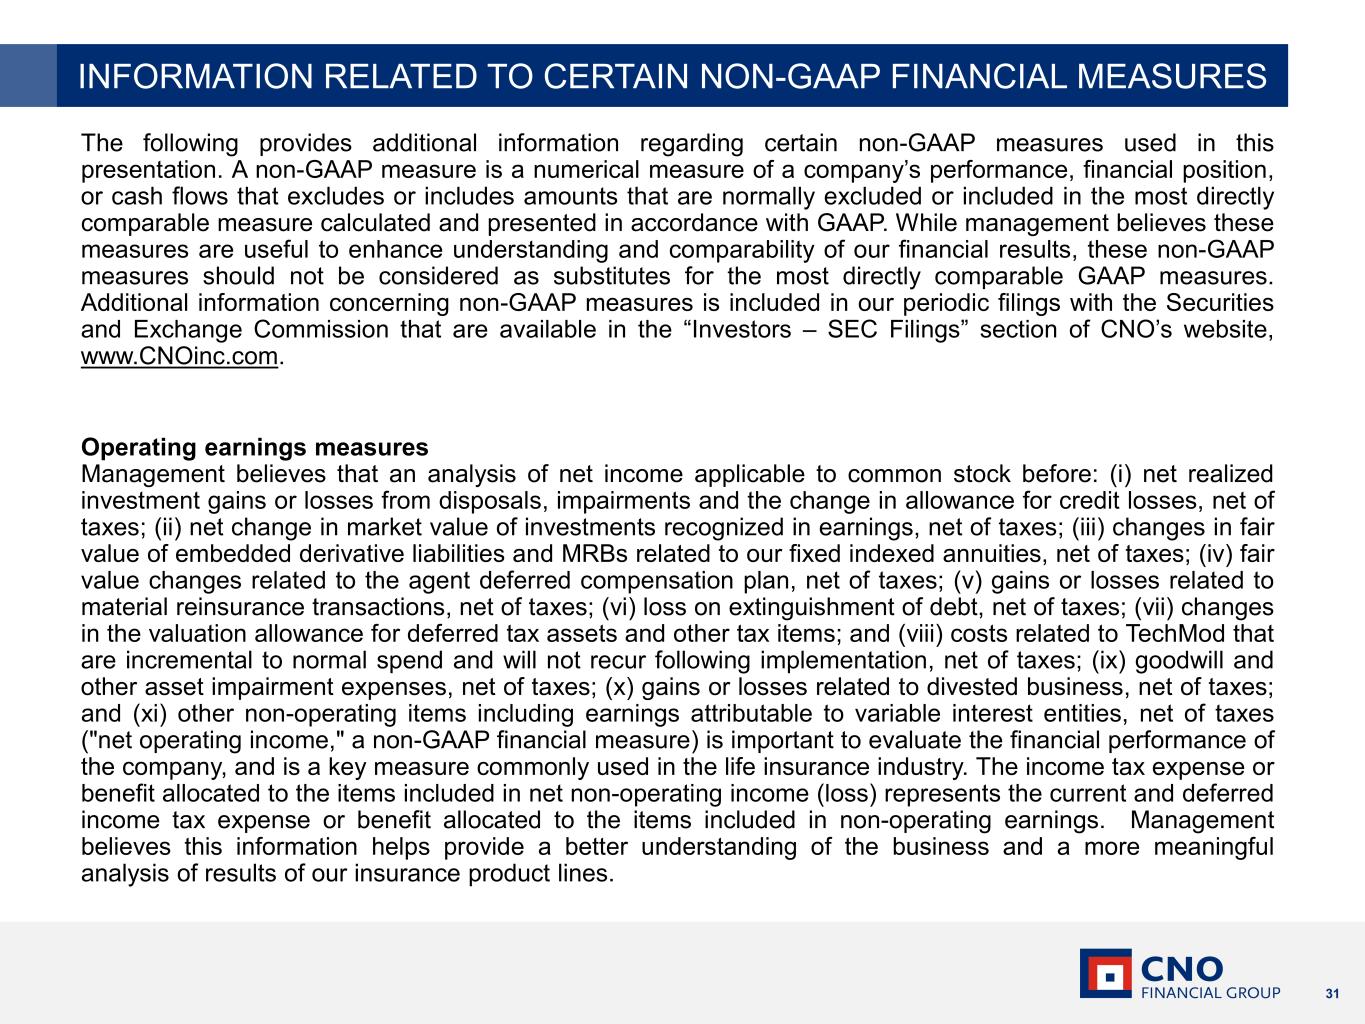
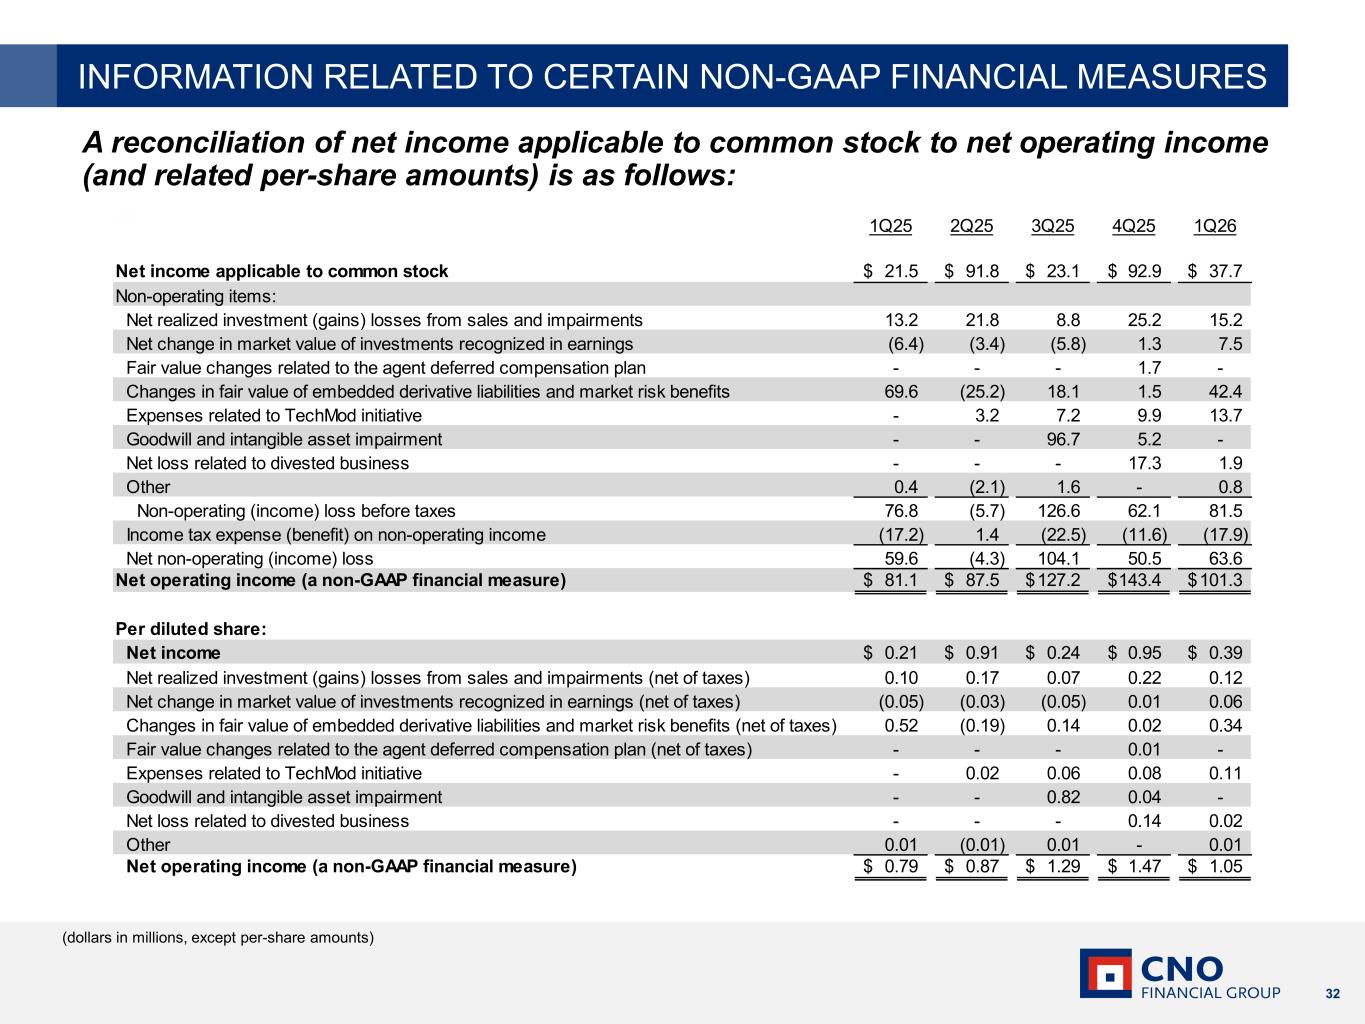
Good morning and thank you for joining us on CNO Financial Group's first quarter 2026 earnings conference call. Today's presentation will include remarks from Gary Bajwani, Chief Executive Officer, and Paul McDonough, Chief Financial Officer. Following the presentation, during this conference call, we will be referring to information contained in yesterday's press release. You can obtain the release by visiting the media section of our website at cnoinc.com. This morning's presentation is also available in the Investors section of the website and was filed in a Form 8K yesterday. Let me remind you that any forward-looking statements we make today are subject to a number of factors which may cause actual results to be materially different than those contemplated by the forward-looking. Today's presentation contains a number of non-GAAP measures, which should not be considered as substitutes for the most directly comparable GAAP measures. You'll find a reconciliation of the non-GAAP measures to the corresponding GAAP measures in the appendix. Throughout the presentation, we will be making performance comparisons. Any comparisons made will refer to changes between first quarter of 2026 and first quarter of 2025. And with that, I'll turn the call over to Gary.
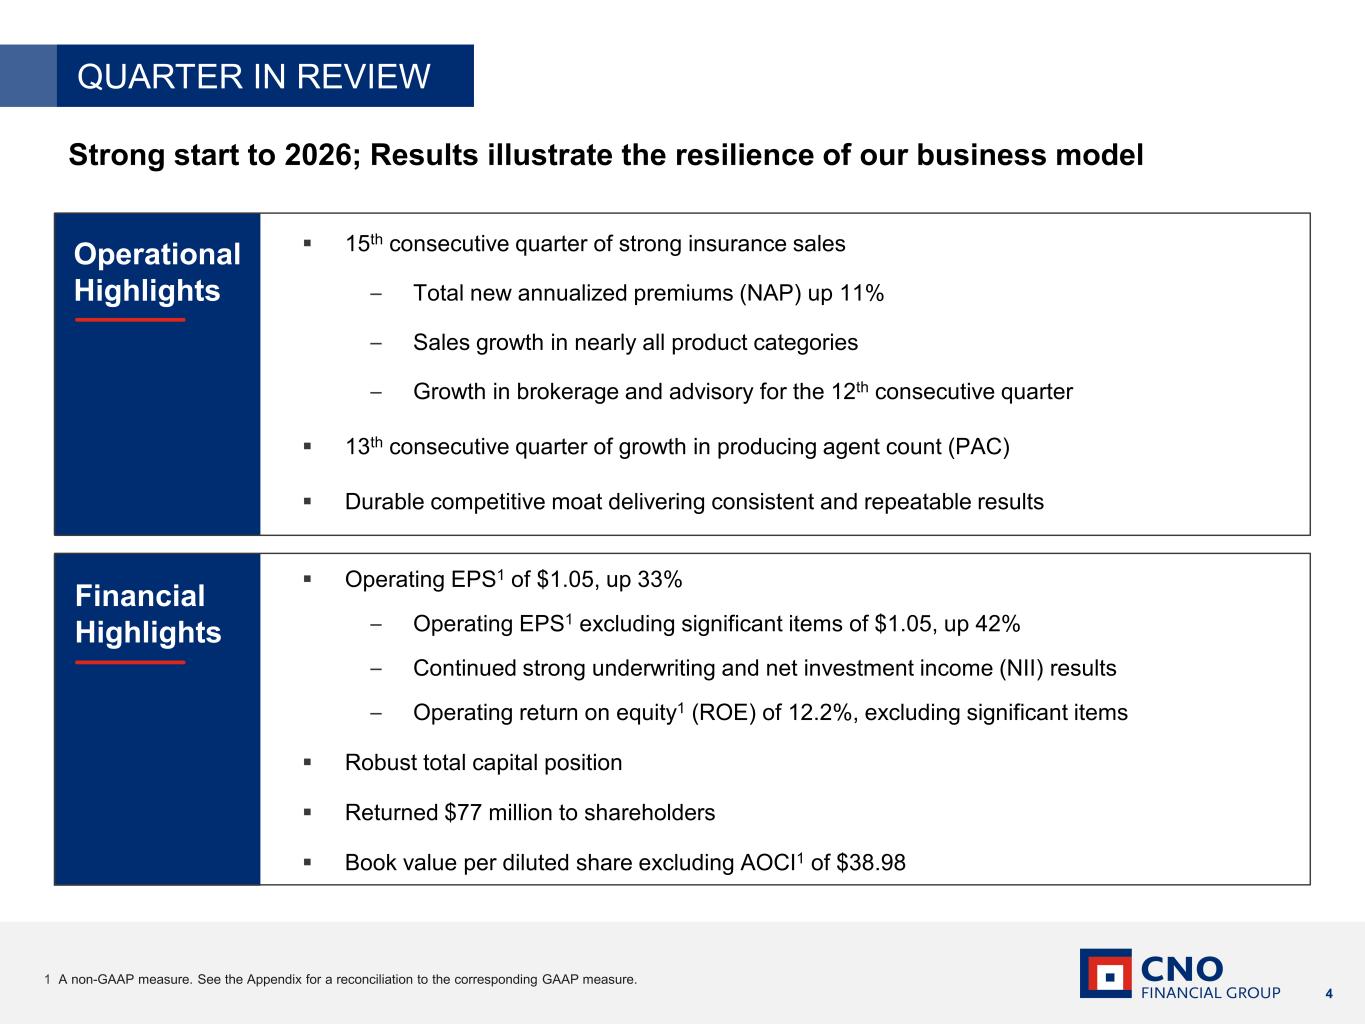
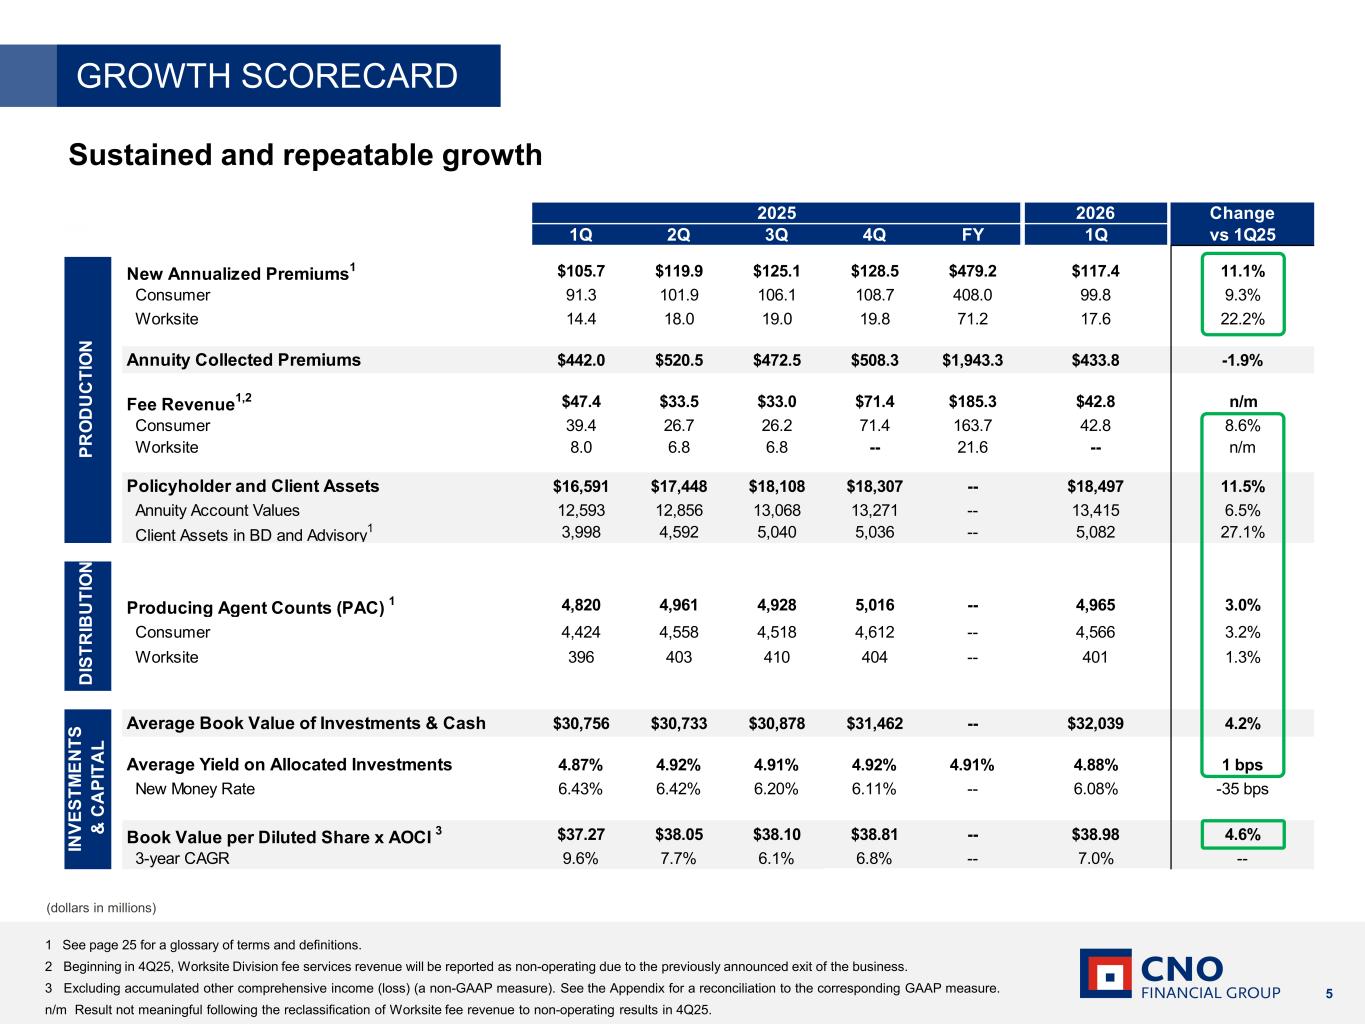
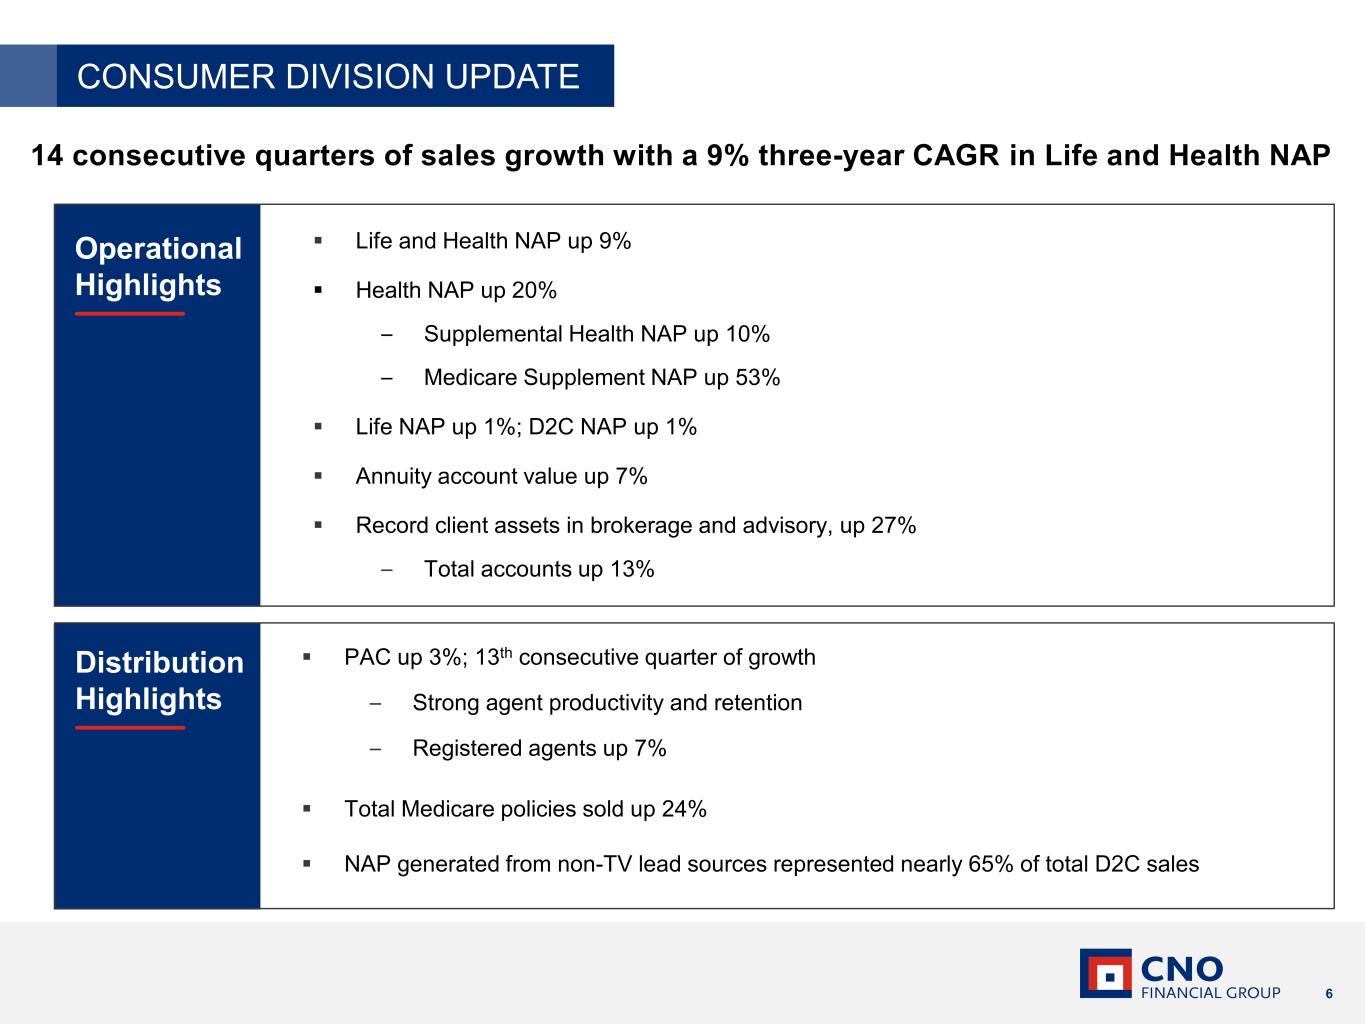
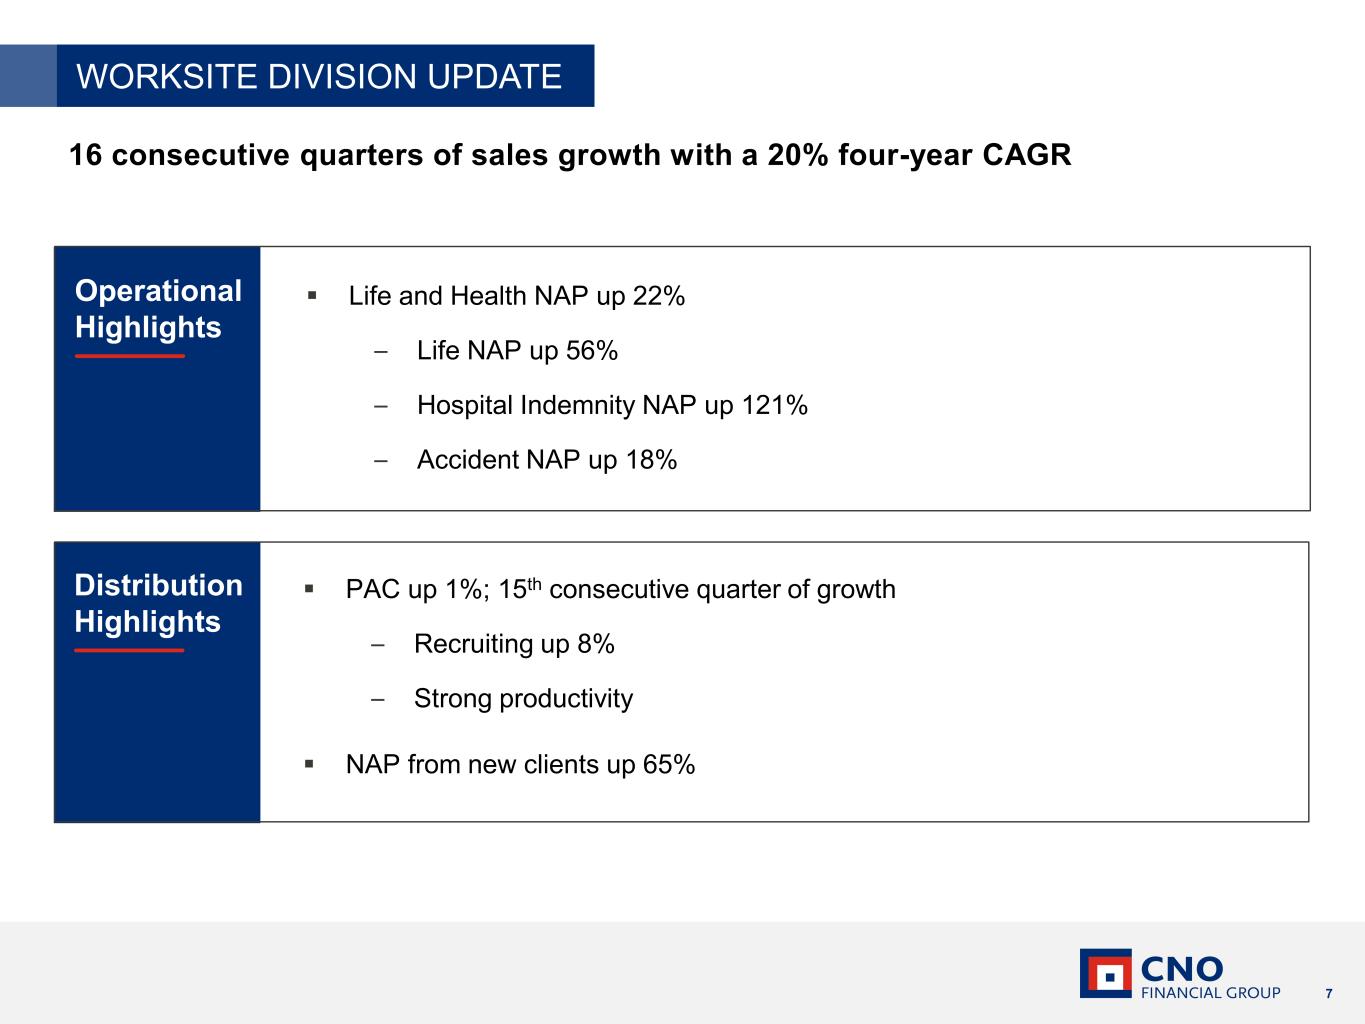
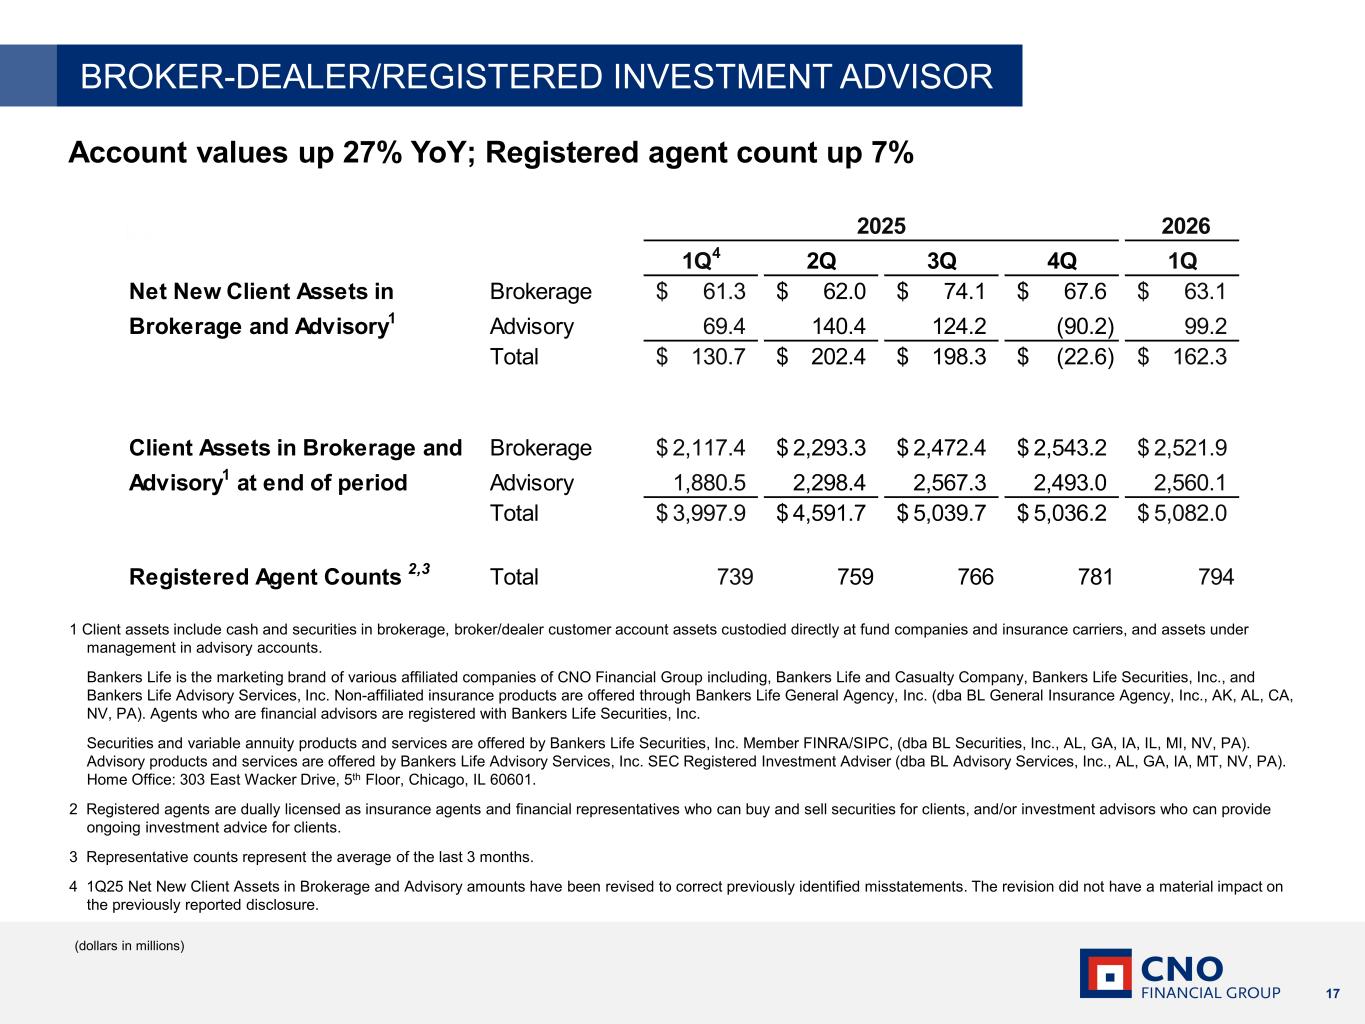
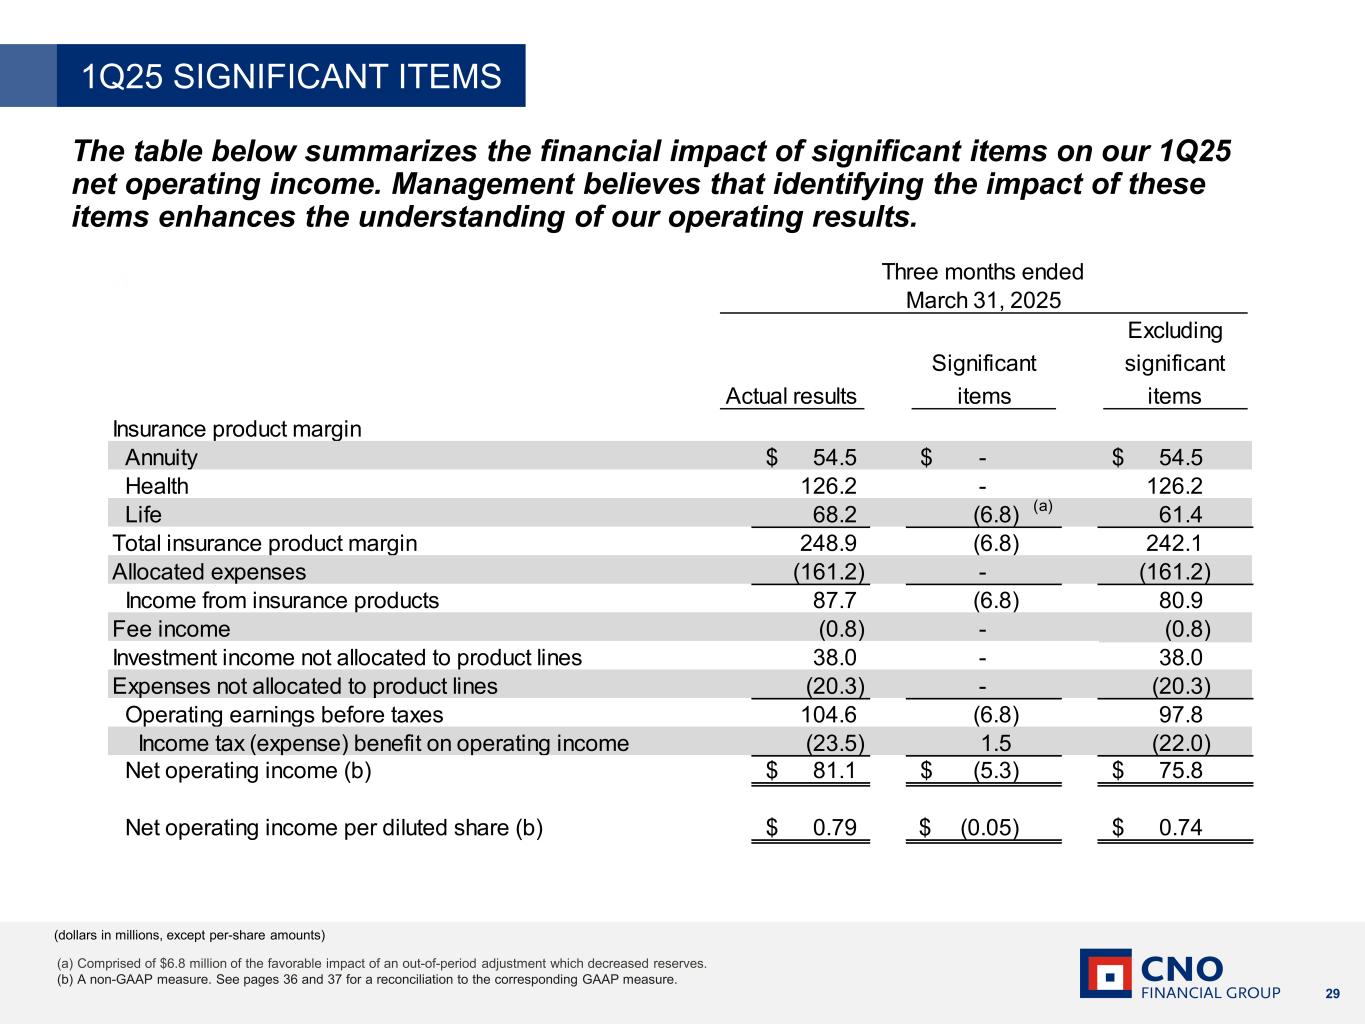
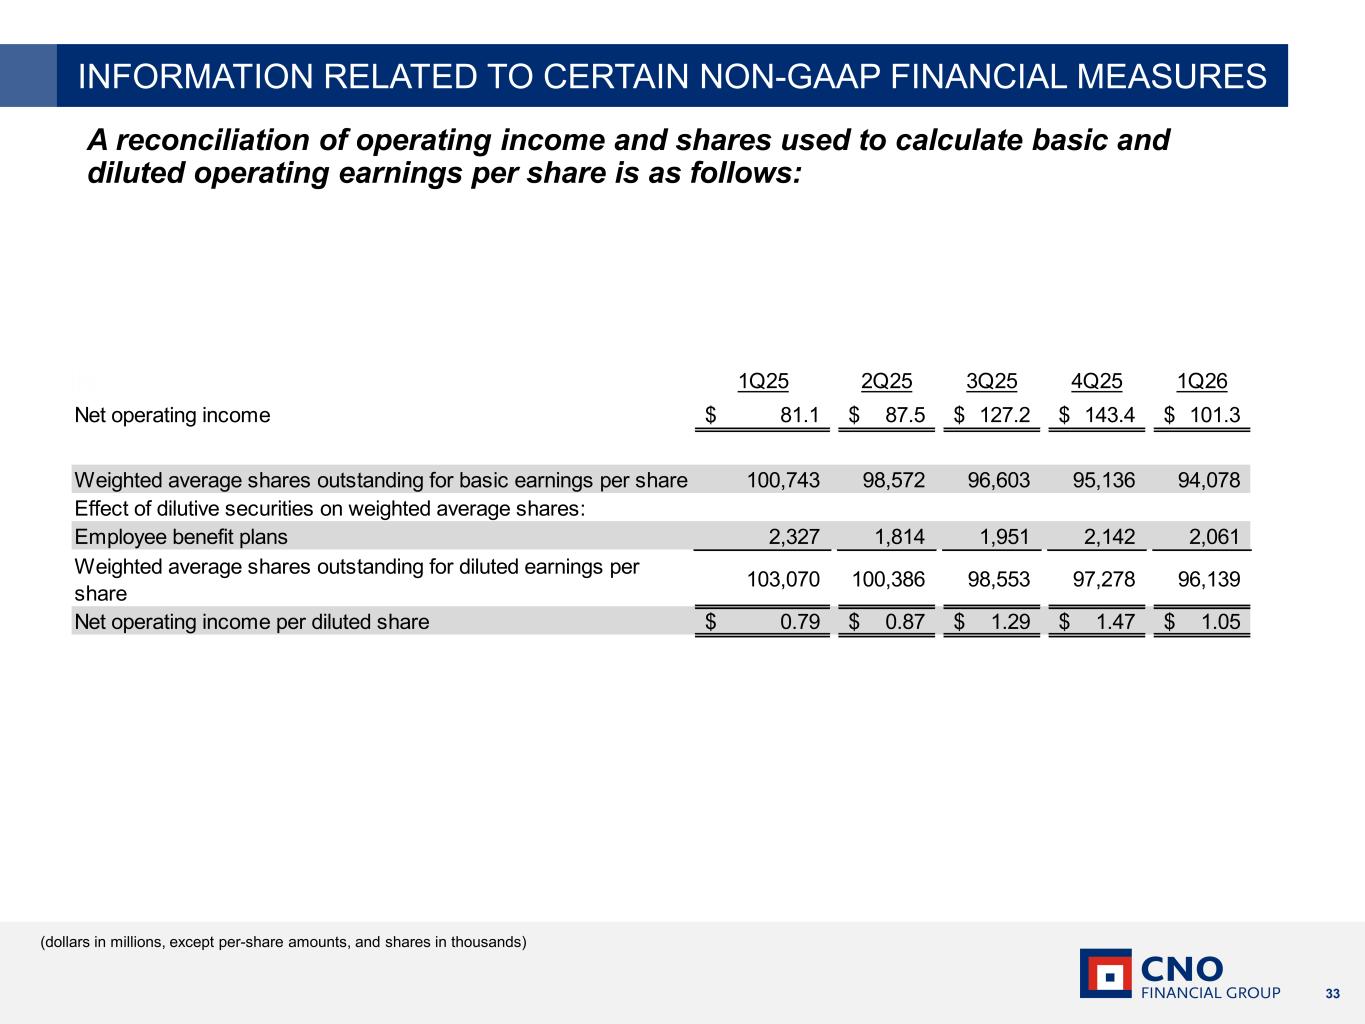
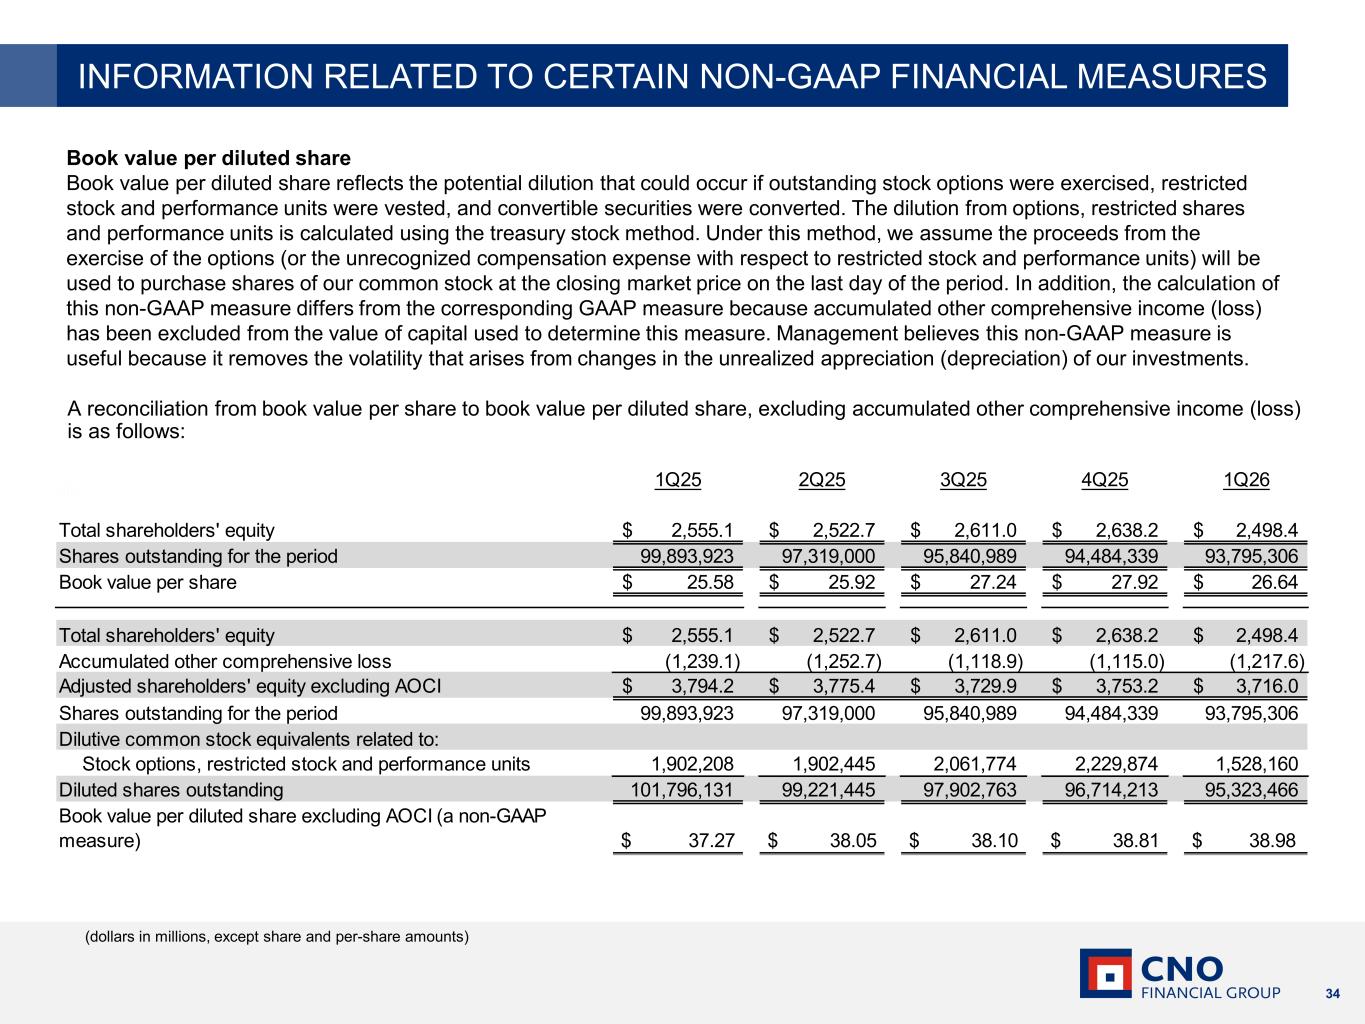
Thanks, Adam. Good morning, everyone, and thank you for joining us. C&O is off to a strong start to the year, building on our excellent 2025 performance. First quarter operating earnings per diluted share were up 33% to $1.05 and up 42% excluding significant items. We also delivered our 15th consecutive quarter of sales growth and our 13th consecutive quarter of producing agent count growth. We remain pleased with the consistent results we're generating and we remain focused on growing earnings, improving profitability, and reinvesting in the business. Our performance in the quarter once again illustrates the strength and resilience of our business model. We continue to perform well through economic uncertainty as we help middle-income households achieve greater financial security and protection. Sales results in the quarter were strong across both divisions, with total new annualized premiums up 11%. Our exclusive middle market focus and our last-mile captive agent distribution model create our durable, competitive moat. This difficult-to-replicate model is a clear advantage and a catalyst for profitable growth. Earnings continue to benefit from strong insurance product margin and investment results, reflecting growth in the business and expansion of the portfolio book yield. We maintained a robust capital position while returning $77 million to shareholders. Book value per diluted share, excluding AOCI, was $38.98, up 5%. Turning to slide 5 and our growth scorecard. Nearly all of our growth scorecard metrics were up for the quarter with strong performance across production, distribution, and investments and capital. Turning to slide six and our consumer division, the consumer business delivered a strong start to the year. This marks our 14th consecutive quarter of sustained sales growth and includes a 9% three-year compound annual growth rate for life and health NAP. Consistent execution and our focus on the middle income market continue to drive our results. Life and health NAP was up 9% for the quarter. Total health NAP was up 20%, marking 15 consecutive quarters of growth. Supplemental health was up 10%. Our Medicare business continues to perform well, building on the strong results our field leaders delivered during the fourth quarter 2025 annual enrollment period. Total Medicare policies sold were up 24%, with Medicare supplement NAP up 53%. Our results continue to reflect the shift in consumer preferences away from Medicare Advantage and towards Medicare supplements. During the 2025 AEP, industry-wide MA enrollment growth slowed to about 3%, the weakest pace in 20 years. The broader MA market also continued to experience significant disruption as many leading carriers pared back plans and benefits over the last 18 months. Approximately 3 million MA members had their plans terminated for the 2026 plan year, requiring them to find new coverage. About one in five people with Medicare switched plans or carriers, the highest rate ever recorded for an annual enrollment period. This environment underscores the value of offering both MedSup and Medicare Advantage through our national agent distribution model. Medicare remains a flagship door-opening product for C&O, supporting our ability to expand the total number of households we serve. LifeNAP was up 1% for the quarter, with more than half of our life production being generated from direct sales. Our approach to the D2C Life channel continued to benefit from technology-driven productivity enhancements and diversifying our direct marketing away from television to include more web, digital, and third-party channels. These non-television lead sources generated nearly 65% of all D2C Life sales for the quarter. Annuity collected premiums of $434 million were down 2% on a strong comparable. Account values were up 7% over the prior year. We delivered our 12th consecutive quarter of brokerage and advisory group. Client assets were up 27% to a new record, and total accounts were up 13%. When combined with our annuity account values, our clients now entrust us with more than $18 billion of their assets, up 12%. 12%. Strong agent productivity and retention continue to fuel our sustained sales momentum. Agent recruiting is also up as our career path continues to resonate with applicants seeking financial stability and a career of purpose. Producing agent count was up 3%. Our 13th consecutive quarter of growth, registered agent count grew 7%. Investments in technology, data, and artificial intelligence are woven into our strategy to drive greater efficiency and agent productivity and to enhance our customer experience. One example is our Colonial Penn Call Center, where we are using AI to help answer and intelligently route customer calls to live agents. The early results are very encouraging. We're seeing shorter customer wait times and higher quality sales conversions. We have multiple initiatives underway across the company to advance our technology and AI roadmap. As these programs move from pilot to execution, we will continue to share examples of the value they deliver. Next, slide seven and our worksite division performance. The worksite business also started the year strong, with life and health NAP up 22 percent. This represents our 16th consecutive quarter of sales growth with a 20% four-year compound annual growth rate. Highlights from the quarter included life insurance, up 56%, hospital indemnity insurance, up 121%, and accident insurance, up 18%. Our focus on small to mid-sized businesses and associations combined with our career agent model continues to drive meaningful sales growth. Naps from new clients increased 65%, largely driven by geographic expansion and further penetration into existing markets. Live sales, in particular, experienced a significant uptick from these new client relationships. Our sales performance in the quarter was driven by strong agent productivity. Producing agent count was up for the 15th quarter, and agent recruiting was up 8%. Across both divisions, we're pleased with the solid start to 2026. We're executing well and expect that momentum to carry through the remainder of the year. And with that, I'll turn it over to Paul.
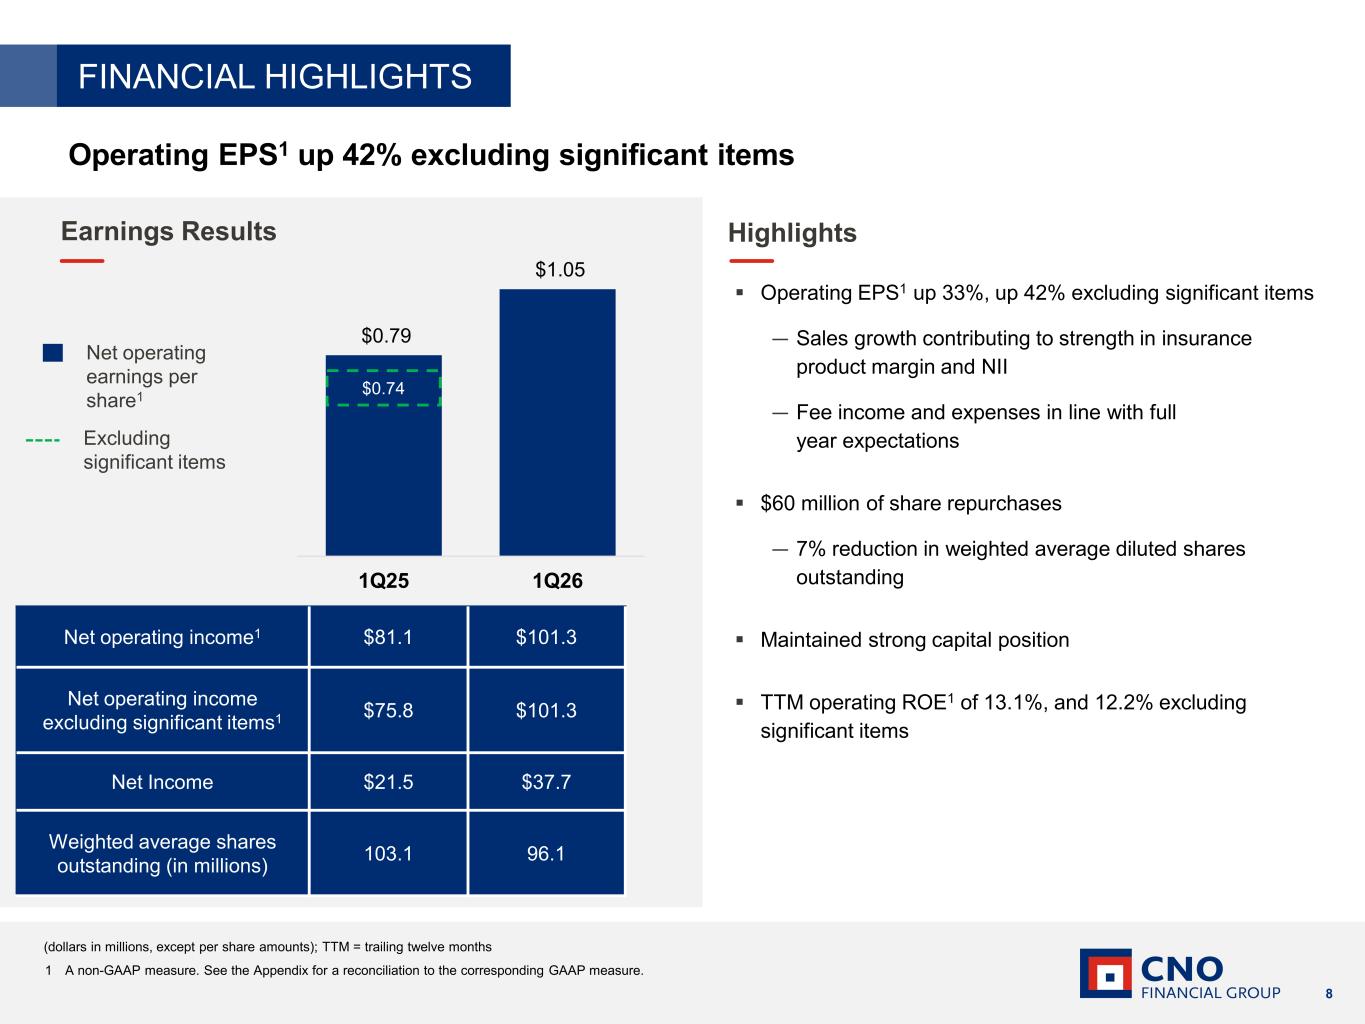
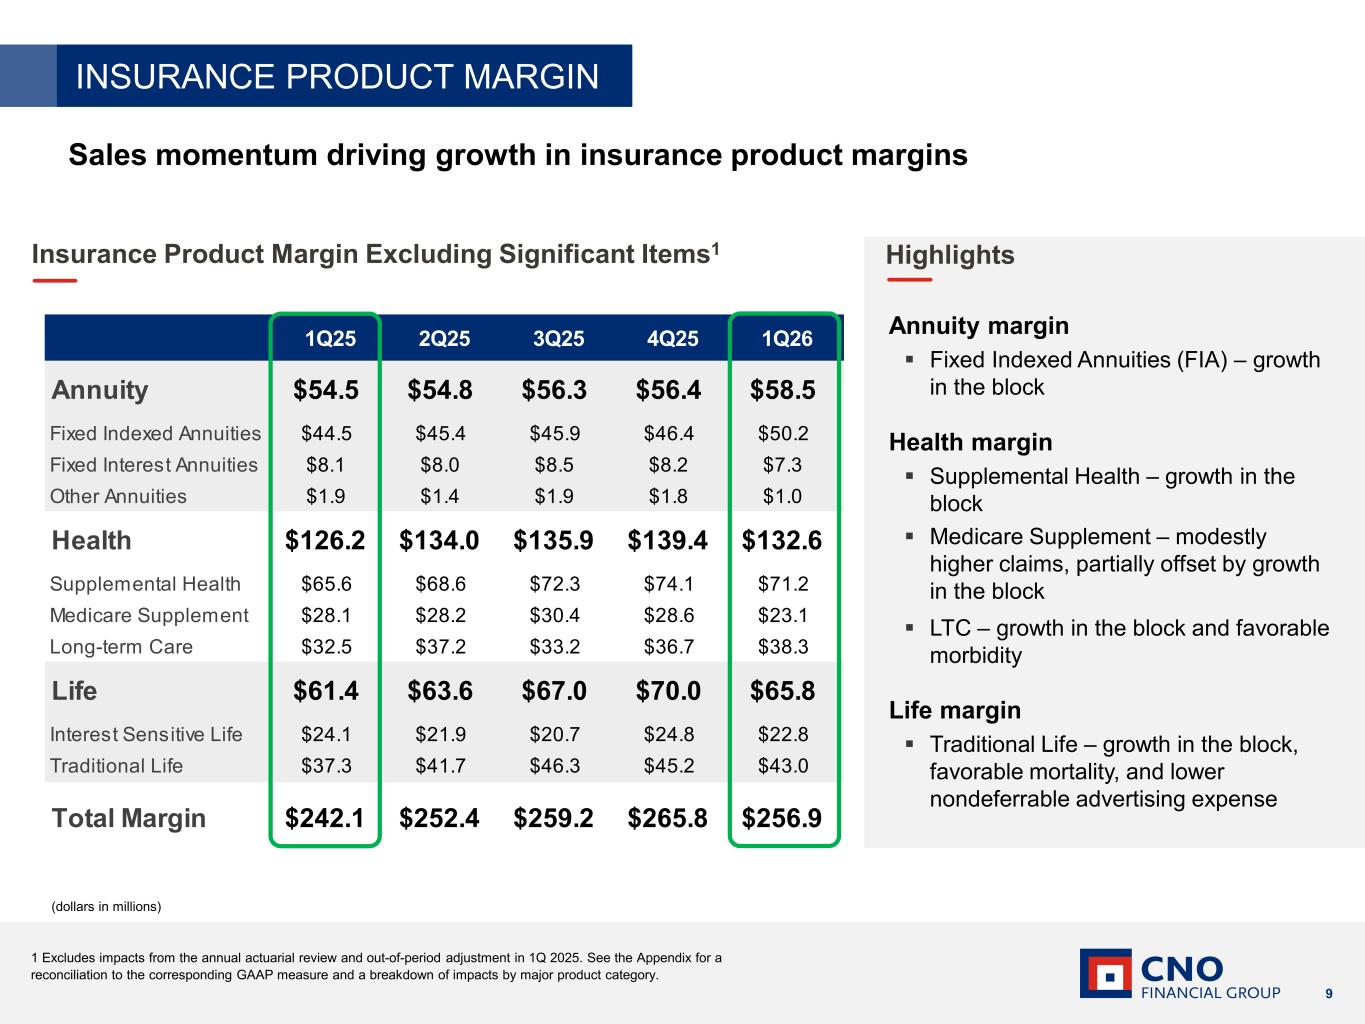
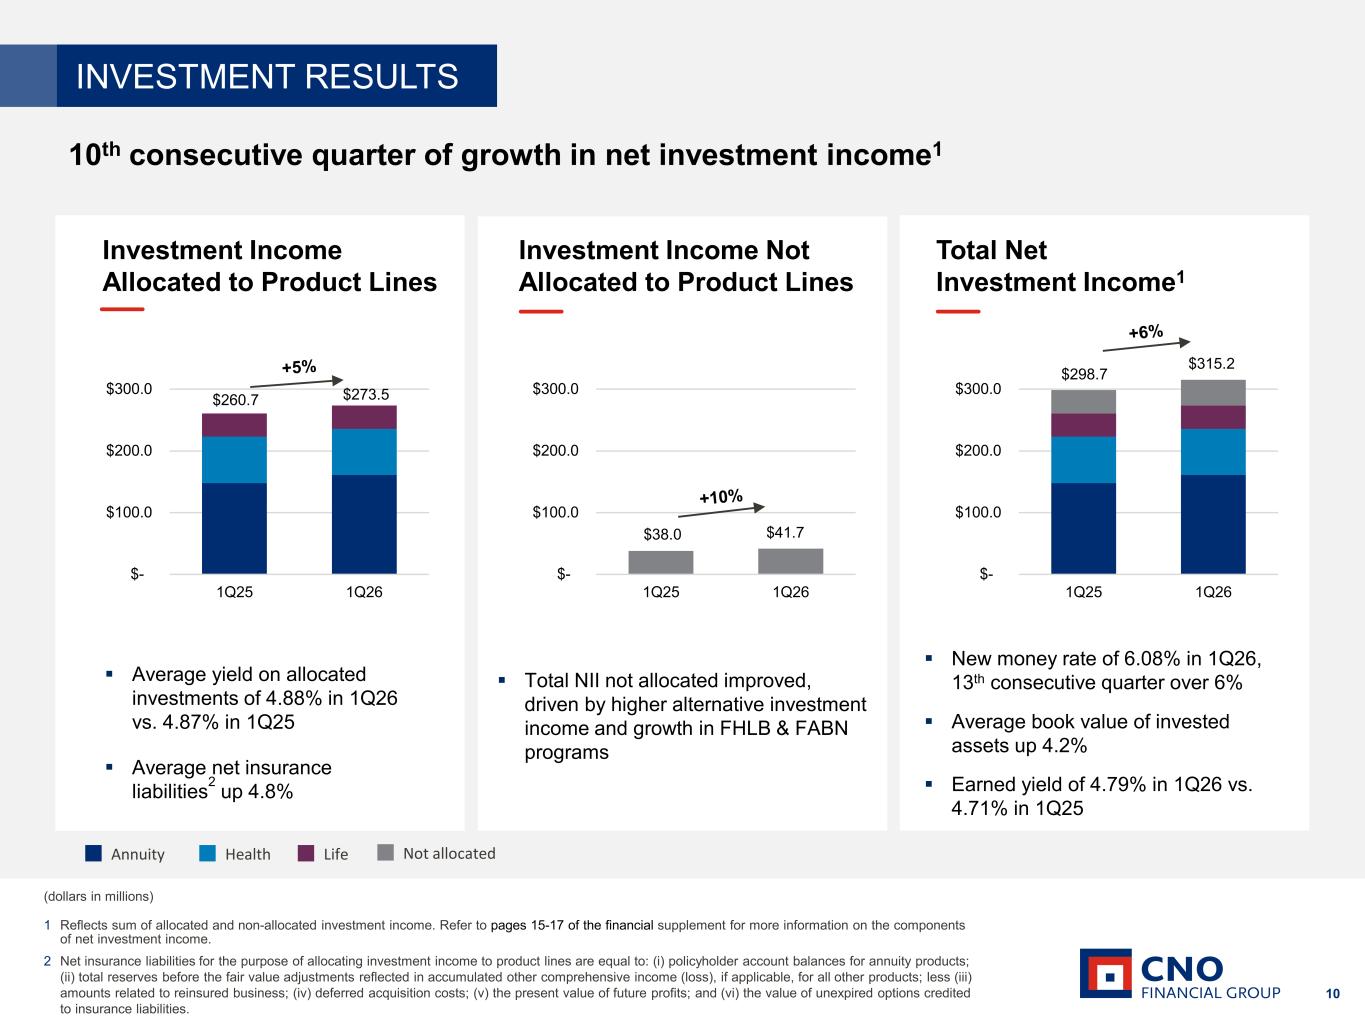
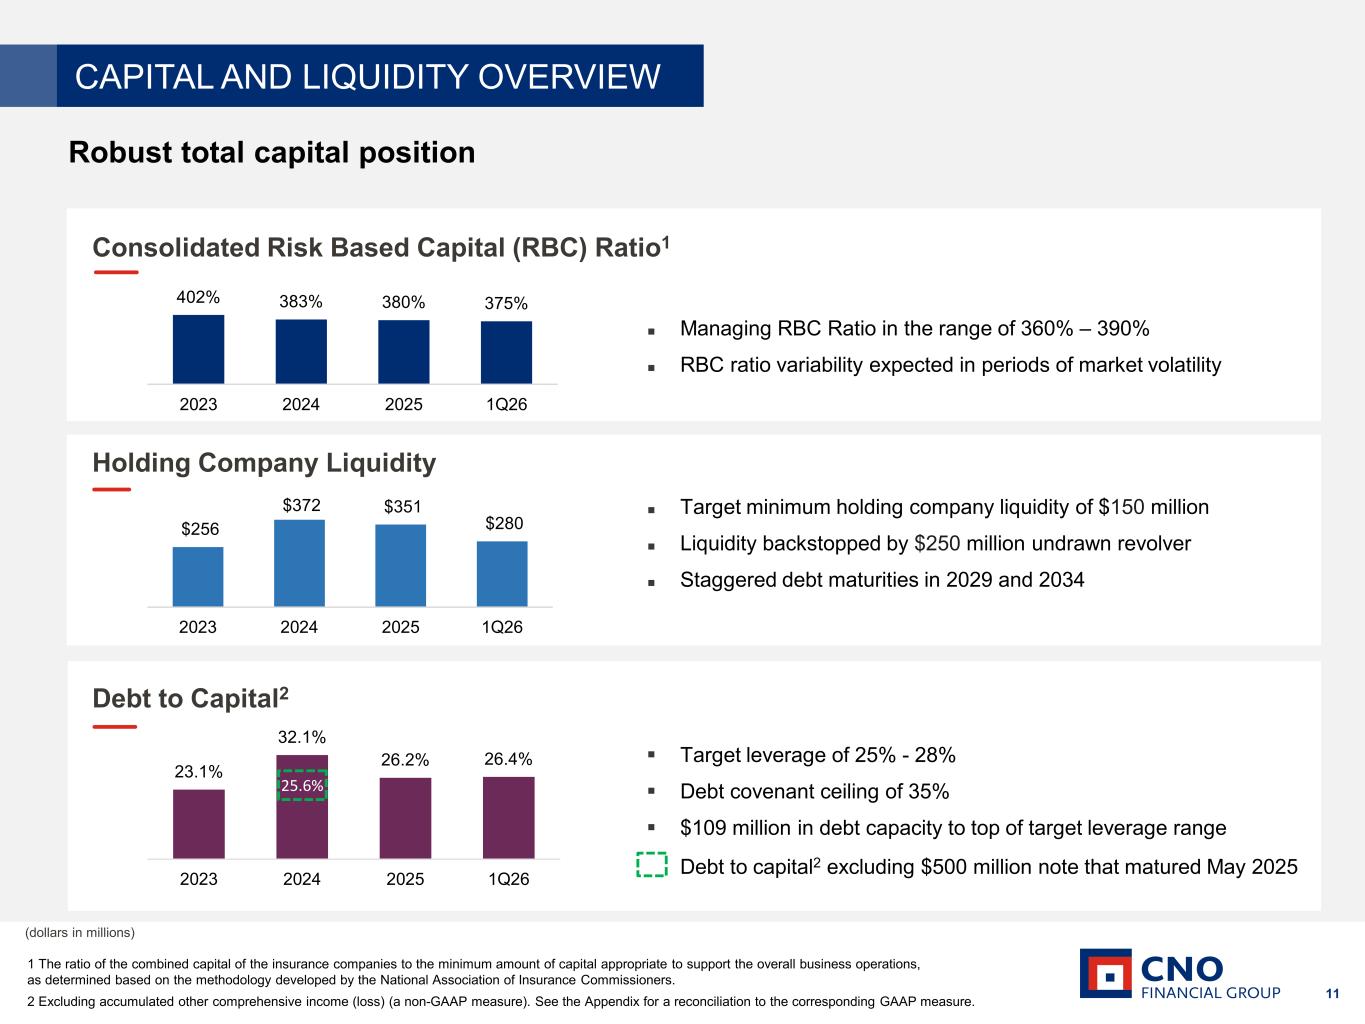
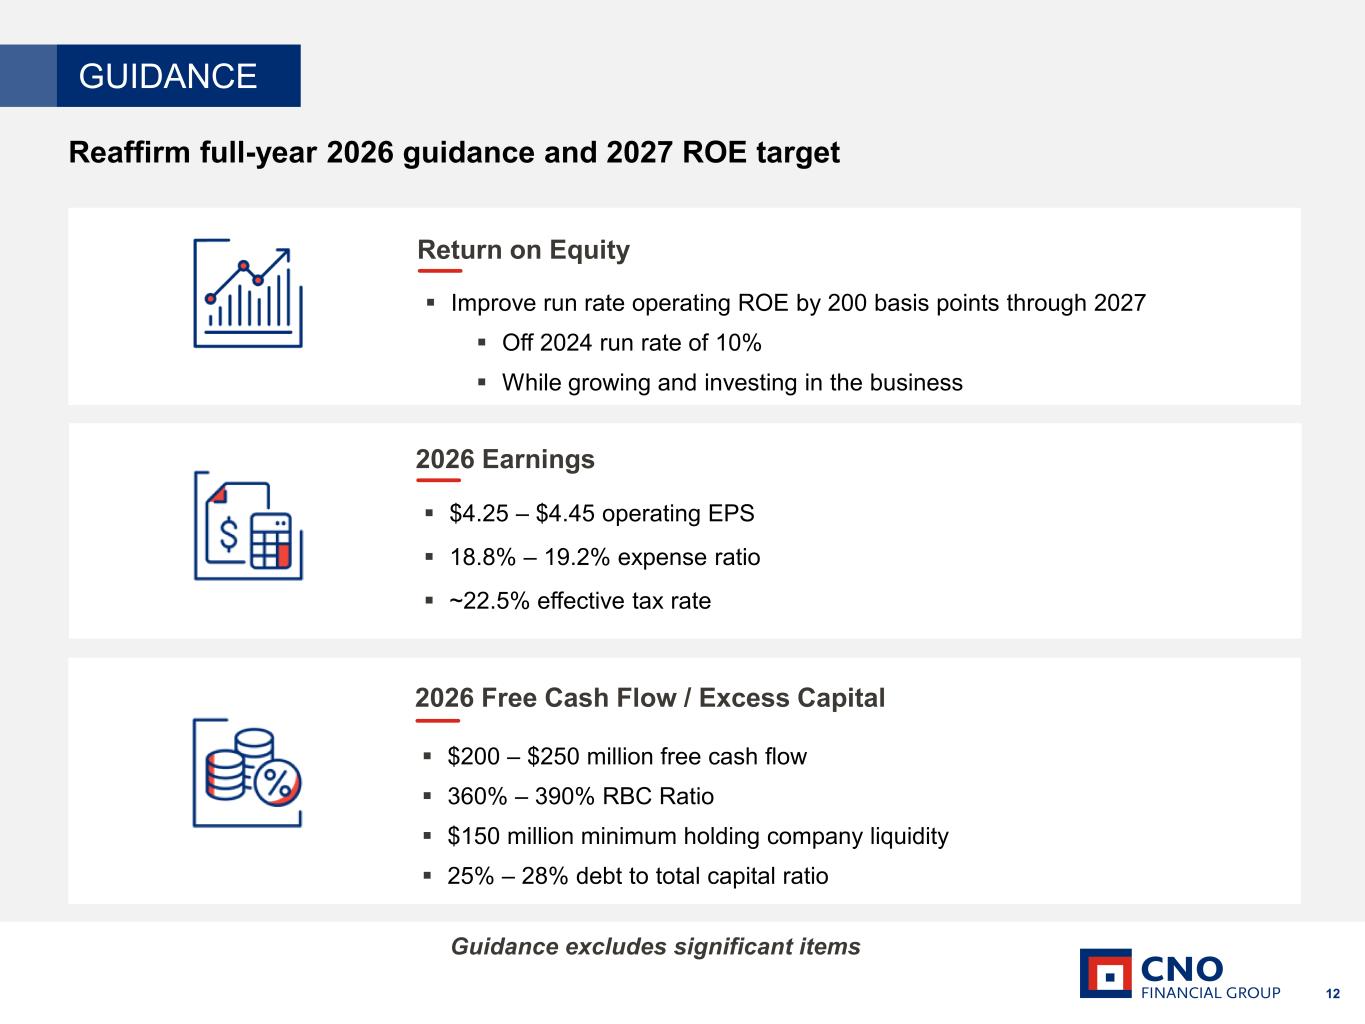
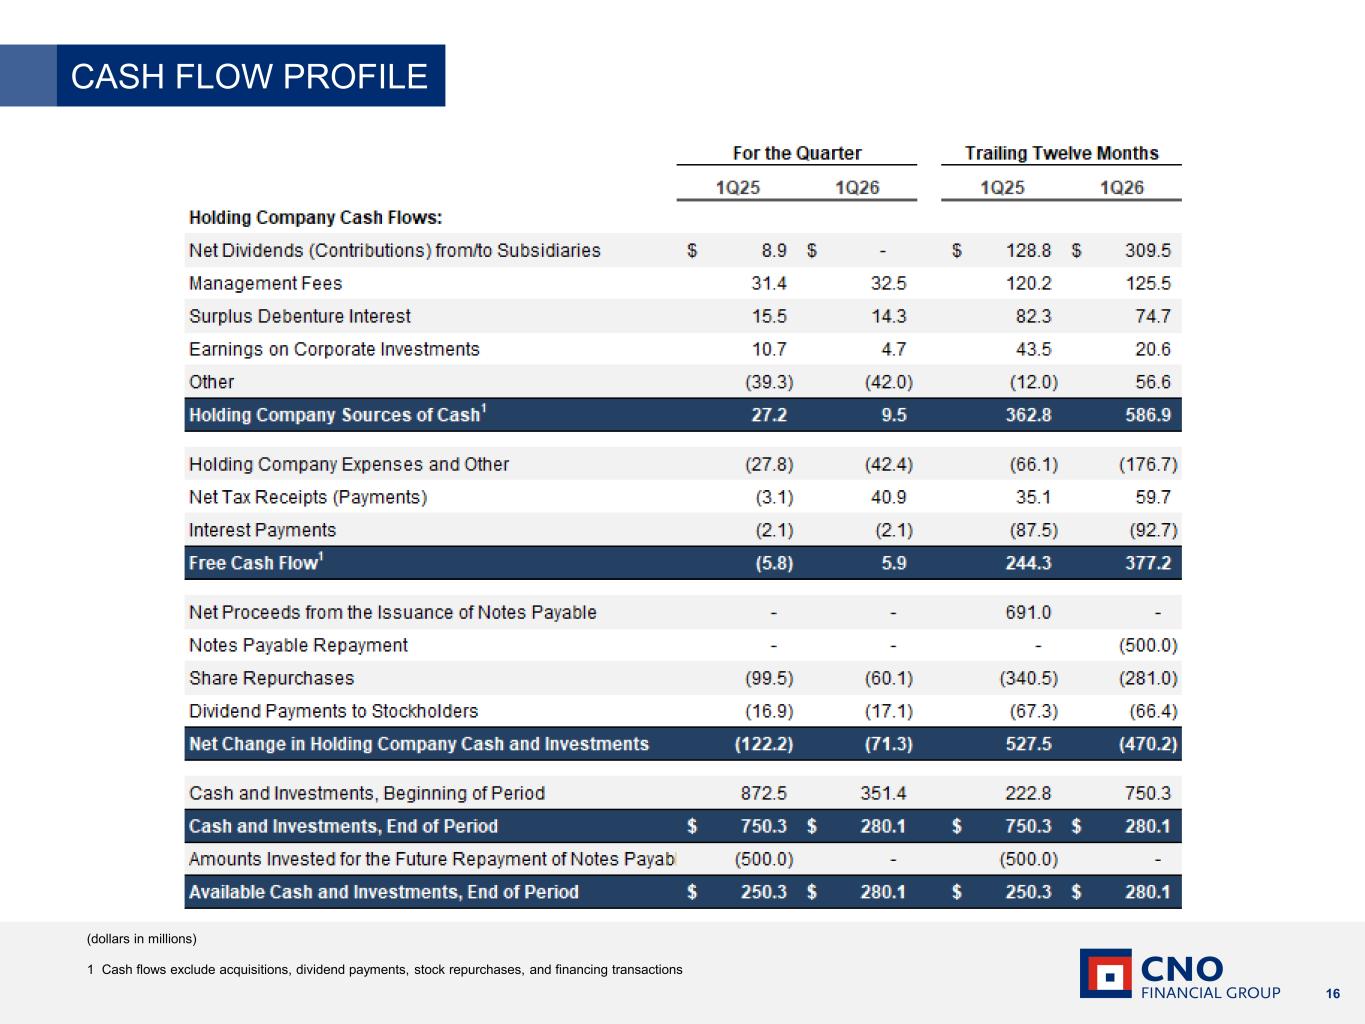
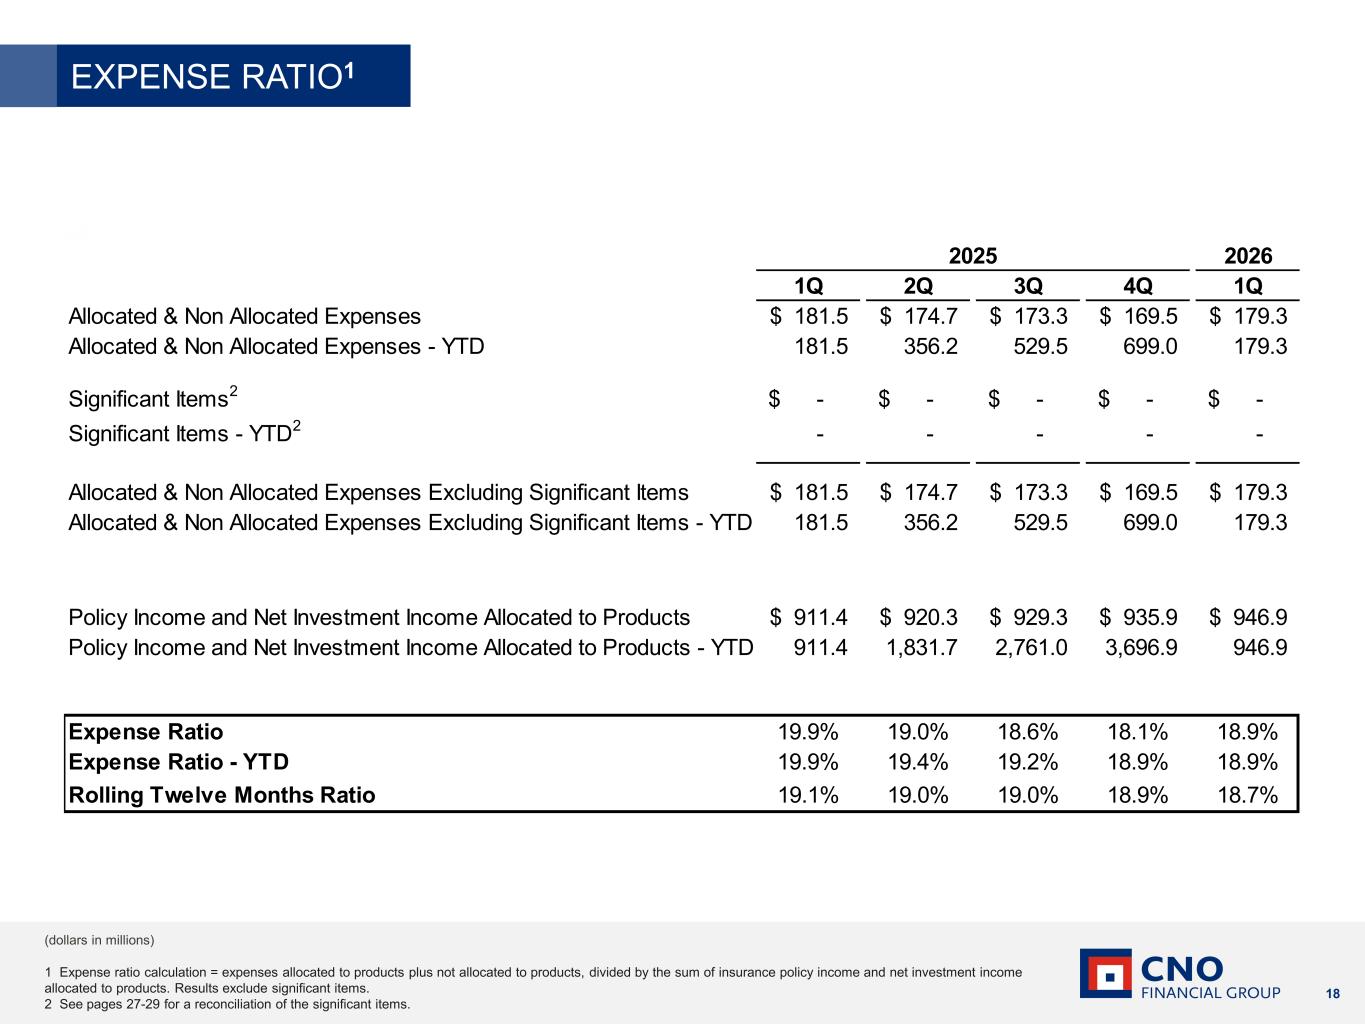
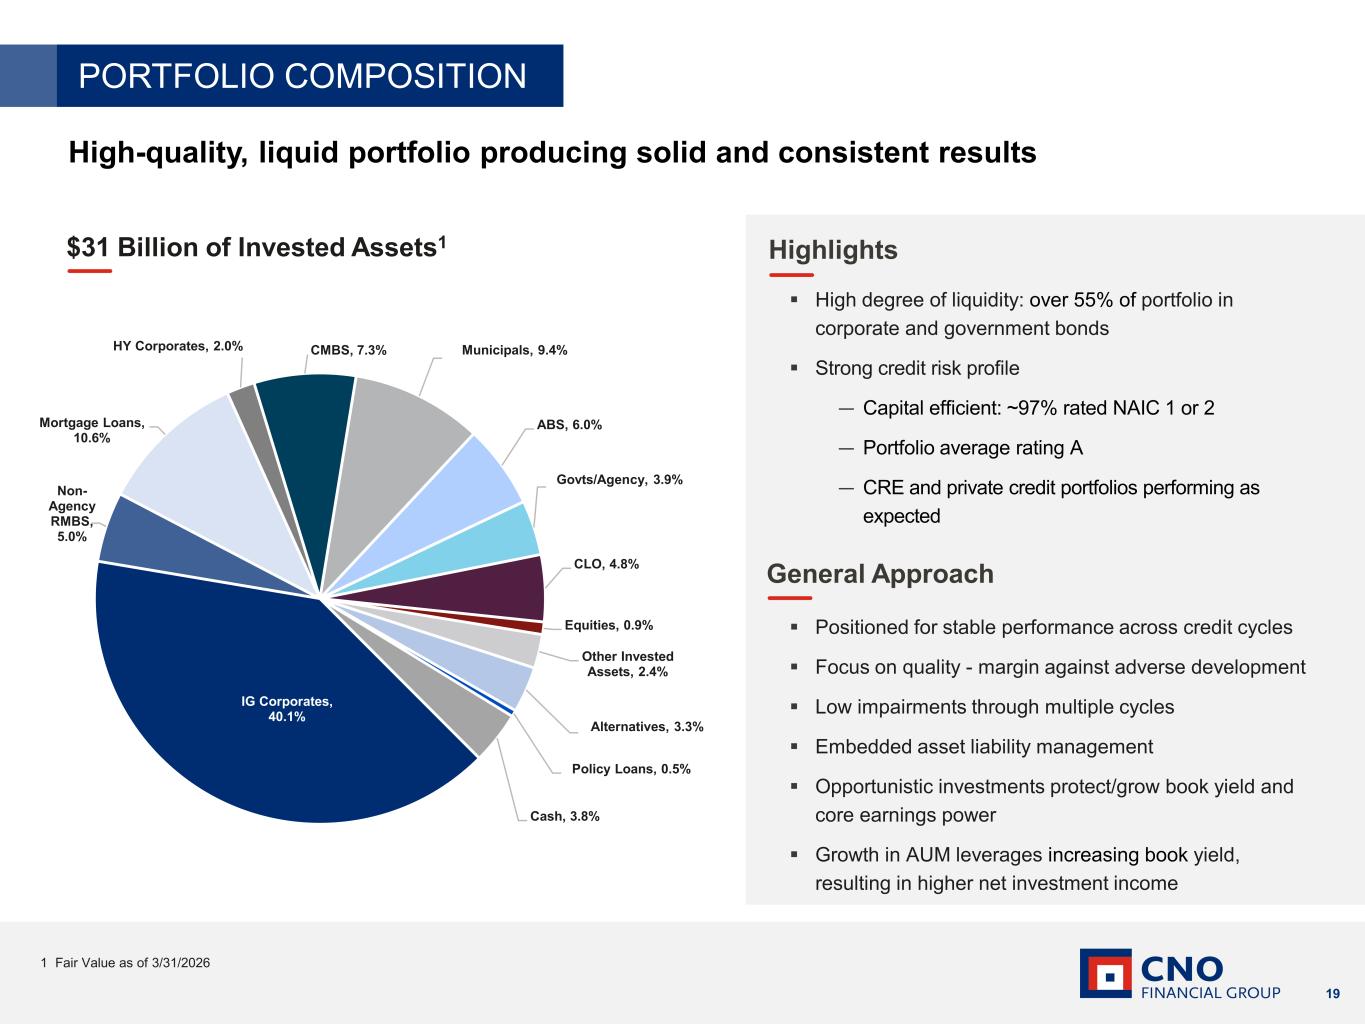
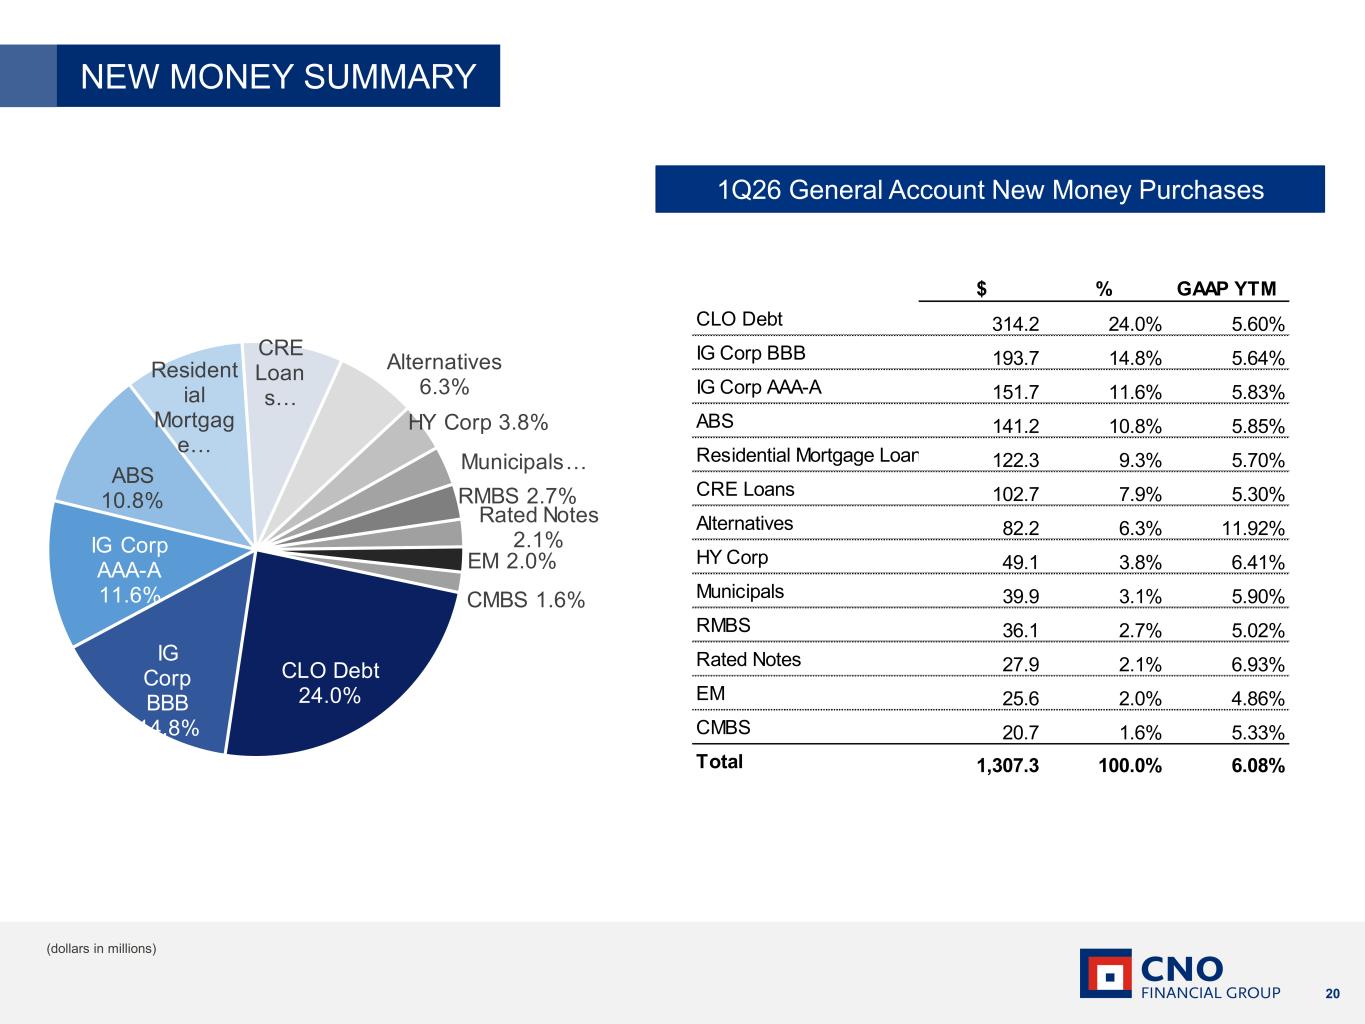
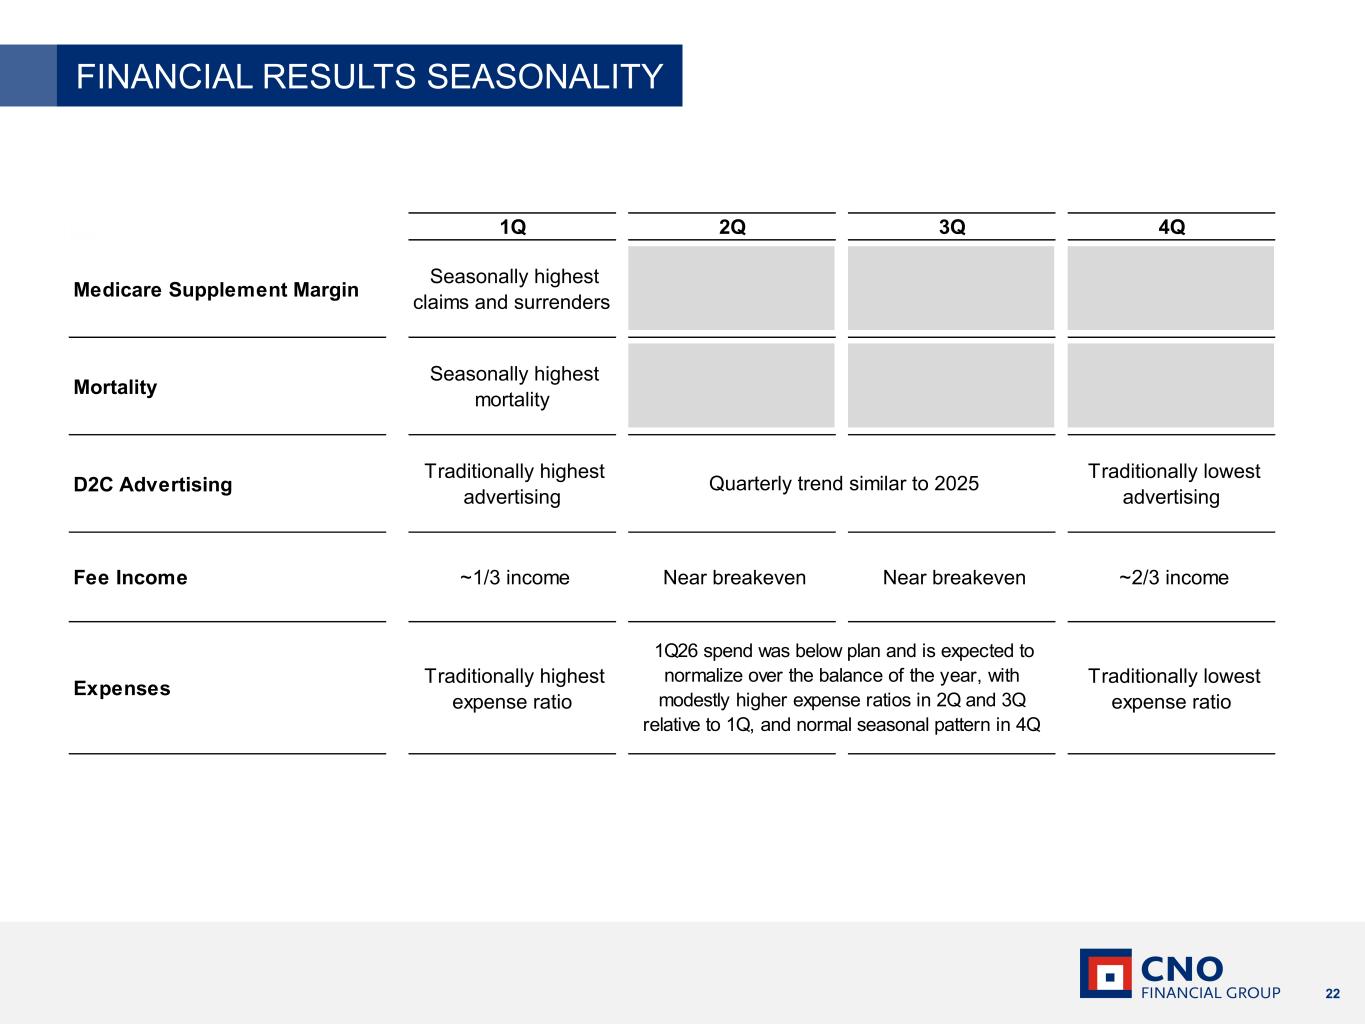
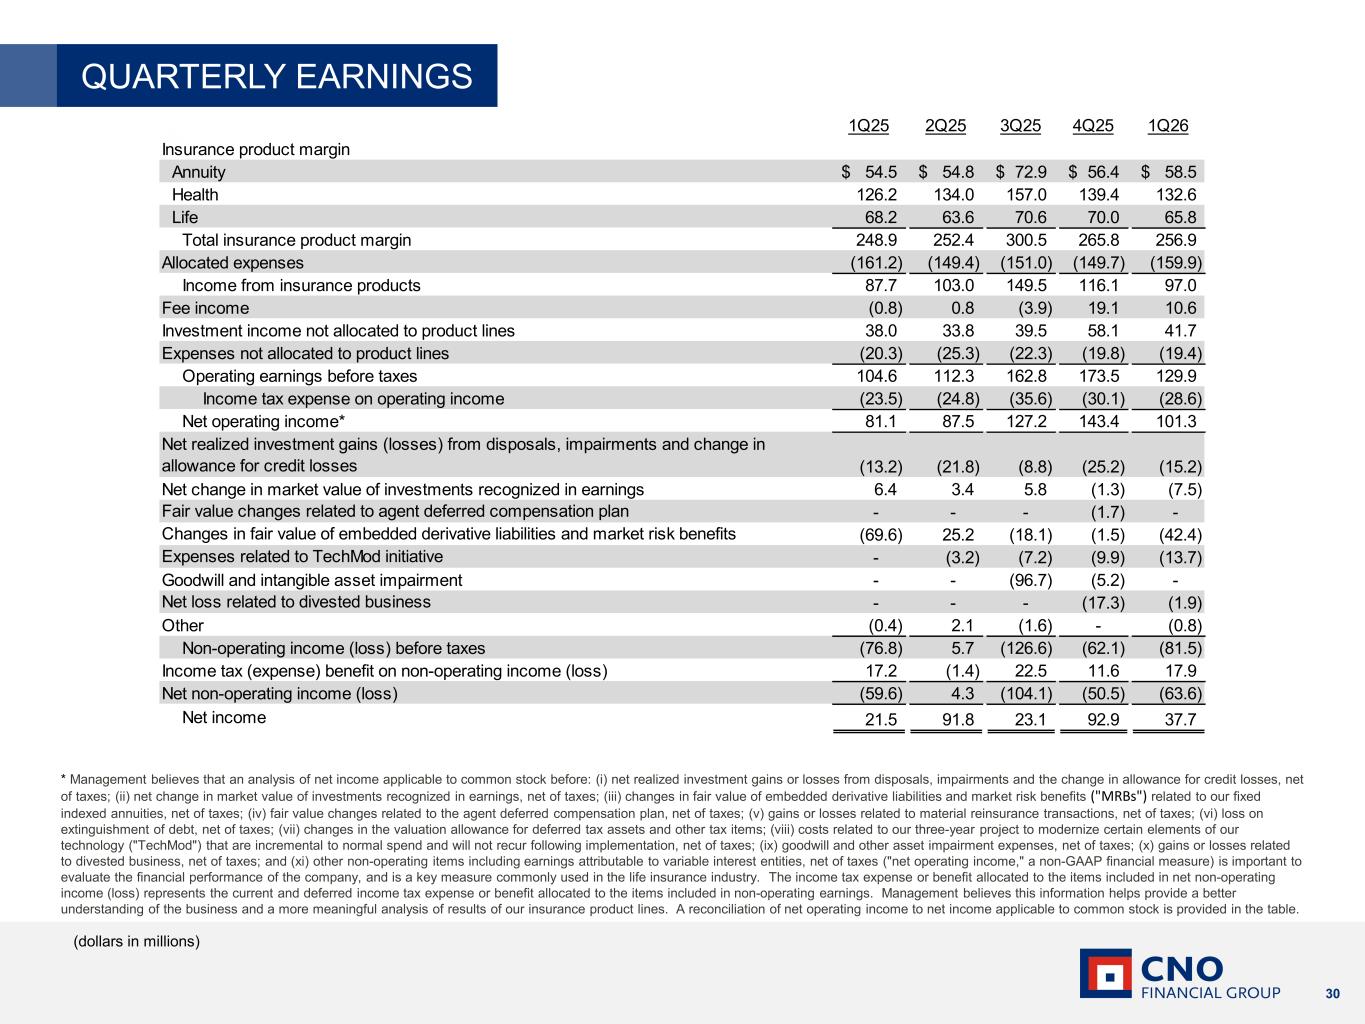
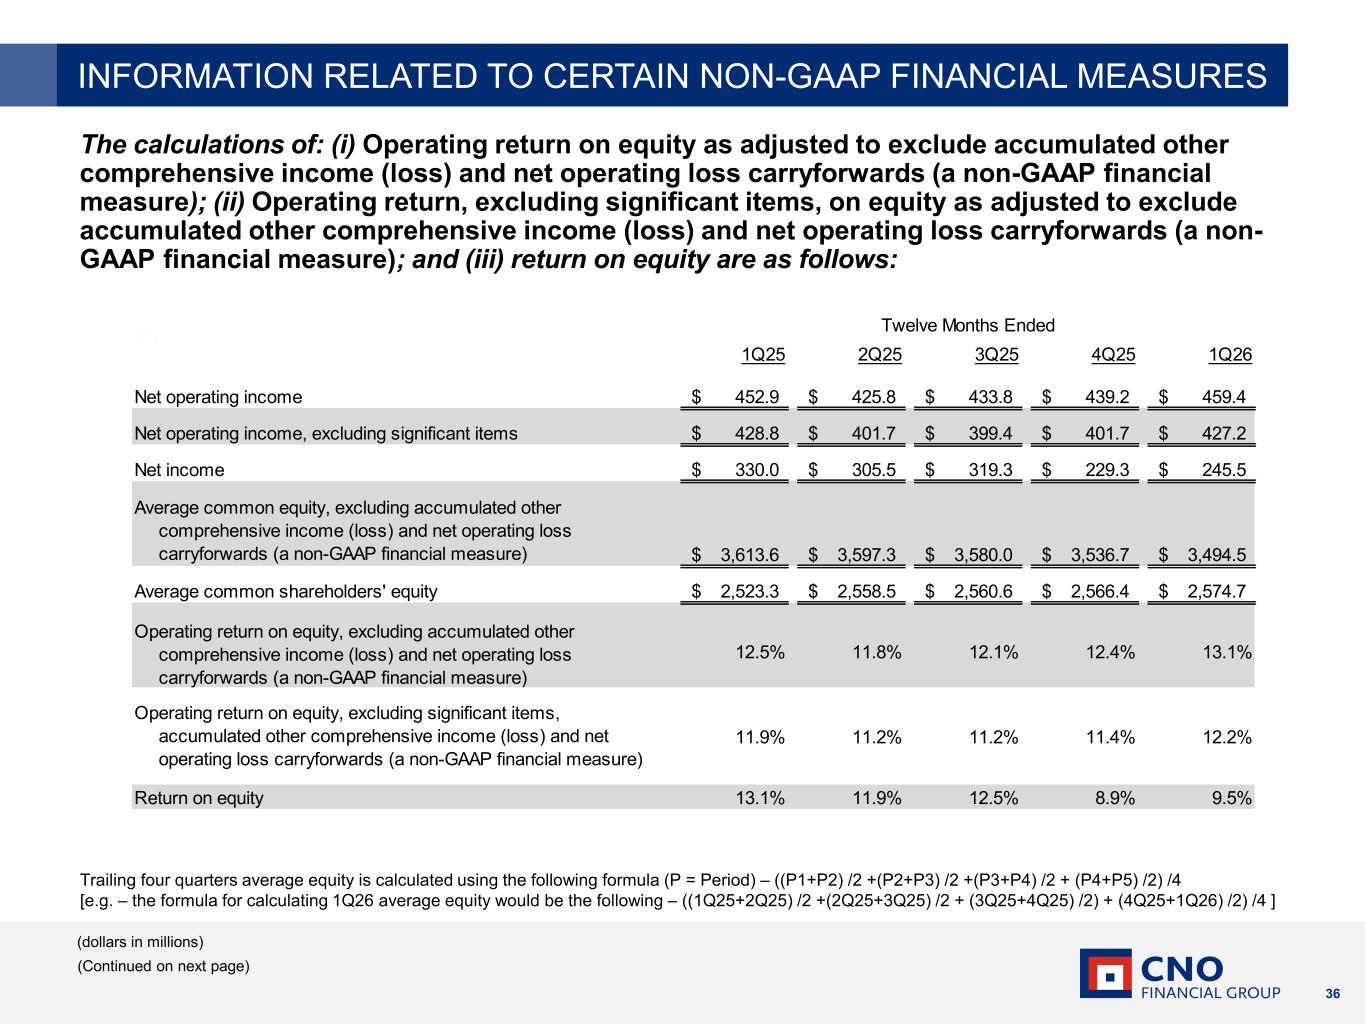
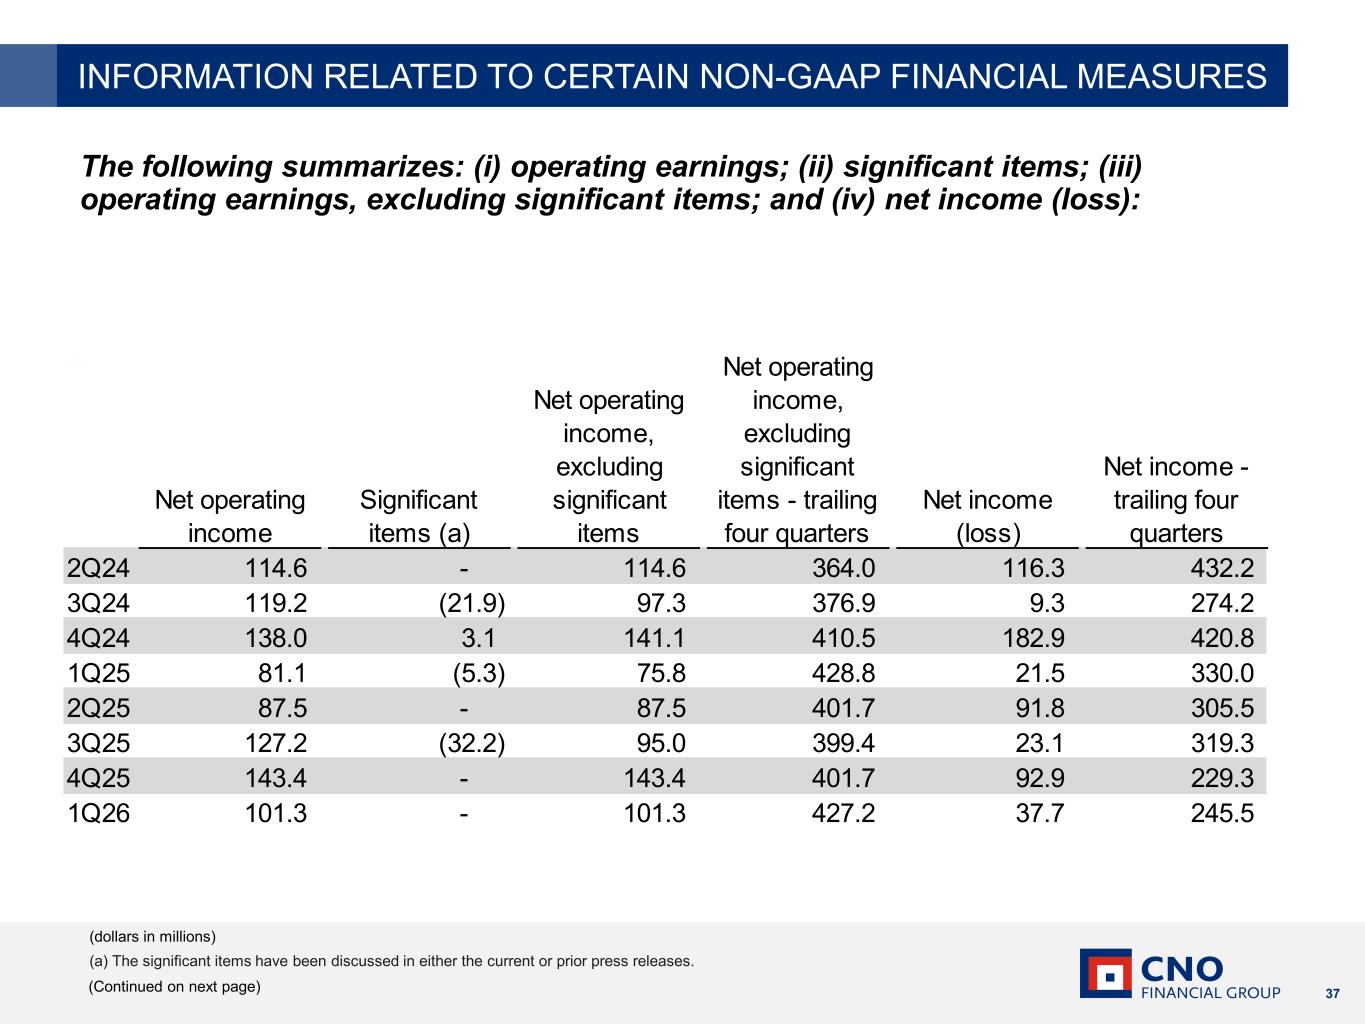
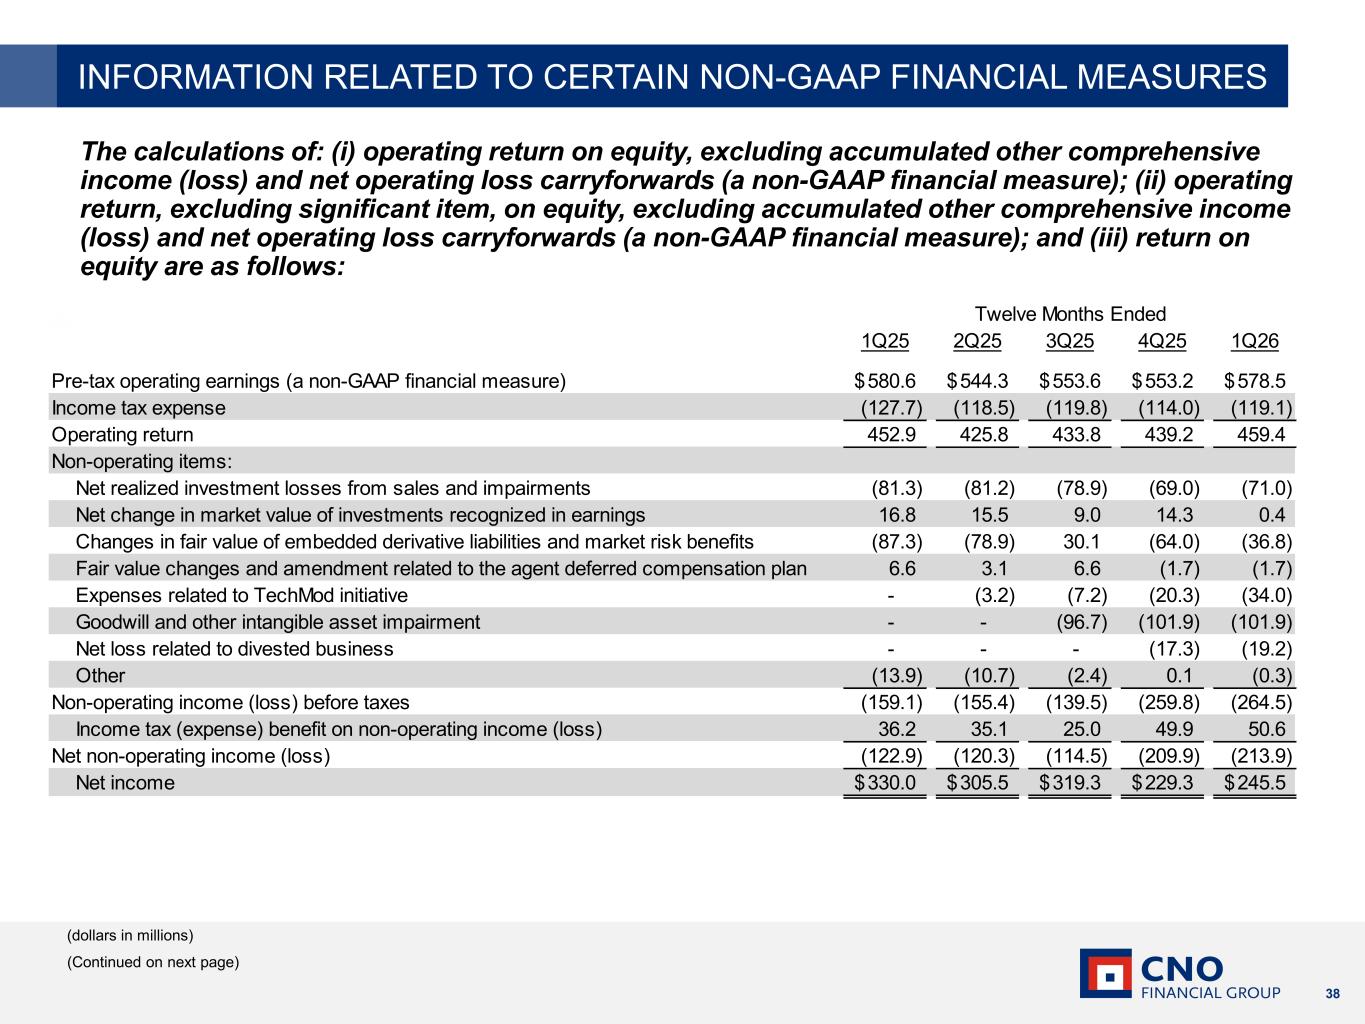
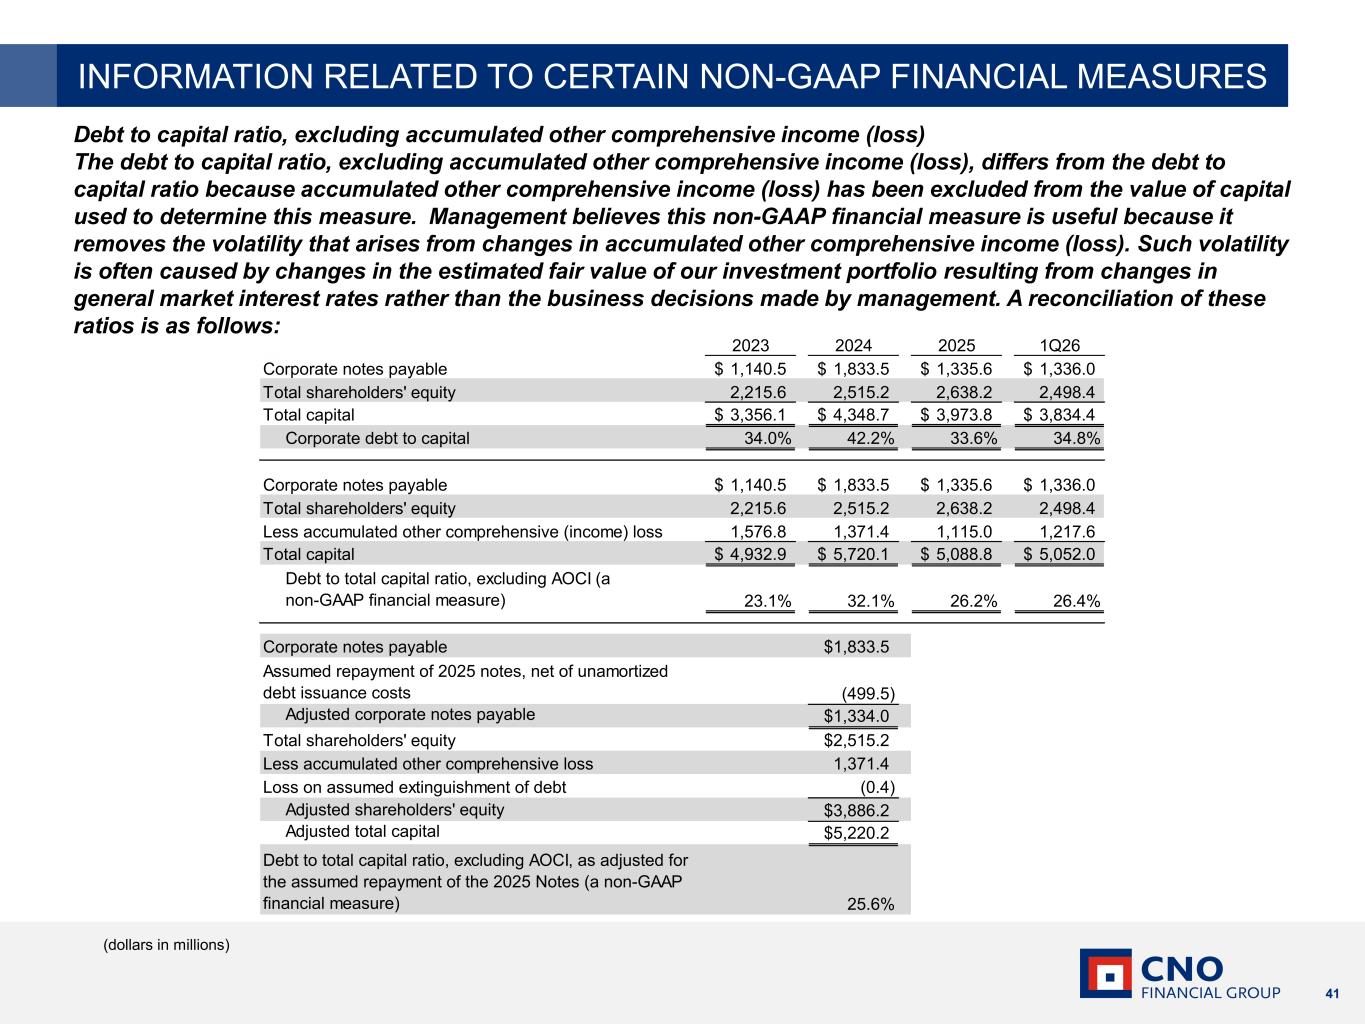
Thank you, Gary, and good morning, everyone. Turning to the financial highlights on slide eight, operating earnings per share were $1.05 for the quarter, up 33%, and up 42%, excluding significant items in the prior period. The increase reflects continued profitable sales growth, strength in underwriting results, growth in net investment income driven by growth in assets together with higher yields, and ongoing discipline in expense and capital management. Fee income was in line with expectations in the quarter. The expense ratio was 18.9%, reflecting lower than planned spending in the quarter, which we expect to normalize over the balance of the year. During the quarter, we deployed $60 million of excess capital on share repurchases, contributing to a 7% reduction in weighted average diluted shares outstanding. We continue to take a measured, disciplined approach to expense and capital management, reinvesting in the business to support growth, while also generating a healthy level of free cash flow, which we return to shareholders through dividends and share repurchases. On a trailing 12-month basis, operating return on equity was 13.1% and 12.2% excluding significant items. Turning to slide nine, outstanding sales performance over the last several years continues to drive growth in insurance product margins across each major product category. As a reminder, the first quarter is typically the lowest insurance product margin quarter of the year, reflecting seasonality across several of our products. Against that backdrop, our first quarter 26 results were solid, reflecting the strength of the underlying business. Fixed indexed annuities benefited from growth in the block. Supplemental health and long-term care both also benefited from growth in the block, with long-term care margin also reflecting favorable morbidity. Medicare supplement faced modestly adverse claims experience, partially offset by the favorable impact of continued growth. We expect rate increases over the course of 2026 to help address the recent claims experience. Our traditional life margins benefited from growth in the block, favorable mortality, and lower non-deferrable advertising expense. Overall, these results again demonstrate the value of our diversified product portfolio, where individual puts and takes across product lines typically net to stable and growing total margin over time. Turning to slide 10, net investment income increased 6% year over year, marking the 10th consecutive quarter of growth in total net investment income. The growth was driven by two key factors, growth in net insurance liabilities and related assets, which increased 4.8% in the quarter, and continued improvement in book yields, supported by 13 consecutive quarters of new money rates above 6%. Net investment income not allocated to products increased year-over-year, reflecting growth in the FHLB and FABN programs, while alternative investment income improved over the prior year but was slightly below expectations. Importantly, our portfolio continues to remain high-quality and liquid. The average book value of invested assets increased 4.2% year-over-year, reflecting growth in the business. Our investment posture remains disciplined, supporting durable income generation while maintaining flexibility in a volatile market. Our new investments in the quarter comprise approximately $1.3 billion of assets with an average duration of five years. Our new investments are summarized in more detail on slide 20 of the presentation. Turning to slide 11, our total capital position remains robust. The consolidated risk-based capital ratio remains well within our target range, which we manage between 360 and 390 percent, recognizing that some variability is expected quarter to quarter. Holding company liquidity ended the quarter at $280 million, well above our $150 million minimum target. Debt to capital was 26.4%, remaining comfortably within our 25 to 28% target range. Overall, our capital and liquidity position provides flexibility to support growth, manage risk, and deploy capital thoughtfully over time. Turning to our 2026 guidance on slide 12, we're pleased with our first quarter results and the momentum we're carrying into the balance of the year. We feel good about the variables within our control and the underlying performance of the business. However, given the volatile macroeconomic environment and the simple fact that we have three quarters yet to go in 2026 we are affirming our original guidance at this time and consistent with our historical practice we will refine our projections later in the year regarding our three-year operating return on equity target we have been clear that 12 roe was not the destination but rather a waypoint in the journey of our continued improvement. Our recent ROE results make it likely that we will increase our 2027 ROE ambitions. However, just as with our annual guidance, we don't believe it would be appropriate to update our 27 ROE target less than halfway through the three-year cycle. We believe credibility is built through delivery, not through frequent recasting of long-term targets, and we intend to update our ROE objectives for 27 and beyond no later than early next year. And with that, I'll turn it back to Gary.
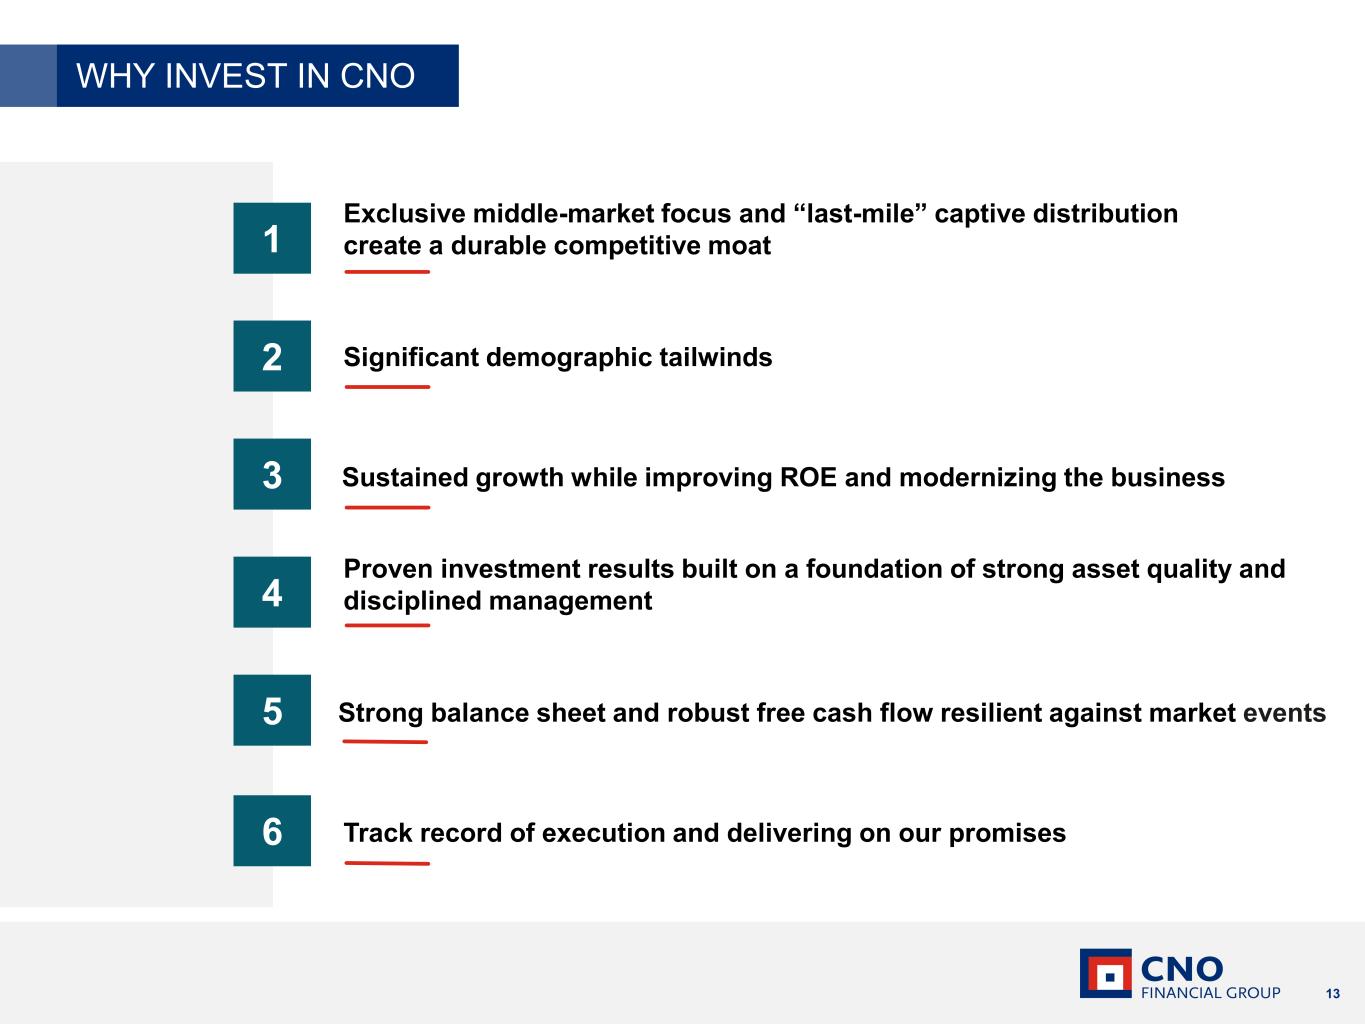
Thanks, Paul. Turning to slide 13, consistent, repeatable results continue to drive our momentum as we grow earnings, improve profitability, and reinvest in the business. Our results reflect the resilience of our business model and the strength of our diversified products and distribution. Disciplined execution will continue to drive our growth and create meaningful value for customers, associates, and shareholders in 2026 and beyond. Thank you for your support of and interest in CNO Financial Group. We will now open the call for questions.
Operator
Operator? we will now begin the question and answer session please limit yourself to one question and one follow-up if you would like to ask a question please press star one on your telephone keypad withdraw your question please press star one again please pick up your handset when asking a question if you are muted locally please remember to unmute your device please stand by while we compile the Q&A roster. Your first question is from Sunit Kamath with Jeffries. Please go ahead.
Thanks. Good morning. I wanted to start with the MedSup business. Paul, I think you talked about in your prepared remarks, some pricing plans. Can you flesh that out a little bit and give a sense of the timing of when you'd expect those premiums to sort of kick in?
Sure. Hi, Sidney. So we started seeing some increase in our med subclaims last year, translating to higher benefit ratios. As you know, as you just mentioned, we have the opportunity to file rate increases annually, allowing us to address emerging experience and maintain profitability of the book over time with a bit of a lag. So in 25, we filed for rate increases in two buckets. The closed block with a January 1-26 effective date asking for an increase of 10.5 percent, and we received approvals for 10.2 percent. And then the closed block with July 1-26 effective dates, we filed for 16.8 percent, and we're expecting approvals for around 14.5 percent. These rate increases earn in over time with the full quarterly impact over these two blocks evident by fourth quarter of this year, which should translate to improved benefit ratios depending a little bit on claims experience in 26, which we would then address with 2027 rate filings. In the long run, over time, METSUP is a good product for us meeting our target returns. The good news is that METSUP is not our only product. And I think this illustrates the strength and the resiliency of our business model, including its product diversity, which typically translates to puts and takes and product margin across our product portfolio, but relatively stable and growing margin in total, and you certainly see that in our first quarter results.
Got it. And are those two buckets that you mentioned similarly sized, or is one bigger than the other?
The closed block, I'd say, is maybe two-thirds, and the open block about a third, roughly.
Okay. And then maybe for Gary, just focusing on the consumer segment, at the product level, it looked like health gap was quite strong, but life, DTC, and annuities, less so. And I think you'd mentioned in annuities, some tough comps. So maybe just give us some color in terms of what you expect there. Are we getting to the point where the comps are getting just too difficult to grow, or was there something anomalous in the first quarter? Thanks.
So, Sunit, thanks for the question, and thanks for the continued interest in C&O. I didn't see any particular anomalies in the first quarter. And if anything, I would argue that all of the forces that have continued to allow us to grow are still there. You've still got the population. You've still got 11,000 folks turning 65 every day. You've still got the absence of alternatives. You've still got longer lifespans. You've still got the fact that the government can't solve this problem. We expect demand for these products to continue to be very robust. You're right in citing the fact that we had tough comparables or strong comparables, I guess I should say. Frankly, I would kill to have that problem every quarter. And even the 2% that we cited, I really regarded that as nothing more than just quarter to quarter fluctuation. I mean, remember, if the selling season in one quarter is one or two days shorter than another quarter, you're going to see variants. There's all kinds the stuff that goes on every quarter. To be really blunt, I don't pay that much attention to volume from quarter to quarter. I'm way more focused on the one and three year trends and everything I see points me to strong demand and more importantly, or at least as importantly, a really strong ability on our product portfolio and distribution network to be able to execute and meet those demands. So I am extremely bullish and I wouldn't pay any attention to you know, minor fluctuations of 1% or 2% here or there. It's, in my mind, irrelevant.
Operator
Your next question is from Ryan Kruger with KBW. Please go ahead.
Hey, thanks. Good morning. First question was just on expenses. I know you mentioned normalization during the rest of the year, but I mean, would you consider this all timely related in terms of the abnormally favorable expenses this quarter, or do you think we are actually seeing some favorability maybe to what you had originally expected?
Hey, Ryan, it's Paul. I'm not sure I'm totally following the question, but just to offer some thoughts, and please give me a follow-up if I'm not answering the question. So, there's always some variability across quarters. It's somewhat difficult to plan each quarter exactly. Typically, in the first quarter of the year, we have higher expenses, which translates to a higher expense ratio, and that grades down over time. That's been pretty consistent over the last several years. Honestly, that was our expectation this year. It hasn't played out that way. Um, but, uh, we expect that the expenses for the full year will still come in, uh, around where we had originally planned and, you know, that should translate to, uh, you know, the expense ratio, uh, when you do the math, having said that, you know, the, the, um, growth we're seeing in the business, uh, will, uh, drive likely some favorability in the denominator of the ratio, and I think that points to the continued leverage that we're getting in the business from the growth that we're seeing. So, Ryan, let me know if that did not answer your question.
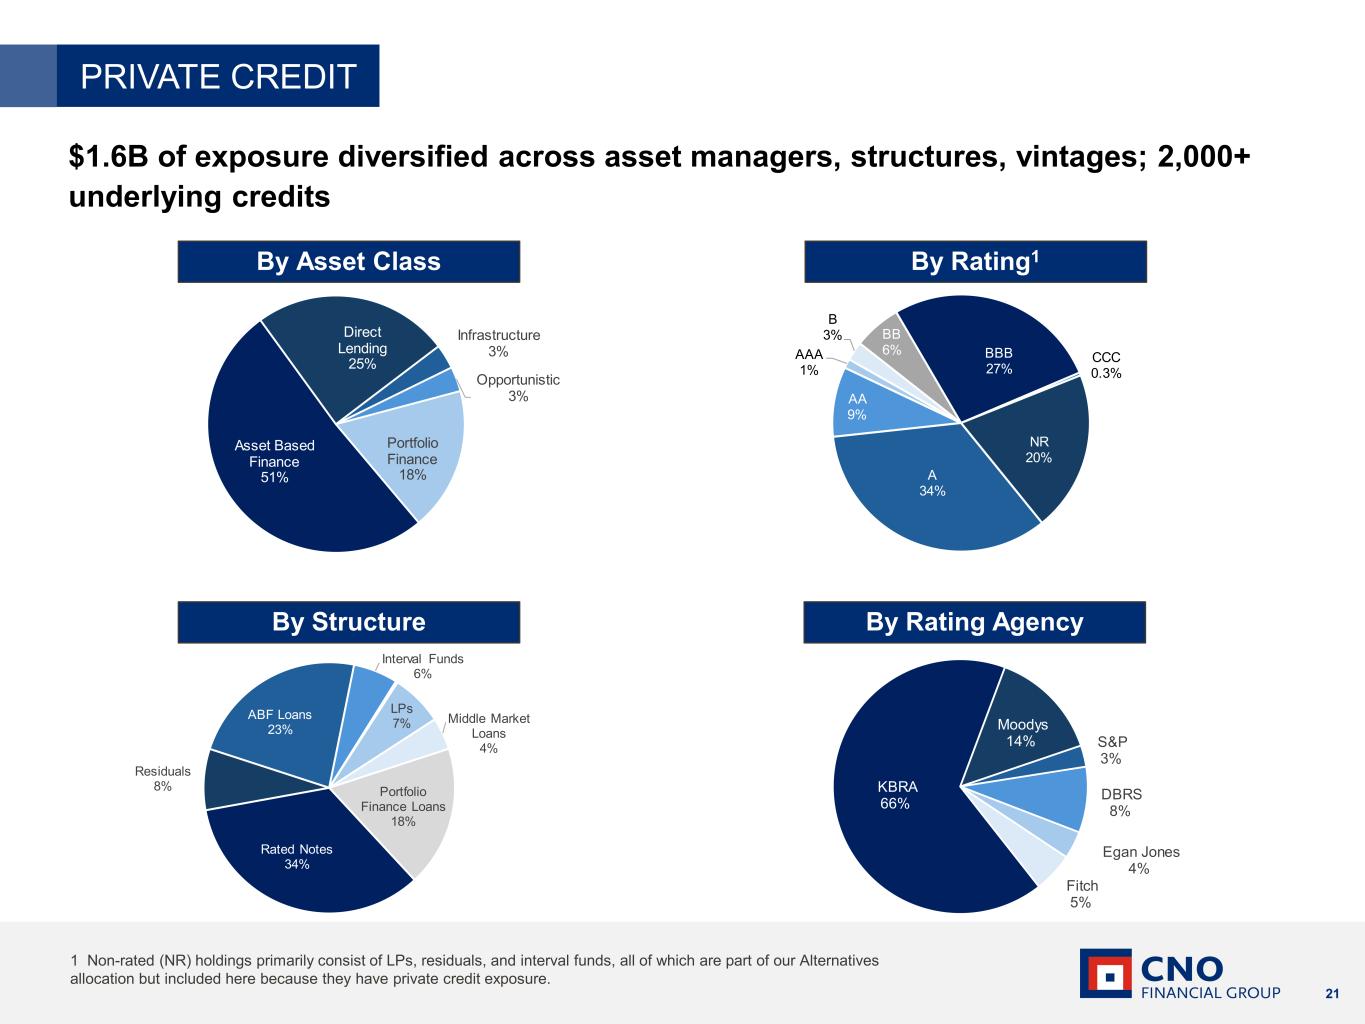
No, that was exactly what I was getting at. Thank you. And then I just had one for Eric johnson there's certainly been a lot of volatility and i guess concern fluctuation in the credit market c phase just curious about your perspective on what you're seeing in the credit markets and and also where you're seeing good opportunities to deploy new money right now yeah uh good morning and and all right good morning and and and thank you um you know we've always taken the the point of view that we wanted to have a stable and consistent investment performance at CNO.
And so our asset allocation model over the last couple of years has really been predicated on being capital efficient and storing up dry powder for a more favorable environment where you could really make some money at lower levels of risk versus making very little bits of money at maybe higher levels of risk. And so, you know, as we got into this year and you had some ball in the first quarter, you know, you saw a lot of rate ball. I mean, you know, Treasury curve moved up, you know, 30, 40 basis points. But, you know, credit spreads were actually pretty flat, kind of traveled in a five to, in IG, maybe a five to seven basis point channel, high yield, maybe 30, 40 basis point channel. So you didn't really get the credit market was pretty well behaved largely because there was a lot of demand for product at higher rate levels. You know, investors were willing to buy buy stuff. And and you saw that in over subscriptions and continue, you know, execute good executions on on on on new issues. So through the quarter, you know, we pretty much stuck to our knitting. As you can see, it's in the earnings deck. You know, we worked shorter on the curve largely because that was our ALM need, and we wanted to keep that in check. And then secondly, you know, we just didn't, you know, there was not the extreme opportunity to make big money. So, you know, that's reflecting new money rate, which is around a little higher than 6%, consistent with prior quarters. We didn't lunge at the market. We're going to let it come to us. Don't think this story is in the ninth inning. And as the economy evolves and the impact of higher energy costs and other things happen, there'll be better entry points for a real change in strategy. We're not there yet. Great. Thanks a lot. Appreciate it. You're welcome.
Operator
Your next question is from Joel Hurwitz with Dowling & Partners. Please go ahead.
Hey, good morning. Wanted to start on the ROE target, and good to hear that'll likely increase. I guess, what do you think are the biggest drivers of the recent outperformance that you guys think is sustainable moving forward? Is it growth, expenses, experience?
You know, I think it's all of the above. As we've said, as we've been saying for a couple of years, there aren't really any silver bullets here, but it's really a combination of things, actions taken across the value chain of the business that is driving earnings growth and some of its earnings, of course, but we're also taking actions in the denominator of the calculation. So, you know, being as efficient as possible in capital, we continue to focus on that. So it's, again, I feel like a little bit of a broken record on this question, but the answer hasn't changed. And that is that we are focusing on the entire business and there are things that we are doing to improve effectiveness and efficiency and to drive growth and to drive, you know, risk adjusted returns in the investment portfolio and to optimize capital. You add all that up and sort of on a compounding basis, it has been driving ROE improvement and we expect we'll continue to do so.
Got it. That's helpful. And then shifting to long-term care, can you just sort of unpack the experience and maybe expectations moving forward, right? Results have been favorable and they look to, you know, improve further this quarter, I guess. Is a margin around 50% sort of the new normal for that business?
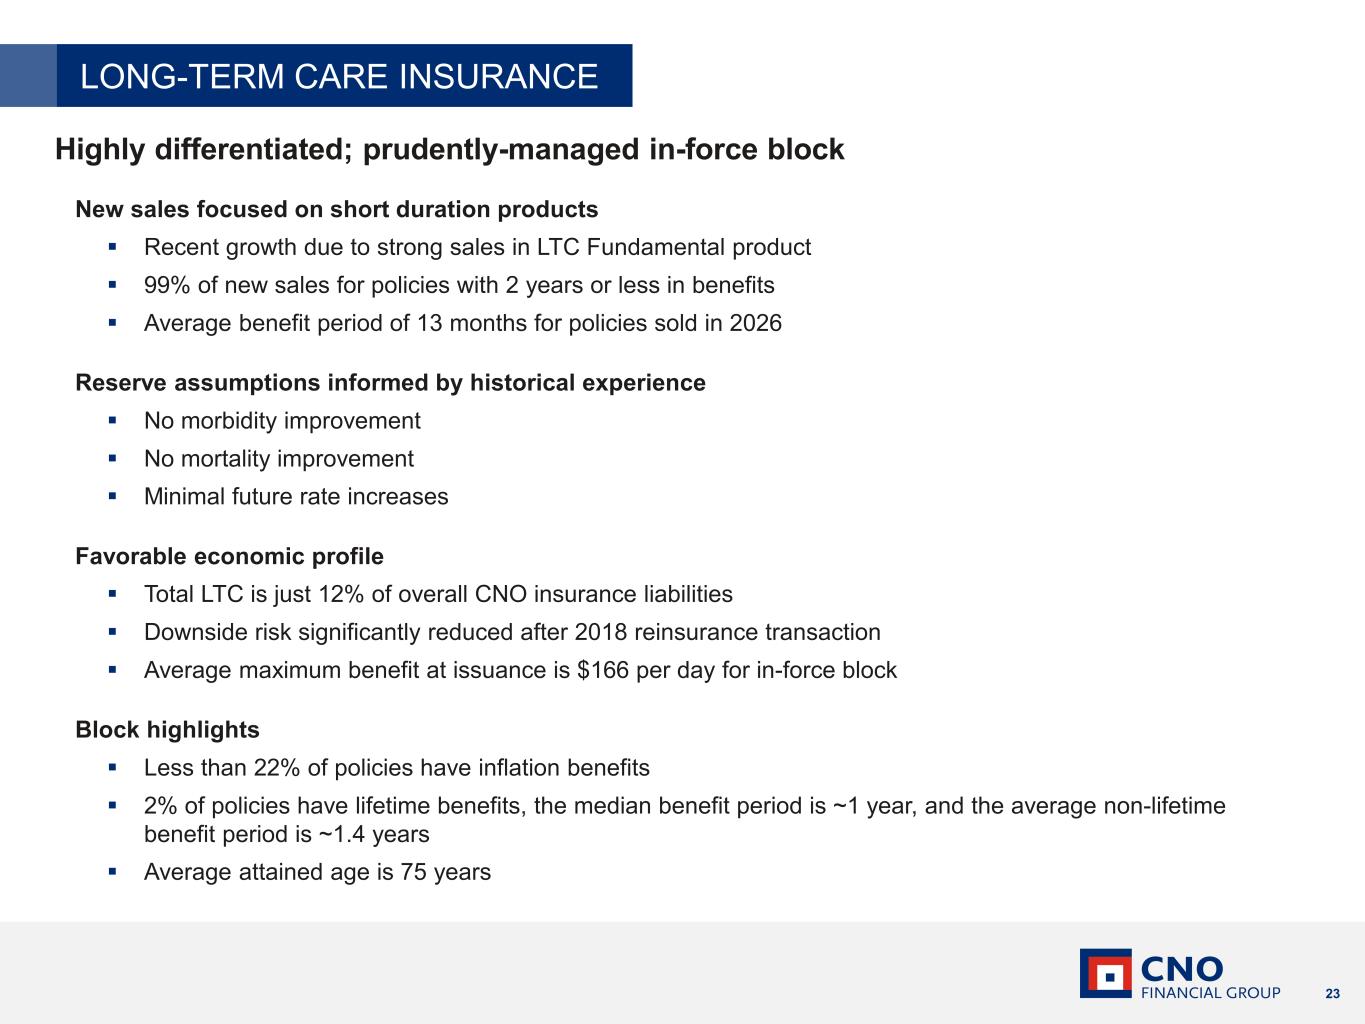
Yeah, so long-term care continues to perform exceptionally well. It continues to surprise us a bit to the upside, including in this quarter. You know, we revised assumptions a bit last third quarter. You know, we'll do that again. this year in the third quarter, and we'll see how things evolve, but the claims experience has been reasonably stable and favorable. It continues to be a great business for us. It's a product that our customers need, and it's designed and priced in a way that generates good returns and stable results.
Operator
Your next question is from Jack Matten with BMO Capital Markets. Please go ahead.
Hey, good morning. Just one follow-up on the ROE target. Given that C&O is currently at 12.2%, there's still, I think, some meaningful benefits to emerge from actions you've taken in recent quarters. I'm just wondering if there are any partial offsets or places where there could be some normalization as we think about that overall trajectory? Because it just seems there could be some meaningful upside versus the original 12% target based on where things are currently running.
Yeah, Jack, I can provide some initial thoughts and Gary may want to jump in. I guess two points. Number one, the operating earnings we continue to drive and, you know, within a sort of a reasonable range. We expect to be able to continue to drive growth in operating earnings. We'll continue to focus on capital to drive improvement on that side of the equation. The other comment that I would make is that the denominator is shareholders' equity, and so it is impacted by non-operating income, which, as you know, is volatile. So that can create some noise, you know, plus or minus in the ratio over time. But over long periods of time, you know, that tends to even out. So I'll leave it there. I don't know, Gary, if you want to offer some higher level comments.
Yeah. Yeah. Thanks, Paul. Jack, thanks for the question and thanks for the interest. I think an important perspective to remember 12 percent you know we started out at the end of 2024 and said we wanted to improve our ROE by 200 basis points in three years. But we have from the outset been clear externally and internally that that 12 percent number is not the destination not even close we have to continue to improve we will continue to improve so you should absolutely count on the fact that we're going to do everything we can to drive that above 12 really the only question is by one and by how much so whether we get to 12 in 2026 or 2027 or whatever it is our aim is to continue to improve upon that that's not good enough we can get better and that's within our reach the only thing we're stopping short of doing is communicating by how much and by one but you should absolutely uh take certainty in the fact that we are driven
to improve that beyond 12 12 is nothing more than a waypoint that's helpful thank you and um my other question is just on the rbc ratio and conzo that's seen as right in the middle of your target range right now i guess like sequentially this quarter was there any kind of movement or impact from lower equity markets on hedges, kind of like what you had last year? And I guess if that is the case, would it be fair to think there's been a likely recovery on a market-to-market basis, given what's happened in April? Just curious, any sensitivity you can provide around those movements?
The answer to those questions or comments, Jack, are yes and yes. We did have an impact from the S&P being down about 5% in the quarter. As you know from your question, that drives the reserves for FIAs and interest-sensitive life down. Economically, it drives the call option assets down by roughly the same amount, but because there's a prescribed flooring in the statutory reserves of the FIAs and the ISLs, you end up with some noise, meaning lower surplus, lower RBC, lower dividend capacity. But as the equity markets recover, as they've done already in the quarter to date, that unwinds. From a planning perspective, we assume that this is a neutral impact in the year and over time. Thank you.
Operator
Your next question is from Wilma Bertis with Raymond James. Please go ahead.
Hey, good morning. Can you talk a little bit about the FAA ban market this year? Our understanding is that just the spread environment is a little bit less favorable. Just interested to hear what you're seeing there.
Thanks, Wilma. I'd invite you to take that, Eric.
You know, if you look at what spreads in the market did during the first quarter of the year, financials actually widened out relative to, let's say, industrials. Financials, including insurance and banks, widened out relative to industrials. So if you want to think about it as kind of on an arbitrage basis, that's negative to kind of the basic arb of a funding agreement transaction, which is to be a financial, an insurance company that issues. And then you take the money and invest it hopefully in high quality industrials and utilities and things like that. So because of that negative R during the quarter, I think we run our program on a pretty strict high quality basis and we have a pretty high target return on equity. And so I think had we tried to do an offering during the quarter, it would have perhaps produced a marginal contribution and not the one that we try to run the program around. That, I think, is that circumstance is moderating a bit since quarter end. Financials have come in a little bit more. Rates are a little bit higher. So, you know, we've had some relief in that tension. And we'll continue to reassess that as we get into our next window, which will probably be in June. You know, we have a meeting about it this morning, actually, and, you know, we're keeping a close eye on it. But I would also say that we don't have to issue unless the time is right for us and we can achieve our targets without doing violence to our sense of risk and quality. So under no pressure to do anything, we'd like to because it's a good way to make money. We have a nice program. We're good at it and all that stuff. But we're not going to break the bank.
Makes sense. Sounds like a thoughtful approach. um and could you talk a little bit more about your mortality expectations for the year uh seems like there was something there was some favorability in the quarter but you know is that just kind of a one-off like what are you seeing there just any color you can give for the rest of the year would be helpful thanks hey Wilma it's Paul so yeah we saw some a bit of favorable mortality in our trad life business um I'd say you're kind of within a normal range of expectations.
And so we'll continue to monitor that and again revisit our assumptions in the third quarter.
Operator
Okay, thank you. There are no further questions at this time. I will now turn the call back to Adam Avil, VP of Investor Relations, for closing remarks. Please go ahead.
Thank you, Operator, and thank you all for participating in today's call. Please reach out to the Investor Relations team if you have any further questions. Have a great rest of your day.
Operator
This concludes today's call. Thank you for attending. You may now disconnect.