Operator
Hello, everyone. Thank you for joining us, and welcome to the C&O Financial Group fourth quarter earnings call. After today's prepared remarks, we will host a question and answer session. If you would like to ask a question, please press star 1 on your telephone keypad. To withdraw your question, press star 1 again. We will now hand the call over to Adam Alville, VP of Investor Relations. Please go ahead.
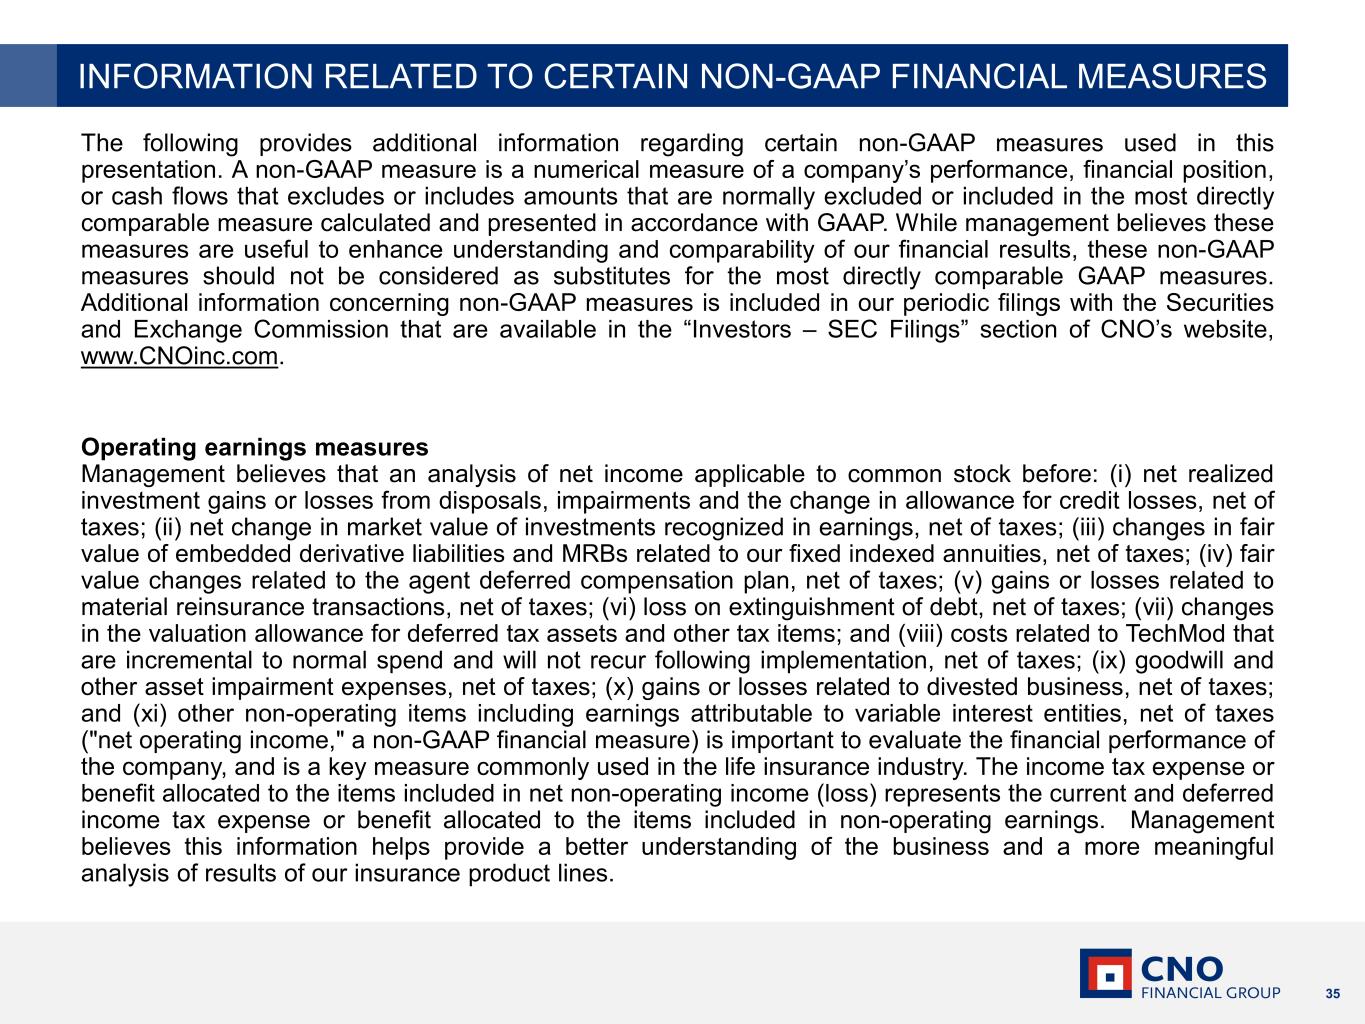
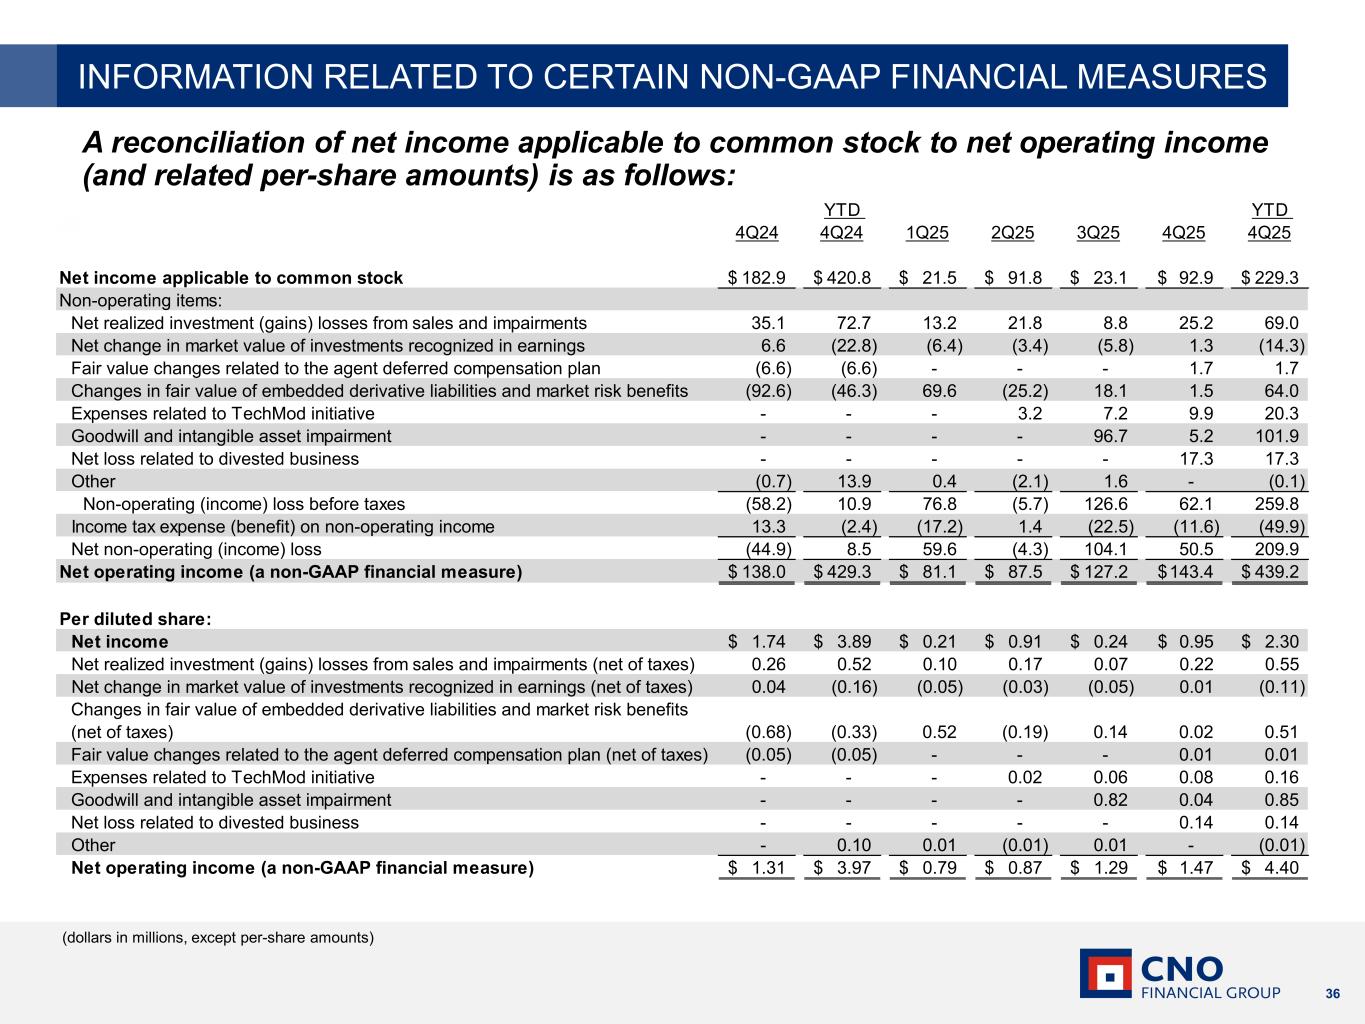
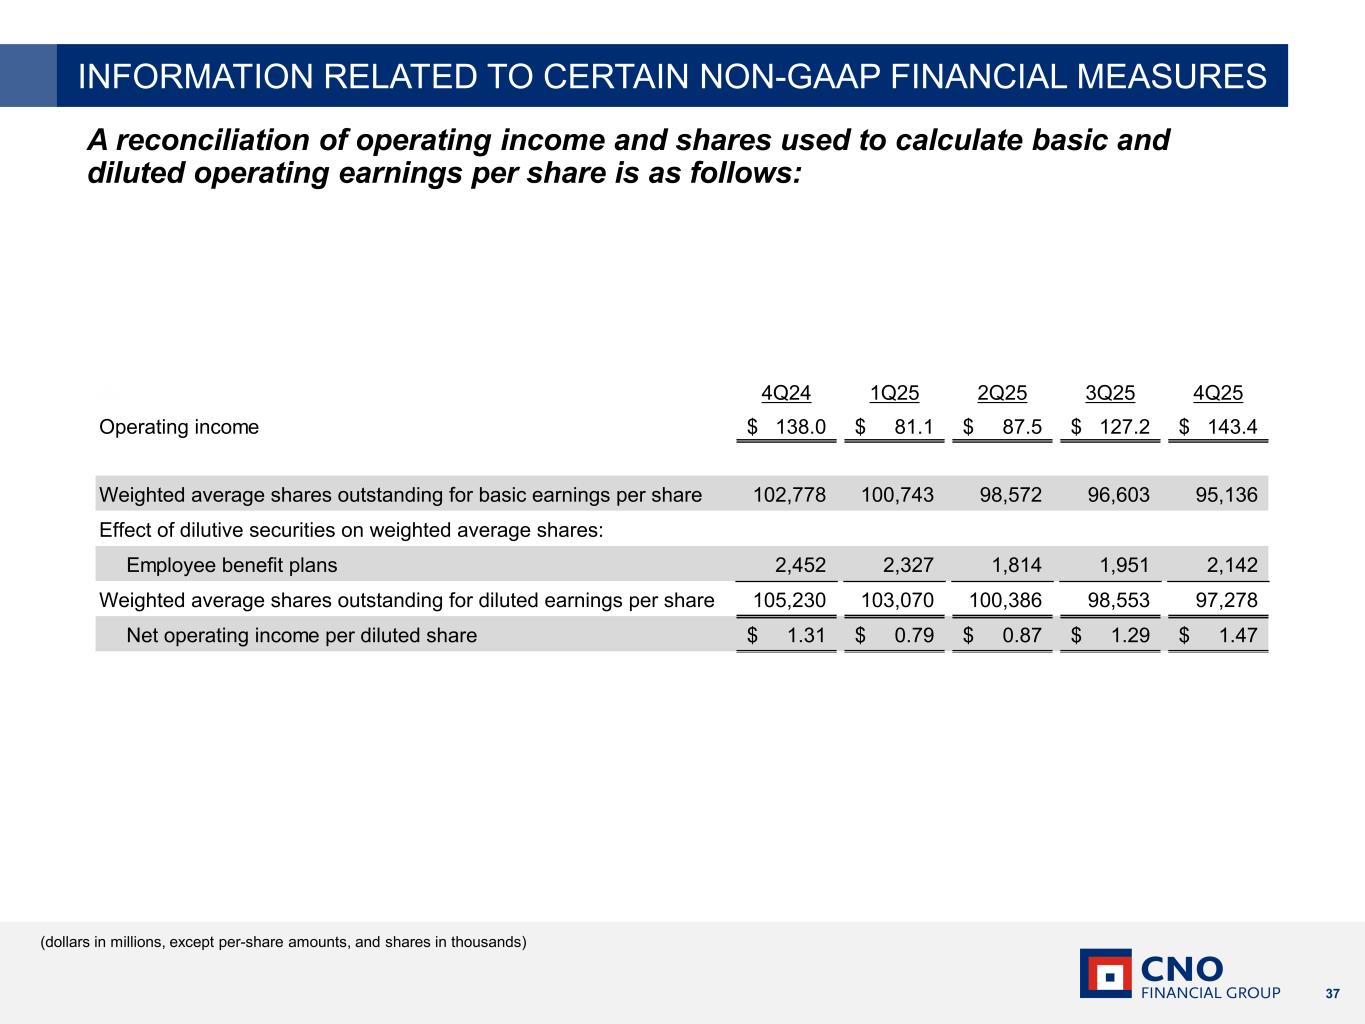
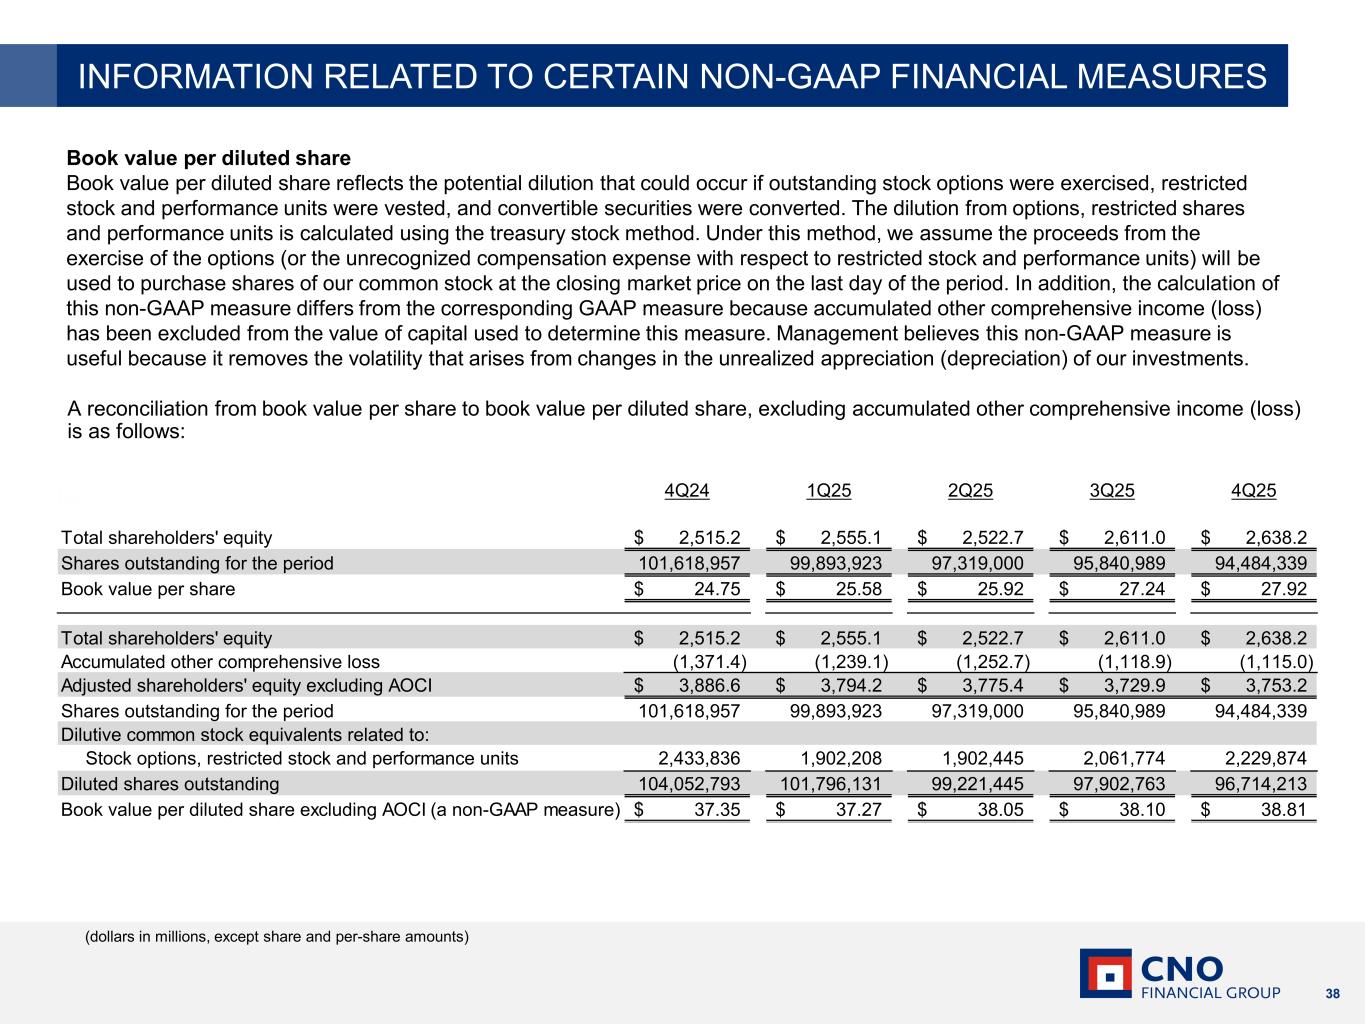
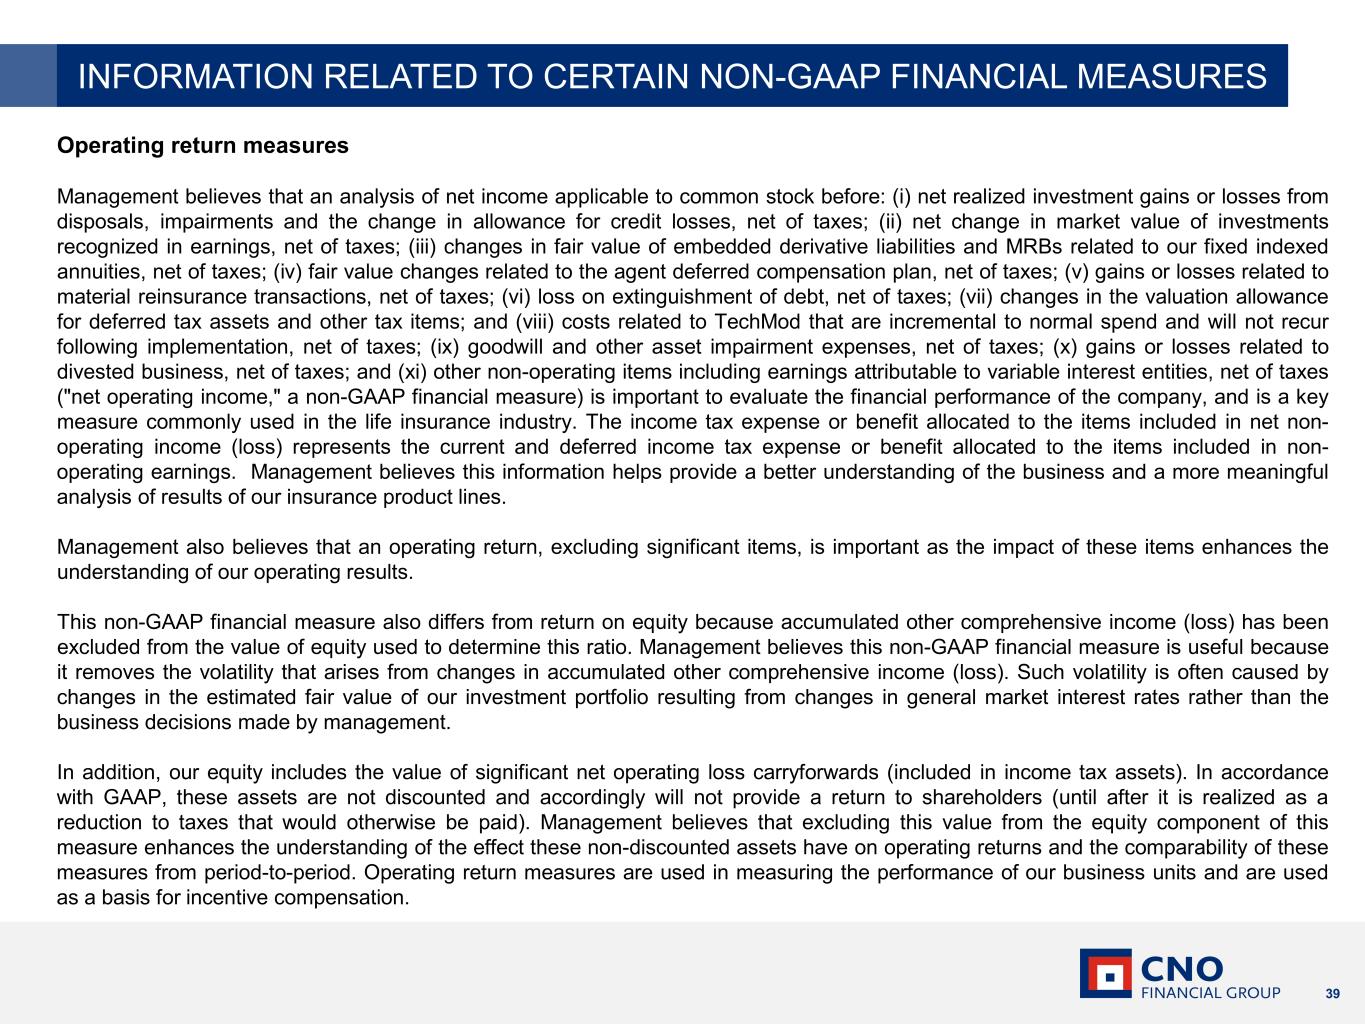
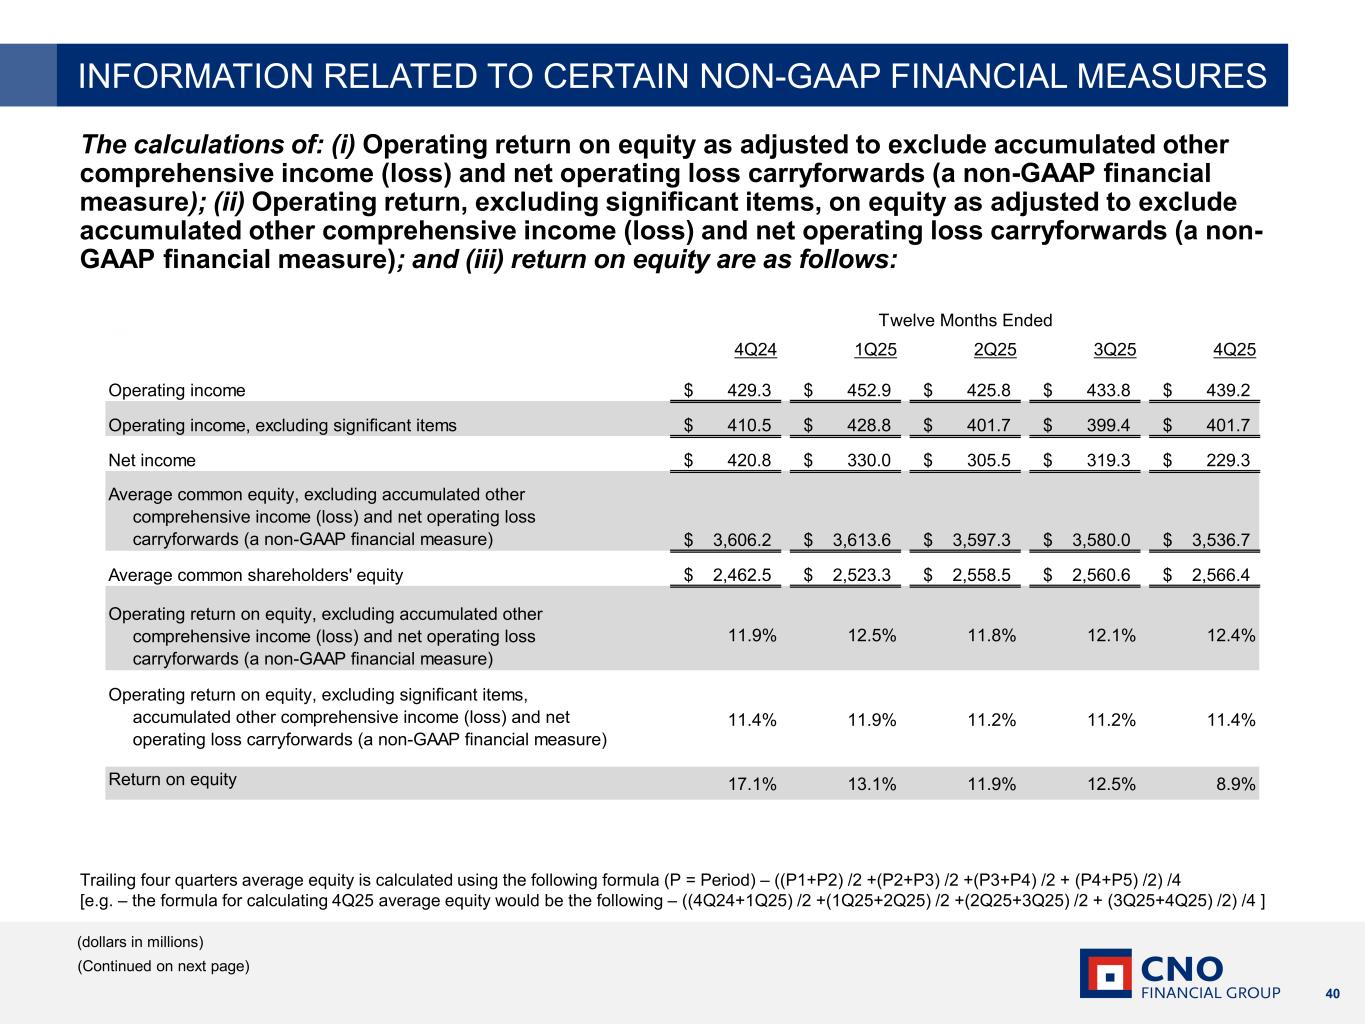
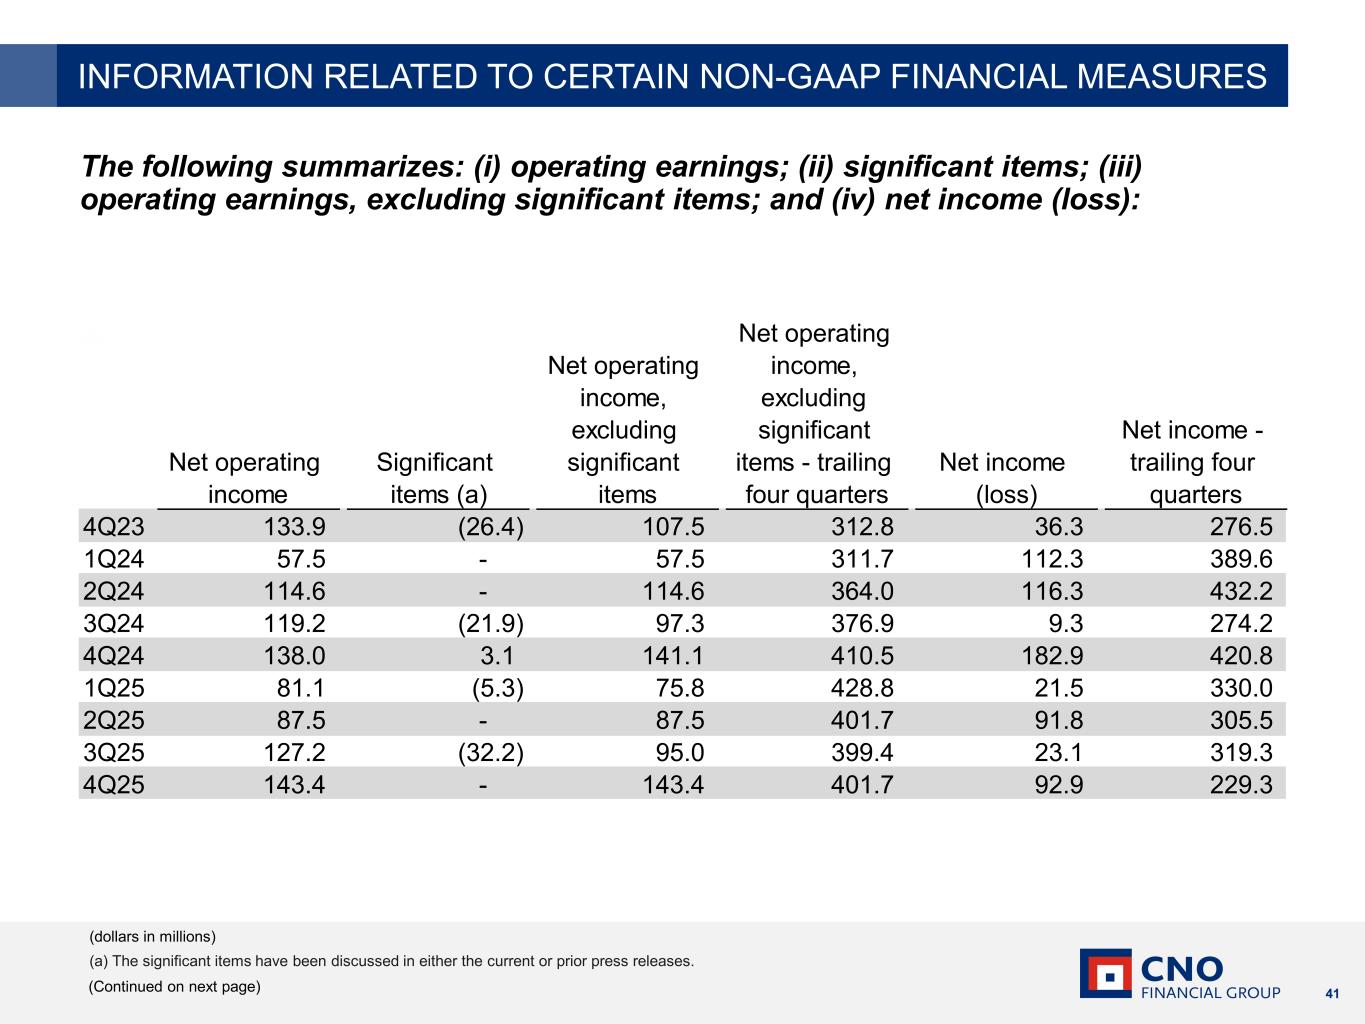
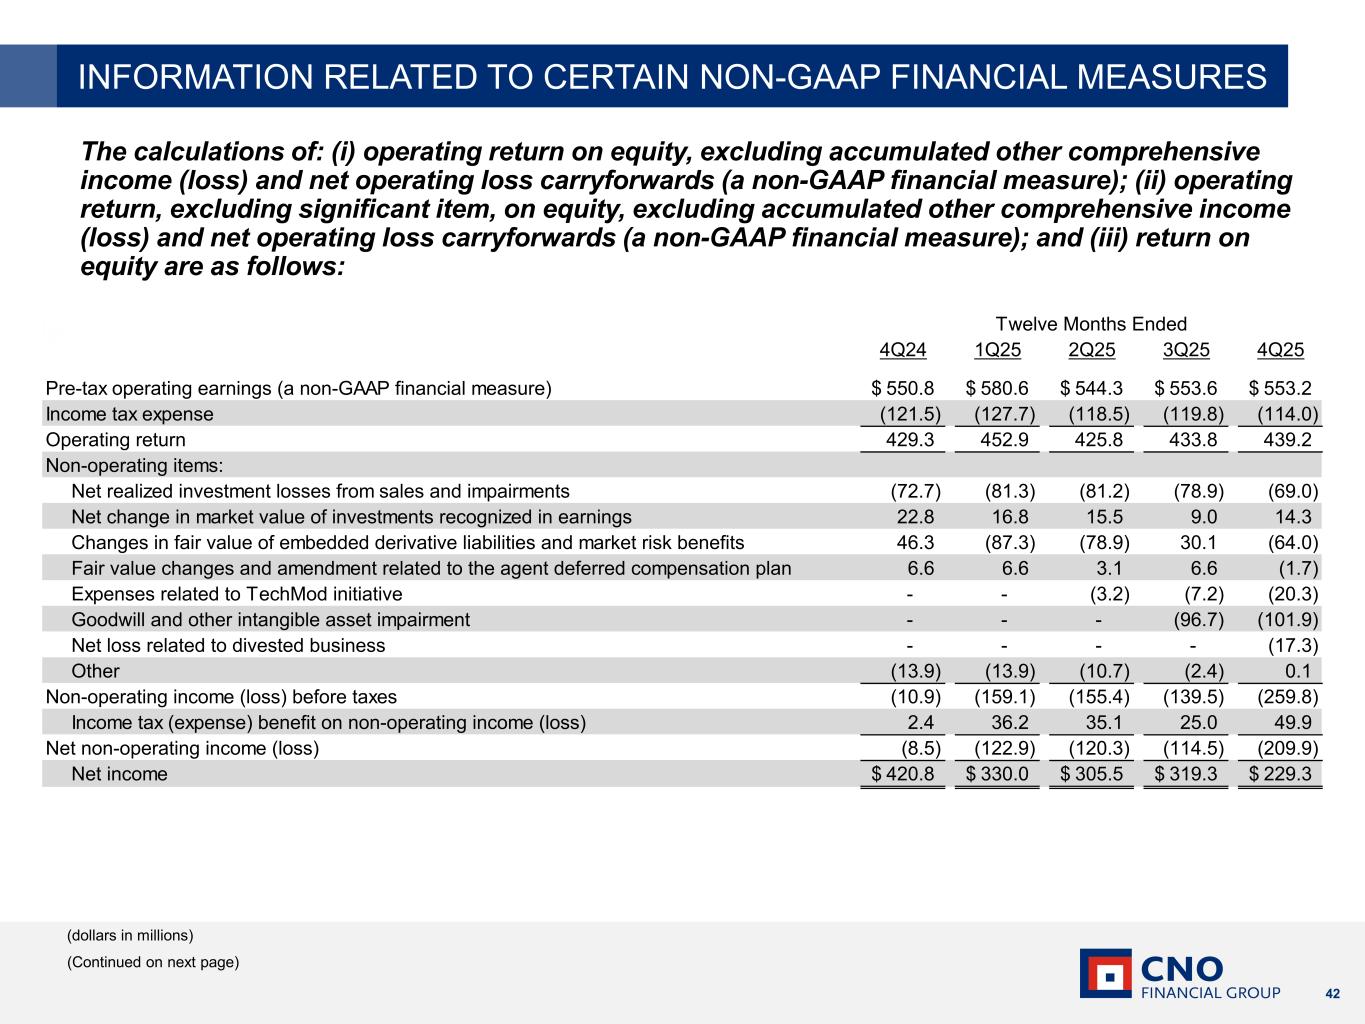
Good morning, and thank you for joining us on C&O Financial Group's fourth quarter 2025 earnings conference call. Today's presentation will include remarks from Gary Bajwani, Chief Executive Officer, and Paul McDonough, Chief Financial Officer. Following the presentation, we will also have other business leaders referring to information contained in yesterday's press release. You can obtain the release by visiting the media section of our website at CNO. The presentation is also available in the Investor Section Form 8 yesterday. Let me remind you that any forward-looking statements we make today are subject to a number of factors which may cause actual results to be materially different than those contemplated by the forward-looking state. Today's presentation contains a number of non-GAAP measures which should not be considered as substitutes for the most directly comparable GAAP measures. You'll find a reconciliation of the non-GAAP measures to the corresponding GAAP. This presentation will be making performance comparisons and, unless not otherwise specified, any comparisons made will refer to changes between full year 25 and full year 2024. With that, I'll turn the call over to Gary.
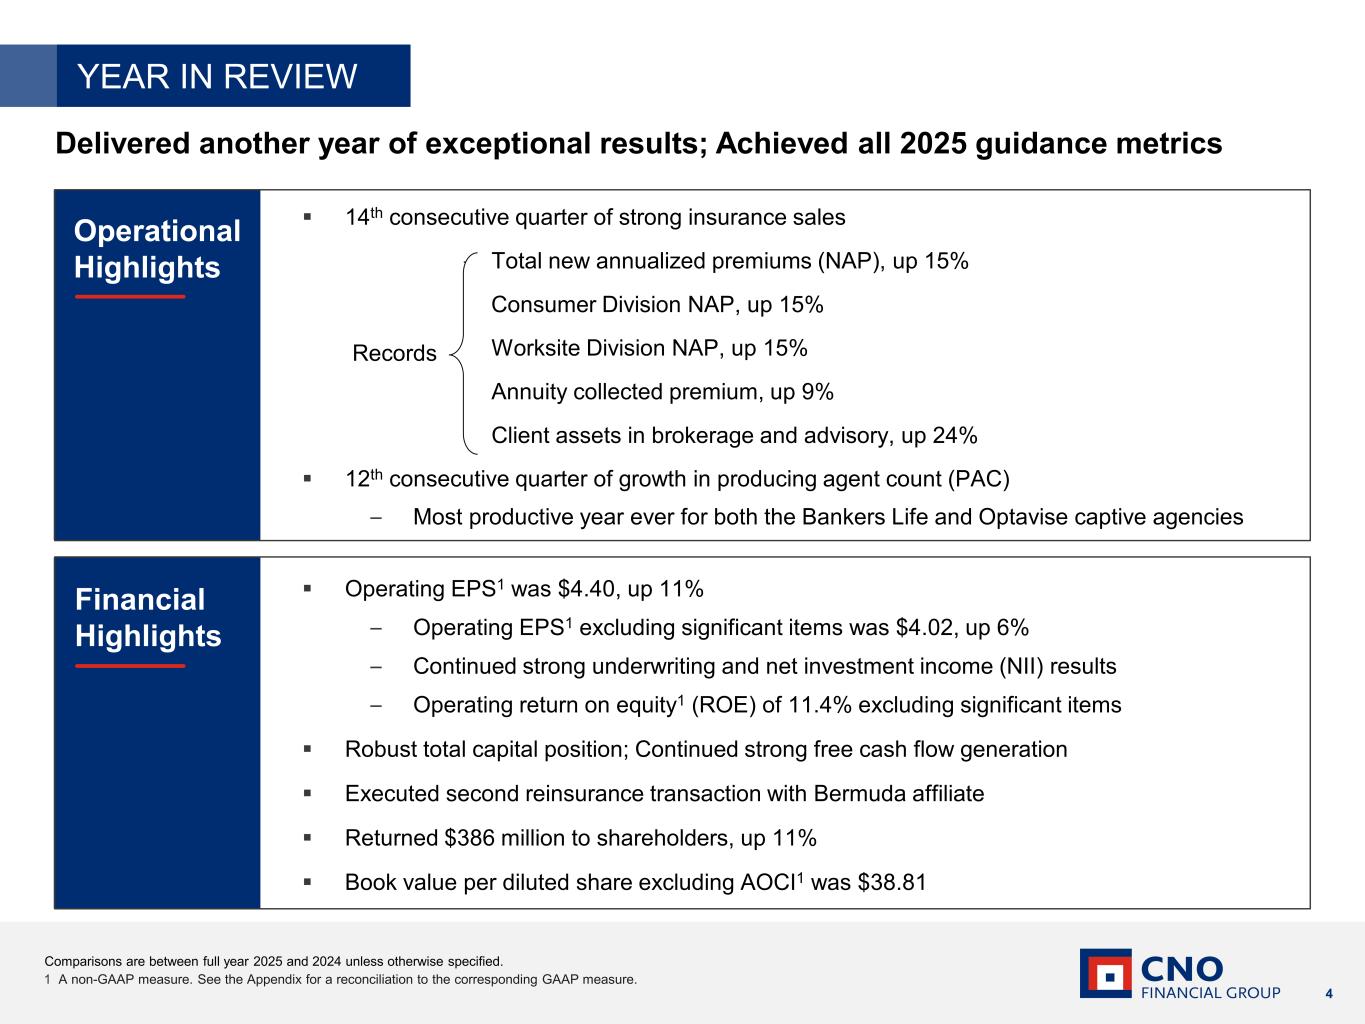
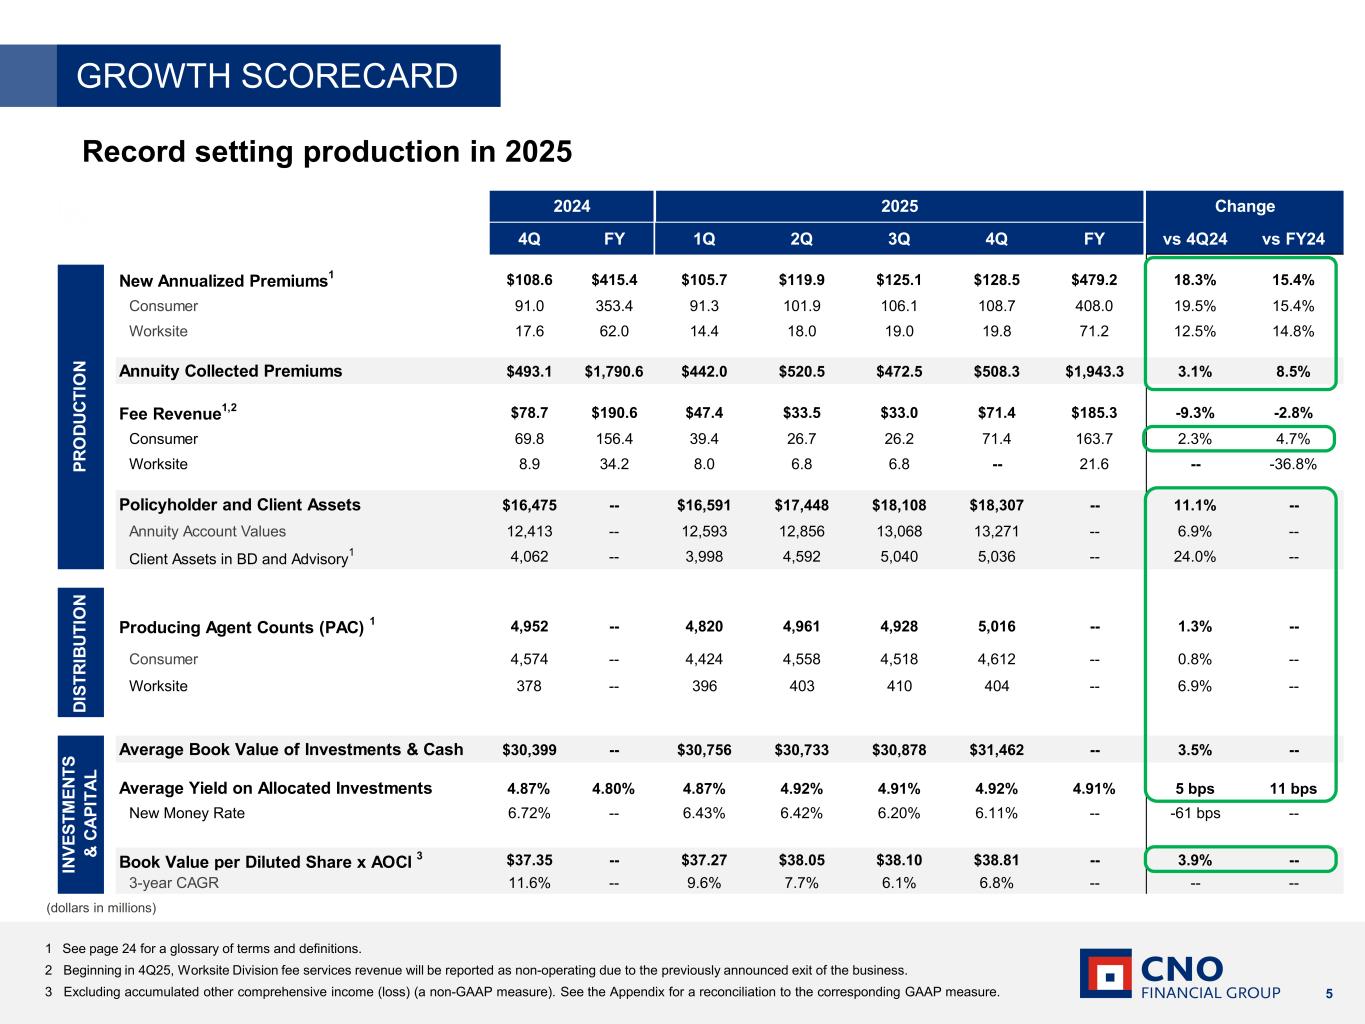
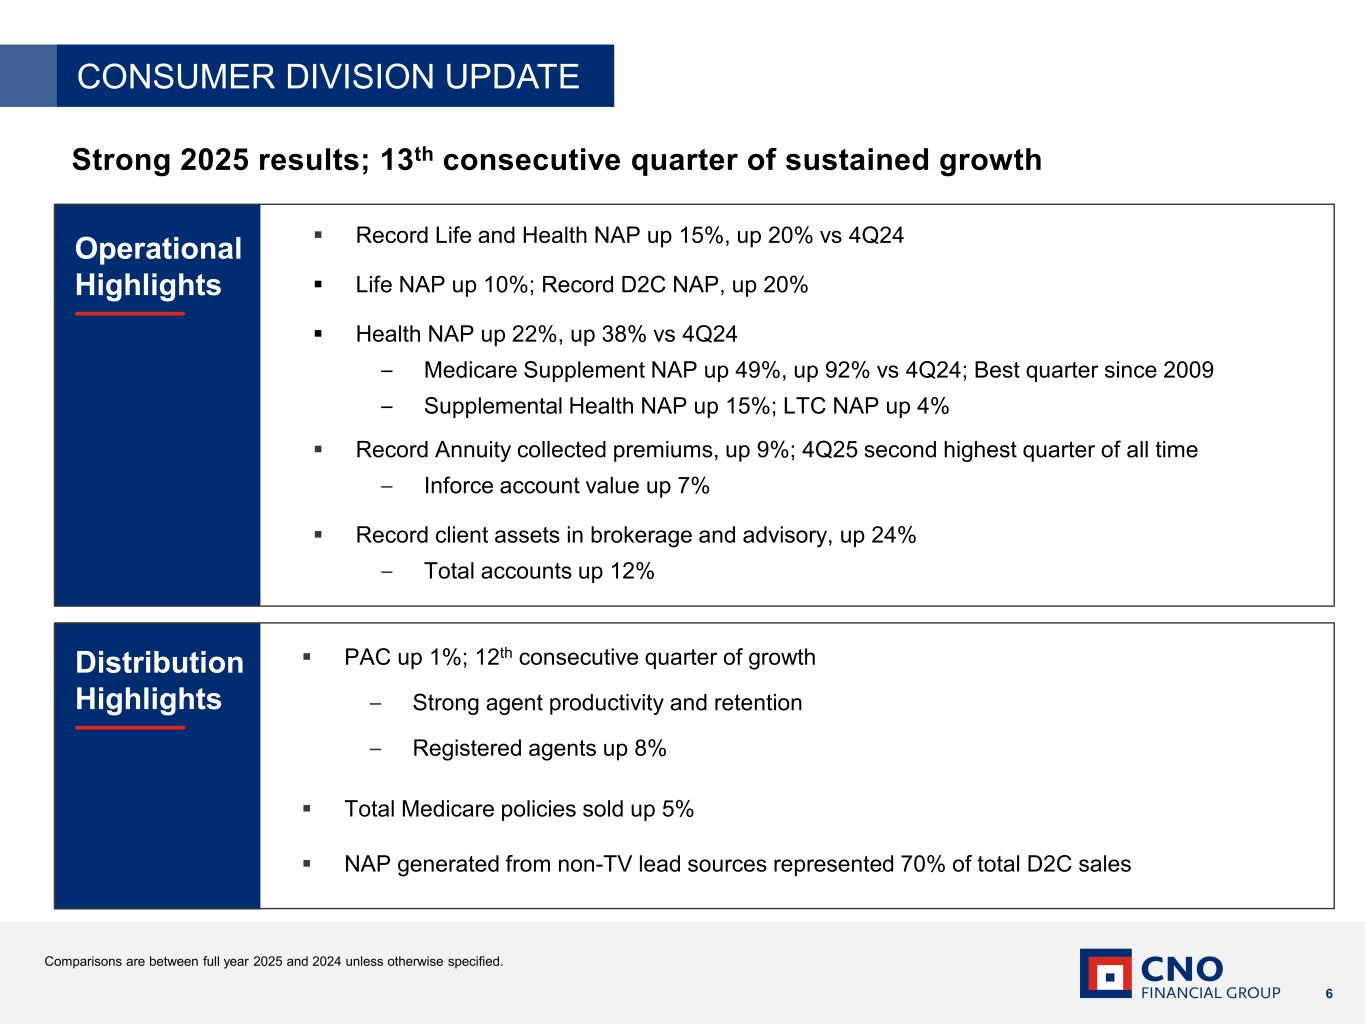
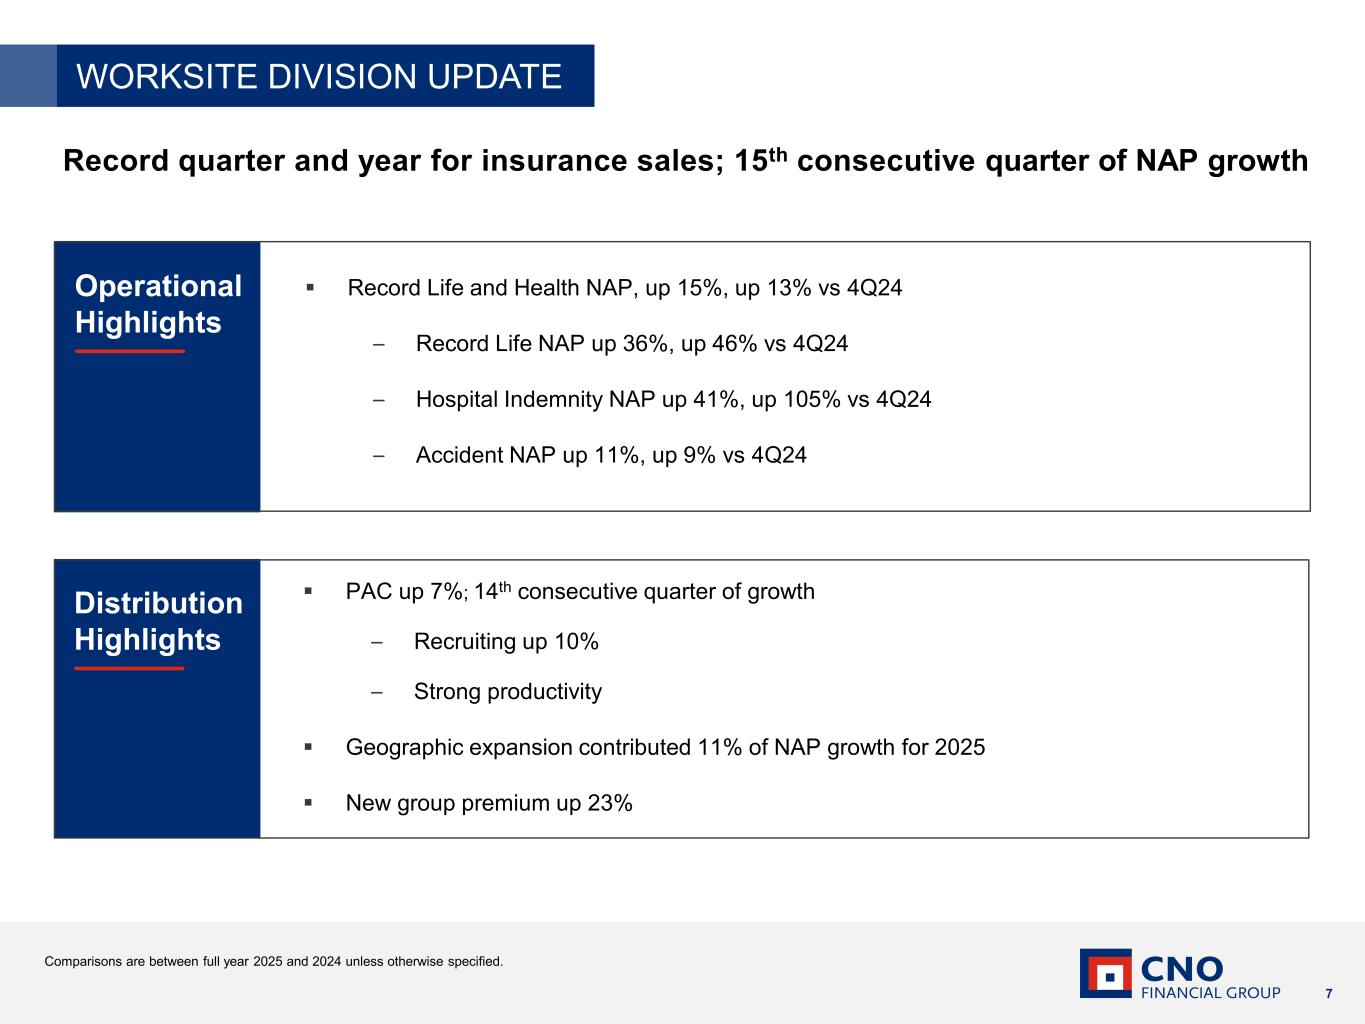
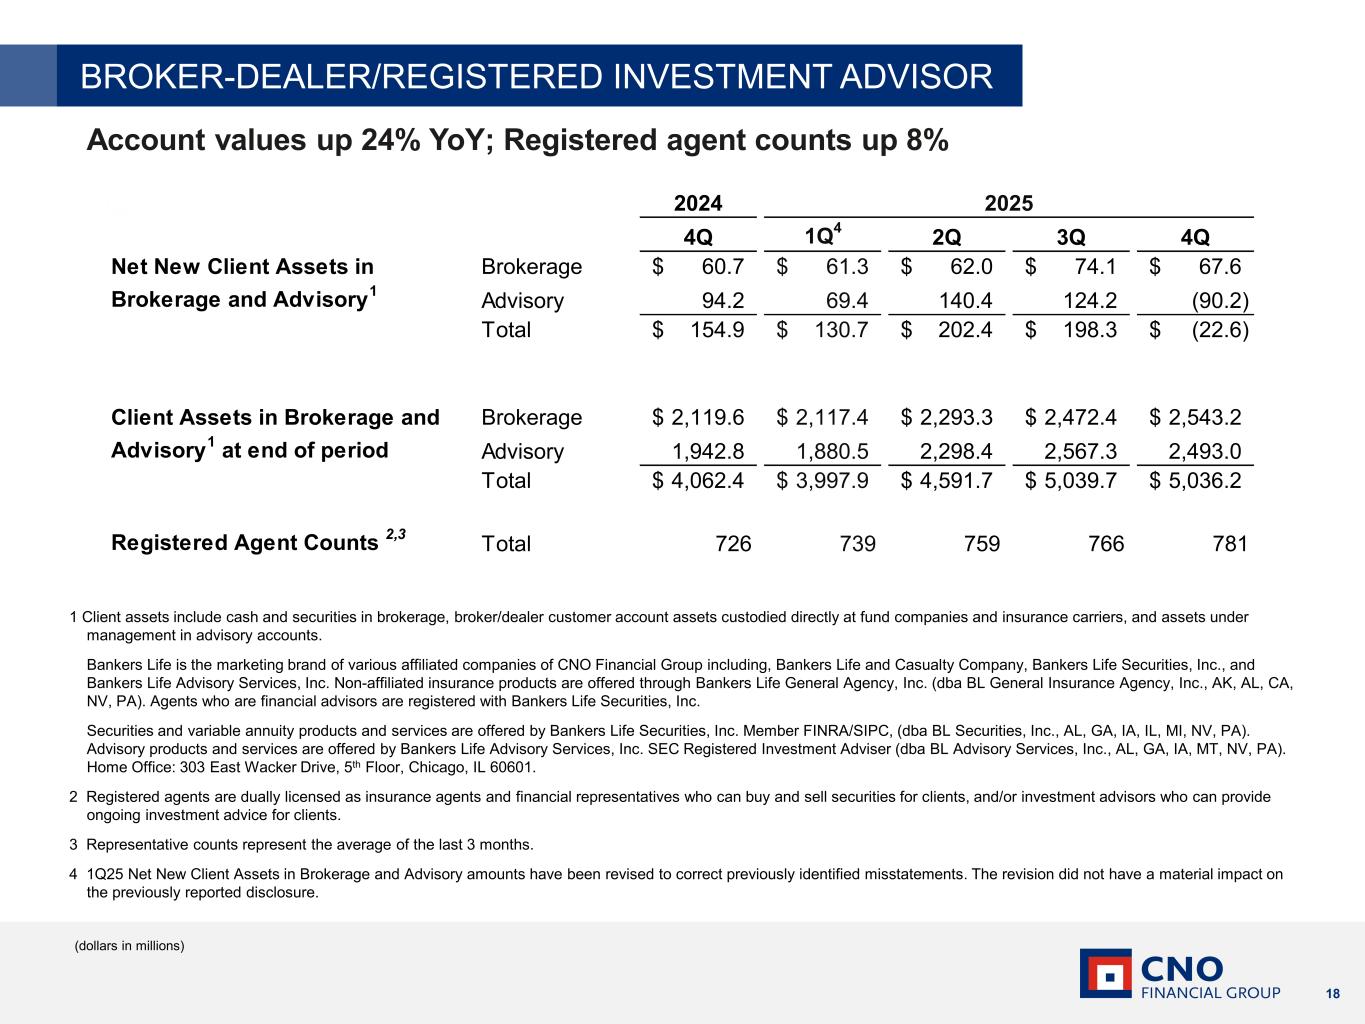
Thanks, Adam. Good morning, everyone, and thank you for joining us. C&O once again delivered an excellent quarter and full-year results. We are growing and investing in the franchise, growing operating earnings, and improving profitability all at the same time. Our performance remains consistent and repeatable, underpinned by strong execution and a focus on the underserved middle-income market. We achieved, and in most cases exceeded, all of our 2025 guidance, including improving our operating return on equity to 11.4%, excluding significant items. Building on our sustained momentum, 2025 represented one of our best operating performances to date. We delivered our 14th consecutive quarter of sales growth, our 12th consecutive quarter of growth in producing agent counts, and our most productive year ever for both our Banker's Life and Optivize captive agencies. For the full year, we delivered record total new annualized premium up 15%. We set production records across both divisions and in multiple product lines, a clear sign that our model is meeting the broad-based needs of our middle-income consumers. Our exclusive middle market focus and our last-mile captive agent distribution model create our durable competitive moat. This difficult to replicate model is a clear competitive advantage and a catalyst for profitable growth. I'll cover these results in more detail in each division's comments. Our consistent sales momentum is driving earnings growth. Operating earnings per diluted share was $4.40, an increase of 11%. Earnings continue to benefit from strong insurance product margin and investment results, reflecting growth in the business and expansion of the portfolio book yield. New money rates have exceeded 6% for 12 consecutive quarters while maintaining portfolio quality. Paul will go into greater detail on our financial performance. We ended the year with a robust total capital position after returning $386 million to shareholders, an 11% increase over 2024. And for the 13th year in a row, we raised our quarterly common stock dividend. Book value for diluted share excluding AOCI was $38.81, representing a 7% compound annual growth rate over the past three years. Additional highlights from 2025 include a second reinsurance transaction with our Bermuda affiliate, continued strong capital position and free cash flow generation, and an all-time high share price. Turning to slide five and our growth scorecard. 2025 was a record-setting year, and nearly all growth scorecard metrics were up for the quarter and for the full year. As a reminder, our growth scorecard focuses on the three key drivers of our performance, production, distribution, and investments in capital. I'll discuss each division in the next two slides. Paul will cover investments in capital during his remarks. Beginning with the Consumer Division on slide six, our Consumer Division delivered an exceptional year capped off by our 13th consecutive quarter of sales growth. 2025 also marked the third consecutive year of record production by the Bankers Life agent force. For the full year, we delivered record total NAP of 15%, double-digit growth in life, supplemental health, and Medicare supplements, and record growth in annuities and client assets in brokerage and advisory. LifeNAP was up 10% for the full year, led by record direct-to-consumer life sales, up 20%. Our targeted measured approach to the D2C channel benefited from technology-driven productivity enhancement and diversifying our direct marketing away from television to include more web, digital, and third-party channels. These non-television lead sources generated over 70% of all D2C life sales for the year. Total health NAP was up 22%, which marks 14 consecutive quarters of growth. Supplemental health was up 15%, and long-term care was up 4%. Our field force delivered another exceptional performance during the Medicare annual enrollment period. Medicare Supplement NAP was up 49% for the full year and up 92% for the quarter, our best MedSup quarter in 15 years. Medicare Advantage policies sold, which are not reflected in NAP, were down 3% for the year. Our results reflect a growing shift in consumer preferences from Medicare Advantage to Medicare Supplement, as many of the leading MA carriers pair back plans and benefits, reversing a decade-long trend. Medicare remains a flagship door-opening product for us to meet and serve more customers. Total Medicare policies sold were up 5% for the year. With approximately 11,000 Americans turning 65 each day, we expect overall demand for Medicare products to grow and to help us expand the total number of households we serve. Record annuity collected premiums were up 9% for the full year and up 3% for the quarter, our 10th consecutive quarter of growth. Collected premiums in the quarter totaled $508 million, and in-force account values were up 7%, exceeding $13 billion. Our captive distribution and the long-term relationships that our agents established with their clients add stability to our annuity block. We delivered our 11th consecutive quarter of brokerage and advisory growth. Client assets in the channel were up 24% over the prior year, totaling more than $5 billion. For the full year, total accounts were up 12%. When combined with our annuity account values, our clients now entrust us with more than $18 billion of their assets, up 11% from 2024. Improving agent productivity fueled our sustained sales momentum in 2025. Producing agent count grew for the 12th consecutive quarter and registered agent count was up 8%. The consumer division delivered another outstanding year. We expect that same focus and momentum to carry into 2026. Next, slide seven in our worksite division performance. Worksite insurance sales have never been stronger, with 2025 representing the best production year ever for our worksite business. We finished the year with record full-year insurance sales, up 15%, and record fourth-quarter insurance sales, up 13%. This represents our second consecutive year of record production and 15th consecutive quarter of NAP growth. Full year highlights included record life insurance sales, up 36 percent, hospital indemnity insurance, up 41 percent, and accident insurance, up 11 percent. Strategic growth initiatives contributed significantly to our worksite NAP performance in 2025. Our geographic expansion initiative delivered 11% of the NAP growth for the year. And NAP from new group clients was up 23%. Producing agent count was up 7%, driven by recruiting, up 10%. This marks our 14th consecutive quarter of growth in the agent force. Our previously announced exit of the fee services business within WorkSite is progressing on schedule and should be largely complete in the first half of 2026. We are already seeing the benefits of streamlining our focus on core insurance business. As we enter 2026, we remain confident in our ability to execute and continue to grow the And with that, I'll turn it over to Paul.
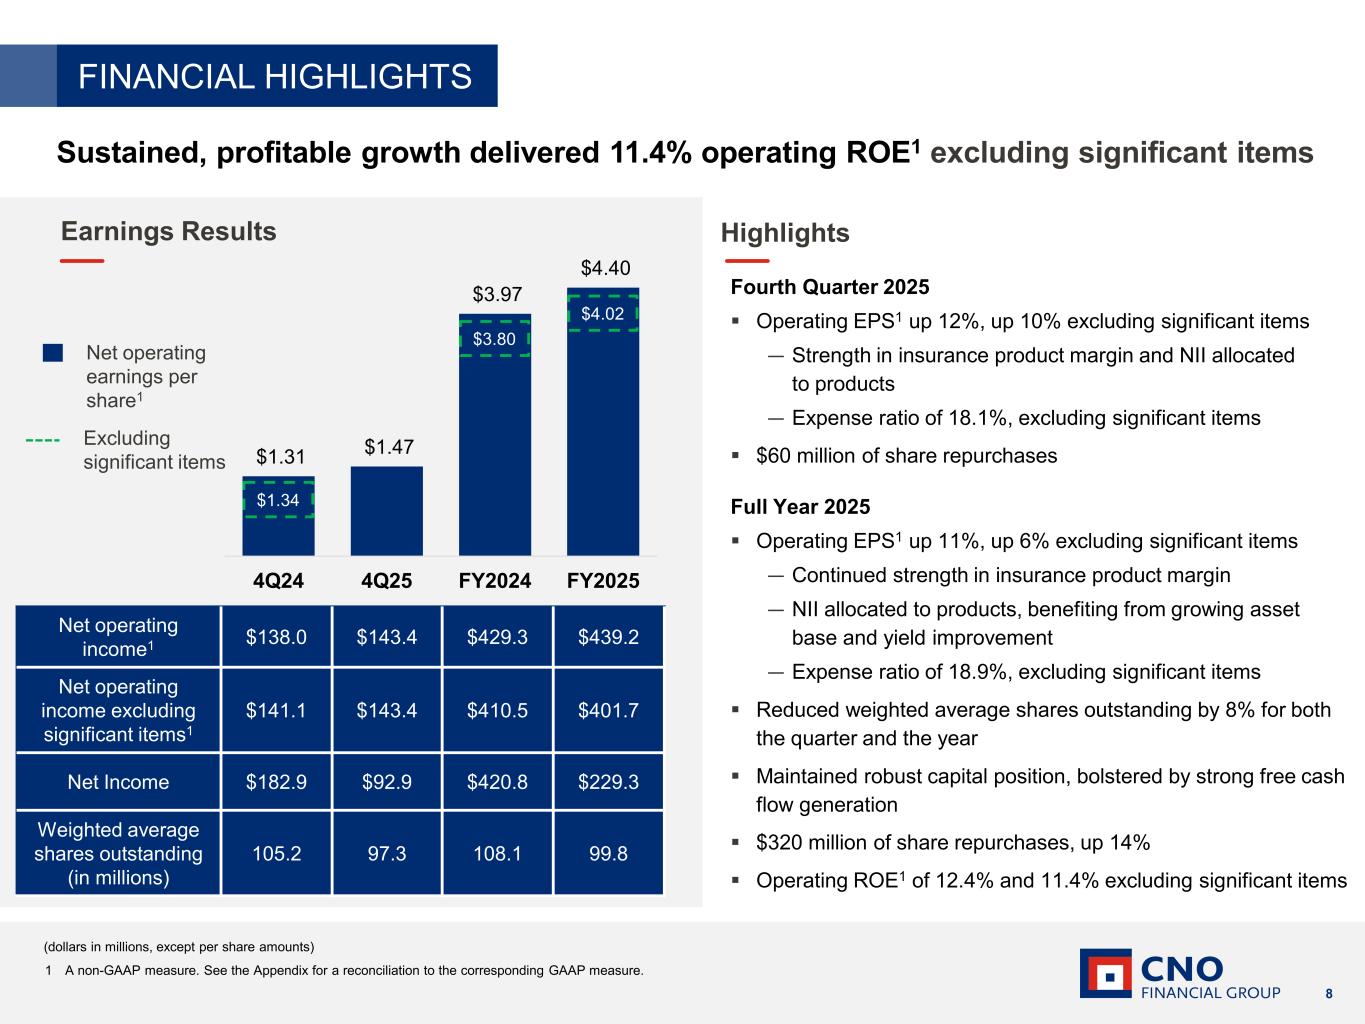
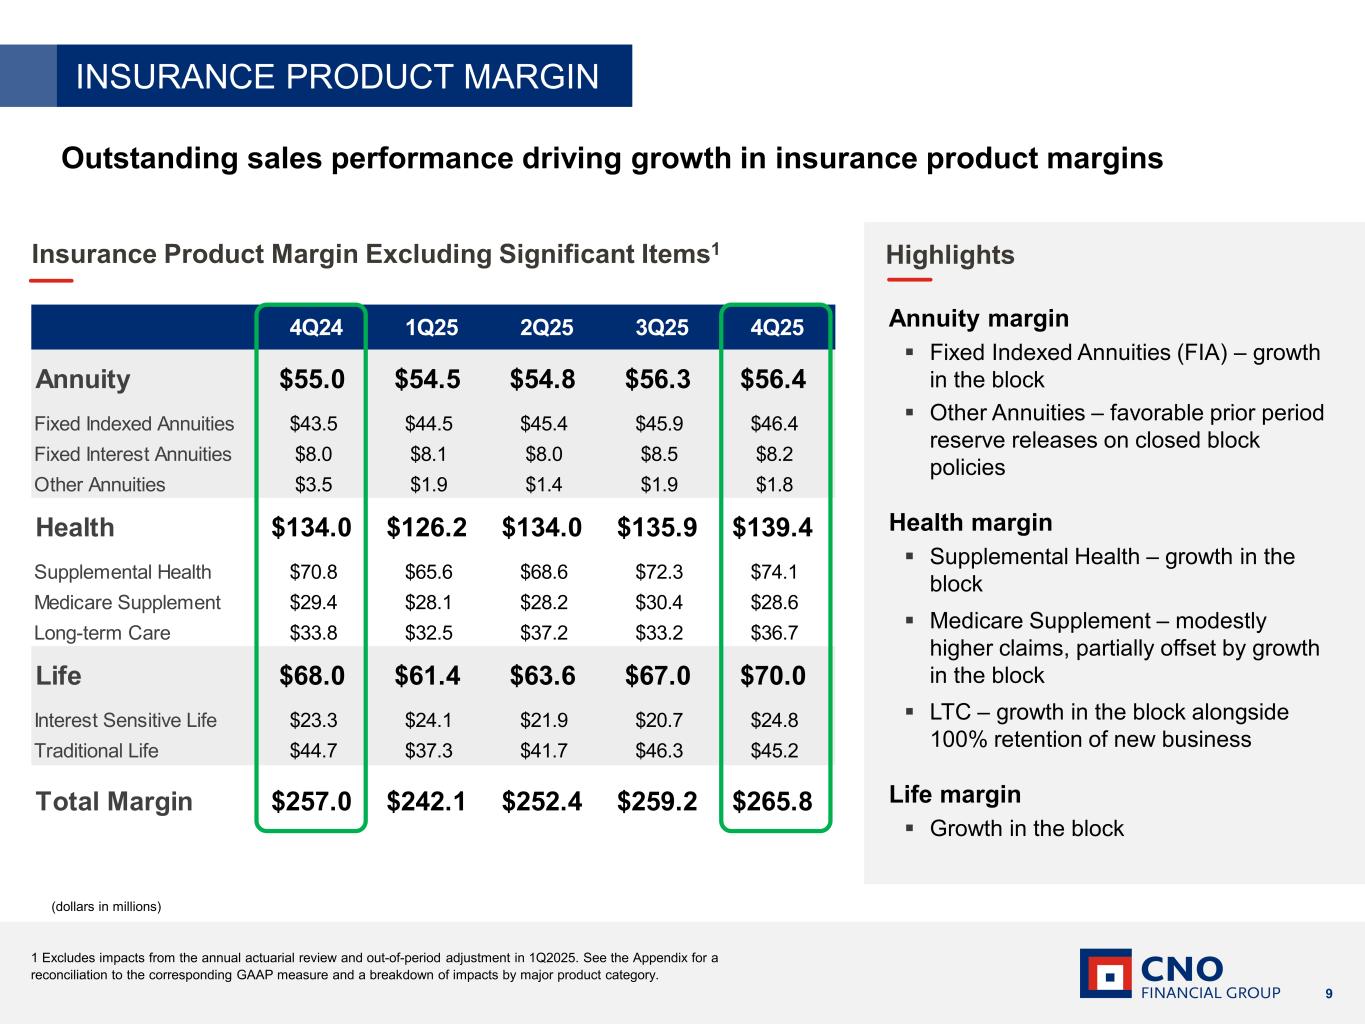
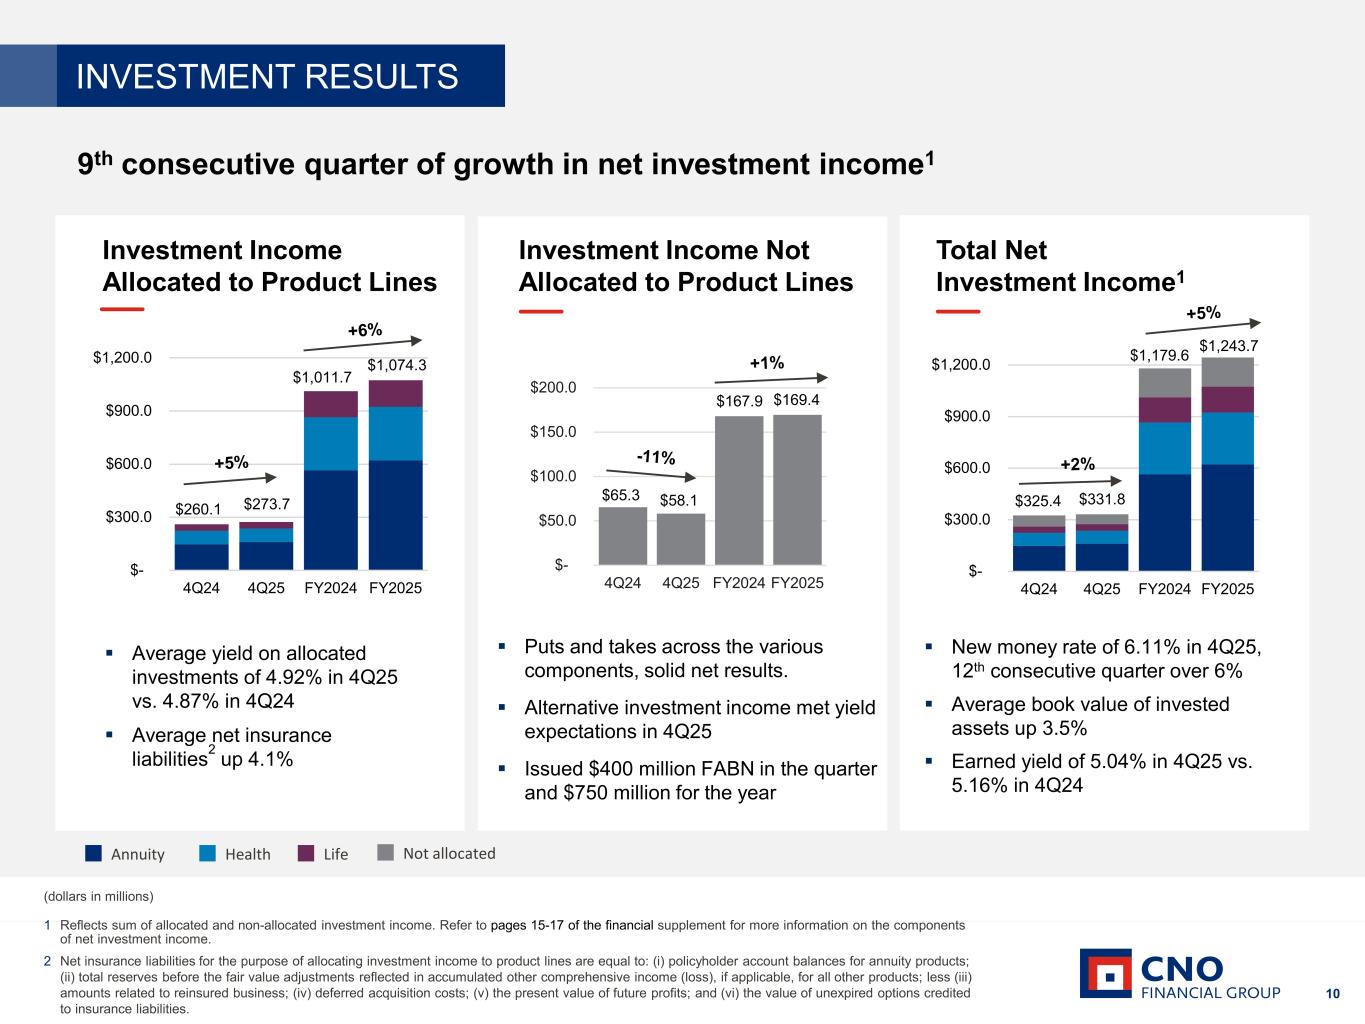
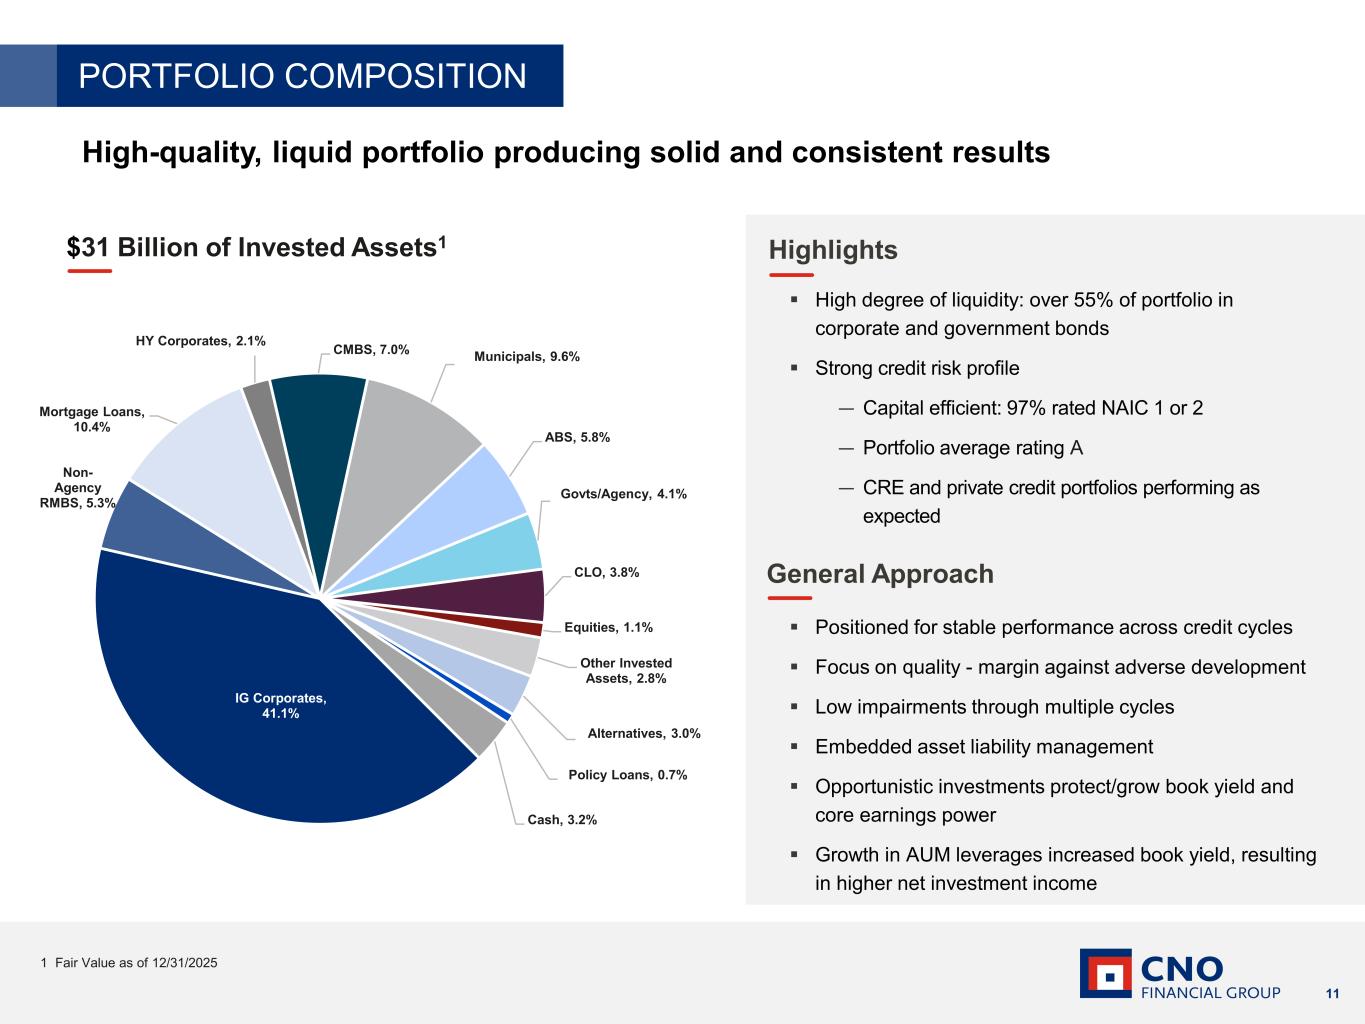
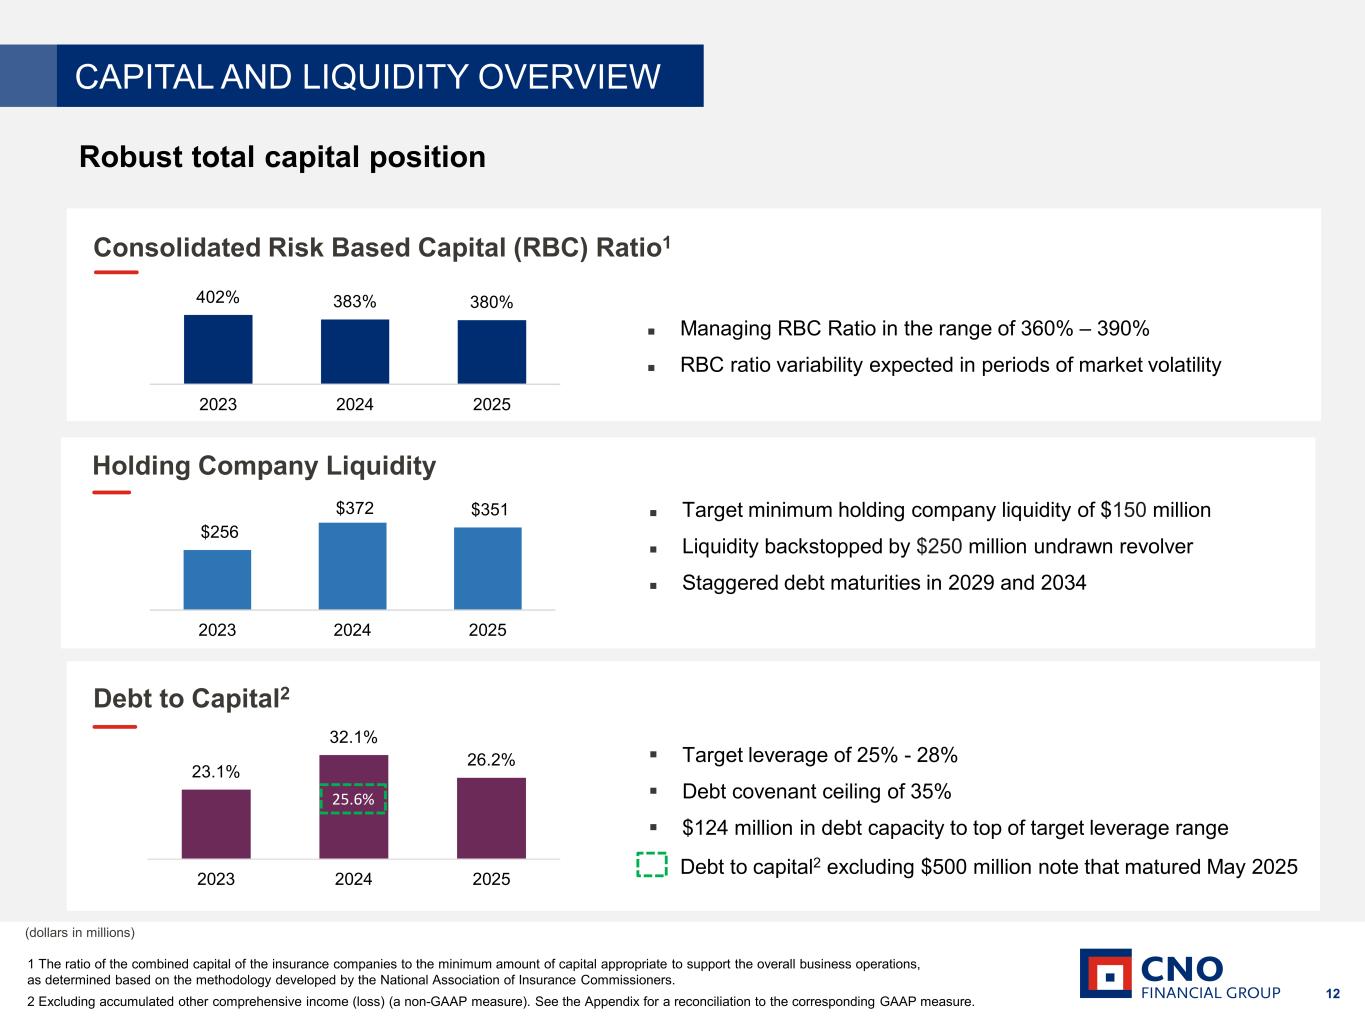
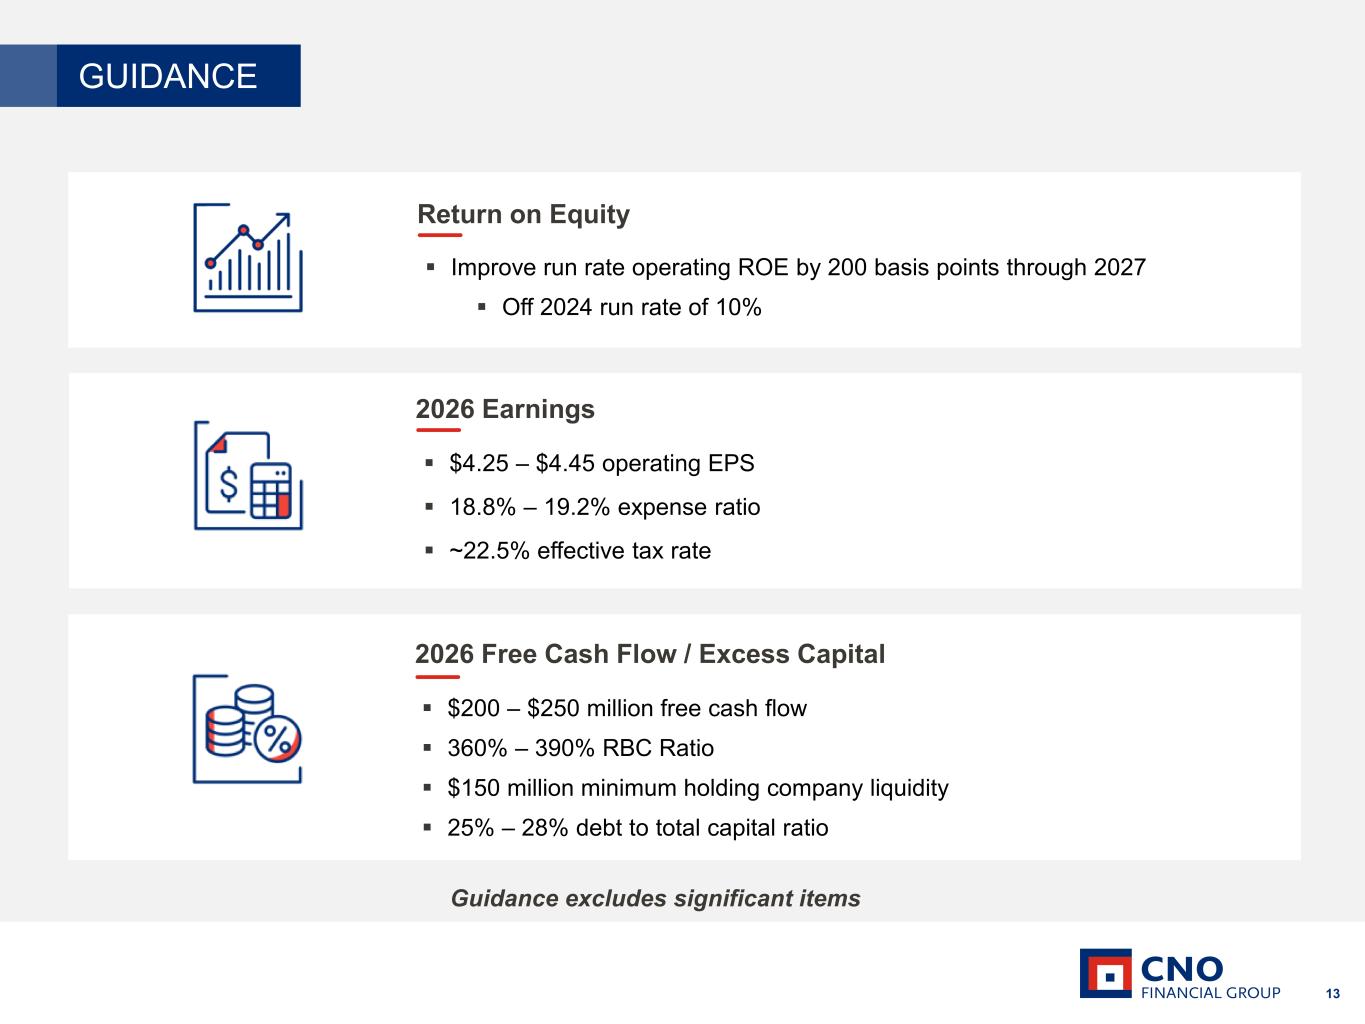
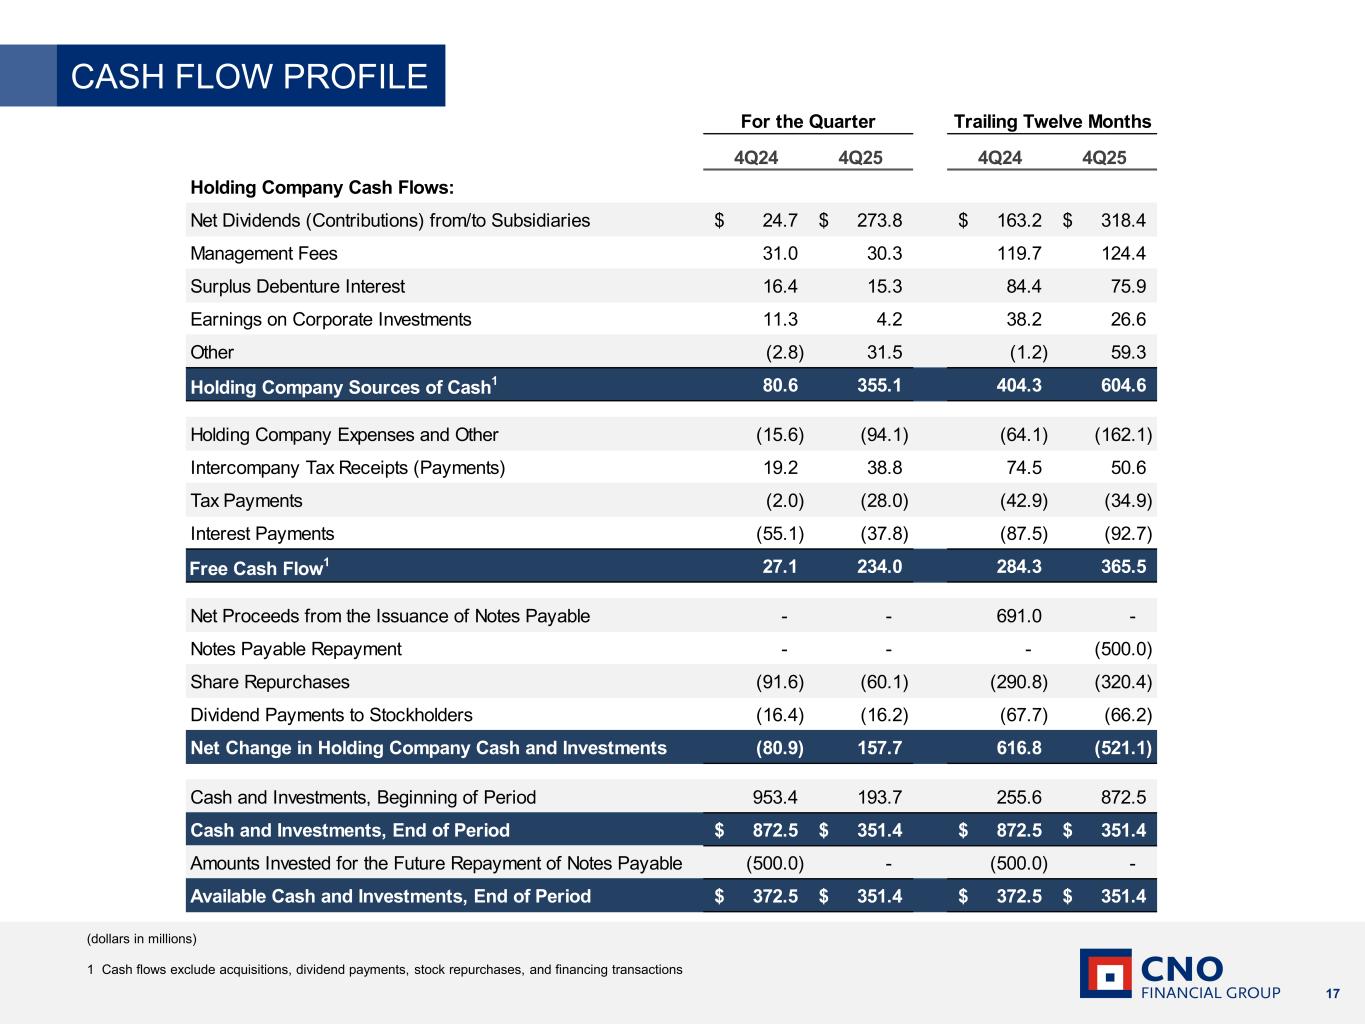
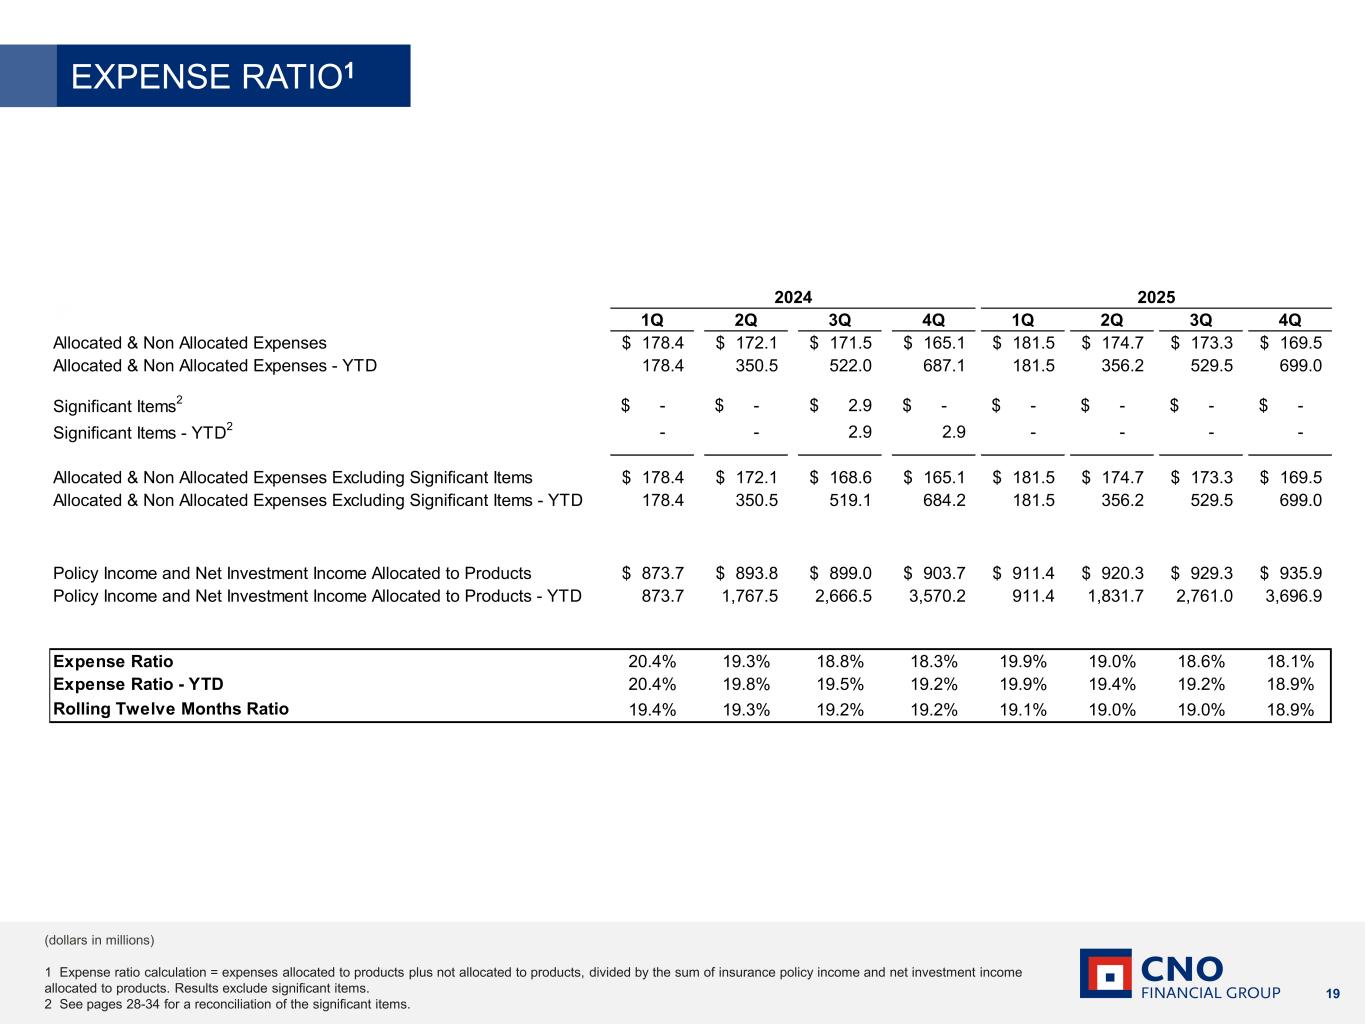
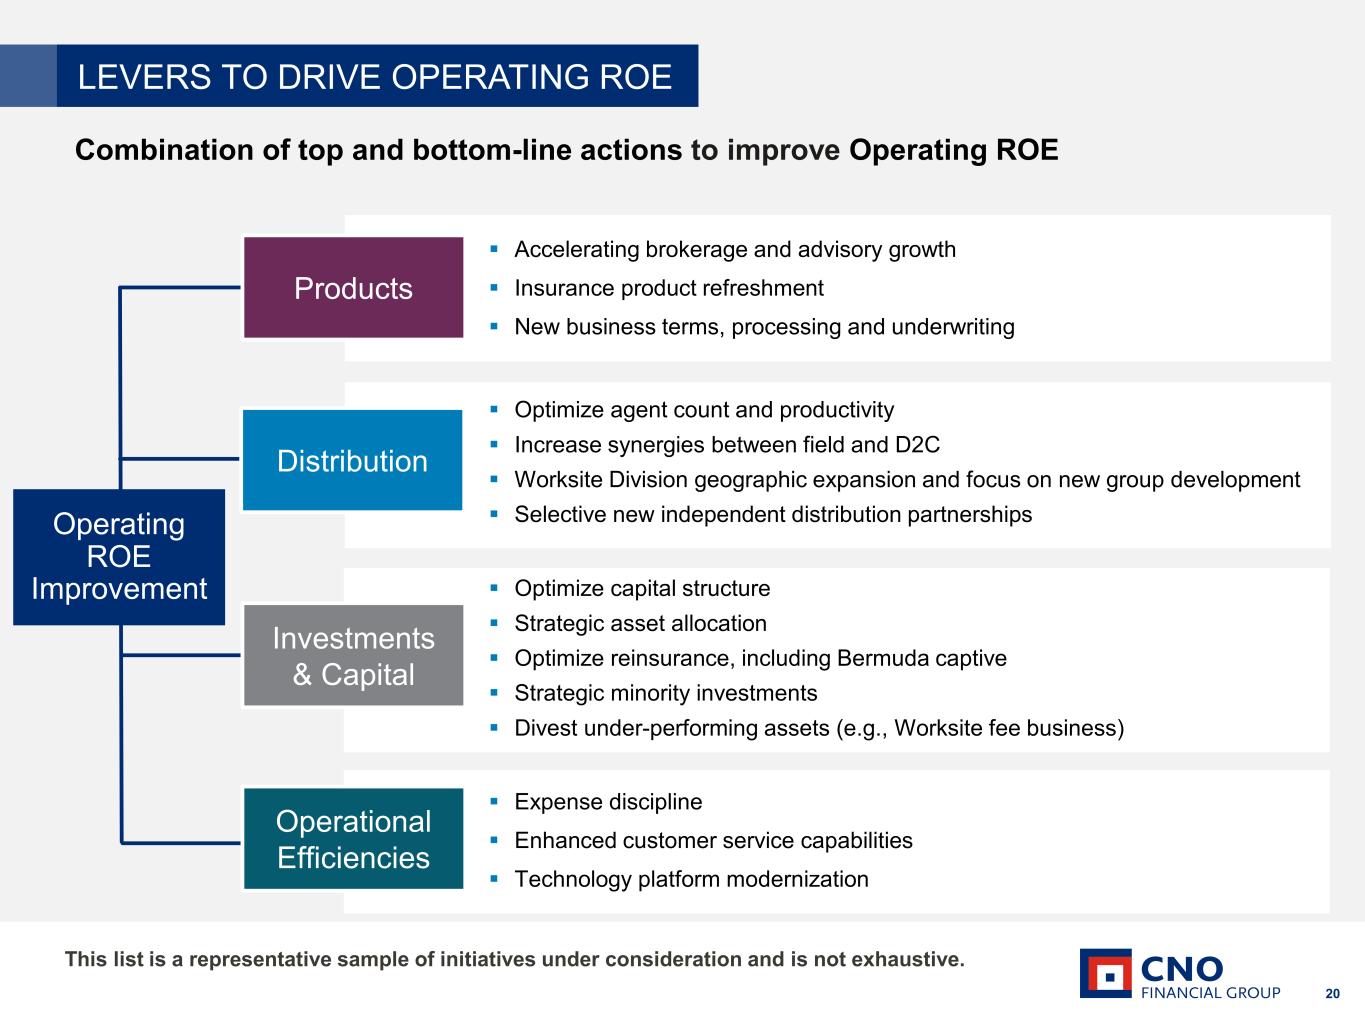
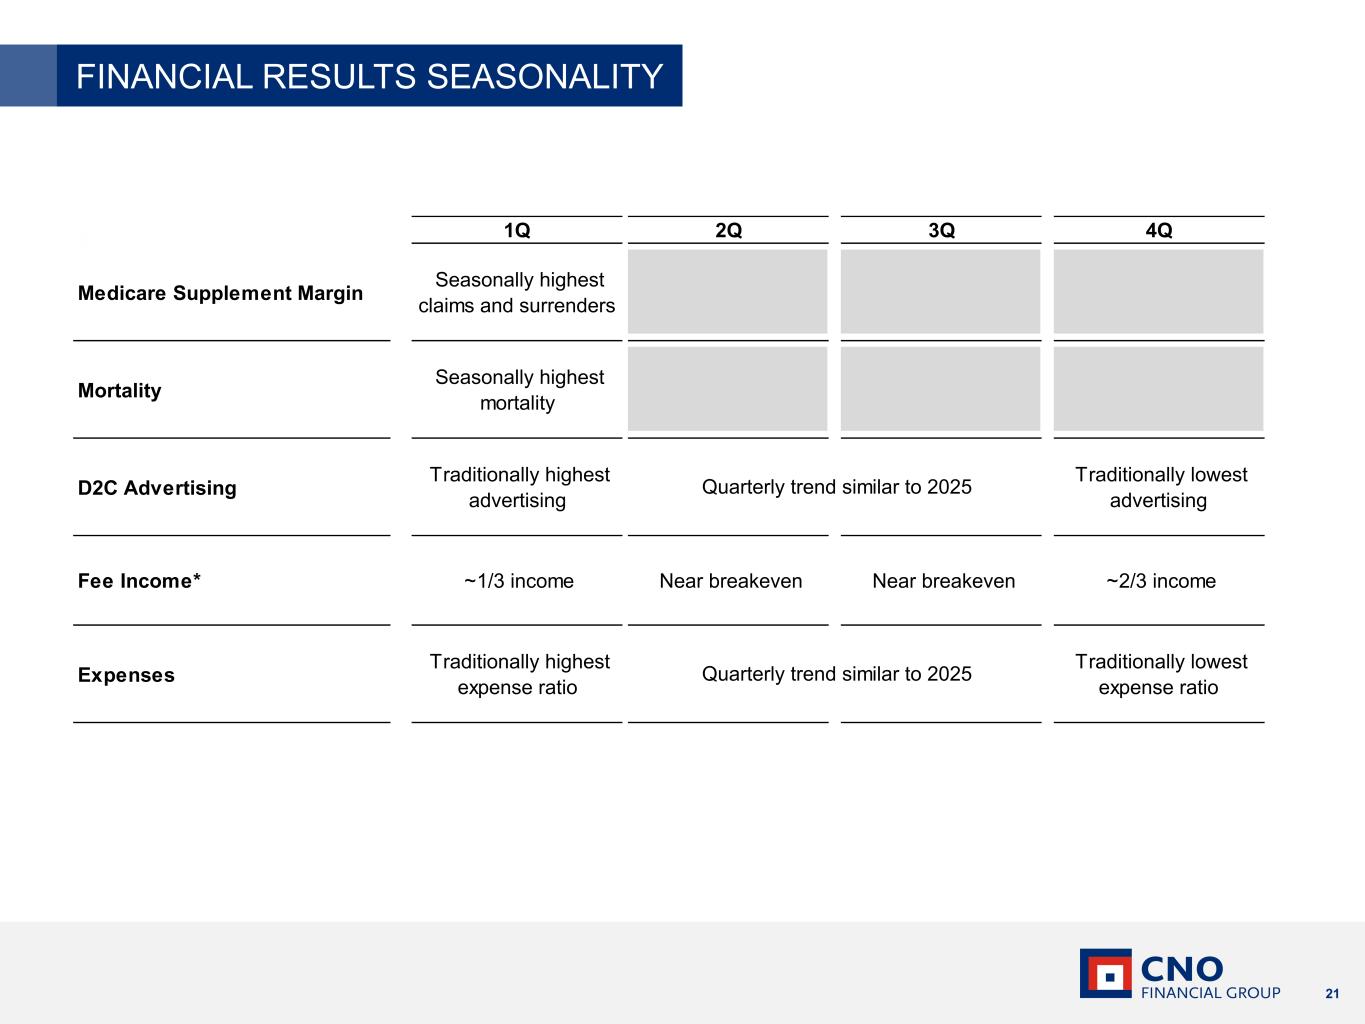
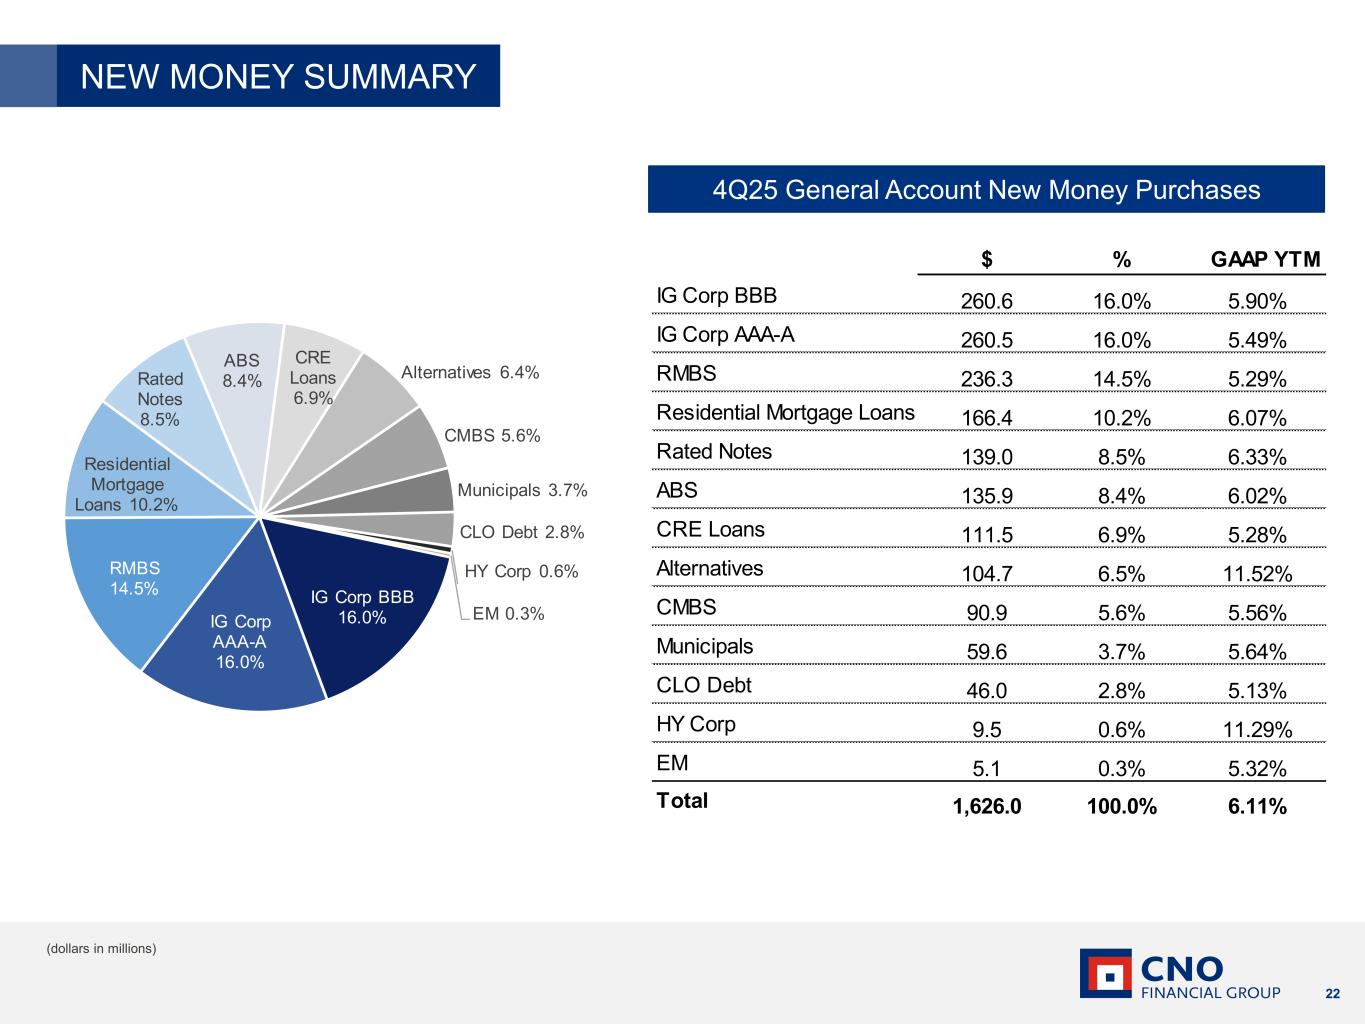
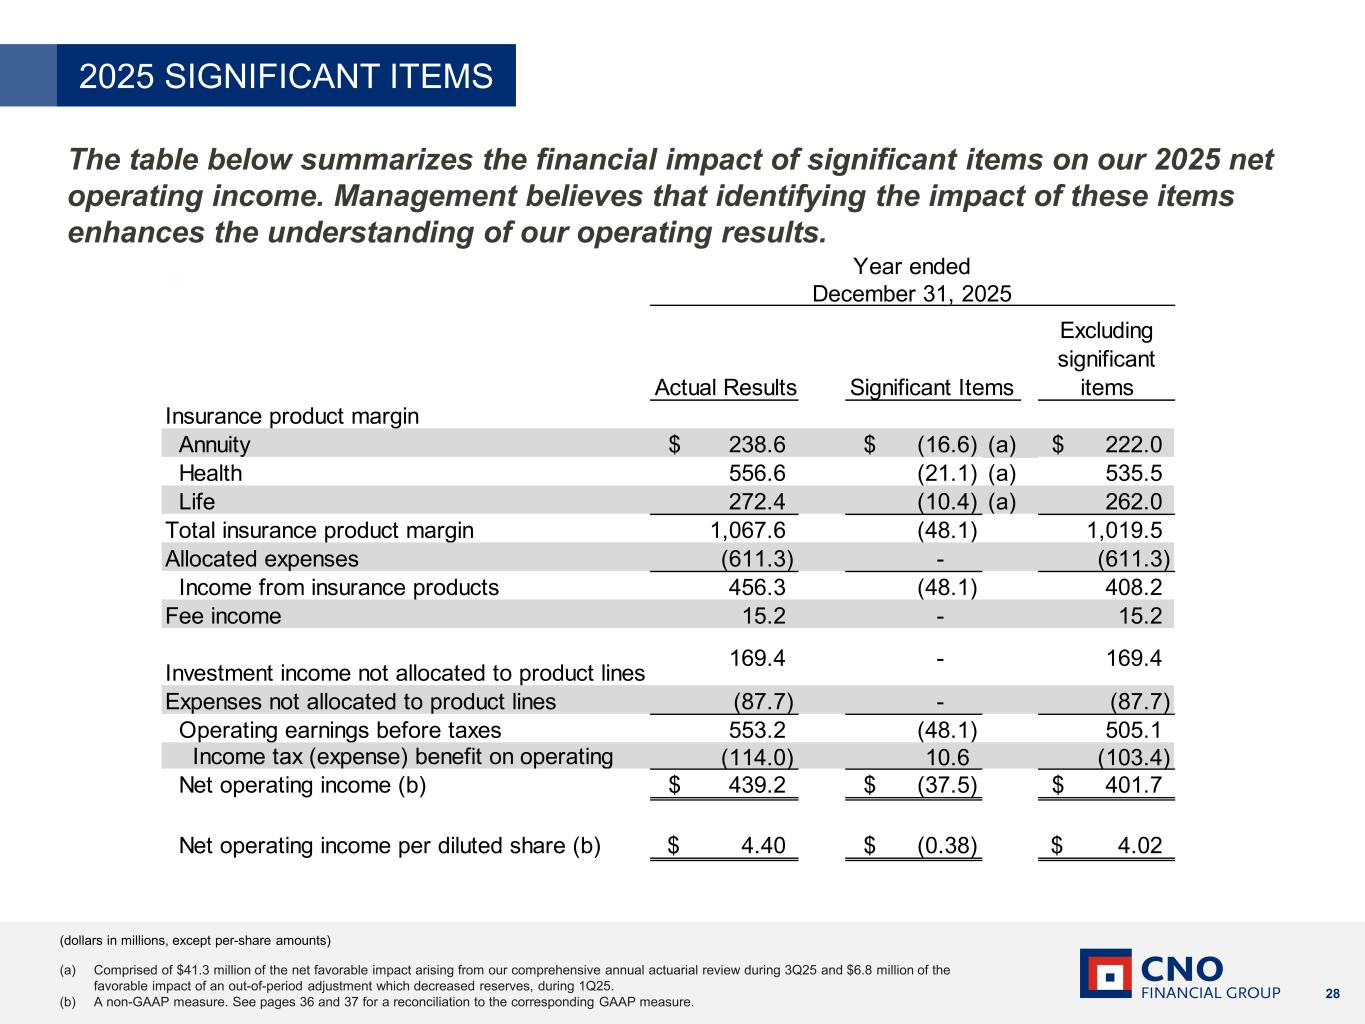
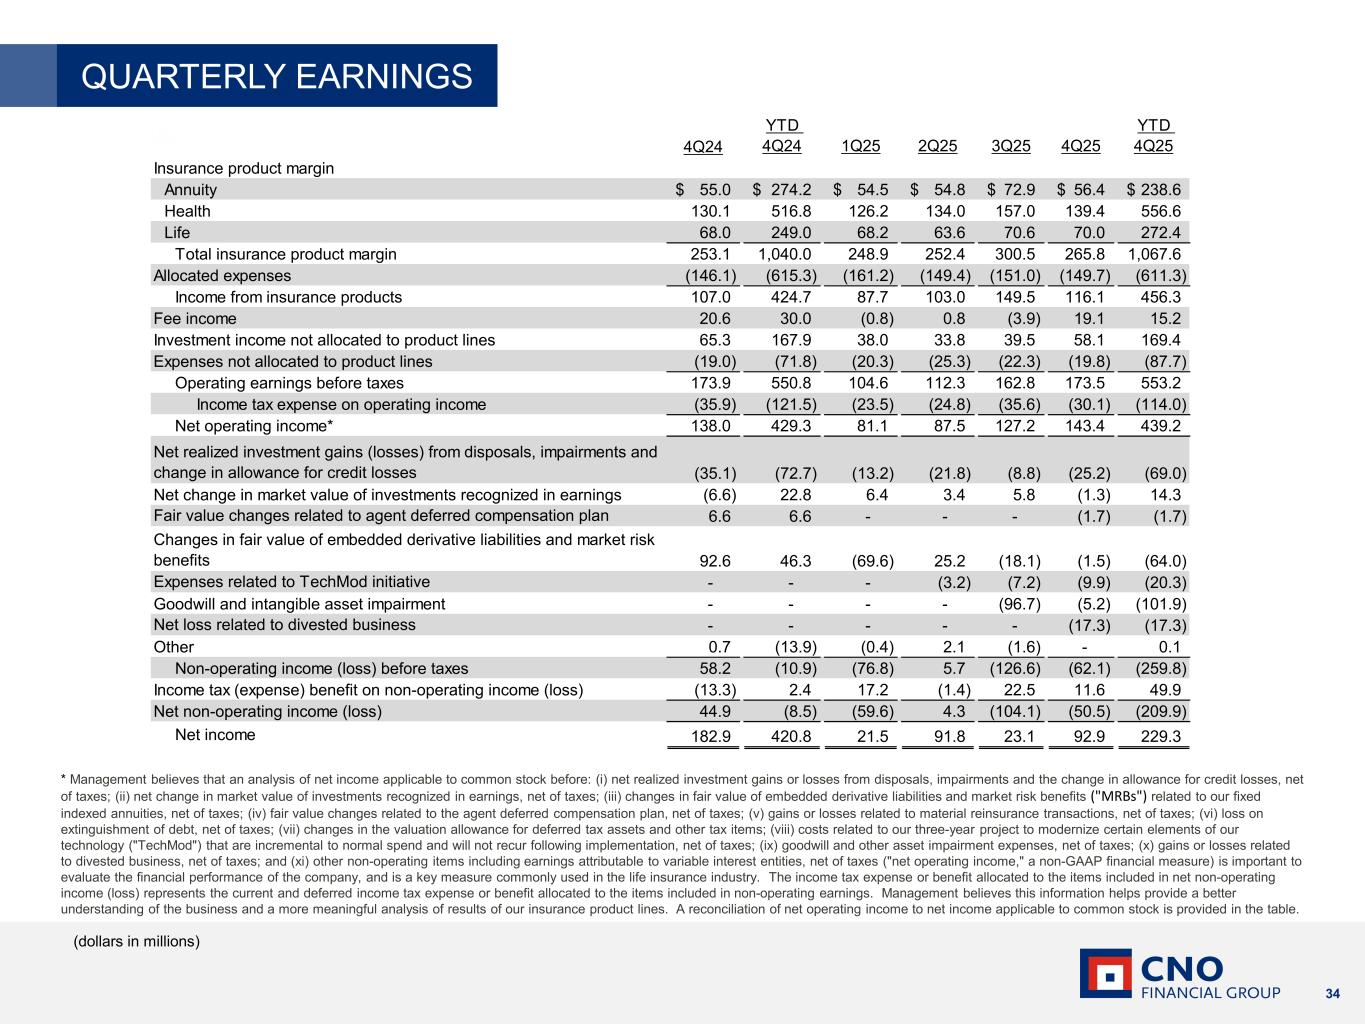
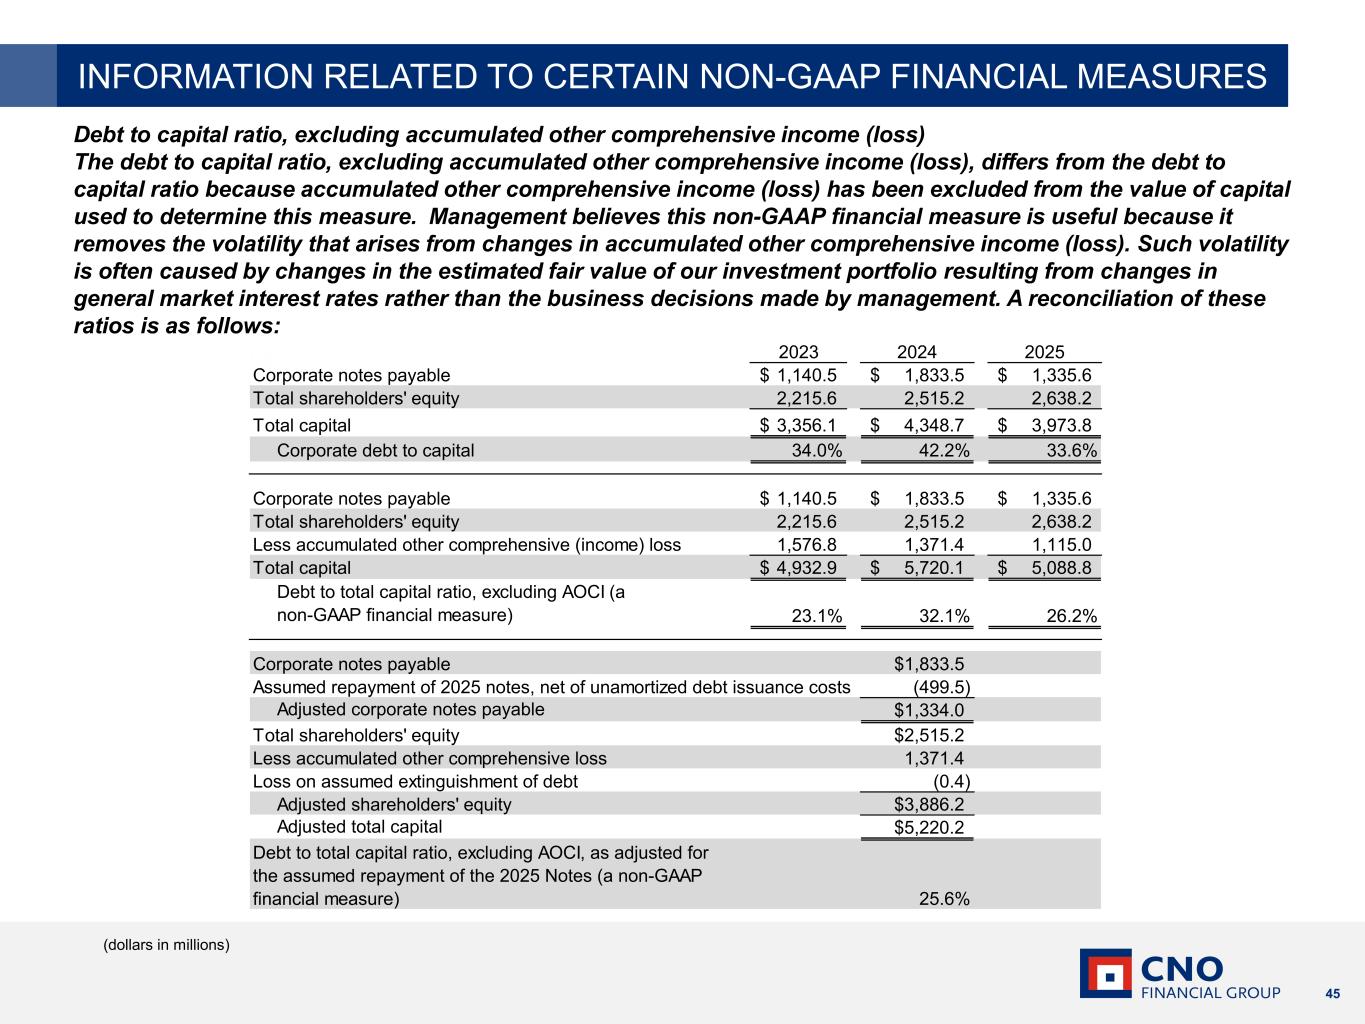
Thank you, Gary, and good afternoon or good morning, rather. Good morning, everyone. Turning to the financial highlights on slide eight, our results for the quarter and the year demonstrate our ability to deliver sustained, profitable growth. Operating return on equity excluding significant items was 11.4%, reflecting significant improvement from the 10% run rate return on equity in 2024, and good progress toward our 12% target ROE in 2027. Operating earnings per share ex-significant items grew 10% in the quarter and 6% for the year, reflecting continued strength in both insurance product margin and net investment income. Notably, at $4.02, our full-year operating earnings per share, excluding significant items, exceeded the high end of our original guidance. Similarly, our full-year expense ratio of 18.9 percent, excluding significant items, was better than the low end of our original guidance, reflecting improved operating leverage as we grow the business. The effective tax rate on operating income was 20.6% for the year, coming in below our 22 to 22.5% guidance. This reflects the impact of tax strategies implemented in the fourth quarter related to certain tax credits, reduced impact of state taxes, and an increase in tax-exempt We deployed $320 million of excess capital on share repurchases in the year, up 14%, including $60 million in the fourth quarter. This contributed to an 8% reduction in weighted average diluted shares outstanding and reflects the strong free cash flow generation of the business. Overall, a quarter and full year reflect a continuation of the operational momentum we have carried throughout the year. Turning to slide nine, total insurance product margin, excluding significant items, increased again this quarter, supported by outstanding sales performance over the last few years across both divisions and for most products. This growth coupled with stable underlying claims trends continues to drive higher margins across the three product categories. 2025 again demonstrates the value of our diversified product portfolio, where ordinarily puts and takes across product lines consistently net to stable and growing total margin over time. Turning to slide 10, net investment income remains solid, marking the ninth consecutive quarter of growth in total net investment income. Allocated net investment income increased with both growth in average net insurance liabilities up 4.1% and continued improvement in the average yield on allocated investments. For the year, NII allocated to products was up 6%. Net investment income not allocated to products reflects puts and takes across its various components. The net result in the quarter was strong, supported by alternative investment income, which met yield expectations, and a $12 million special dividend from a strategic investment. Total NII reflects disciplined portfolio management, steady asset growth, and durable yield performance, all of which continue to support strong earnings fundamentals. We issued $400 million of FABN in the quarter and $750 million for the full year. This program continues to deliver quality risk-adjusted returns, and we remain very pleased with its performance and expect to continue issuing under the program going forward, subject to market conditions. Our new investments in the quarter comprised approximately $1.6 billion of assets, an average rating of single A and an average duration of six years. Our new investments are summarized in more detail on slide 22 of the presentation. The new money rate was 6.11%, the 12th consecutive quarter above 6%. Turning to slide 11, our investment portfolio remains high quality and liquid. As of year-end, we held a record $31 billion of invested assets with 97% rated investment grade and an average rating of single A. The portfolio's strong performance reflects our consistent up-in-quality positioning and remains diversified and well-balanced. commercial real estate and private credit portfolios continue to perform as expected, supported by conservative underwriting and proactive risk management. Turning to slide 12, we ended the year with a robust total capital position. Our consolidated risk-based capital ratio is 380%. You may notice that we're referencing a target RBC range of 360 to 390, with the midpoint consistent with the previously stated 375%. Managing within this range allows for normal quarter-to-quarter variability in the RBC metric. The range is also consistent with how we describe to rating agencies and to regulators our risk appetite and our approach to risk management. Holding company liquidity ended the year at $351 million, well above our minimum threshold of $150 million, supported by continued strong free cash flow generation and reflecting our second reinsurance transaction with our Bermuda affiliate announced back in November. Debt to total capital remains within our target range of 25 to 28%. Overall, our capital position remains strong, providing flexibility to support growth, maintain financial resiliency, and continue deploying capital in a disciplined and sustainable Turning to slide 13 and our initial 2026 guidance. We continue to target an improvement in run rate operating return on equity of 200 basis points through 2027, off a run rate 2024 ROE of approximately 10%. Importantly, our 2026 guidance is aligned with F trajectory, as we remain focused on delivering improved profitability while maintaining our strong growth momentum and resilient capital position. We expect operating earnings per share between $4.25 and $4.45, which represents an 8% increase at the midpoint from our 2025 result and reflects continued earnings growth across the business. This outlook assumes a stable macro environment and investment returns consistent with our long-term expectations. Our expense ratio is expected to be in the range of 18.8 to 19.2%. At the midpoint, this reflects stable operating leverage as we continue to grow the business, partially offset by ongoing investments to support growth. As in prior years, we would expect some seasonality within the year, with the expense ratio starting higher in the first quarter and trending lower as the year progresses. We expect fee income of approximately $30 million for the year, with roughly a third in the first quarter, minimal contribution in the second and third quarters, and the balance in the fourth quarter. The effective tax rate is expected to be approximately 22.5%. We expect free cash flow of $200 to $250 million, which supports continued progress on capital deployment while maintaining a strong balance sheet and investing in the business to support growth and execution of our strategic initiatives. You'll recall that in 2025, we began a three-year initiative to invest in tech modernization with an expected investment over that period of approximately $170 million. This initiative is on track and on budget. In 2025, we deployed roughly $20 million on the initiative, and in 2026, we expect to deploy an additional $75 million. It's worth noting that our free cash flow guidance is net of this investment. As mentioned, we expect to operate with a risk-based capital ratio in the range of 360 to 390. Finally, we expect minimum hold co-liquidity of $150 million and a debt-to-total capital ratio of 25% to 28%. And with that, I'll turn it back to Gary. Thanks, Paul.
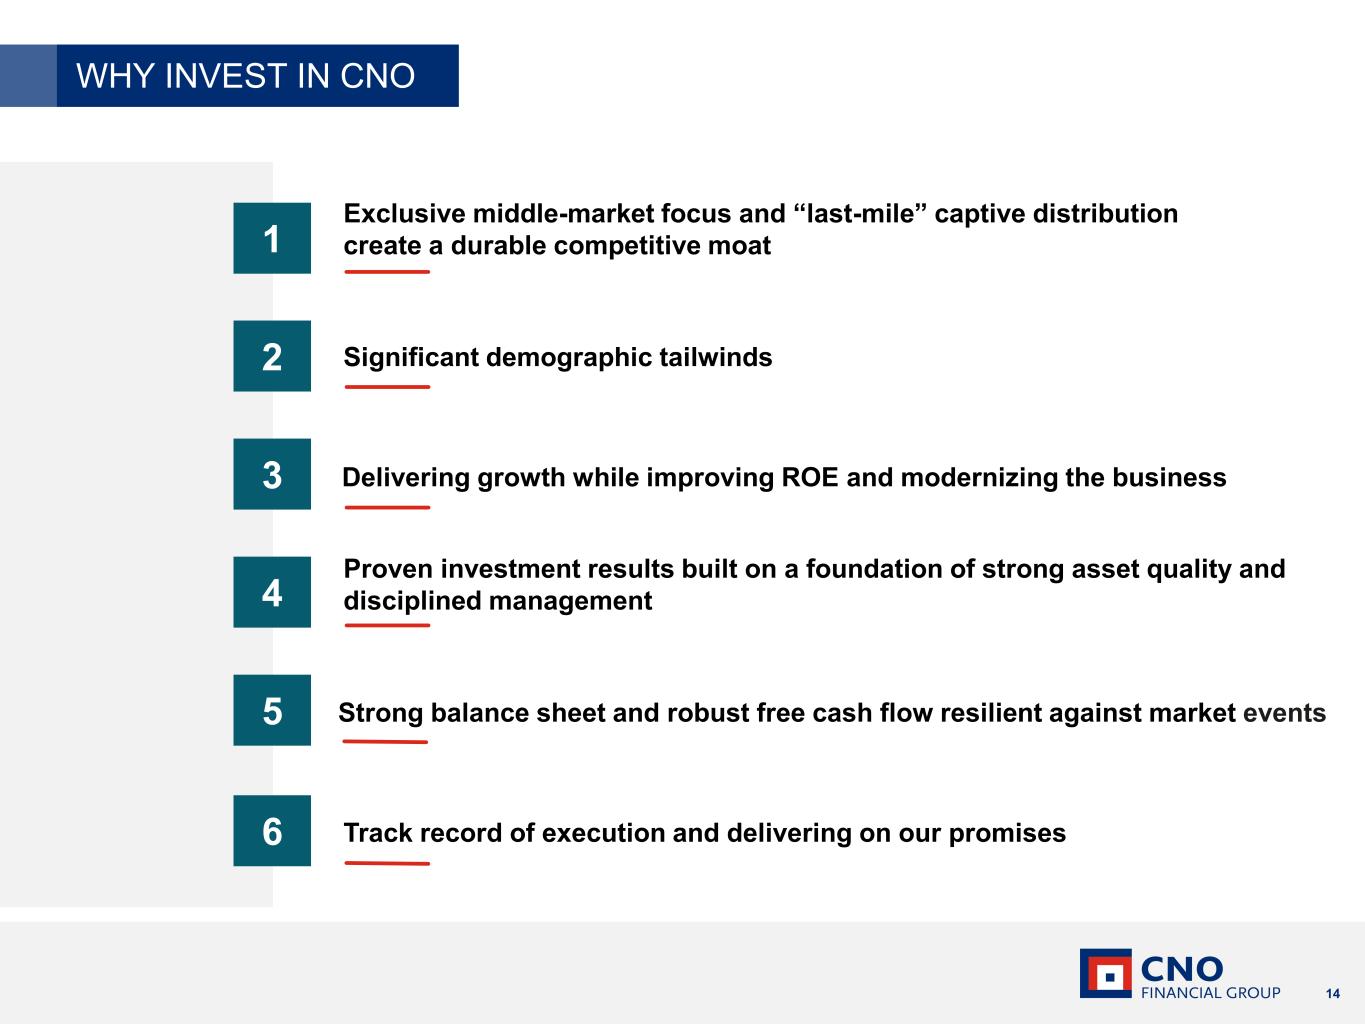
Turning to slide 14, C&O once again had exceptional full-year results. We achieved, and in most cases exceeded, all 2025 guidance metrics and delivered one of our best operating performances on record. Consistent, repeatable results continue to drive our momentum. We're growing and investing in the franchise while also growing earnings and improving profitability. We enter 2026 with a strong capital position and a path to achieving our 2027 ROE target. Thank you for your support of and interest in C&O Financial Group. We will now open it up for questions. Operator?
Operator
We will now begin the question and answer session. If you would like to ask a question, please press star 1 on your telephone keypad. To withdraw your question, press star 1 again. Please pick up your handset when asking a question. If you are muted locally, please remember to unmute your device. Please stand by while we compile the Q&A roster. Your first question comes from Sunit Kamath from Jefferies. Please go ahead.
Great, thanks. I wanted to start with earnings emergence, and maybe this one's for Paul. You know, as we think about the strong sales that you guys have generated over the past couple of years, I'm assuming there's some sort of lag between, you know, kind of when you write the business and when it sort of fully earns in. So I was just wondering if you could maybe give us a rule of thumb in terms of sort of how long does it take to kind of hit the target returns that you're pricing for.
Sure. Hi, Sunit. Appreciate the question. So, you know, it depends by product and the duration of the product. I guess what it emphasizes that we are hitting our target returns across our product portfolio. And the guidance that we've provided, you know, is capturing how earnings are emerging based on the sales trends over the last few years. And, you know, given our continued sales momentum and how that translates to earnings, that gives us confidence in our ability to meet the ROE target in 2027. And as Gary has emphasized on a number of occasions, that's not the end point, right? The expectation is that beyond 2027, we would continue to see ROE improvement.
Got it. And then I guess maybe for Gary, just wanted to get a sense of how you're thinking about the environment You know, we're seeing layoffs, we're seeing bad job numbers. You know, on the one hand, it creates an opportunity for you from a recruiting perspective. On the other hand, it could create challenges for your target market. So just hoping you could walk us through your thoughts on that. And then do you have an expectation for producing agent count growth in 2026?
Yes. There's a question. I'll start with the last question first. Do we expect to grow producing agent count? Yes, we will continue to grow. That's our expectation. I would just emphasize, I think producing agent count growth is important, but I think it's a distant second to agent productivity. Ideally, we try and do both. We try and grow the number of agents we have, and we want them all to be more productive. But if you force me to pick, I will always emphasize productivity. That's a very long-winded way of saying we expect the agent count to grow in 2026, but it's not my primary focus. primary focus is definitely productivity. In terms of the overall outlook, let me first issue a disclaimer. I have a terrible track record of predicting everything from interest rates to the weather. If you want to know exactly what's not going to happen, you should ask me for a prediction. All of that said, I feel like 2025 was a year of significant lack of visibility, And I have to tell you, I still feel that way. I feel like there are so many variables in terms of what could happen with interest rates and geopolitics and so on. I think that it's very difficult. It's always difficult to predict, but I really feel like 25 and now 26 during my tenure is running different businesses. These are some of the most lack of visibility I've had as a CEO. Now, all of that said, yes, we have seen the job numbers. we have seen the reports of more layoffs. That typically helps us on the recruiting side, but that, of course, makes consumers more afraid and more reticent to engage in discretionary purchases. So what does that mean? It means our agent counts may go up. It means that things like Medicare supplements, which are typically a little bit more immune to economic cycles, those sales should still be reasonable, but other discretionary sales, such as annuities life and long-term care, I think, get more difficult when the macro environment gets tougher. All that said, we've, you know, we've continued to work through it, and I think it's really important to remember that no matter what's happening in the economy, there's still 11,000 folks turning 65 every day, and those folks still have an absence of alternatives in terms of long-term planning and so on. So that represents the opportunity for us, but the pressure is definitely growing. The headwinds are definitely growing.
Was that the type of detail you were looking for, or is there something I missed? No, no, that's great. And if I could just sneak one more in, Paul, I think you mentioned on the last call it was sort of reasonable to assume sort of a one Bermuda transaction a year. I just want to make sure that's right and that there's no change in that kind of thinking, high level.
Yeah, so, Sunita, I guess I'd say that we're very pleased to have completed our second treaty in 4Q of last year. We continue to work to further grow our Bermuda operation, but we won't share any specific plans as to not to get ahead of the regulatory review process. Our guidance does not contemplate any additional treaties beyond the two already in place for 2026. But I think, you know, as I said last time, you know, the cadence we've been on should, you know, be a decent indication of the cadence going forward.
Okay, thank you. Samit, I agree with Paul's comments. I would just like to emphasize one point. We enjoy really good relationships with the regulators there, and frankly, in the U.S. as well. And I think part of the reason we have those good relationships is because we're very respectful of their process. We never want to make any prediction that would seem like we're getting ahead of them or their processes, and that's why we don't build those types of things into our projections. We will be working to do what makes sense and what's smart and so on, but we also want to be respectful of the regulatory process.
Operator
Your next question comes from Wilma Burtis at Raymond James. Please go ahead.
Growth in 25 was strong at kind of high single digits or maybe, I guess, low double digits. But I realize this has been a result of multiple years, Gary, that you've been focused on positioning the business for growth. But is this a sustainable level? Anything unusual in 2025? Or I suppose there could even be some upside, right, with Medicare Advantage issues, tech investments, that kind of thing. So maybe just give us some color.
Yeah, I think the easiest way to answer your question, Wilma, is probably to give you a little bit of a feel product by product. I think that we would expect our Medicare Advantage sales to go down because of what's happening in the marketplace. That really has nothing to do with C&L. It's just what's going on in the marketplace. Similarly, I would expect our Medicare Supplement sales to continue to go up. That volume, those 11,000 seniors that are turning 65 every day, more of them are going to be buying Medicare supplements than historically have. In terms of some of the other products, it starts to get harder to predict. If you think about some of the comments I made with Sumit, depending on what's happening with the macroeconomic conditions, that's really going to impact the discretionary purchases that the consumers make. Now we've been able to, you know, continue to work right through all of those. again, we've really had the demographic tailwinds that have helped us. But if we see increased headwinds, if there are really a lot more layoffs like we've seen early signs of, that's going to slow down discretionary purchases and we will inevitably be impacted by that. All in all, we remain pretty comfortable with the guidance that we've provided in terms of ROE and earnings and so on. It might be that we get more in one product and less in another, but we feel pretty good about the guidance we provided, we do acknowledge that there's some macroeconomic headwinds coming.
Thank you. And then could you help us think through any impact on Medicare Advantage distribution fees? I think that there's some actuarial component there that's based on the churn. And we've all heard about Medicare Advantage and some of the issues there, realize that those underwriting issues don't apply to you guys, but could impact the churn. Is that reflected in the 26 outlook? And maybe if you can give us any additional color.
Yeah, we have reflected. I'm sorry. This is Gary. We have reflected what we're expecting to see in terms of the volume on Medicare Advantage in our projections. I would expect there will continue to be pressure there. It's hard to know whether the carriers are going to focus on compensation or they're going to focus on paring back benefits or what other things they're going to do as they go through the process. All of that said, I think the bottom line is Medicare Advantage is going to have some very significant headwinds. And that's another reason we feel good about our model, where those consumers that want it, they can get it from us. But we are definitely more focused on Medicare supplement. We like the Medicare supplement better.
Operator
Okay, thank you.
Your next question comes from Jack Matten of BMO Capital Markets. please go ahead hi good morning we just just one on capital deployment I guess given the end of the year with about 200 million above your holding company target I guess are you thinking you'll bring that down closer to your your target level by the end of this year and any perspective or thoughts on potential use of cash would be helpful hey Jack it's Paul I would just emphasize that there's really been no change in how we think about deploying excess capital on the margin we return it to shareholders through share repurchases absent
more compelling alternatives we also think there's some wisdom to being somewhat measured and how quickly we take down the excess so without providing specific guidance i think a past practice here should be a good indication of our future behavior all right thanks and um Maybe just on the unallocated NII, I know there's a lot of things that go into that bucket, but I wonder if there's any kind of directional outlook you can provide for that line.
I mean, I know you caught out a $12 million special dividend. If we back that out, is that something close to a normal run rate that you'd expect?
Yeah, I would point you, Jack, to the detail in the supplement that breaks down what flows through NII not allocated. Certainly the dividend in the fourth quarter of this year and the fourth quarter of last year is sort of off-trend and not, you know, something that we expect to be repeated. You know, we may see more of that, but it's not kind of run rate. The one thing that's fairly volatile has been at least the last, you know, few years is the income from alts. And certainly the sequential trend has been good there over the last few quarters, particularly in the fourth quarter of this year where the yield was actually slightly better than, you know, our long-term run rate of sort of, you know, eight to nine, something in that range. So I wouldn't necessarily predict how that's going to play out over the next four quarters, but our guidance does presume that it's generating that long-term return.
I guess one more end up, kind of a follow-up on the Medicare dynamics. I guess I know for Medicare itself, you capture both distribution and the right economics. I guess is that then more or less or the same on like an ROE basis versus, you know, Medicare Advantage where you really are only counting with the distribution economics of that? Just wondering how you should think about how that plays into your financials and ROE profile.
Yeah, economically, frankly, we're indifferent. There are pros and cons to each. As an example, with the Medicare Advantage, you get to recognize the income sooner, as an example. But the high-level thing you should take away is economically we're really indifferent, and we've designed it that way intentionally. All that said, operationally, I have a strong preference for the Medicare supplement, number one, because we manufacture it and distribute it, so we control the entire chain, if you will. So that isn't an economic commentary. That's just about the business. Second, typically, not always, but typically Medicare supplement consumers tend to be of higher net worth and they tend to have a greater ability to buy other products. I want to emphasize with that there are some really strict rules about how you can market to consumers when you have a Medicare relationship and so on. We, of course, follow all of those rules, so I don't want that to get misinterpreted. But the bottom line is, in the context of those rules, we do better with consumers that have a Medicare supplement because they typically have a greater net worth and typically have a greater interest in talking to us about other products as well. So that's the reason for the preference.
Operator
A reminder, if you would like to ask a question, please press star 1 on your telephone keypad. Your next question comes from Wilma Burtis at Raymond James. Please go ahead.
Hey, thanks for letting me back in. Just a couple for you. Are you seeing any dynamics in the investment universe that might influence a shift in allocations to higher yielding assets in order to just continue to give a good yield given proper risk management with interest rate decreases and ongoing tight spreads?
Well, thanks for the question, Eric. I'd invite you to offer your perspective on that. We may have lost you.
I think Eric's having some technical difficulties, yeah.
Operator
Just one moment while we add Eric.
One moment while we add. Oh, you got me, Adam?
All right, thank you. All right, thank you. Thank you, Wilma. Sorry for the back and forth. You know, I think right now we're largely running back, you know, what we did for the second half of last year, which was pretty successful, which was, you know, largely around sustaining good portfolio quality supplemented with some you know small tactical add-ins around the edges that really produce some some yield in the portfolio I would not expect us to be changing necessarily our risk parameters currently I don't think you're you know spreads continue to be very tight I don't think there's a particular space right now where you're are being rewarded for that, that would include the software space, that would include the BDC space as well. Very closely monitoring those areas for opportunity should have arrived, but currently don't think the valuations have cheapened enough to attract our money.
So running it back, feel good about how things are trending right now, and it'll take a little bit more more juice in the in the orange for us to change that thank you and then I'm just one last one is there any elevated sales benefit that you're seeing from annuities products as a result of the increased health sales specifically in Medicare supplement or is it just kind of normal course growth? Thanks.
I think it's mainly normal course growth. Now, that said, we had really strong Medicare supplement sales, and that, of course, helped us, you know, consistent with my earlier comments, the Medicare supplement consumers typically have a better cross-sell ratio for us, again, within the context of following all the rules that are out there. So, we benefit from that. But in terms of that ratio growing where there was a greater level of cross-sale, I wouldn't say so, no. Thank you.
Operator
Your next question comes from John Barnage from Piper Sandler. Please go ahead.
Good morning. Thanks for the opportunity. My first question is sticking with the investment portfolio. What's the exposure to software in the investment portfolio as you broadly define it?
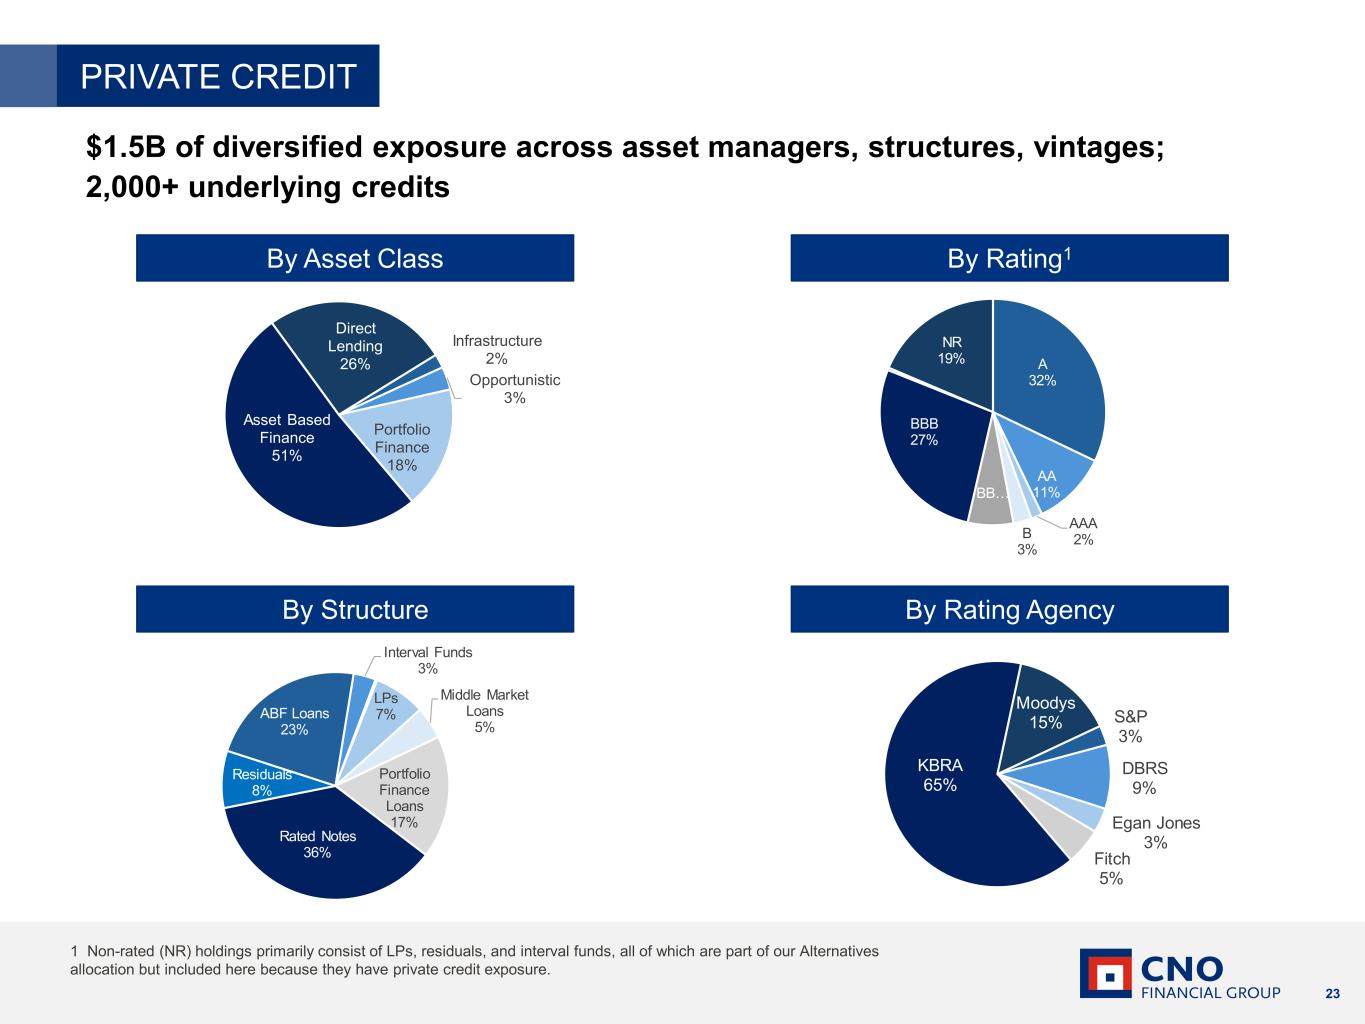
Good morning, John. Hopefully you can hear me on my first go-around. This, for us, I think will be an opportunity if it arises, certainly not a problem. You know, I'm old enough to remember, you know, Polaroid and Kodak. And so, software has always been a business that's been susceptible to disruption. That's not something I'm learning this year. I've known it for a really long time that's informed how we've allocated to the space. Currently, we have roughly $250 million of software exposure. That's about 60, 70 basis points, a pretty small number. Strong tilt towards software that serves enterprises rather than small businesses or consumers. Within that small, within that rather, strong preference for mission critical software, systems of record, proprietary data repositories and cyber security. So I think, you know, we are positioned from strength and, you know, when and with the market rewards some risk taking in this area, I think we'll be prepared for it. Broadening out my answer for you, John, if you looked into our alternatives portfolio, a somewhat similar answer in private of credit, which is about $1.4 billion allocation. We probably have, it's less than 10% of that would be exposed to software. And within that, it's very little of its direct lending. The great bulk of it is in structured form, which means it has good credit support and it's margined and all that stuff. So, you know, we've got strong cushions there in PE, it's about 15% of our PE holdings, which is 400 plus million dollars. So 15% of that, you can do the math, it's about $70 million. And so, you know, I think that if you got a big drawdown or bigger than where we were currently experienced, at least in PE or even in private credit, You could, I think, dampen alternatives returns, but I don't think you would destroy alternatives returns. So, you know, I think on balance, we're in a good spot, and I think we have the ability in the partners to take advantage of opportunities that emerge, and I think I'll leave it there, but happy to amplify on anything you would like.
Thanks for that, Eric. It was very helpful. My next question for Gary, if we talk about, I think it was 11,000 people turn 65 a day now, you've certainly positioned yourself to take advantage of this secular dynamic for quite some time with recruitment and productivity. But I'm trying to better understand how we see this 11,000 moving to 12,000 and when it goes back down to 10,000. How long did it take us to get here from 10 to 11? And can you talk about your product positioning in the life cycle of these individuals turning 65?
Yeah. Thanks, John. Sorry, I'm getting a lot of echo. I'm getting a lot of echo.
I believe we hit the peak. It's either 2030 or 2035 when the number of folks turning 65 starts to go down again. So we're within five to ten years of that peak number, if memory serves correctly. but we expect it to grow or hold stable until then and even when it starts even on down it's not like it's going to go from 11,000 down to 2,000 it's going to gradually reduce again so still represent a very significant opportunity for us. So we view this as something that will be there for quite some time regardless of what's happening with Medicare Advantage versus Medicare Supplement that the reality is that anyone to turn 65 is going to at least look at these products. So we expect this opportunity to continue for quite some time.
I wonder if it might help with that echo if you put yourself on mute.
Operator
At this time, there are no further questions. I will now turn the call back to Adam Alville for closing remarks.
Thank you, operator, and thank you all for participating in today's call. Please reach out to the Investor Relations team if you have any further questions. Have a great rest of your day.
Operator
This concludes today's call. Thank you for attending. You may now disconnect.