Operator
Hello, everyone, and thank you for joining us today for the CNO Financial Group Third Quarter Earnings Call. My name is Sammy, and I'll be coordinating your call today. During the presentation, you can register a question by pressing star followed by one on your telephone keypad. If you change your mind, please press star followed by two on your telephone keypad to remove yourself from the question queue. I would now like to hand over to your host, Adam Orville, from CNO to begin. Please go ahead, Adam.
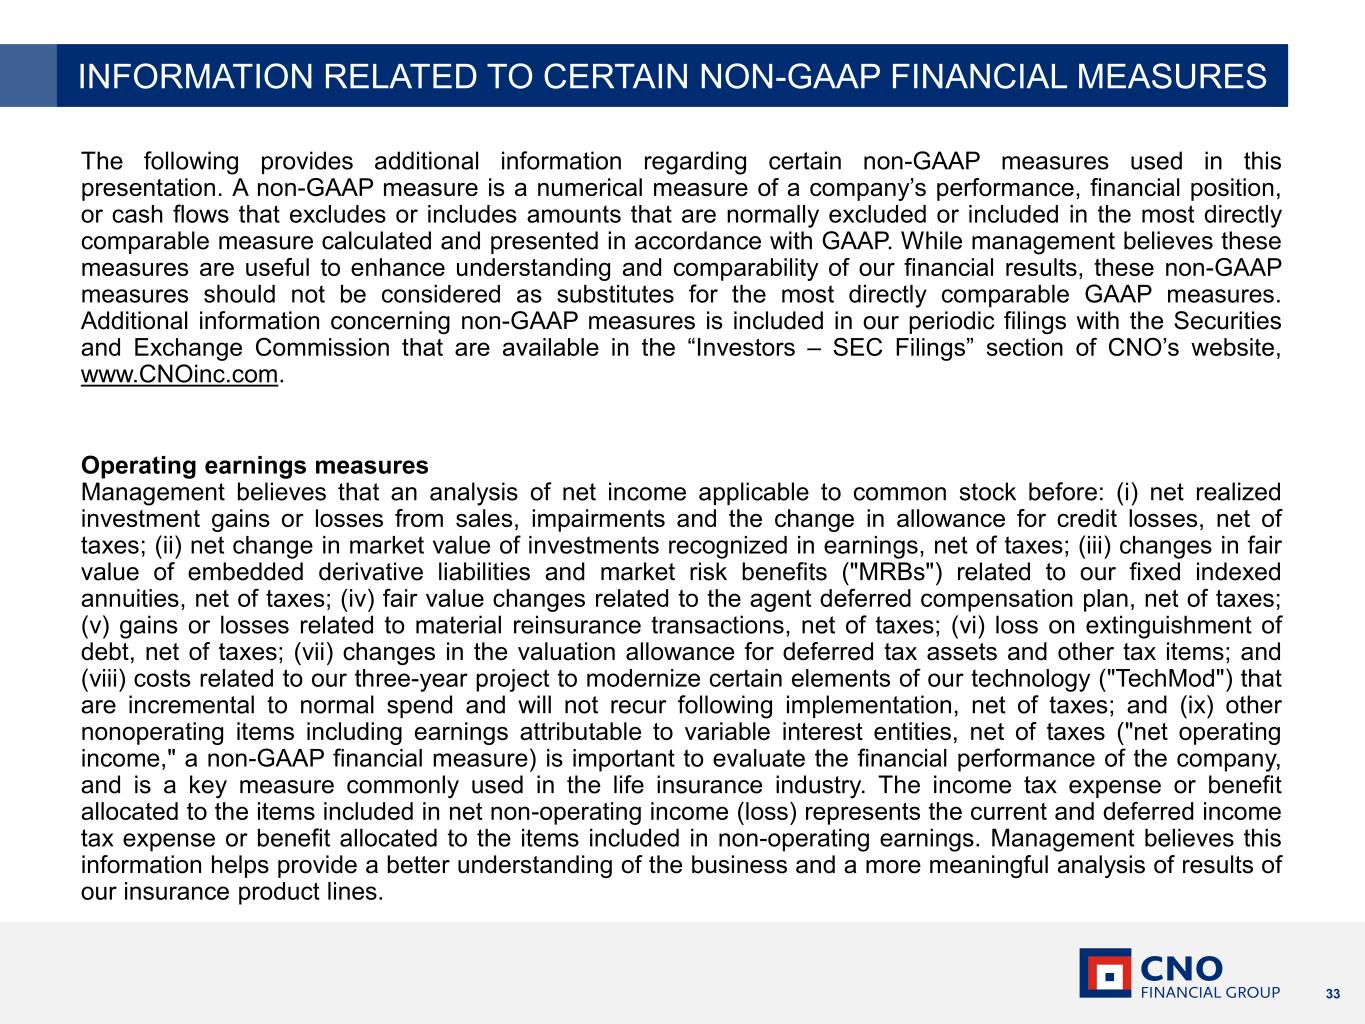
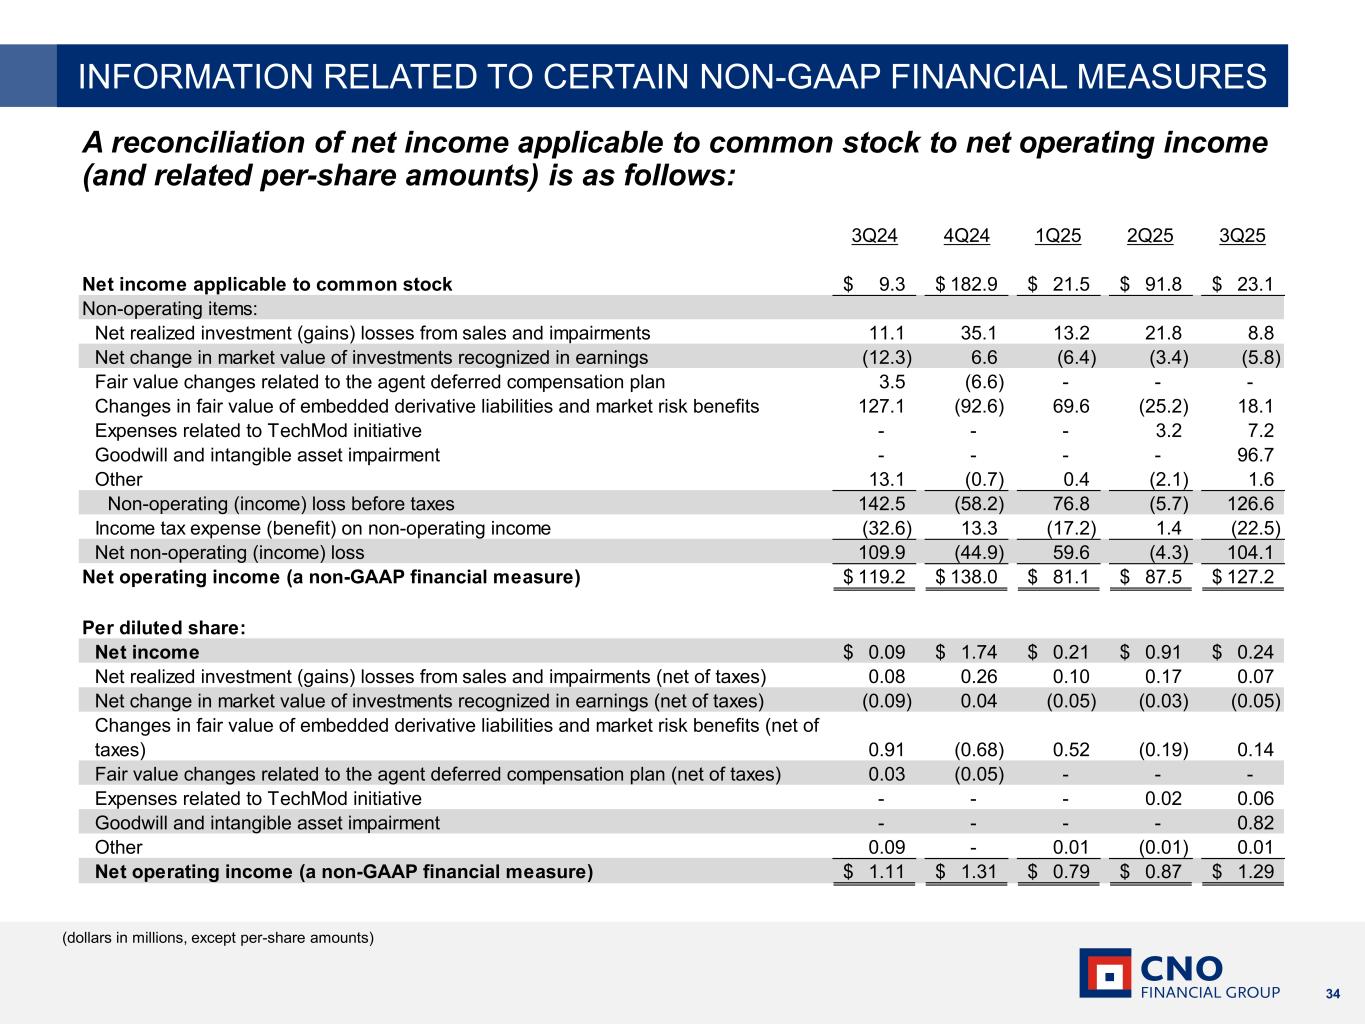
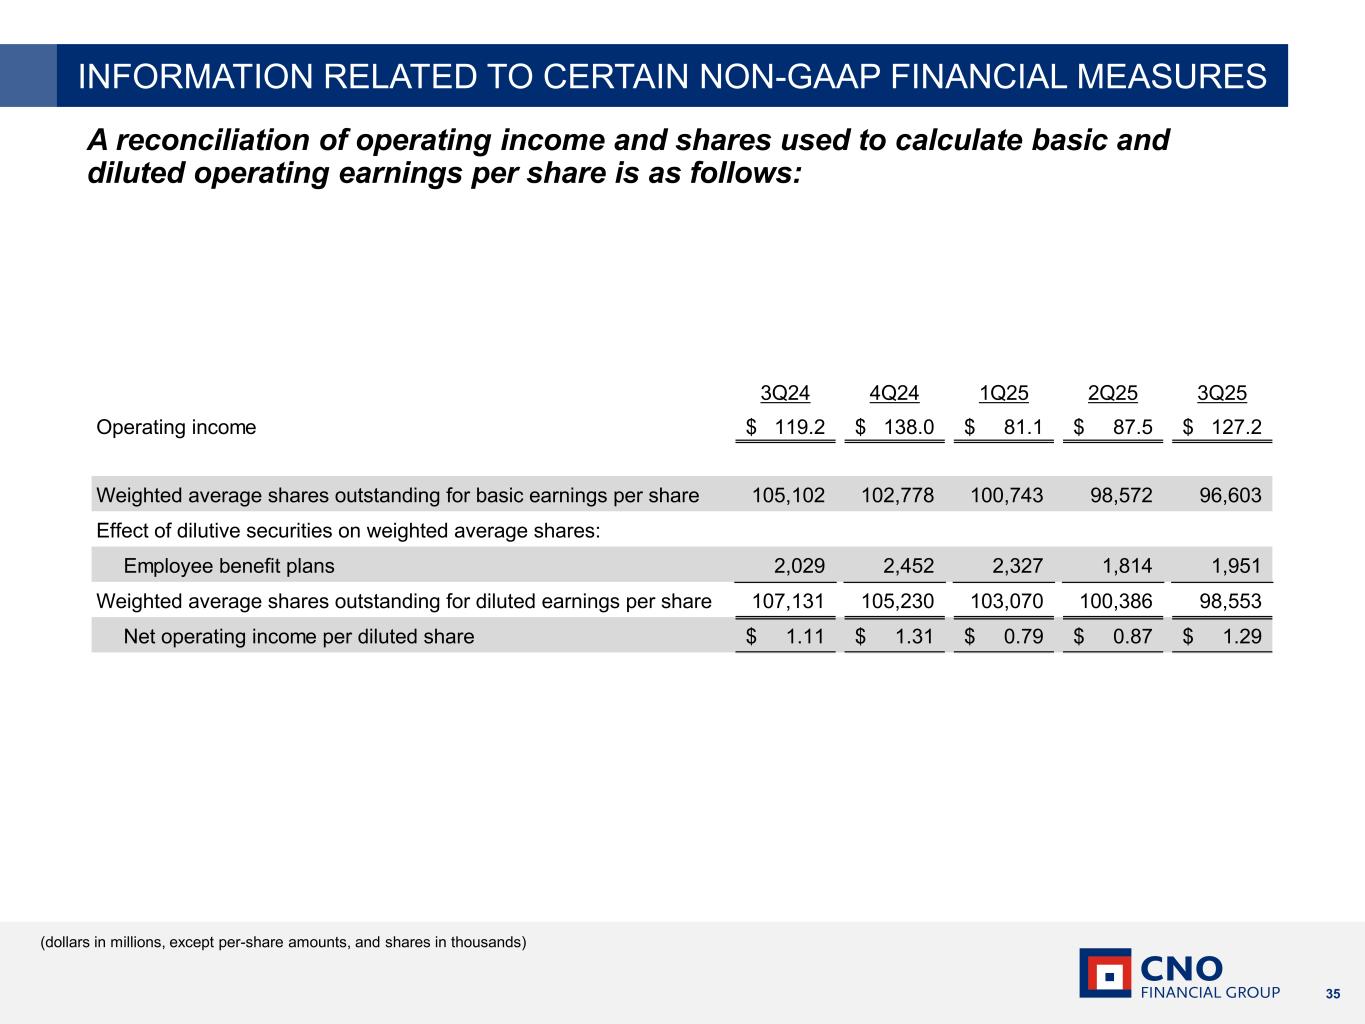
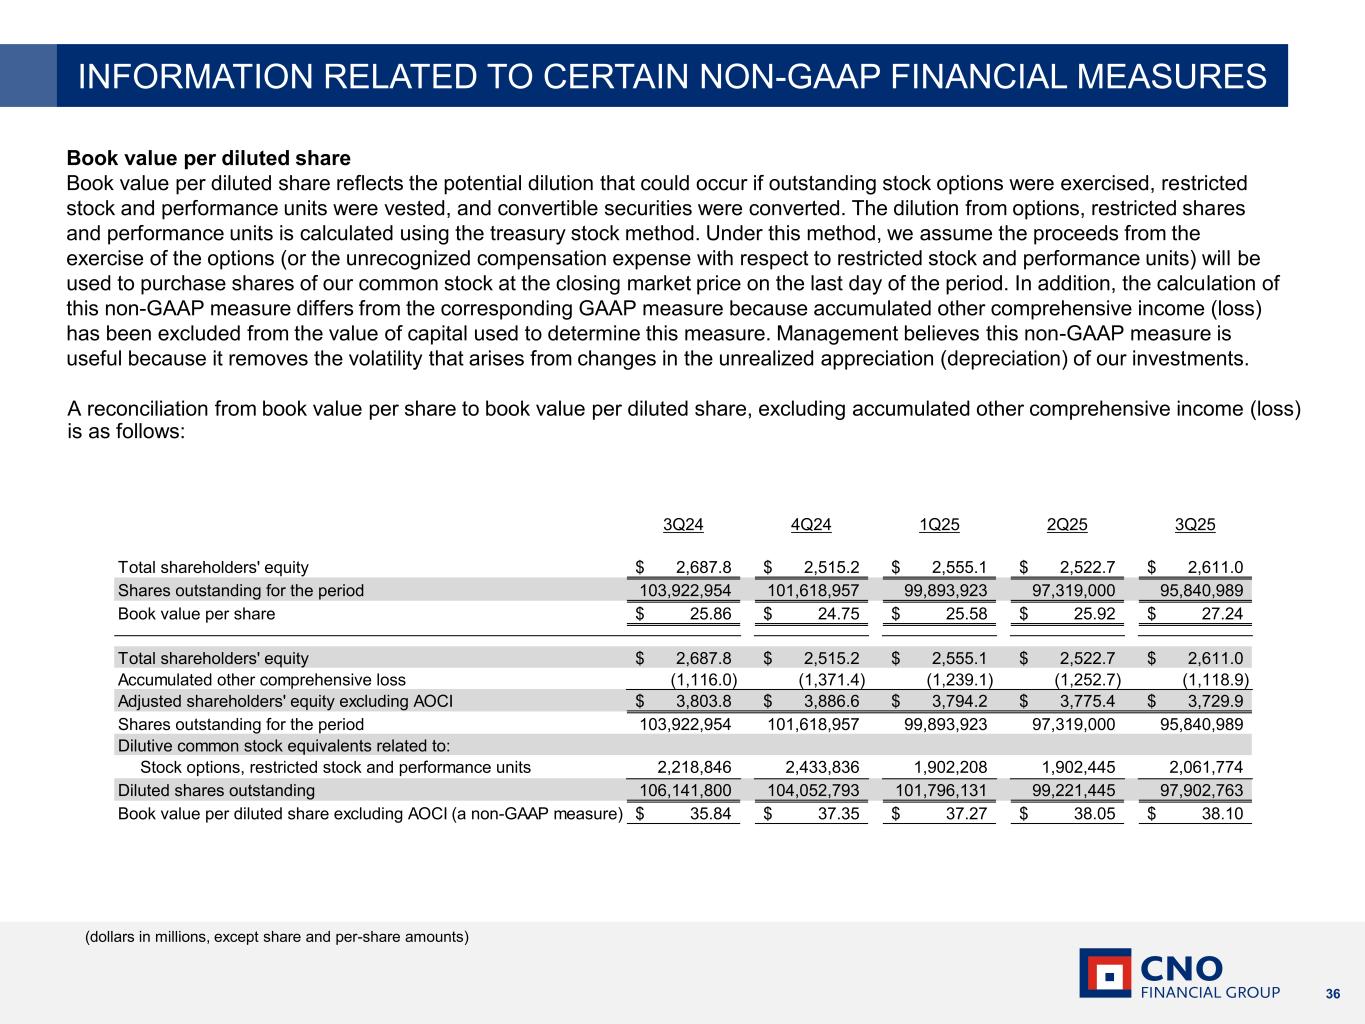
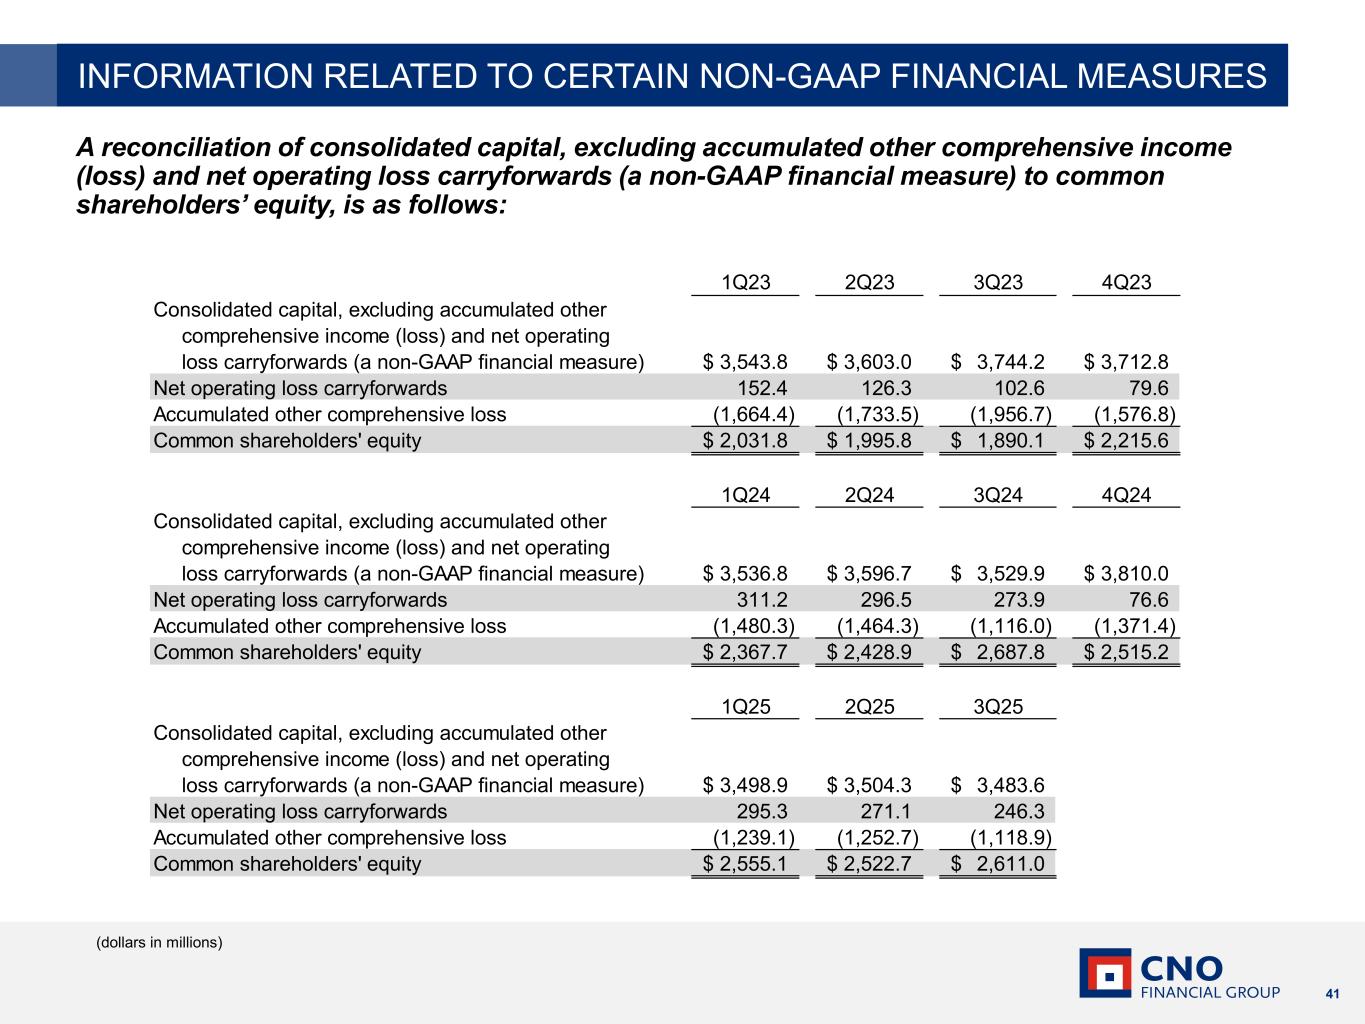
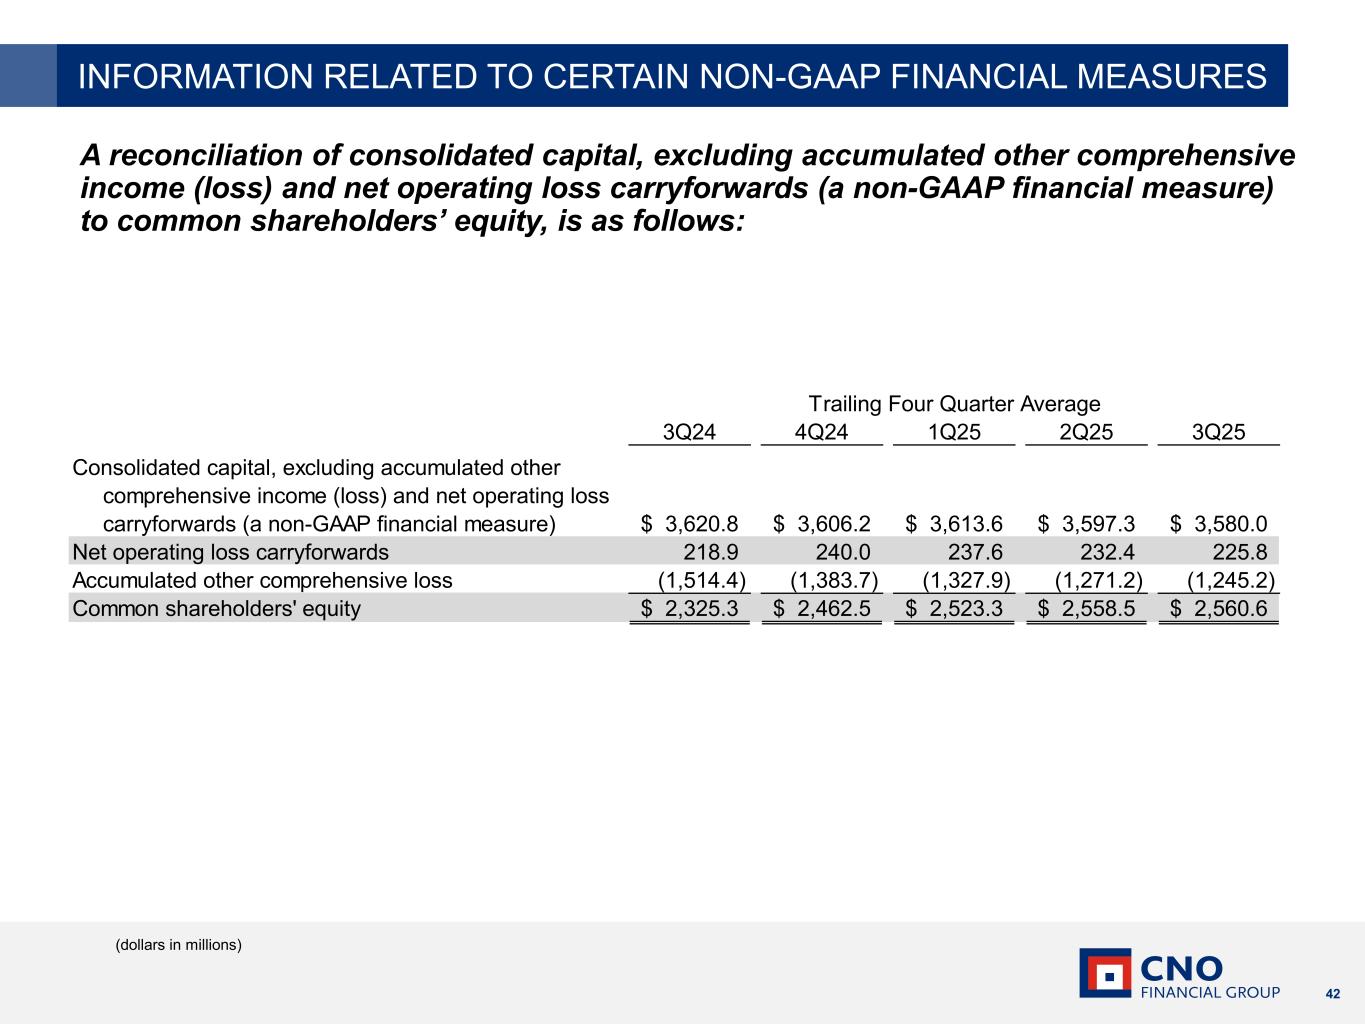
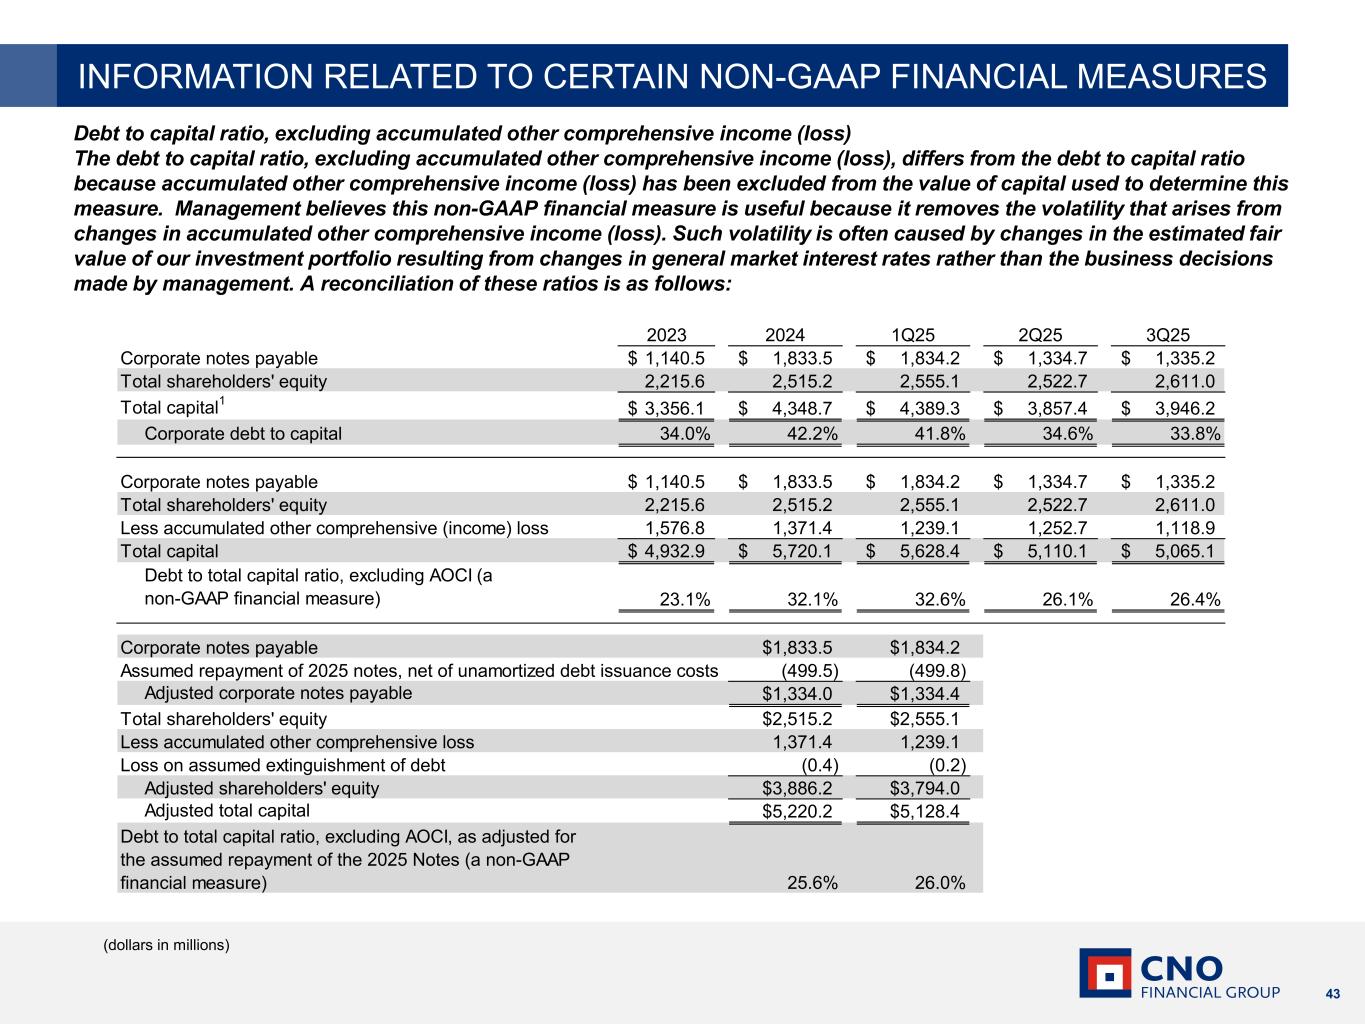
Good morning. Thank you for joining us on CNO Financial Group's Third Quarter 2025. 5. Today's presentation will include remarks from Gary Bajwani, Chief Executive Officer, and Paul McDonough, Chief Financial Officer. Following the presentation, we will also have other business leaders available for the question and answer period. During this conference call, we will be referring to information contained in yesterday's press release. You can obtain the release by visiting the media section of our website at CNOIN. This morning's presentation is also available in the investors section of our website and was filed in a form 8K yesterday. Let me remind you that any forward-looking statements we make today are subject to a number of factors which may cause actual results to be materially different than those contemplated by the forward-looking statements. Today's presentation contains a number of non-GAP measures, which should not be considered as substitutes for the most directly comparable GAP measures. You'll find a reconciliation of the non-GAP measures to corresponding GAP measures in the appendix. Throughout the presentation, we'll be making performance comparisons, and unless otherwise specified, any comparisons made will refer to changes between third quarter 2025 and third quarter 2024. And with that, I'll turn the call over to Gary.
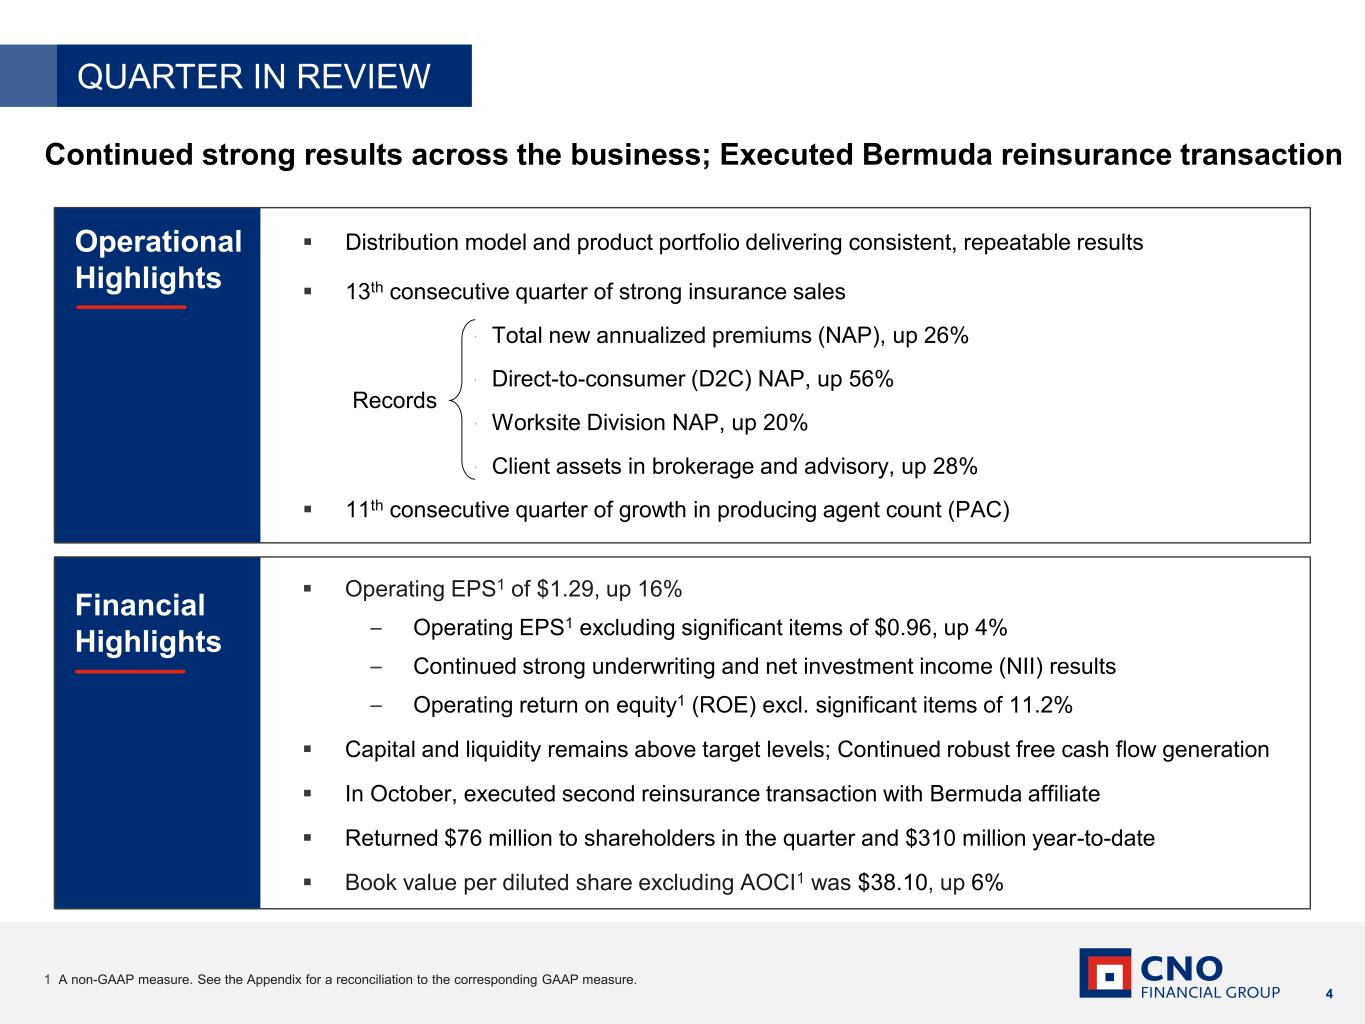
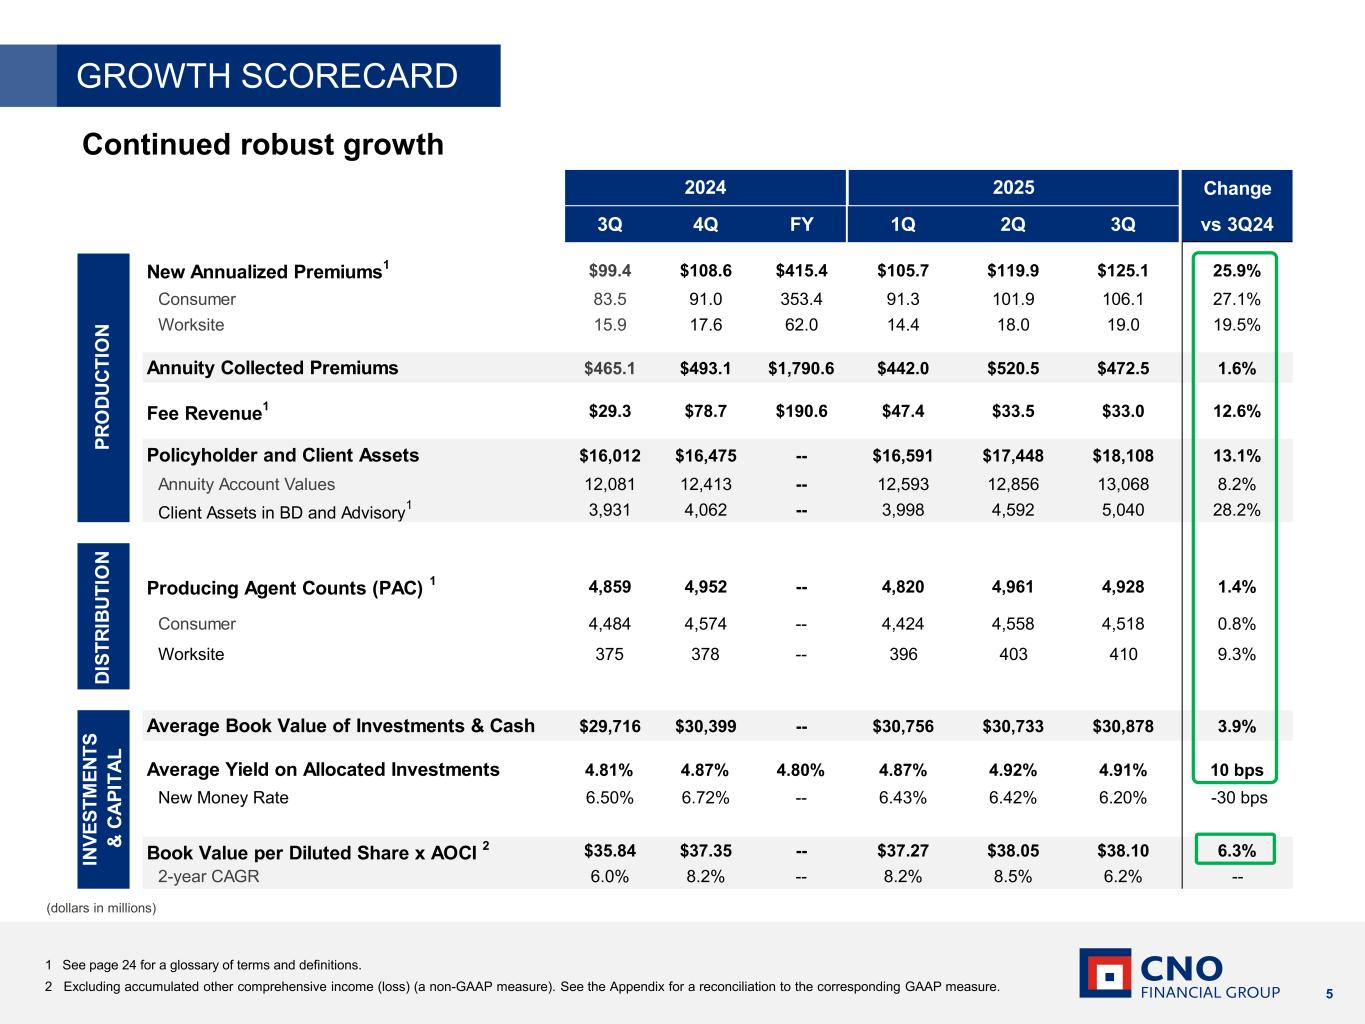
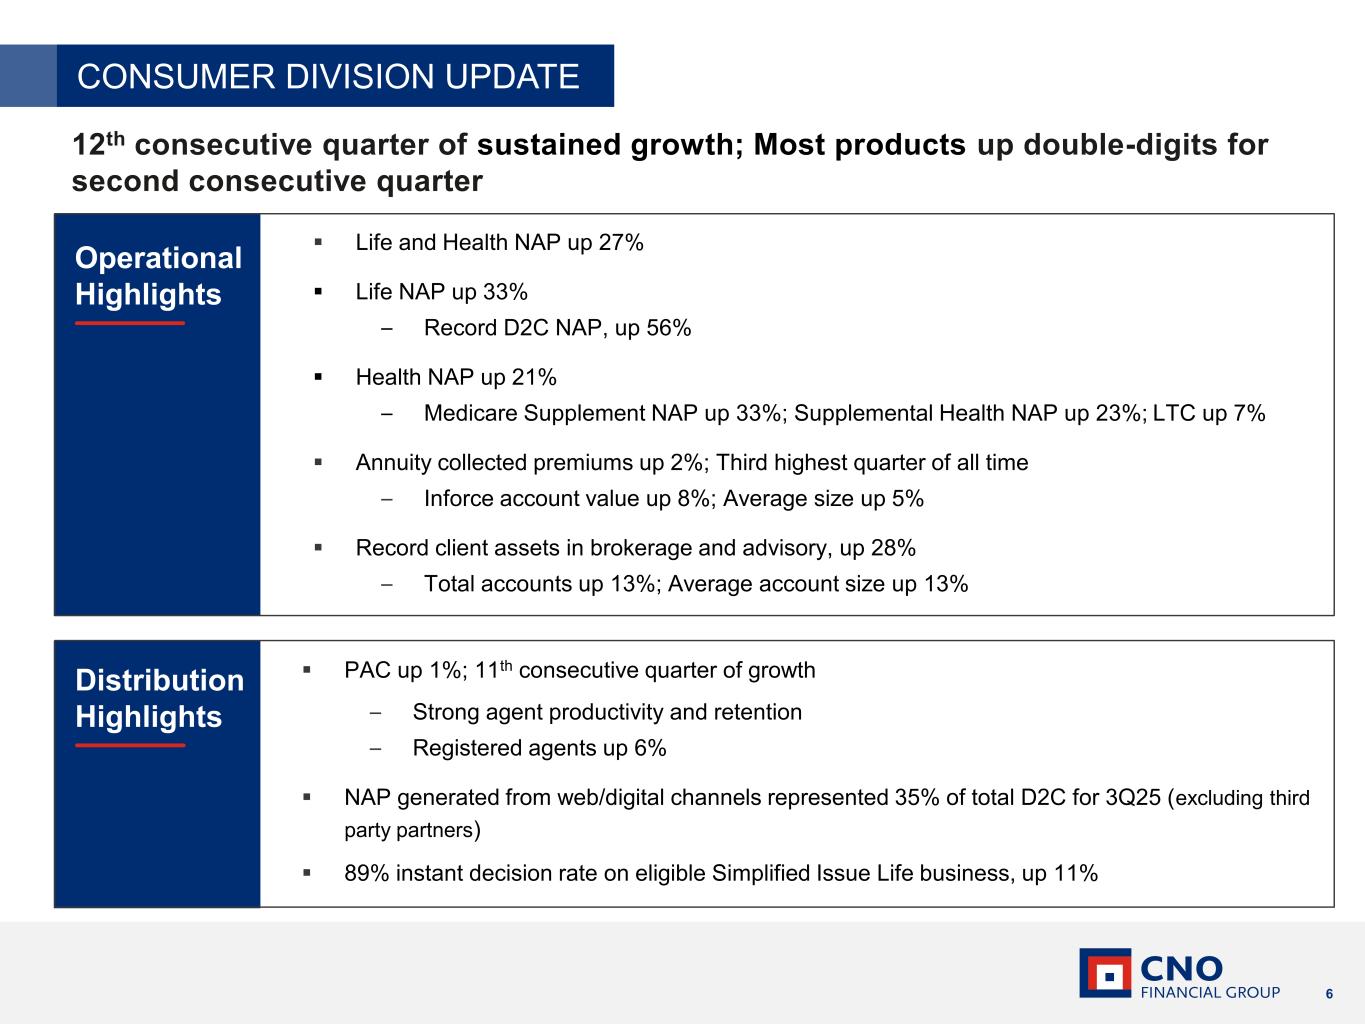
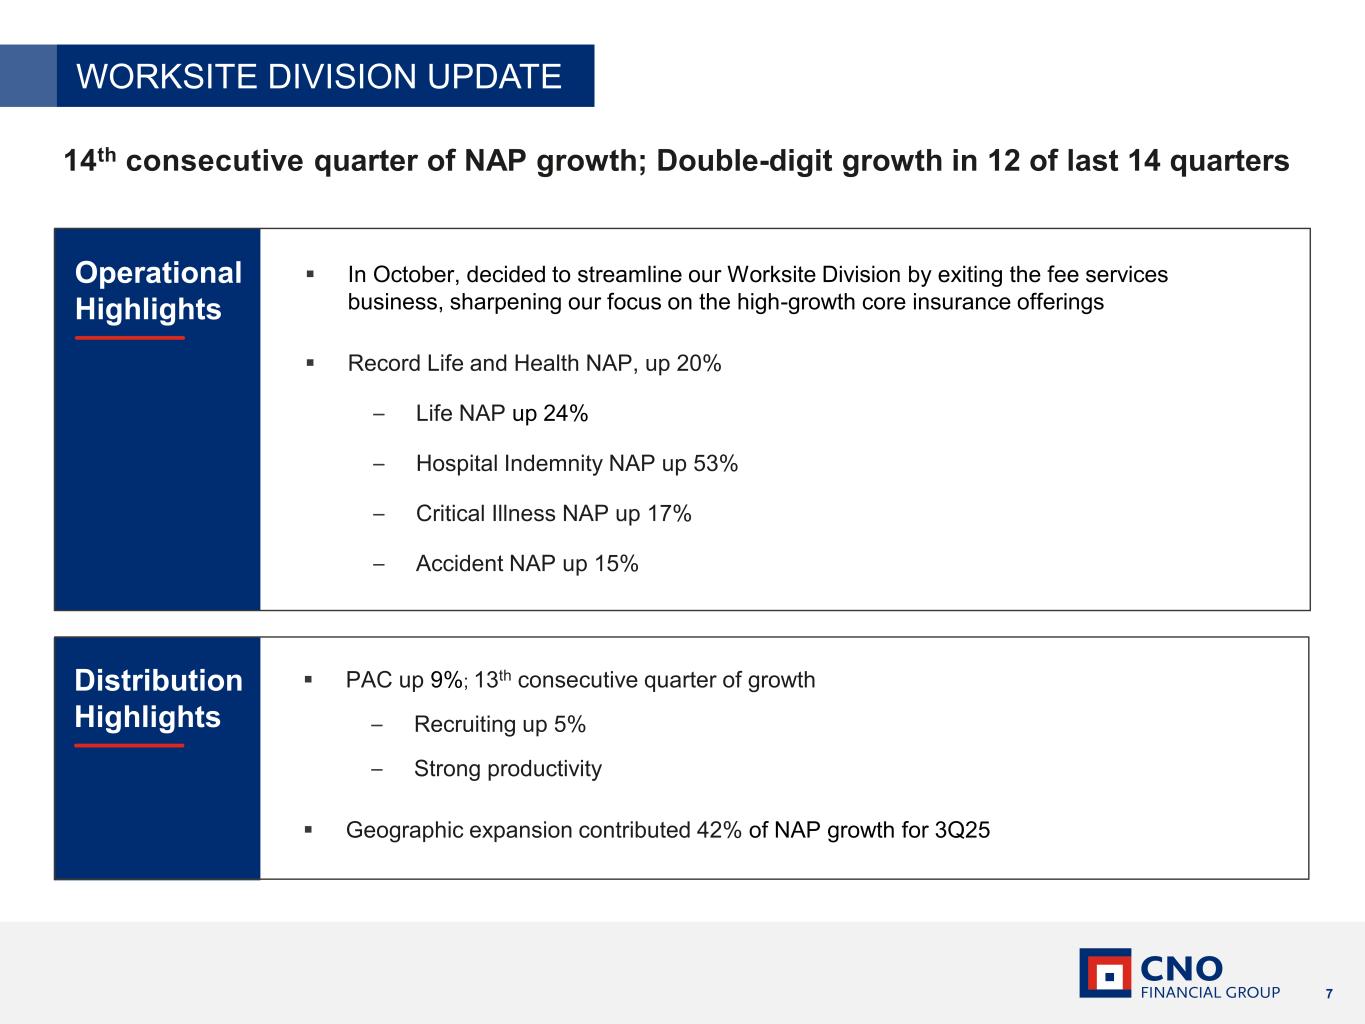
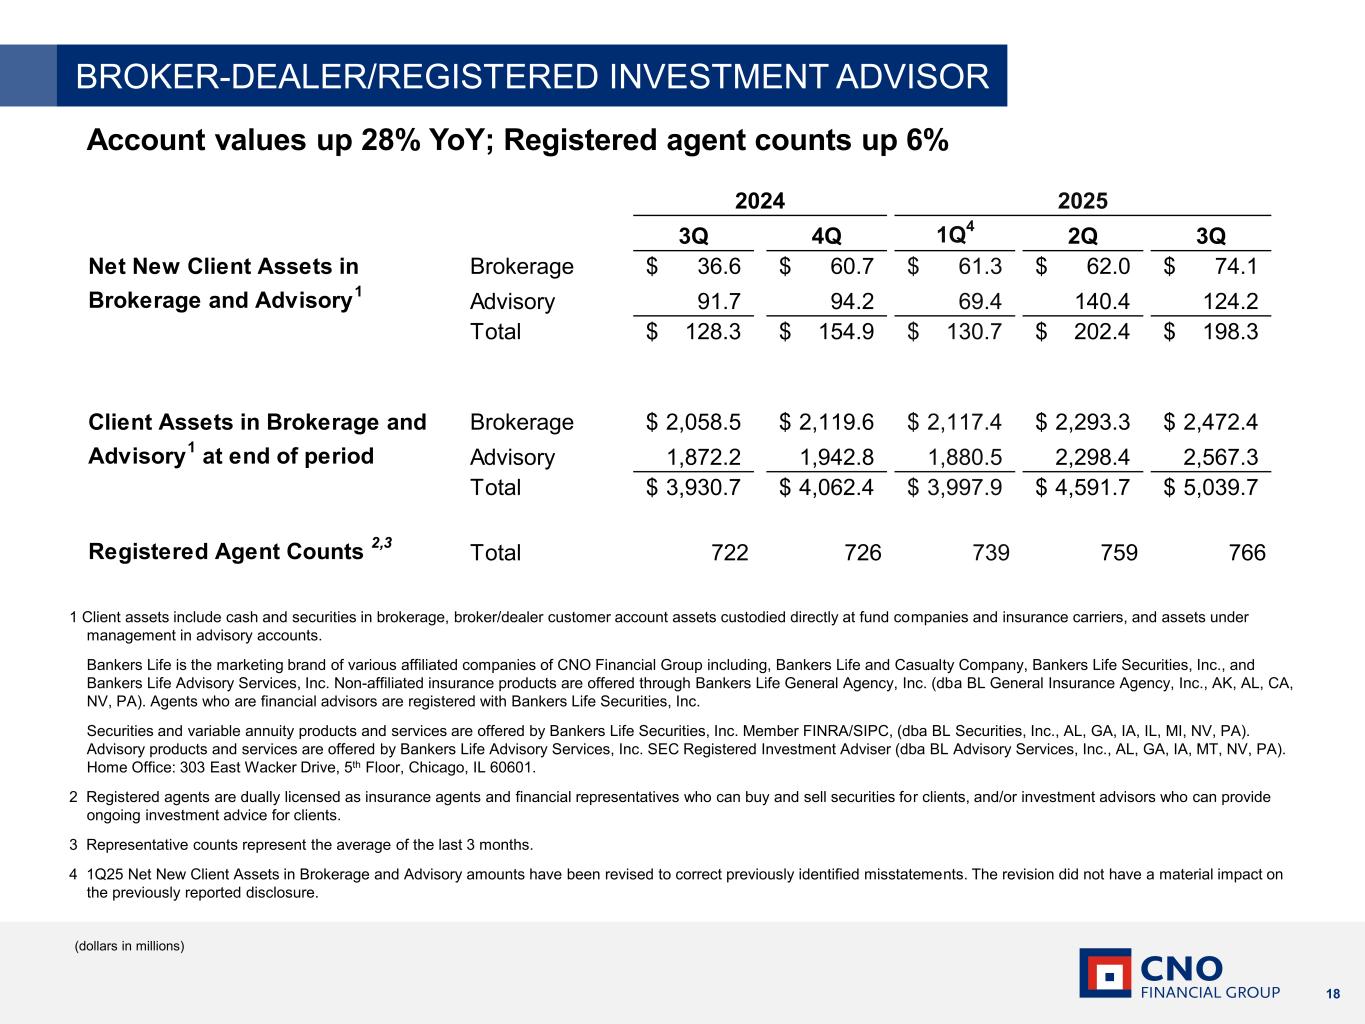
Thanks, Adam. Good morning, everyone, and thank you for joining us. Starting at slide four, C&O once again delivered a strong quarter, demonstrating our capabilities to generate consistent, repeatable results and execute on our strategic plan. We remain focused on growing earnings and improving profitability. To do so, we have taken action on two items that we expect will accelerate operating ROE improvement through 2027 by an additional 50 basis points. First, the execution of a second Bermuda treaty and second changes to our worksite division's fee services business. Further details will be provided later in our prepared remarks. Sales results in the quarter were excellent, including record total new annualized premiums of $125 million, up 26%, and double-digit insurance sales growth in both divisions. We also delivered our 13th consecutive quarter of strong insurance sales and our 11th consecutive quarter of growth in producing age income. I'll cover these results in more detail in each division's comments. Operating earnings per diluted share were $1.29, up 16%. Earnings continue to benefit from favorable insurance product margin and solid investment results, reflecting growth in the business and expansion of the portfolio book yield. New money rates have exceeded 6% for 11 consecutive quarters now, while maintaining portfolio quality. Capital and liquidity remain above target levels, we returned $76 million to shareholders in the quarter and $310 million year-to-date. Book value per diluted share, excluding AOCI, was $38.10, up 6%. Paul will go into greater detail on our financial performance. Turning to slide five, nearly all of our growth scorecard metrics were up for the quarter. As a reminder, our growth scorecard focuses on three key drivers of our performance, production, distribution, and investments and capital. I'll discuss each division in the next two slides. Paul will cover investments and capital in more detail during his remarks. Beginning with the consumer division on slide six, the consumer business delivered another quarter of excellent sales results in our 12th consecutive quarter of sustained growth. Nearly all product lines were up, most by double digits. Steady execution and our dedication to serving the middle-income market continue to fuel our growth. Life and Health NAP once again posted double-digit growth in the quarter of 27 percent. We are pleased with our life business results including total life insurance up 33 percent and record direct-to-consumer life insurance sales up 56 percent. Our D2C results benefited from three key factors. First, process and technology enhancements continue to drive sales productivity. Second, we have been proactively diversifying our direct marketing away from television to include more web, digital, and third-party channels. Non-TV lead sources combined generated 72% of all D2C live sales in the quarter. Lastly, our D2C results were bolstered by increased direct marketing spend by some of our third-party partners. We don't expect this level of spending to repeat in the fourth quarter, which is traditionally the lowest selling quarter of the year for the D2C channel. Our approach to partnerships is intentionally selective, ensuring that distributors complement our existing capabilities and target markets that are different from our typical customer base. This strategy enables us to conduct rapid experiments with minimal investment that augment our in-house development and testing. Sustained growth in our health results continues to underscore strong customer demand for practical solutions to protect against out-of-pocket gaps in medical coverage and the growing cost of health care. Total health NAP was up 21%, which marks 13 consecutive quarters of growth. Supplemental health was up 23%, and long-term care was up 7%. Medicare Supplement was up 33%. Medicare Advantage policies sold, which are not reflected in NAP, were down 24%. Our Medicare results reflect a growing shift in consumer preferences from Medicare Advantage to Medicare Supplement, reversing a decade-long trend. As many of the leading MA sponsors tear back plans and benefits, more customers are moving to Medicare Supplement plans. With more than 11,000 people in the U.S. turning 65 every day, overall demand for Medicare products continues to grow, and we have an opportunity to continue to expand the total number of households we serve. Annuity collected premiums were up 2% in the quarter, our ninth consecutive quarter of growth. Collected premiums in the quarter totaled nearly $475 million, our third highest quarter of all time. Average account size was up 5% and in-force account values were up 8%, exceeding $13 billion for the first time. Our captive distribution and the long-term relationships that our agents establish with their clients add stability to our annuity block. We delivered our 10th consecutive quarter of brokerage and advisory growth. Client assets in brokerage and advisory were up 28% and hit a new record, surpassing $5 billion. dollars total accounts and average account size were each up 13 percent when combined with our annuity account values our clients now entrust us with more than 18 billion dollars of their assets up 13 percent agent productivity and retention continue to support our sustained sales momentum producing agent count grew for the 11th consecutive quarter and registered agent count was up 6%. Investments in technology continue to enable customer experience enhancements and drive operational efficiency. For example, accelerated underwriting on a portion of our simplified life products delivered an 89% instant decision rate on submitted policies in the quarter, up 11%. Next, slide 7 and our worksite division performance. As a reminder, our worksite division encompasses two primary components, insurance products and fee services. First, insurance product sales are the larger part of our worksite business, which once again delivered record sales in our 14th consecutive quarter of growth. I'll touch on our third quarter performance shortly. We have a long and successful history of selling insurance at the worksite. We like the profile and growth of this business. The second component is our fee services business which was added through the acquisitions of web benefit design in 2019 and direct path in 2021 this includes benefits administration technology and education advocacy and communication services this business is small representing less than one percent of total cno revenue and contributing a pre-tax annual loss of approximately 20 million dollars in october we decided to streamline our worksite operations and exit the fee services business to sharpen our focus on the core insurance business and align resources to proven growth areas. We expect the exit process to be substantially complete in the first half of 2026. After several years of strategic investment, Worksite Fee Services has not met our expectations for financial performance or in delivering new insurance customers. Additionally, competition has intensified with lower cost alternatives and new technologies disrupting our market position. Paul will provide more detail on the financial impacts of this decision, which we expect to be favorable to earnings and return on equity.
It was the right strategic decision for CNO, and it was not made lightly.
We remain grateful to the associates who supported this business and thanked them for their service and dedication to our clients and customers. It is important to emphasize that we remain fully committed to our worksite insurance products and distribution. Worksite insurance sales have never been stronger. The division adds valuable diversification and balance to our model. Turning to our results in the quarter. We delivered another record performance for insurance sales with worksite life and health NAP up 20%. This represents our 7th consecutive quarter of record NAP growth and our 14th consecutive quarter of overall NAP growth. Highlights included life insurance sales up 24%, hospital indemnity insurance up 53%, Critical Illness Insurance, up 17%, and Accident Insurance, up 15%. Strategic Growth Initiatives contributed significantly to our worksite NAP performance. Our Geographic Expansion Initiative delivered 42% of the NAP growth in the quarter, marking the seventh consecutive quarter of growth from this program. Recent investments in training and sales tools continue to enhance agent productivity. Worksite recruiting was up 5% in the quarter, and agent productivity was up 15%. Producing agent count was up 9%, our 13th consecutive quarter of growth. As supported by our strong results, we remain bullish on worksite insurance growth in the fourth quarter of 2025 and beyond. And with that, I'll turn it over to Paul.
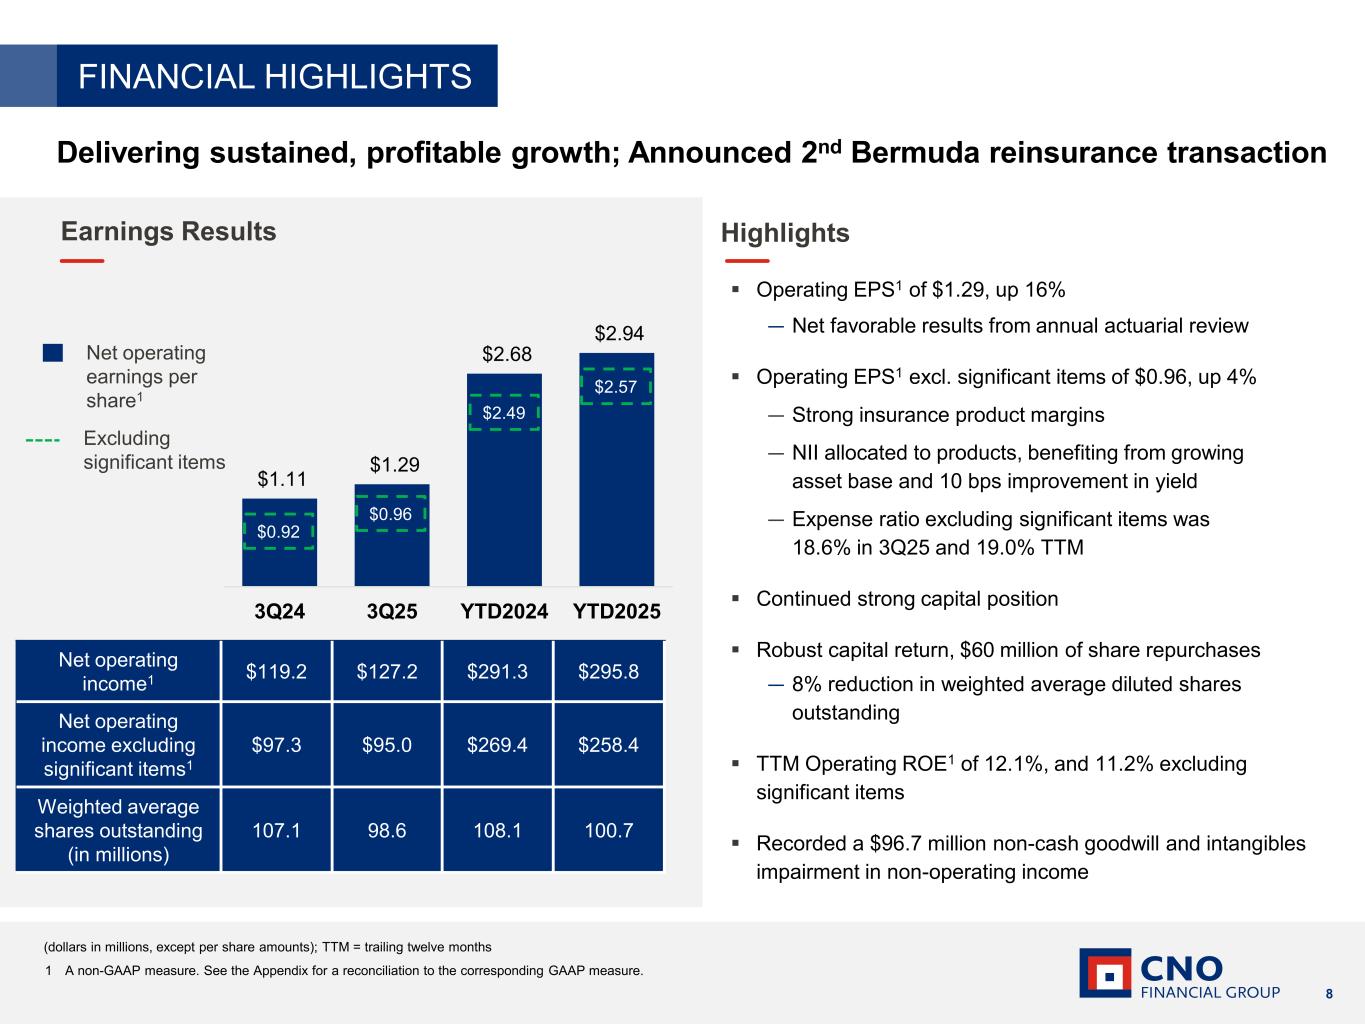
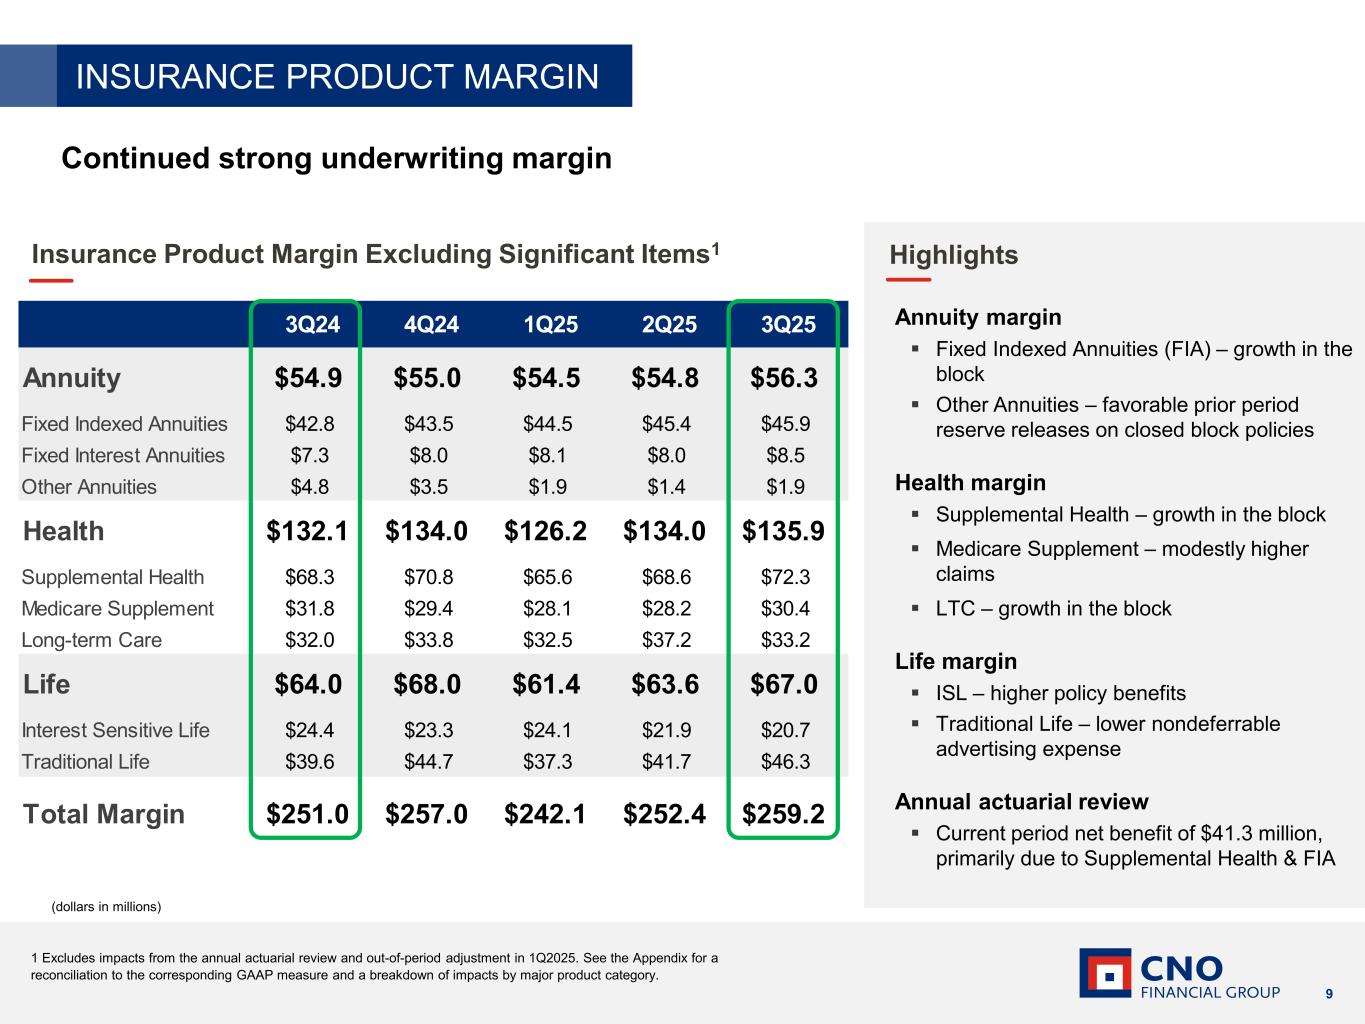
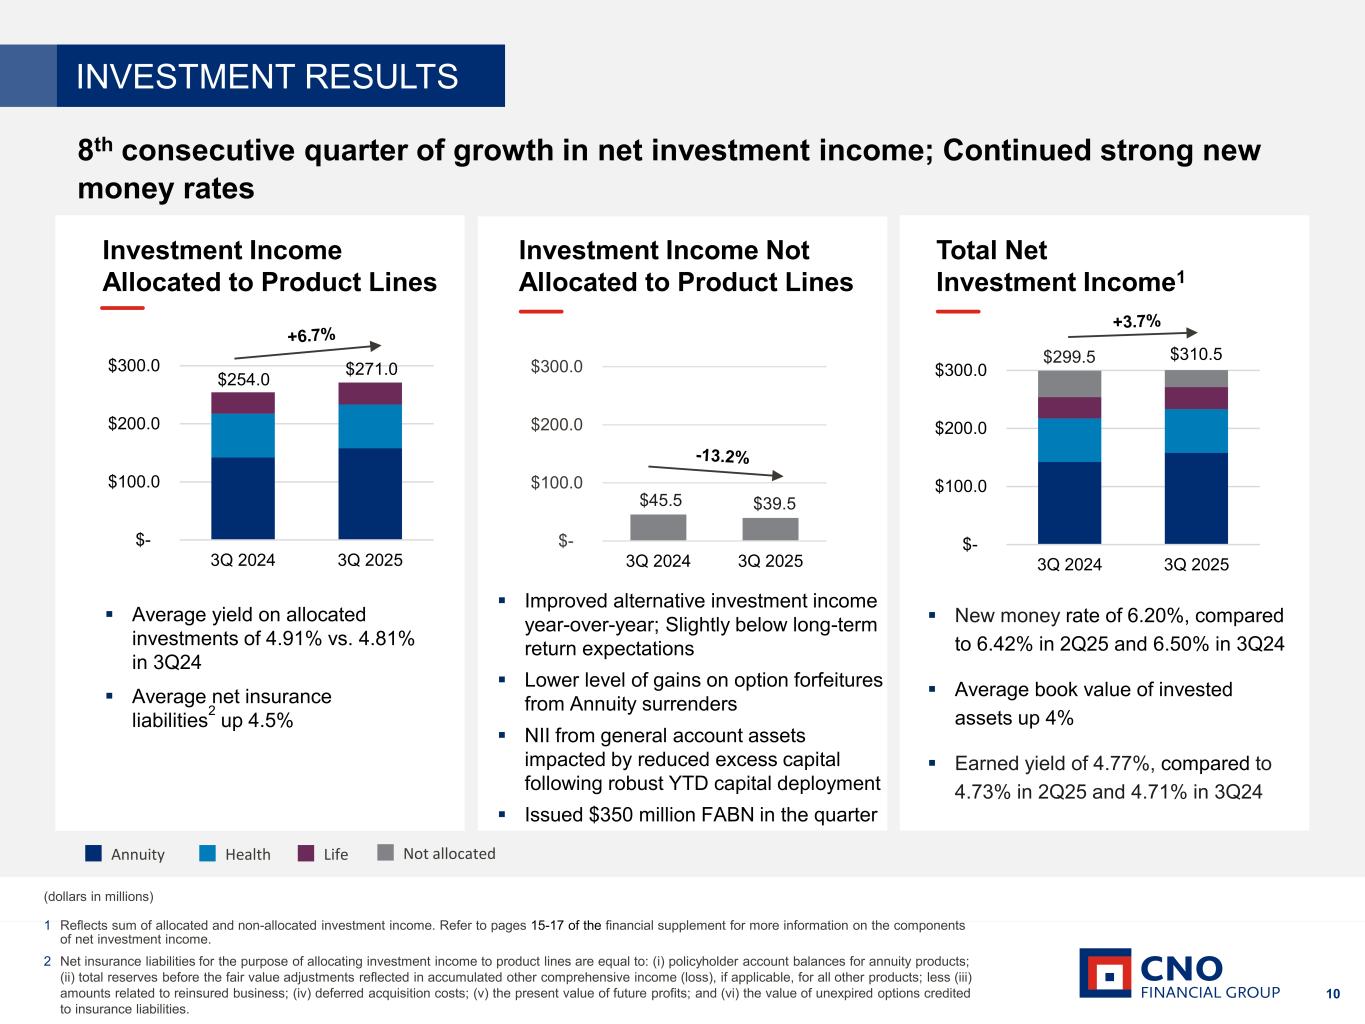
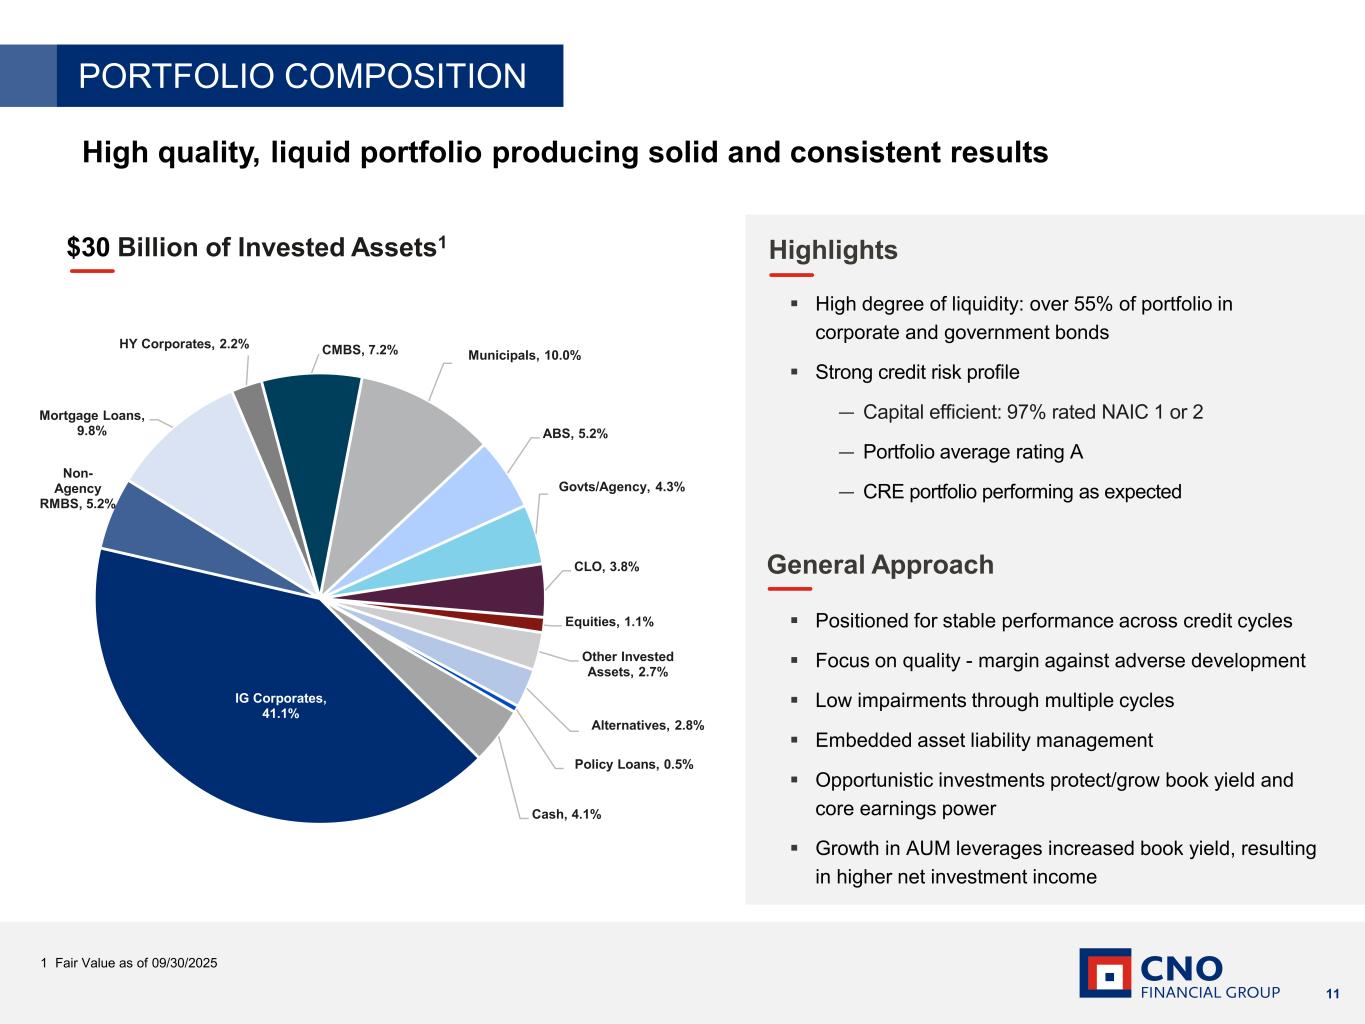
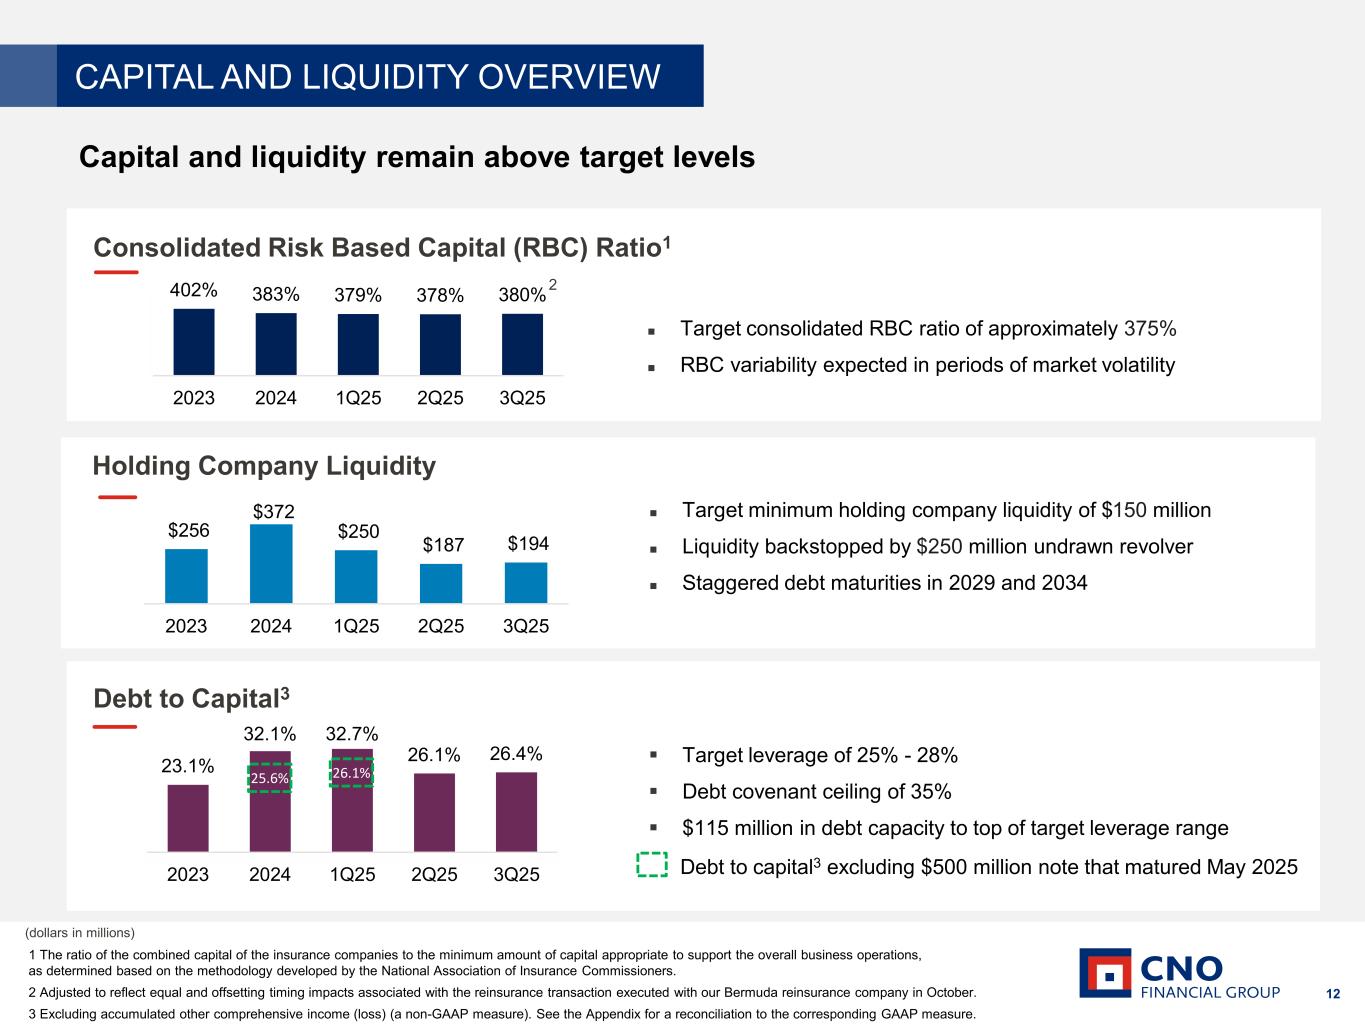
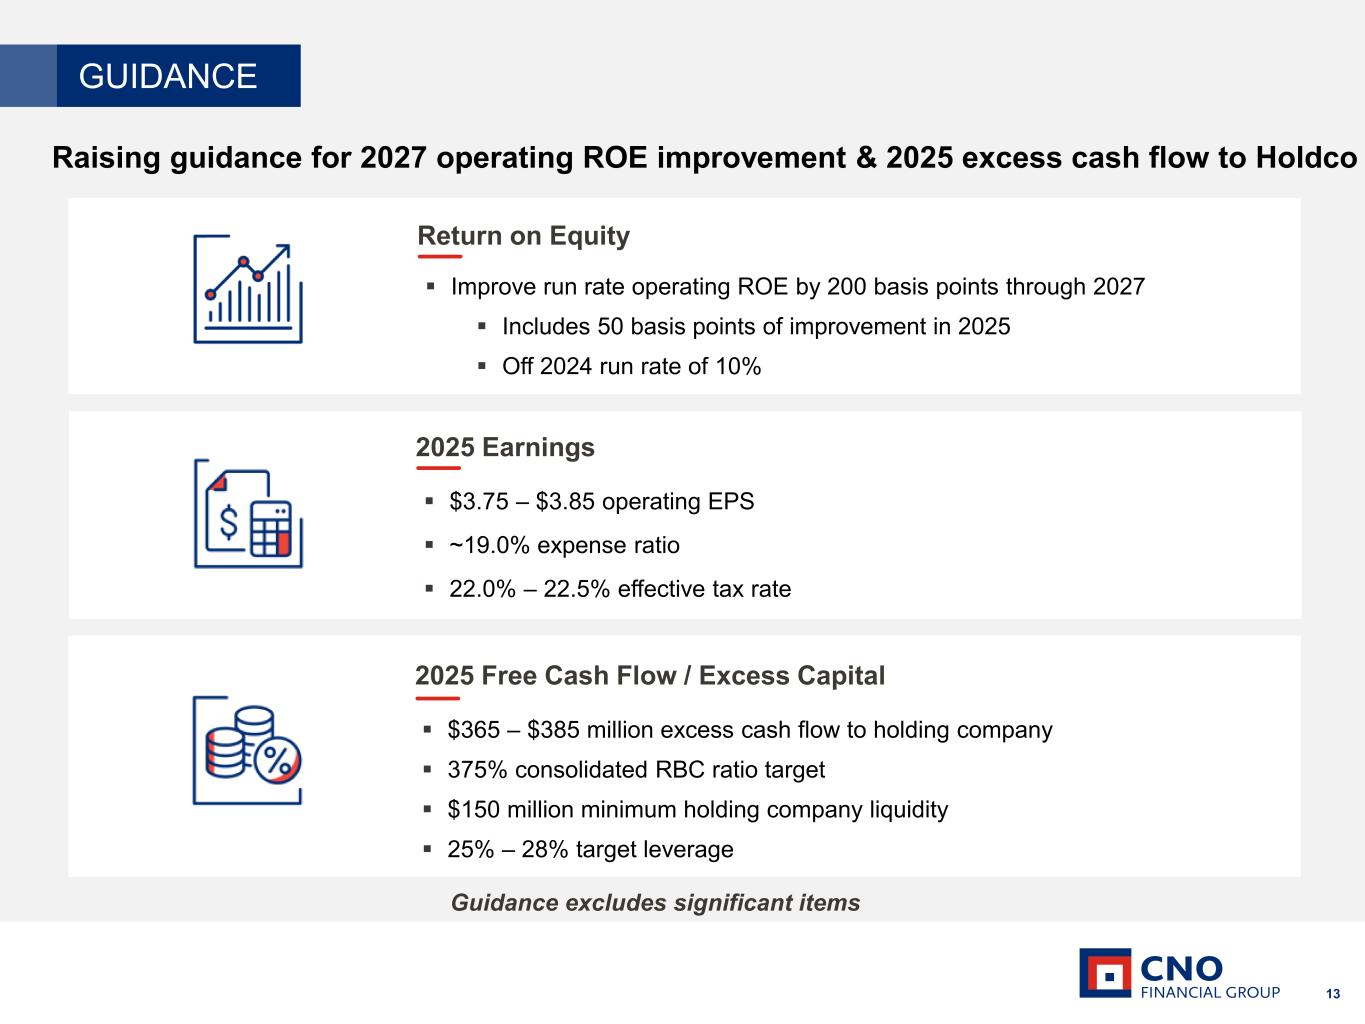
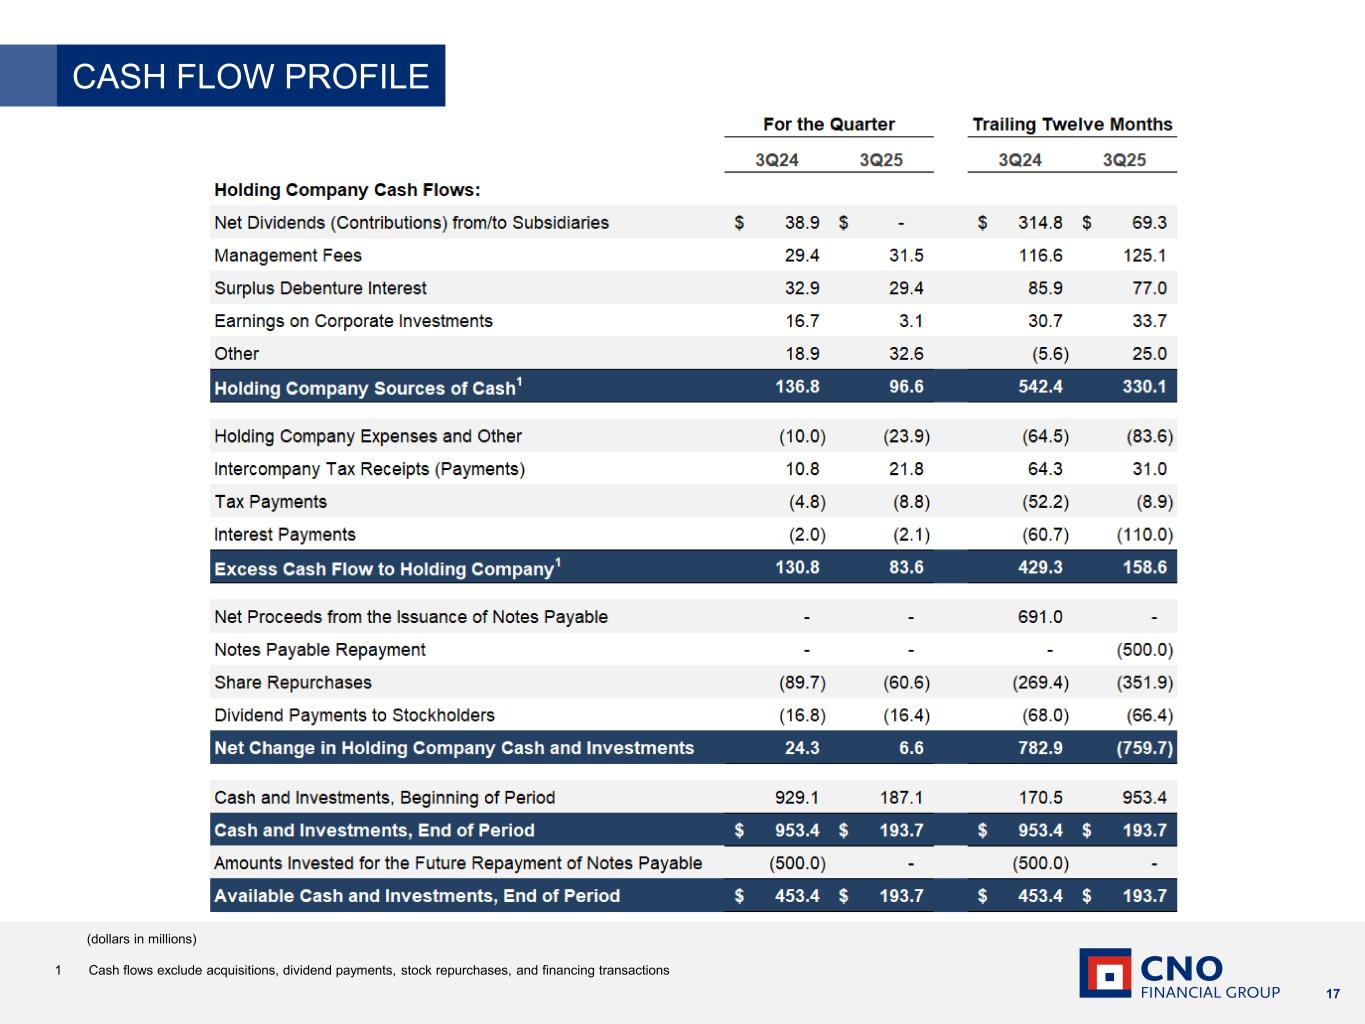
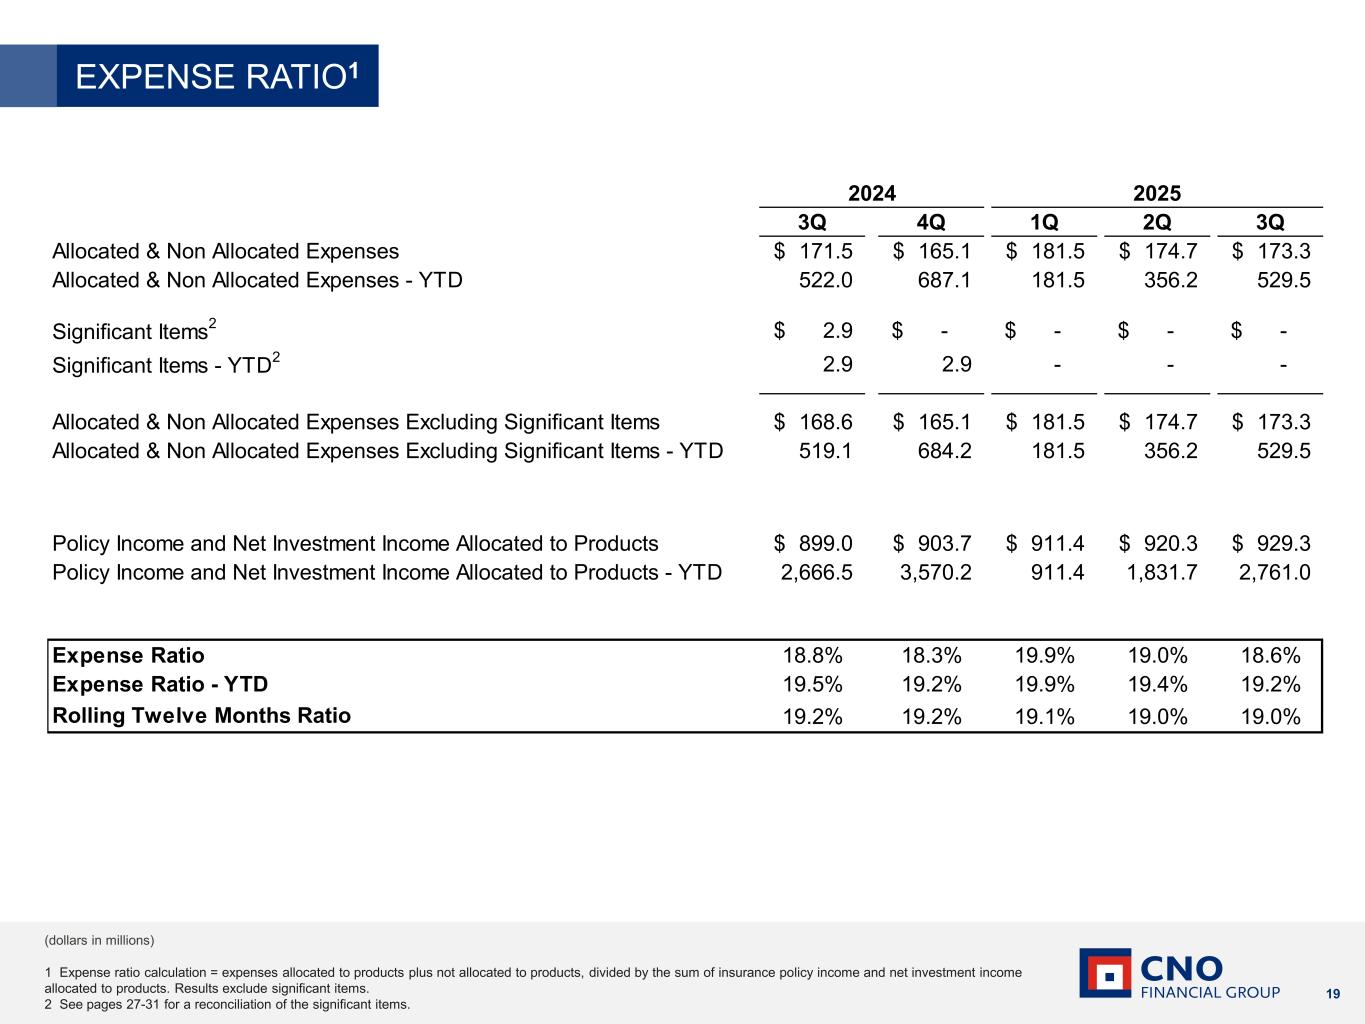
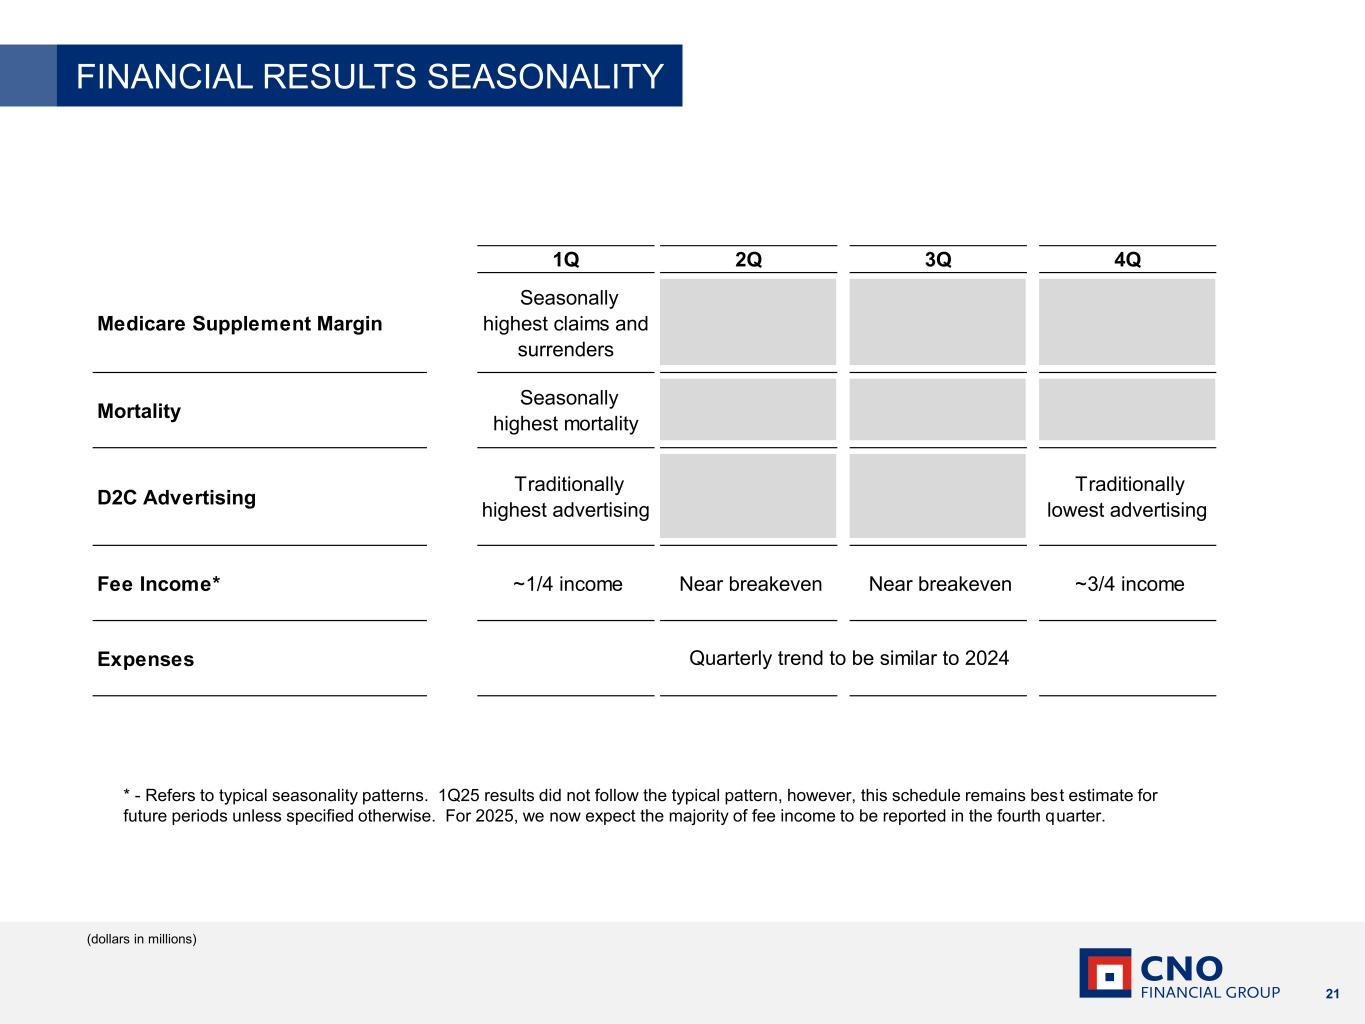
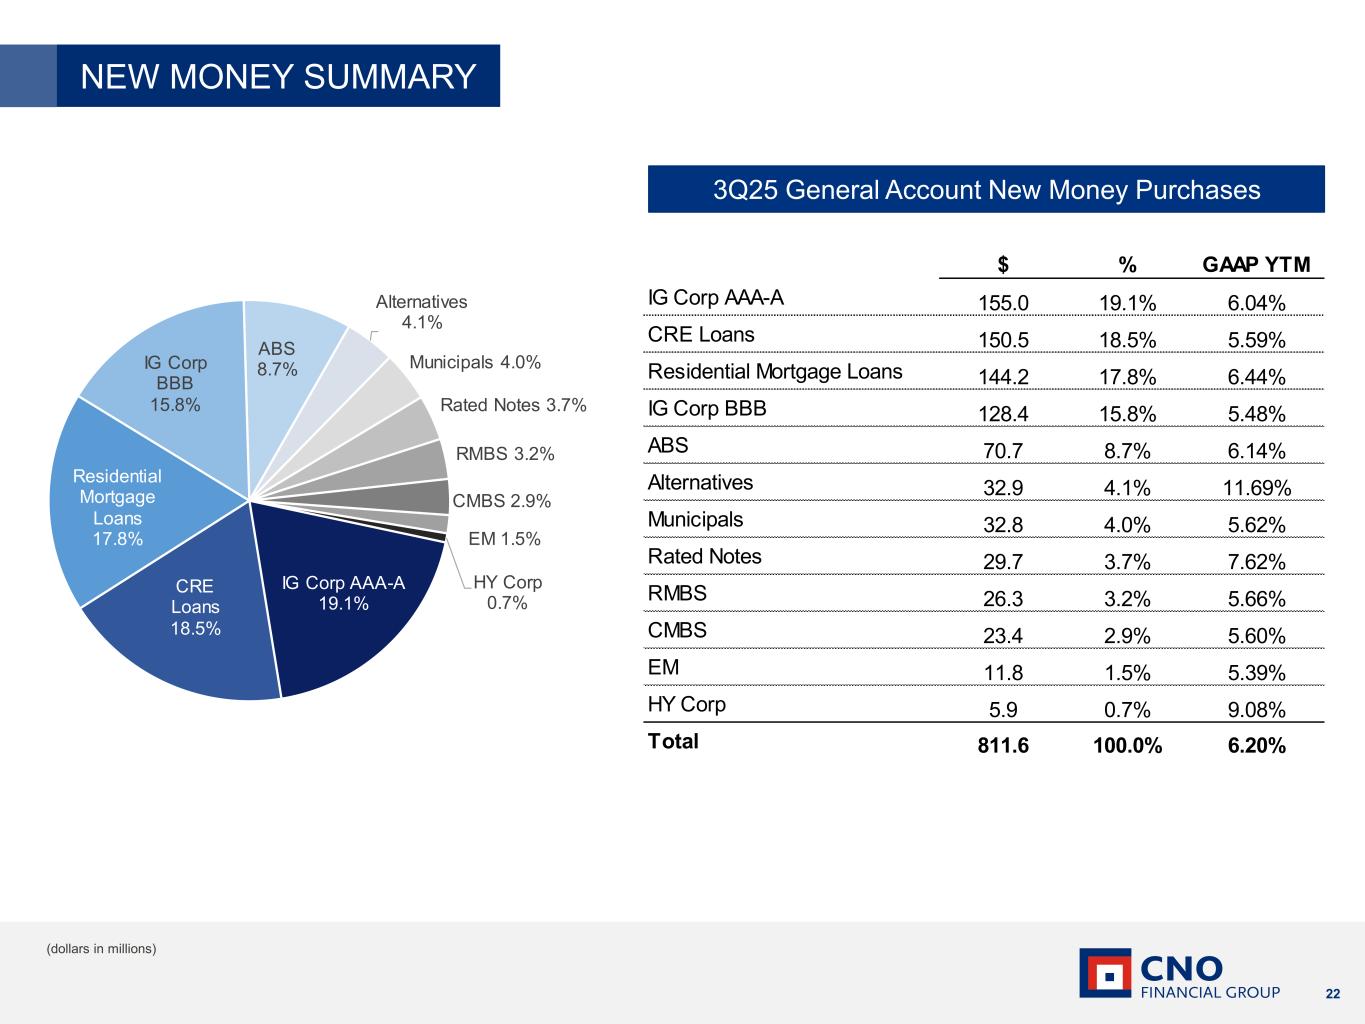
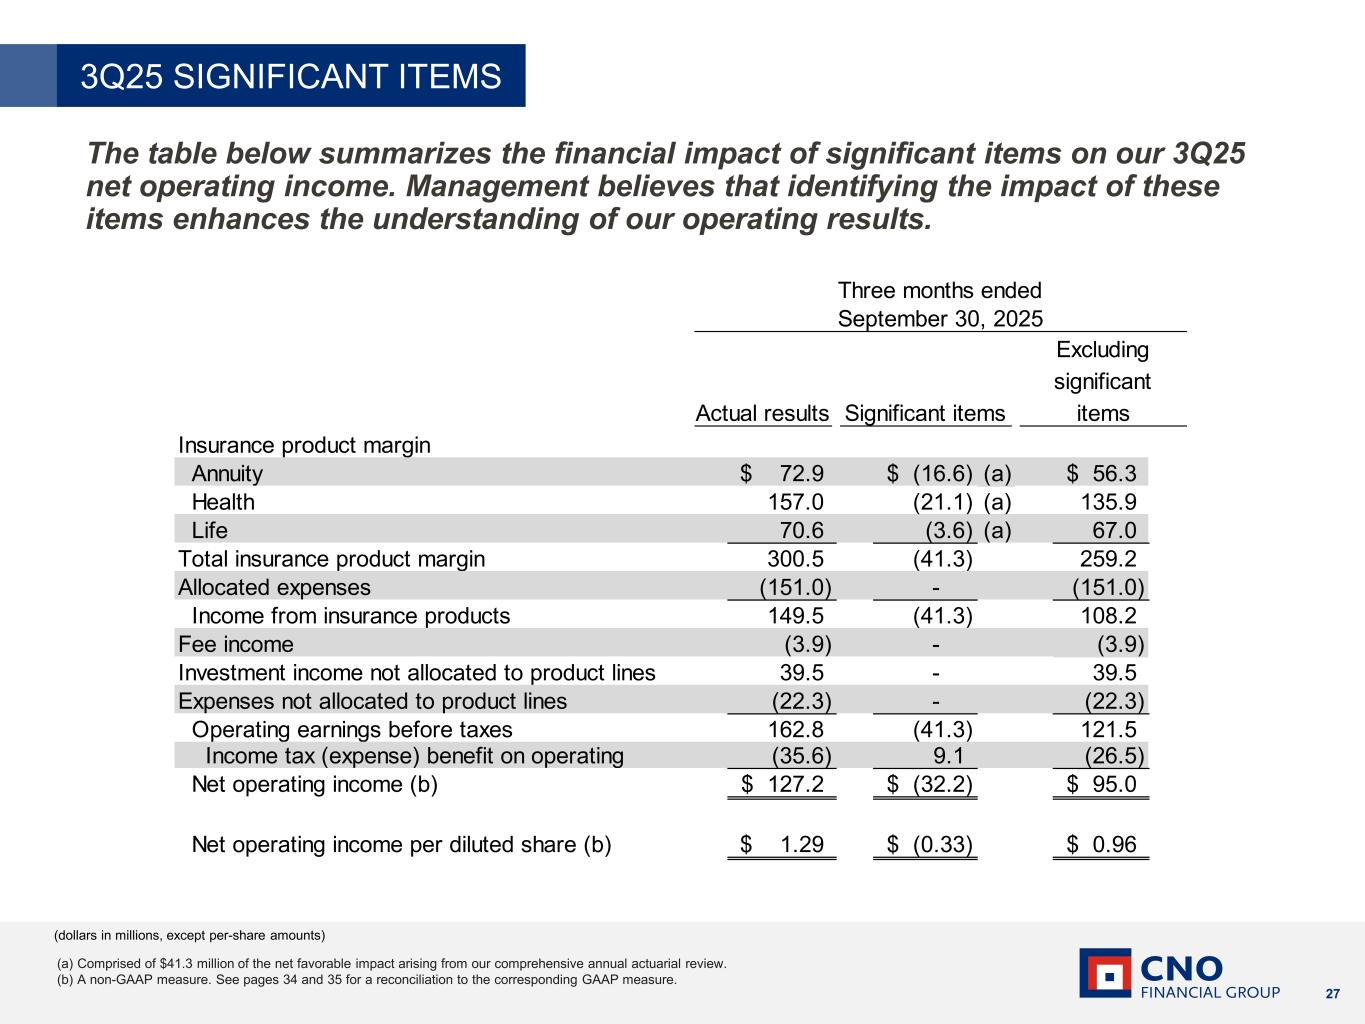
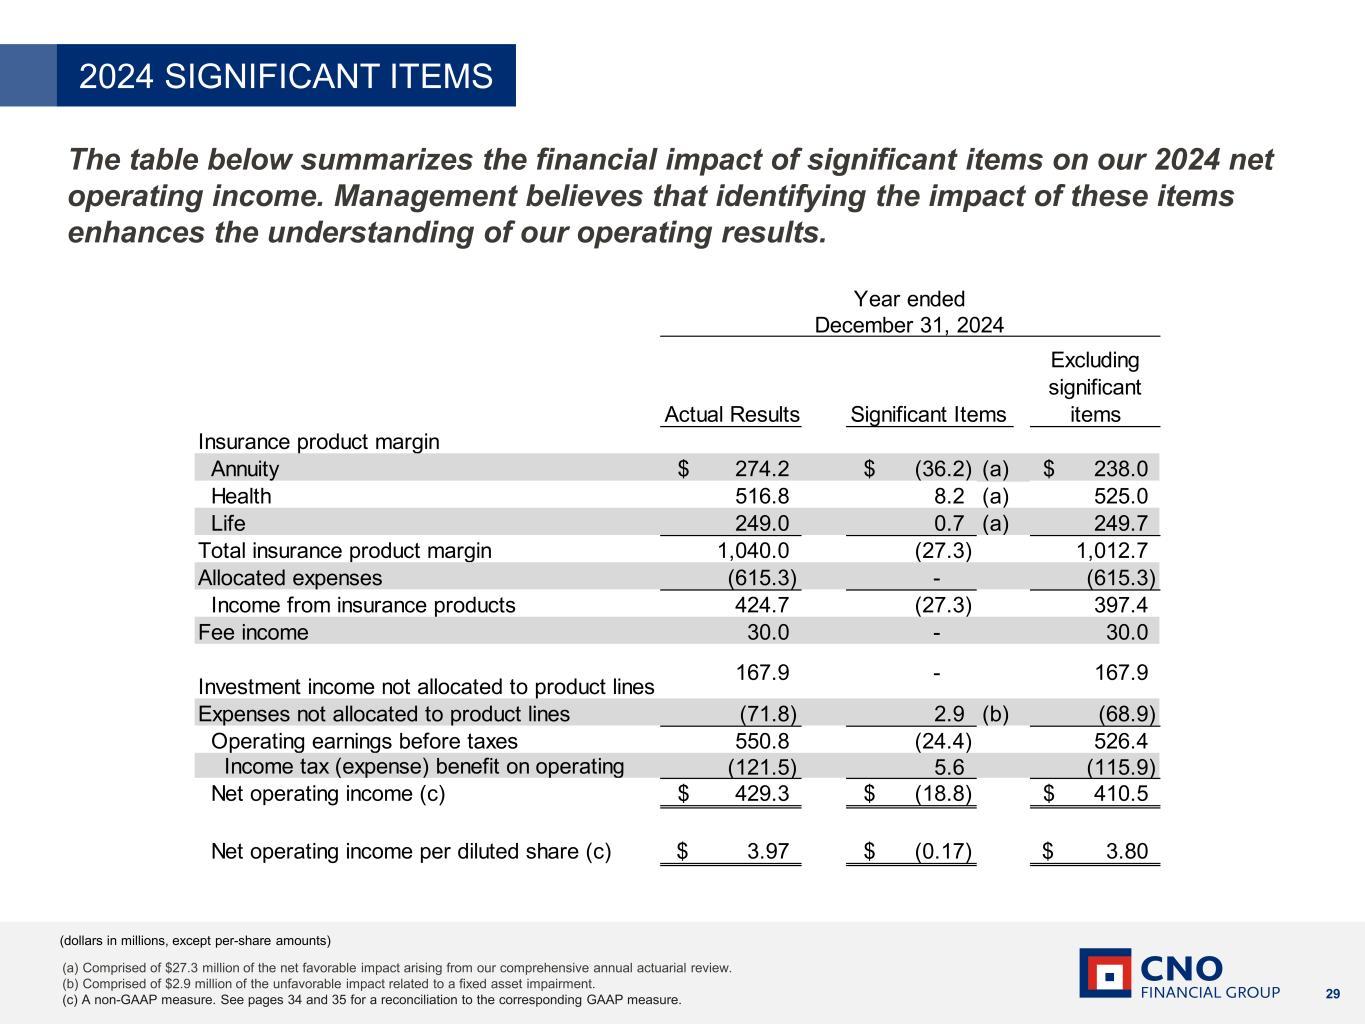
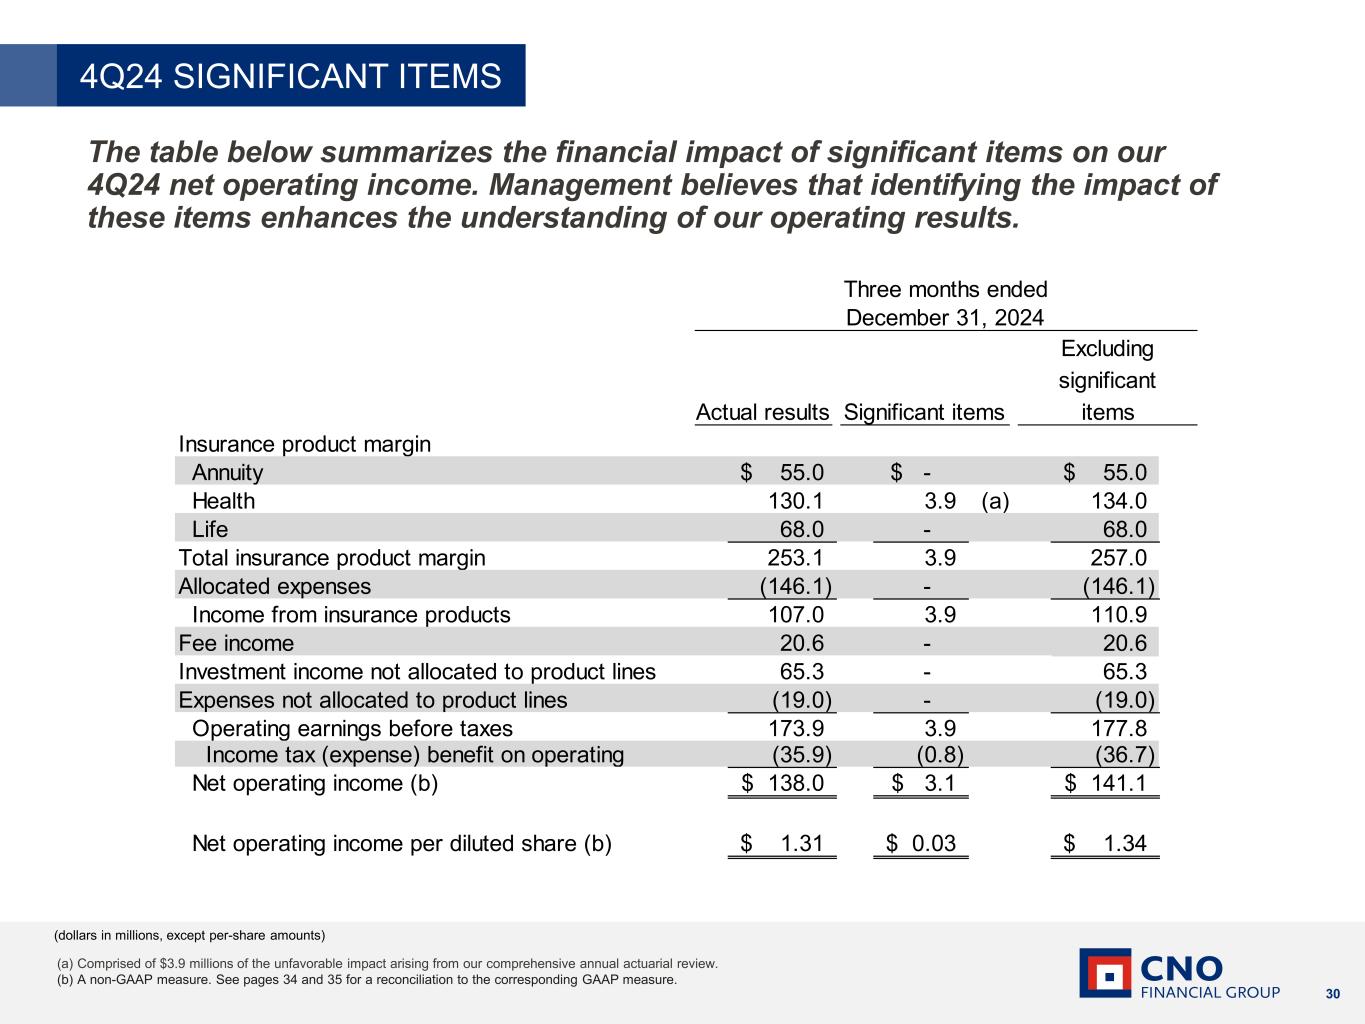
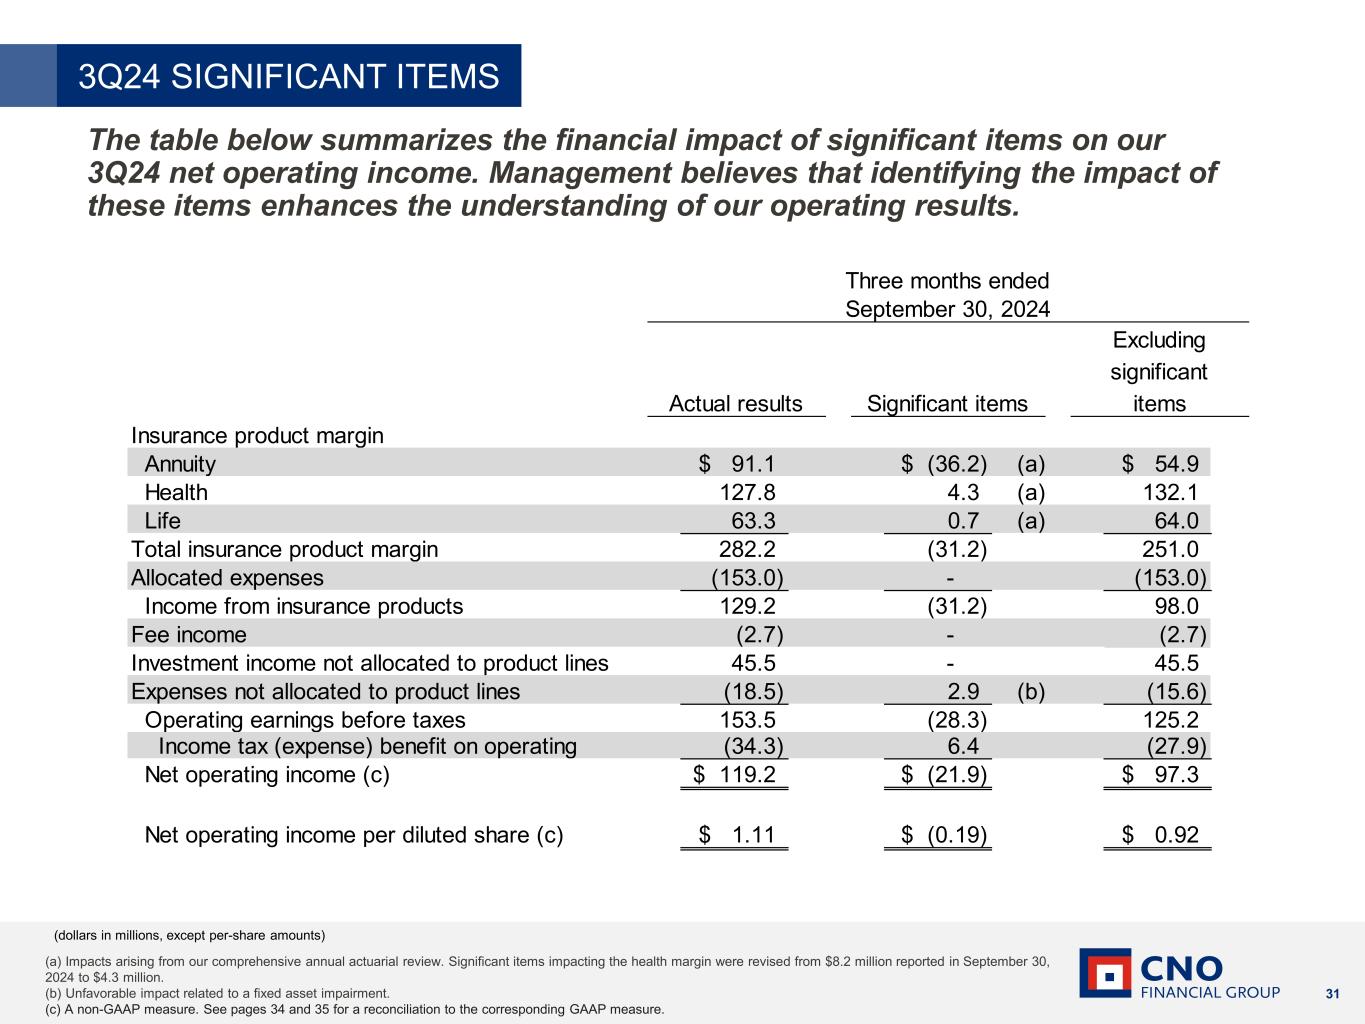
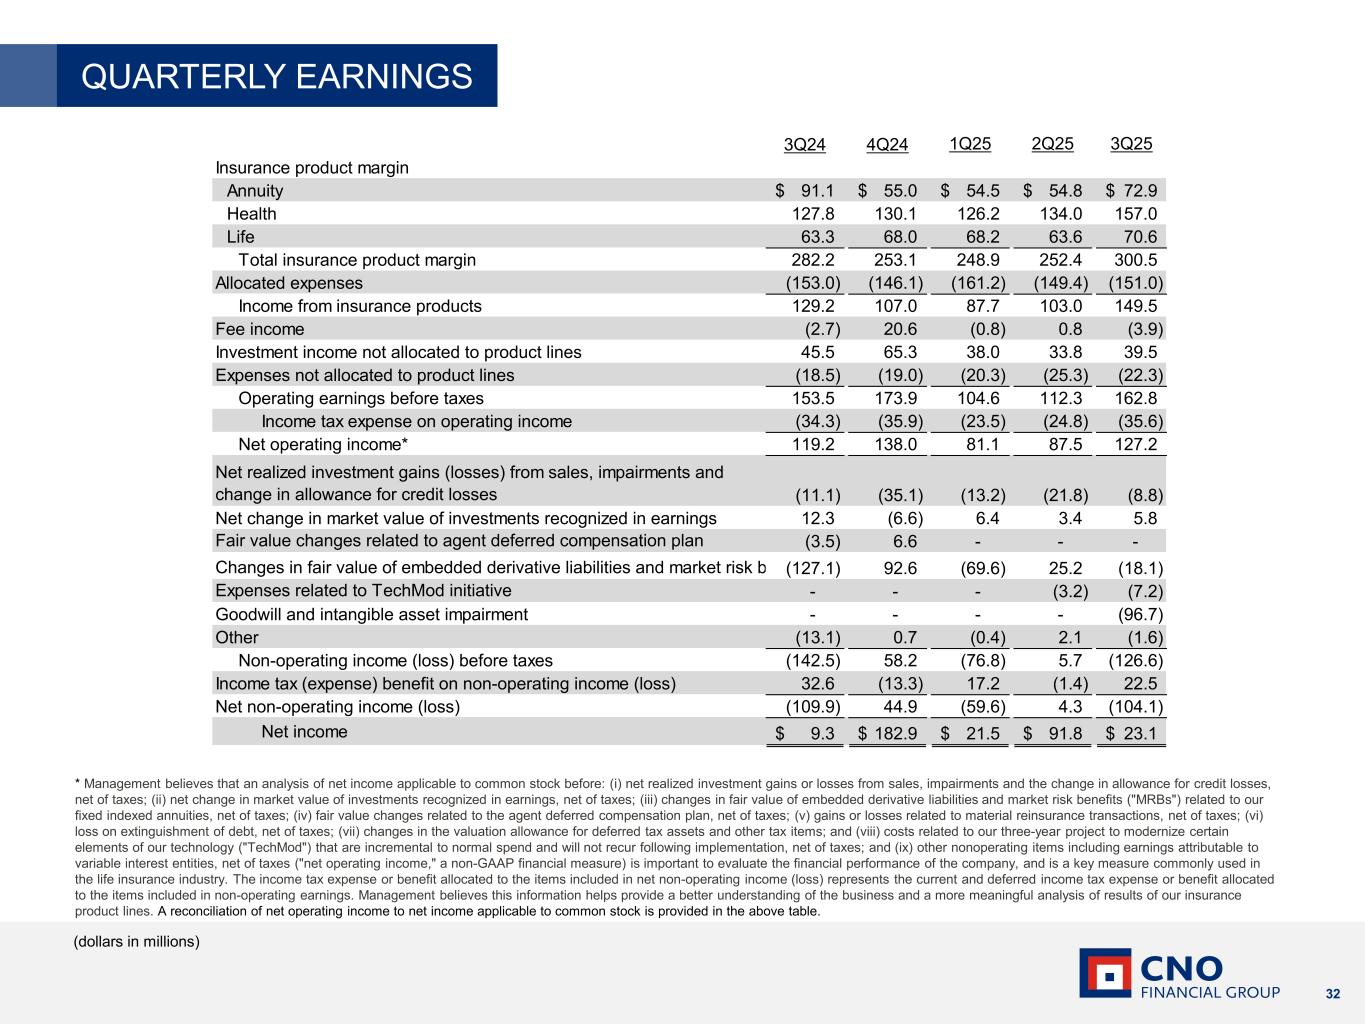
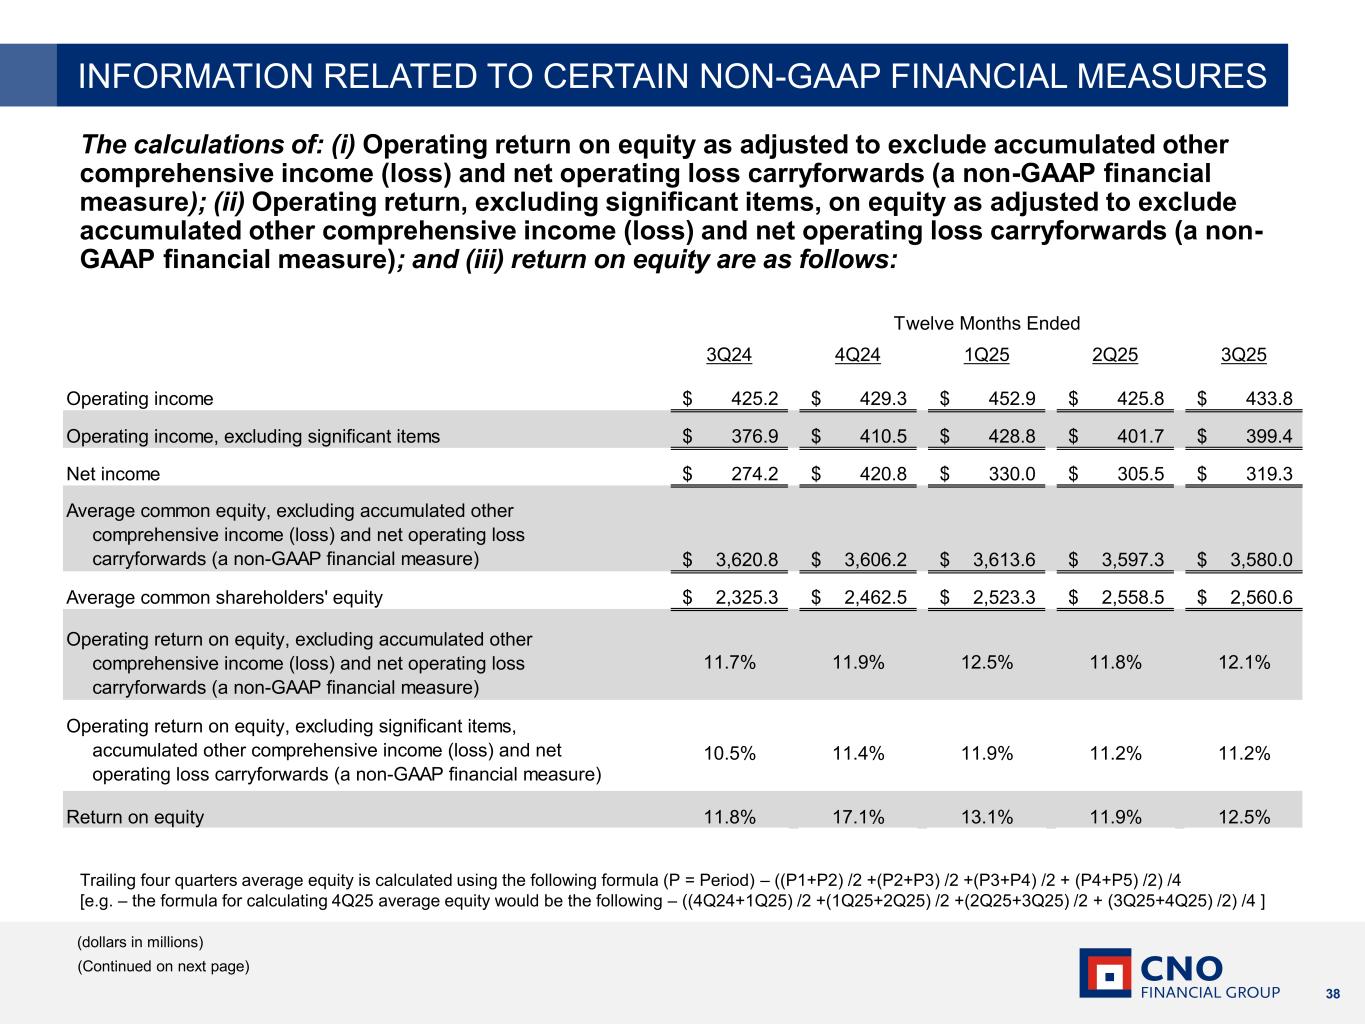
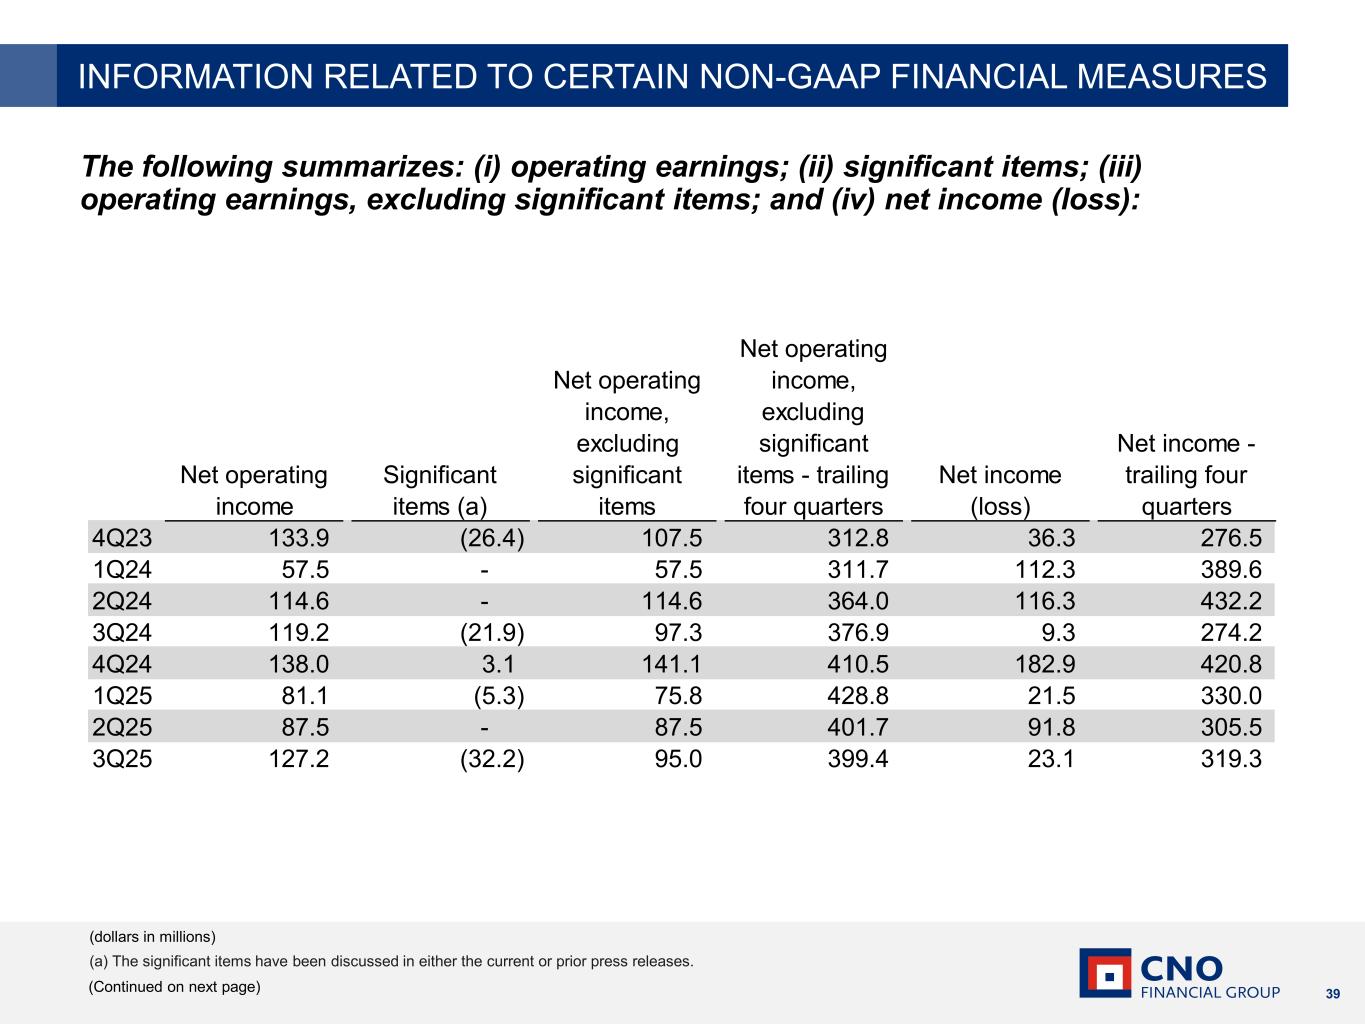
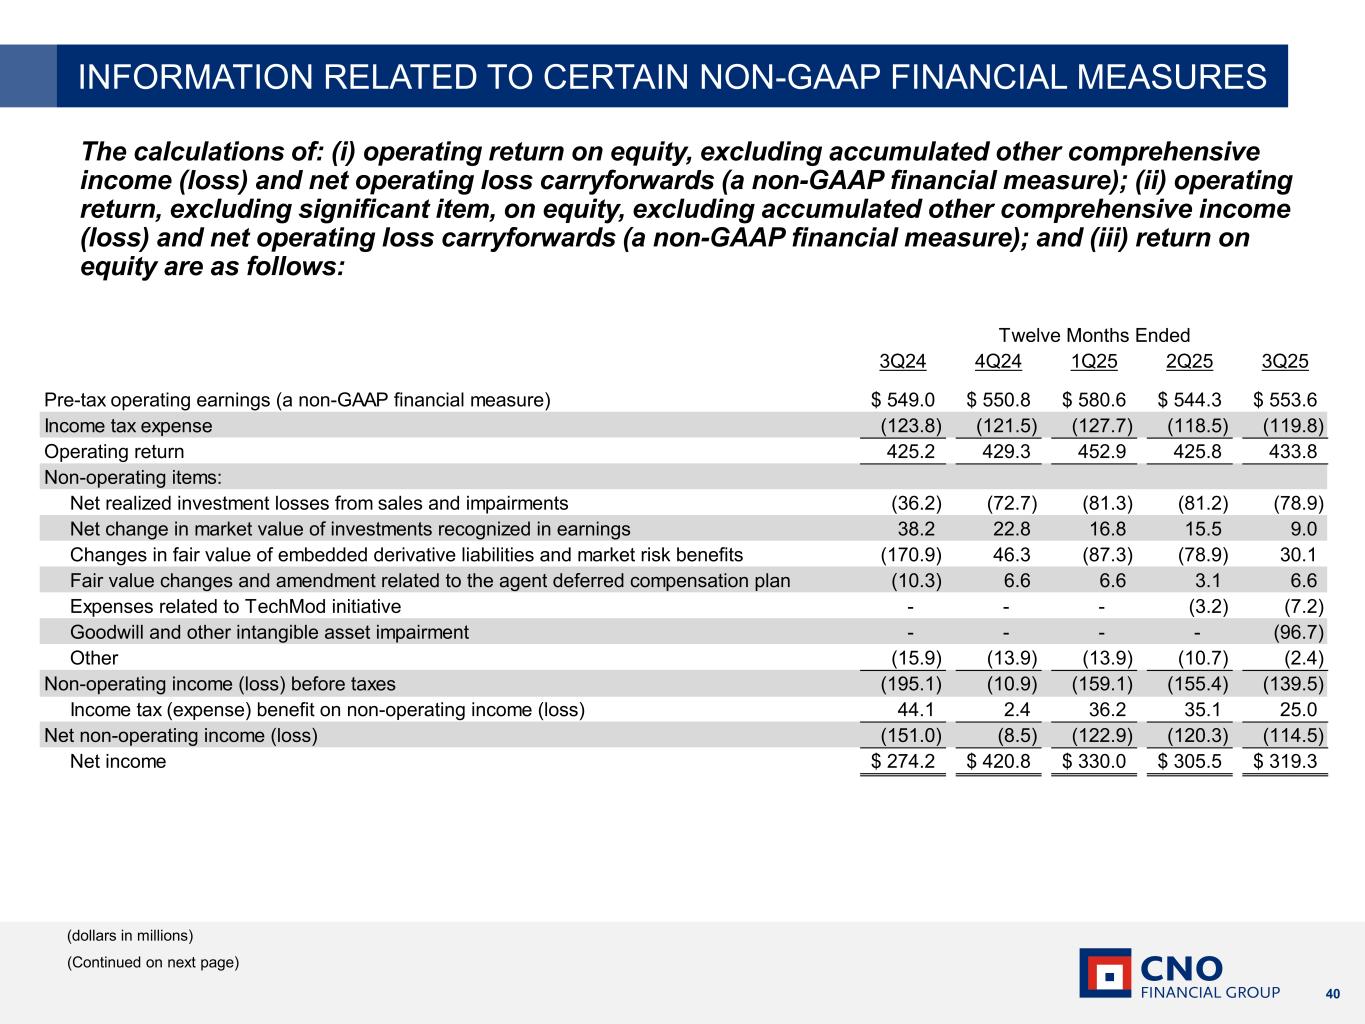
Thank you, Gary, and good morning, everyone. Before turning to my remarks on the quarter, I'd like to first comment on our second reinsurance treaty with our Bermuda affiliate. Effective October 1st, we have ceded approximately $1.8 billion to Supplemental Health U.S. statutory reserves, and we'll cede 50% of new Supplemental Health business from our Indiana domiciled Washington National Insurance Company to our Bermuda Reinsurance Company. We are proud to deepen our commitment to the Bermuda insurance community with this transaction. We are actively exploring additional transactions with our U.S. and Bermuda regulators, which in aggregate position us better to carry out our mission of serving middle-income consumers. Turning to the financial highlights on slide eight, we had another strong quarter across both operating earnings and capital, reflecting favorable trends in insurance product margins, investment income, and continued expense and capital discipline. The expense ratio was 18.6% in the quarter and 19.0% on a trailing 12-month basis. The income was modestly unfavorable to expectations due to underperformance in our worksite fee services business. We continue to manage to our capital and hold code liquidity targets while deploying $60 million in excess capital on share repurchases in the quarter. This contributed to an 8% reduction in weighted average diluted shares outstanding. On a trailing 12-month basis, operating return on equity was 12.1% and 11.2% excluding significant items. For the third quarter, we are recording an impairment of $96.7 million in non-operating income on the goodwill and intangibles associated with the acquisitions of web benefit design and direct path. This impairment reflects updated financial projections for the fee services side of our worksite business, considering recent performance and an increasingly competitive market. Additionally, as Gary previously discussed, in October we decided to exit the WorkSite Fee Services business. We anticipate that decision will result in charges estimated to be in the range of $15 to $20 million, which will also be reported in non-operating income. The timing of the exit charges will be primarily in the fourth quarter of 2025. We expect this exit decision, together with the new Bermuda Treaty, will improve operating return on equity starting in 4Q25, with the full effects emerging over the next five quarters through year-end 2026. The bulk of the ROE improvement relates to the exit of worksite fee services and stems from the elimination of pre-tax operating losses previously associated with the fee income segment, as well as the effects of the Q3 impairment and exit charges on shareholders' equity. I'll elaborate on the ROE impacts in a moment when I get to the guidance slide. Turning to slide nine, total insurance product margin was strong in the quarter. All major product categories were up year over year, reflecting growth in the business and mostly favorable underlying trends. In other annuities, the prior period results benefited from reserve releases due to higher mortality on larger closed block policies. AdSupp results reflect higher claims year over year, but improved results sequentially. Life margins reflect lower advertising spend in our traditional life business, partially offset by higher policy benefits in interest-sensitive life. Finally, our annual actuarial review resulted in a $41.3 million favorable impact to operating income. This was driven by net favorable assumption updates, including most notably favorable lapse rates in supplemental health and surrender rates in fixed index annuities, partially offset by unfavorable morbidity within Medicare Supplement. Consistent with past years, we're calling this out as a significant item in the quarter and presenting the margin on this slide X significant items. Turning to slide 10, we continue to deliver strong net investment income results. Q3 marks the 11th consecutive quarter the new money rate has exceeded 6% and the 8th consecutive quarter of growth in total net investment income. The average yield on allocated investments was 4.91%, up 10 basis points year over year. The increase in yield, along with growth in the business, drove a 7% increase in net investment income allocated to products for the quarter. Investment income not allocated to product results reflect alternative investment income results better year-over-year, though slightly below our long-term run rate expectations. Lower option forfeitures as a result of lower annuity surrenders and lower in-the-money options. and lower NII from general account assets as the robust capital return in the last four quarters has reduced excess capital. Our new investments in the quarter comprised approximately $812 million of assets with an average rating of single A and an average duration of six years. Our new investments are summarized in more detail on slide 22 of the presentation. Turning to slide 11, our high-quality and liquid portfolio is producing solid and consistent results. Approximately 97% of our fixed-maturity portfolio at quarter-end was investment-grade rated, with an average rating of single A, reflecting our up-in-quality bias over the last several years. Turning to slide 12, our capital position remains strong, with our primary capital and liquidity metrics in line with targets. Turning to slide 13 in our 2025 guidance, over the next five quarters, we anticipate the combined impact of the exit from the fee services business and the new Bermuda Treaty will lead to 50 basis points of incremental operating return on equity over and above our previous projections for the 2025 to 2027 period. So, we are revising our operating return on equity target for 2027 to an improvement of 200 basis points up from the prior target of 150 basis points versus a run rate of approximately 10% in 2024. We are narrowing our operating earnings per share range to 375 to 385 while maintaining the same midpoint. This adjustment reflects, among other things, an expense ratio of approximately 19 percent down from the prior range of between 19.0 and 19.2 percent, an effective tax rate between 22 and 22.5 percent compared to the prior estimate of approximately 23 percent, And fourth quarter fee income, approximately $2 million below 4Q24, reflecting lower fee income from our distribution of MedAdvantage products due to the shift towards Medicare supplement products and away from Medicare Advantage products that Gary touched on, and no impact from the results of the worksite fee services business, which we will include in non-operating income and getting in 4Q as we exit that business. We are raising our guidance for excess cash flow to the holding company to a range of $365 to $385 million, up from $200 to $250 million, which incorporates the impact of our new Bermuda reinsurance transaction. Finally, no change to our target capital, hold co-liquidity, and leverage targets. And with that, I'll turn it back to Gary.
Thanks, Paul. C&O delivered another strong quarter. Our performance continues to demonstrate the strength of our business model and our capabilities to generate consistent, repeatable results. We remain well-positioned to grow sales across both divisions, drive improved profitability, and, importantly, keep delivering on our promises to customers and stakeholders. We enter the fourth quarter with meaningful momentum, and we once again expect to end the year strong. Thank you to everyone who joined us in September for our C&O Investor Briefing on the Consumer Division. As a reminder, the webcast and materials from that session are available in the Investor Relations section of our website, cnoinc.com. We thank you for your support of and interest in C&O Financial Group. We will now open it up to questions. Operator?
Operator
Thank you very much. To ask a question, please press star followed by one on the telephone keypad now. If you change your mind, please press star followed by two. And preparing to ask your question, please ensure your device is unmuted locally. Our first question comes from Ryan Kruger from Keith, Britt, and Woods. Your line is open, Ryan. Please go ahead.
My first question was on the really strong D2C sales. Can you give us a little bit more color on, you know, how much the new partnerships are contributing and kind of how to think about those relative to the, to your, you know, your D2C volumes, excluding these newer partnerships?
Maybe I'll make some general comments and then I'll let Paul fill in some of the precise numbers and growth rates and so on in terms of what we disclose. As I mentioned in the prepared remarks, Ryan, we're very selective about who we work with. I'll give you an example. we believe there's a material opportunity in the Hispanic market. We don't think we're well positioned to tap that on our own, so we've partnered with somebody to help us with that. It's those types of things that we are partnering with folks on. It is in addition to what we're doing relative to shifting from our dependence on television advertising. We expect that growth to continue very nicely, as we did reference, because some of the growth in Q3 was due to a pull forward of some uh advertising expenses and so on by our partners we don't think the fourth quarter will be quite quite as strong but we we do believe we will continue to see good solid growth there paul do you want to backfill any of the numbers or percentage growth rates that we disclose good morning ryan consistent with our our general practice of not providing specific guidance i i won't provide any here but uh would just echo uh gary's comments directionally in terms of what you should expect and then just a quick one is the current roughly 20 million annual earnings
loss from the services business does that flow through the fee income line from a reporting standpoint it does it's always been part of the fee income segment and so you should see that segment all else equal improve on an annualized basis by about 20 million dollars okay got it Thank you.
Operator
Our next question comes from John Barnage from Piper Sandler. Our line is open, John. Please go ahead.
Thanks for the opportunity. Good morning. How do you view the opportunity, just kind of following up on the comments about actively exploring additional transactions, the total addressable market for remaining health, life, and long-term care liabilities that could be available to Bermuda?
Hey, John. I'll take a first crack at that. So the question is, you know, how much more might we cede to Bermuda? I won't give you a specific quantitative answer, but I will say that we are looking at opportunities to seed additional business. We are looking at life in particular, which we think which has some benefit, including some other things, the diversification across products. As you know, we currently have FIAs. Now we have self-seeding. Some life reserves would increase the diversification. We continue to actively explore additional transactions with our U.S. and Bermuda regulators. And I would just emphasize, you know, the comment we made in our prepared remarks, which is that in aggregate, the Bermuda platform positions us better to carry out our mission of serving more middle-income consumers in what are very often underserved markets.
Thank you for that answer, Paul. And my follow-up, once direct path and web benefits design fully wrapped up in the first half of 26, does it seem reasonable that the direct expense ratio should fall, given that that wasn't necessarily a profitable business? Thank you.
So, John, the $20 million annualized impact is really all in, including the expenses that were attached to that business. So that's really the expectation at a high level that you should see flow through in the wake of exiting that business.
Operator
Our next question comes from Joel Hurwitz from Dowling and Partners. What on is open, Joel? Please go ahead.
Hey, good morning. Paul, on the assumption review, Any ongoing earnings benefits from the updates and any statutory impacts?
Sure. So on a GAAP basis, the only go-forward impact that's notable is in sub-health, that $2 million quarterly. And then on a stat basis, I'll invite Jeremy to weigh in, our chief actuary.
Jeremy
Analyst — Chief Actuary
Yeah, thanks, Paul. No, there's no statutory impacts related to any of the unlocking.
Okay, got it. And then just two quick ones on the fee service exit. One, how much of your worksite insurance business is linked to these platforms that you're shutting down? And then in terms of that $20 million of a gap loss, is that equivalent to sort of, you know, what the cash impact was from those businesses?
Yeah, I'll take the first question. Joel. We don't expect any material adverse impact to our worksite insurance sales. I would point out, indeed, that's part of the reason we're exiting this business. It just hasn't delivered enough cross-selling and support and so on. We've been able to grow the insurance business and expect to continue to grow the insurance business without the support or the cross-sell of the fee business. So we expect minimal impact to the insurance sales and worksite. Paul?
Yeah, so the second part of your question, Joel, I think is, you know, is the $20 million pre-tax gap earnings a reasonable proxy for cash flow? And just thinking out loud, honestly, that I haven't thought of this specific question, but I think there aren't any, you know, significant delays in the cash impacts as opposed to the gap accruals. So I think so, Joel. Thanks, guys.
Operator
Our next question comes from Wilma Burdis from Raymond James. Your line is open, Wilma. Please go ahead.
Hey, good morning. Is there any way you could help us think a little bit more through the Ford cash benefit or impact? I'm writing some of the supplemental health business. And maybe if you can talk about, I know that relates to a specific sub, but just give a little bit more detail there on the portion of that business that will be going through Wilma, you were breaking up quite a bit there.
I'm not sure I got your question. I think you're asking about the go-forward impacts of the sub-health assumption update.
Yeah, yeah, on cash. Thank you.
On cash, okay. Jeremy, do you want to take that one?
Jeremy
Analyst — Chief Actuary
Sure. So certainly, I mean, on a cash basis with the movement of the new business, the flow piece. There's certainly some reduction in strain there. Don't know the exact numbers specific to that, but certainly you would see some reduction in strain and some additional cash flows related to that.
Okay. Thank you. And then can you guys hear me?
Yeah, I can hear you, Will. You're just breaking up a little bit. If you want to.
Breaking up a little bit. Sorry. Along the lines to my, similar lines to my first question is the 20 million freed up from the fee services business is that going to also be a cash impact i guess what i'm trying to get out here is just maybe help us think a little bit about the ford cash benefits from these two actions thanks got it yeah so similar to joel's previous question i i think that certainly the expenses supporting the fee services business are you know real-time cash.
And on the revenue side, you know, there aren't material deltas between the cash flow and the gap rules. So I think the simple answer to your question, Wilma, is yes.
Operator
Good. Thank you. Our next question comes from Jack Matten from BMO. The line is open, Jack.
Please go ahead. good morning i might add one more on the bermuda transaction and more around the uses of the additional cash flow you're seeing this year something you're kind of playing the earmark for shareholder returns next year or are there incremental i guess investments in the business and growth or capabilities that you're planning to make sure so jack you clearly um will have elevated uh cash at the holdco in the fourth quarter in the wake of of their new bermuda treaty and we will nevertheless be measured in our level of share repurchases as we continue to invest in sales growth and in the previously announced three-year tech modernization project we view these to be an attractive strategic trade-off as both will contribute over time to earnings growth and improved return on equity. Directionally, I would say that you should view our 3Q25 share repurchase levels as more indicative of go-forward levels than the more elevated levels that we had in 4Q of last year and the first half of this year.
Absent, of course, more compelling uses of that capital, we haven't changed in any way how we think about deploying excess capital uh will put it to the best and highest use in practice that has and will likely continue to translate to some level of share repurchase activity got it thank you and um on the revised um or raised roe target just just in the cadence of that i guess should we think about the i guess more of a step up next year since a big driver is just the the divestiture of the the business and then maybe a smaller step in 2027. I guess any other kind of things we should think about regarding the just the cadence of the ROE uplift?
Yeah, that's the right way to think about it, Jack. You know, initially we said expect 150 basis points of 25 to 27 off of a run rate of approximately 10% to 24. And we said including 50 basis points in 2025, you know, we're on track to deliver that. The benefit from the exit of fee services together with the second Bermuda treaty will begin to emerge in the fourth quarter, but won't really have a material impact until we begin to move through 2026. So yes, the incremental 50 bits is really in the 26-27 period.
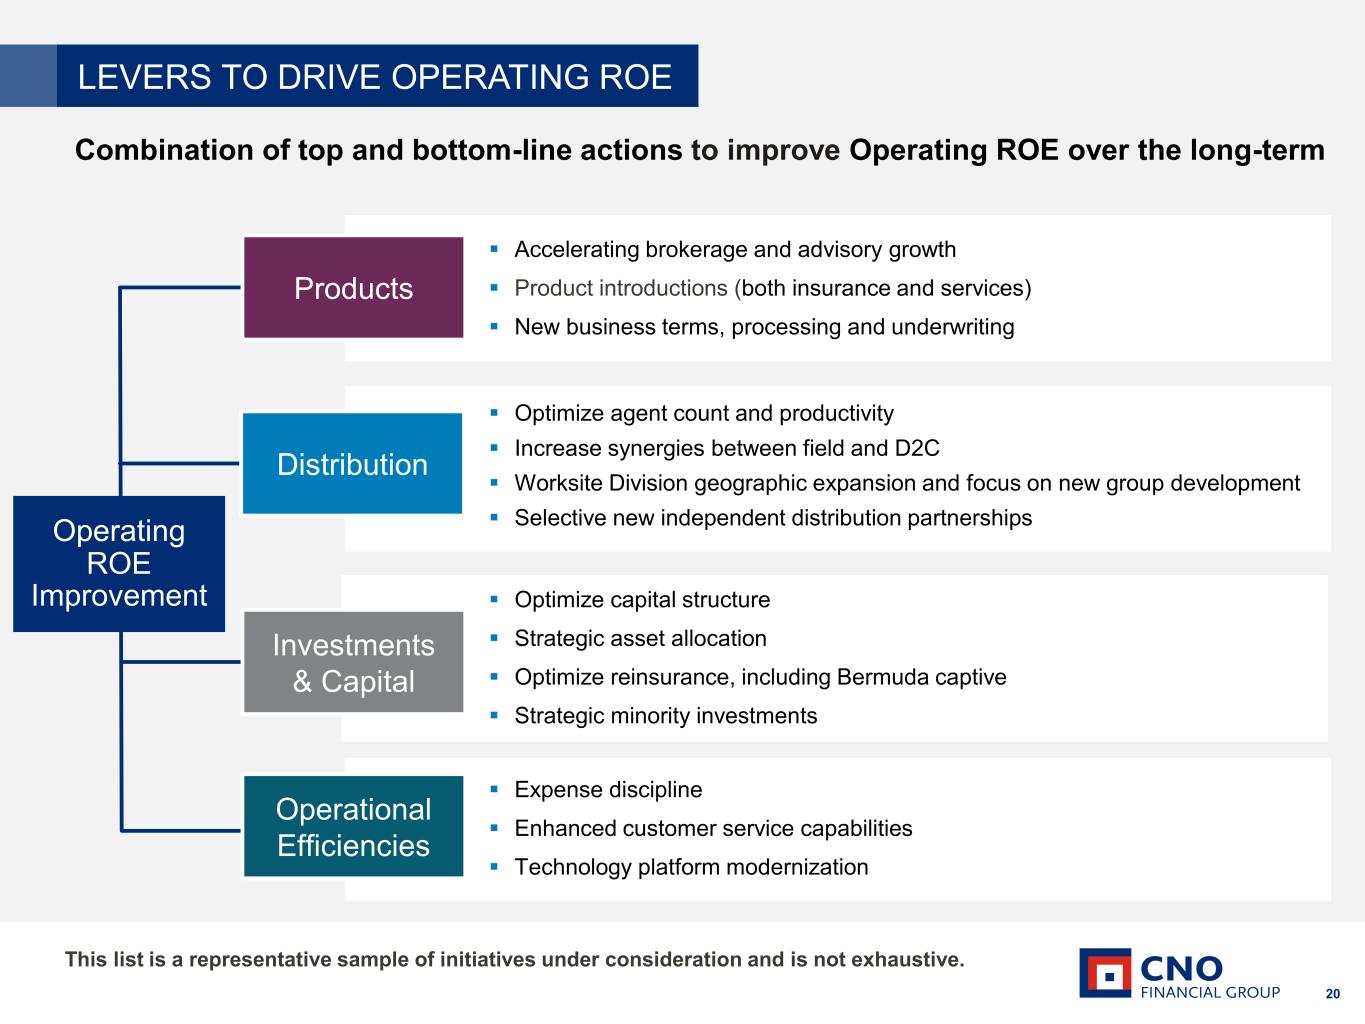
Hey, Jack and Paul, I'd just like to add one other perspective on that. I think it's important to note that even when we hit that 12% ROE, that is not a stopping We have to continue to improve. Right now, we've made public commitments to our shareholders about things we have line of sight for. But I want to emphasize, even when we get there, and hopefully we get there sooner and we're able to, again, increase the target and again talk about, you know, instead of 27, talk about 28, 29, we have to continue to improve. So this team is geared around continuing to look for ways to improve. It's just at the moment, we're only willing to commit to things we have line of sight for. But you should not interpret that as accepting that number at the stopping point. it's anything but it's nothing more than a waypoint we have to continue to get better and so we're constantly looking for things and if we're lucky if we're good and we're lucky we'll be able to say something about that before 2027 and increase that target again that is our goal thank you as a reminder to ask a question please press star followed by one on your telephone keypad our next question comes from joseph joseph from alero and jeffries your line is open joseph Please go ahead.
Operator
Joseph, your line is open.
Operator, we're not hearing anything. I don't know if you can hear something, but we cannot.
Operator
No, I don't believe Joseph is there.
We can skip to the next question, Operator.
Operator
No problem at all. Our next question comes from Jack Matten from BMO. Your line is open, Jack. Please go ahead.
Hey, thanks for taking the follow-up. Just one more on the Medicare supplement business. I guess you talked about what you're seeing regarding claims trends and what drove the assumption review impact this quarter. I think in the last quarter, you talked about expecting a 10% average rate increase in your filings moving into next year. Is that still roughly your expectation?
Hey, Jack. Yes, so the annual actual assumption update did incorporate the trends that we've seen. So no real surprise there and no real change in those trends. um and uh you know as you've pointed out we have the opportunity each year to uh to you know address uh claim trends with uh with pricing um and trying to get to that information so let me circle back on that uh once i put my finger on it yeah this is jeremy i'll go ahead and jump in yeah we're certainly we we've certainly filed uh something around the neighborhood of the 10 and expect to get something in that realm so you're correct thank you thank you jeremy on next question
comes from joseph from jeffreys gone is open joseph please go ahead hey it's uh sunique comments from jeffreys i think we might have an issue with me using his his passcode can you hear me Yes, I see that we can hear you. Okay, perfect. Sorry about that. My first question, just acknowledging the strong NAP in consumer. You know, we did notice that the producing agent count was sort of flattish, maybe up just a little less than a percent. And I guess I'm just curious if we're running into sort of a tough comps issue there, and if that continues, does that start to put some pressure on the consumer NAP, or are you going to be able to continue to grow as you have been?
Sunny, this is Gary. We expect to continue to grow. You are correct that the comps are getting tougher, but we do continue to expect to grow. Conventional wisdom has always held that as employment market softens, more people are interested in trying out a commission-only career. So we expect that to start to help us in coming quarters based on what we're seeing. We also like the results we're getting from a number of our efforts to bring agents in. All of that said, Sidney, if you force me to pick, you know, I've been consistent about this for a few years, I'm still way more focused on productivity. Productivity is way more important than agent count. So ideally we try and do both, but if I had to prioritize, I'd prioritize productivity and that continues to move nicely.
Got it. Okay. And then I guess on the impairments, you know, I know the numbers aren't huge, but, you know, you did reference that you've invested in these businesses and now are exiting them. Does this episode make you think differently about, you know, inorganic growth as a use of capital? Or do you just kind of feel like this one kind of got away from you and you're going to continue to look for inorganic opportunities? Thanks.
This is Gary against me. Let me, I guess, be plain spoken about it. There are clearly some lessons we need to take from this. So I want to make sure that you and our shareholders do not think that we are simply saying this is just one that got away. We have to get better. We have to learn from this. And the responsibility for that is mine, so that it doesn't sound like we're making excuses or anything like that. So this definitely is causing us to rethink how we want to handle acquisitions. We'll be presenting a pretty detailed analysis to our board about lessons learned, so we're taking this very seriously. It will definitely impact the way we move forward. All that said, I do want to make sure that our shareholders also don't lose sight of some of the things that have gone really well. I mean, we've got minority stakes we've taken and partners like Tannenbaum and Rialto and Victory Park and so on that have done very, very well for us. So there are some good skills here, some people that have done some really good work. There are some lessons that need to be learned from these particular investments, and you can rest assured we're taking that very seriously. And it will definitely give me pause as we think about other inorganic opportunities. There's no question about that.
That's good to hear. if i could sneak one more in just on the bermuda should we be thinking about sort of the cadence of you guys thinking about um reinsuring enforced business as maybe one one deal a year and that's kind of what you're shooting for is that a reasonable way to think about it i i think that's reasonable yeah i i i don't think it would be reasonable to expect that we would do more than that.
And at some point with our existing book, other than new business, we'll probably hit the right amount of enforced reserves that are seeded. There is a balance and it's certainly not 100% seeded to Bermuda. So we're not there yet, but at some point we would reach that sort of right right balance but for the time being yes as we mentioned we're exploring an additional business that we might see to bermuda okay that makes sense thanks guys thank you we currently have no further questions so i'd like to hand back to adam for some closing remarks thank you operator thank you all for participating in today's call if you have any further questions please reach out the investor relations team have a great rest of your day
Operator
This concludes today's call. We thank everyone for joining. You may now disconnect your lines.