Speaker 0
Good morning, and welcome. Thank you for joining us for Aflac Incorporated's Third Quarter 2025 Earnings Call. This morning, Dan Amos, Chairman and CEO of Aflac Incorporated, will provide an overview of our results and operations in Japan and the United States. Then Max Broden, Senior Executive Vice President and CFO of Aflac Incorporated, will provide more detail on our financial results for the quarter, current capital and liquidity. These topics are also addressed in the materials we posted with our earnings release, financial supplement and quarterly CFO update on our investors.aflac.com. For Q&A today, we are joined by Virgil Miller, President of Aflac Incorporated and Aflac U.S.; Charles Lake, Chairman and Representative Director, President of Aflac International; Masatoshi Koide, President and Representative Director, Aflac Life Insurance Japan; and Brad Dyslin, Global Chief Investment Officer, President of Aflac Global Investments. Before we begin, some statements in this teleconference are forward-looking within the meaning of federal securities laws. Although we believe these statements are reasonable, we can give no assurance that they will prove to be accurate because they are prospective in nature. Actual results could differ materially from those we discuss today. We encourage you to look at our annual report on Form 10-K for some of the various risk factors that could materially impact our results. As I mentioned earlier, the earnings release with reconciliations of certain non-U.S. GAAP measures and related earnings materials are available on investors.aflac.com. I'll now hand the call over to Dan.
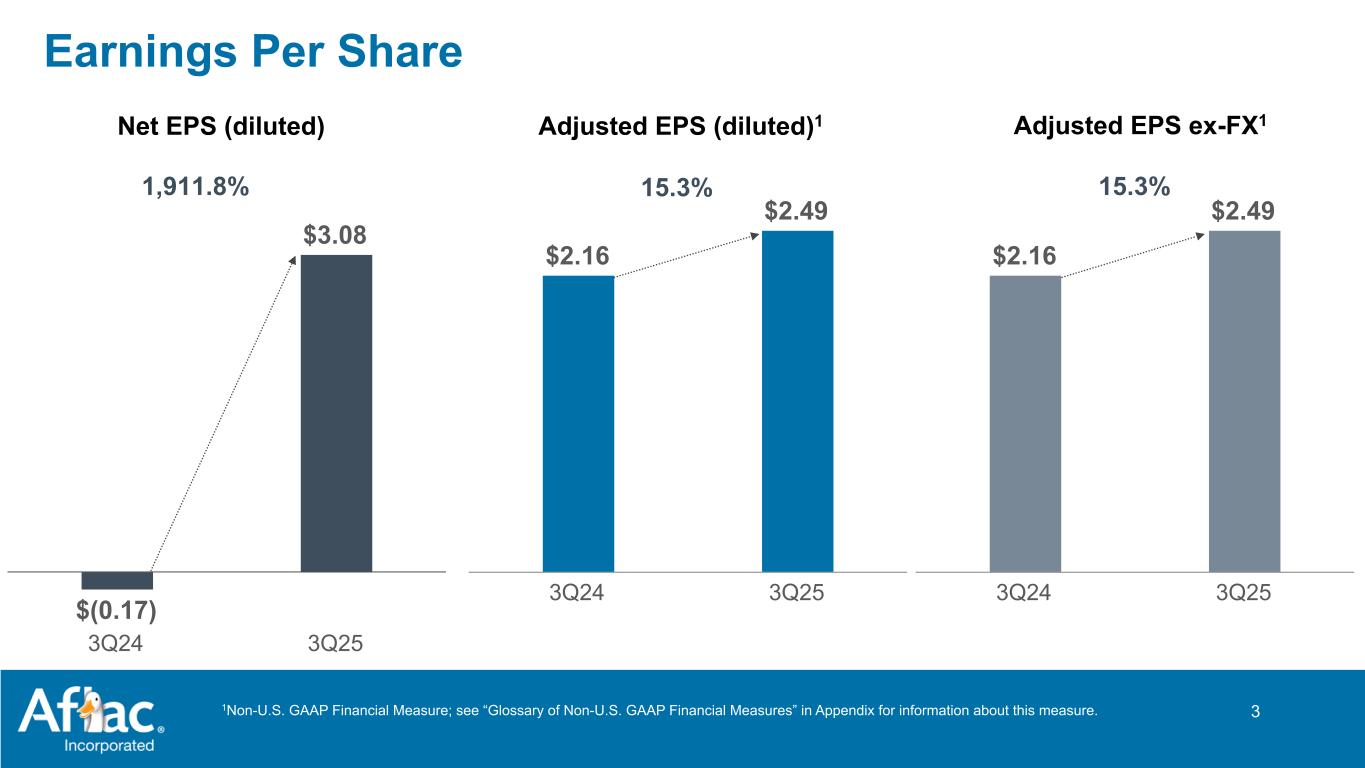
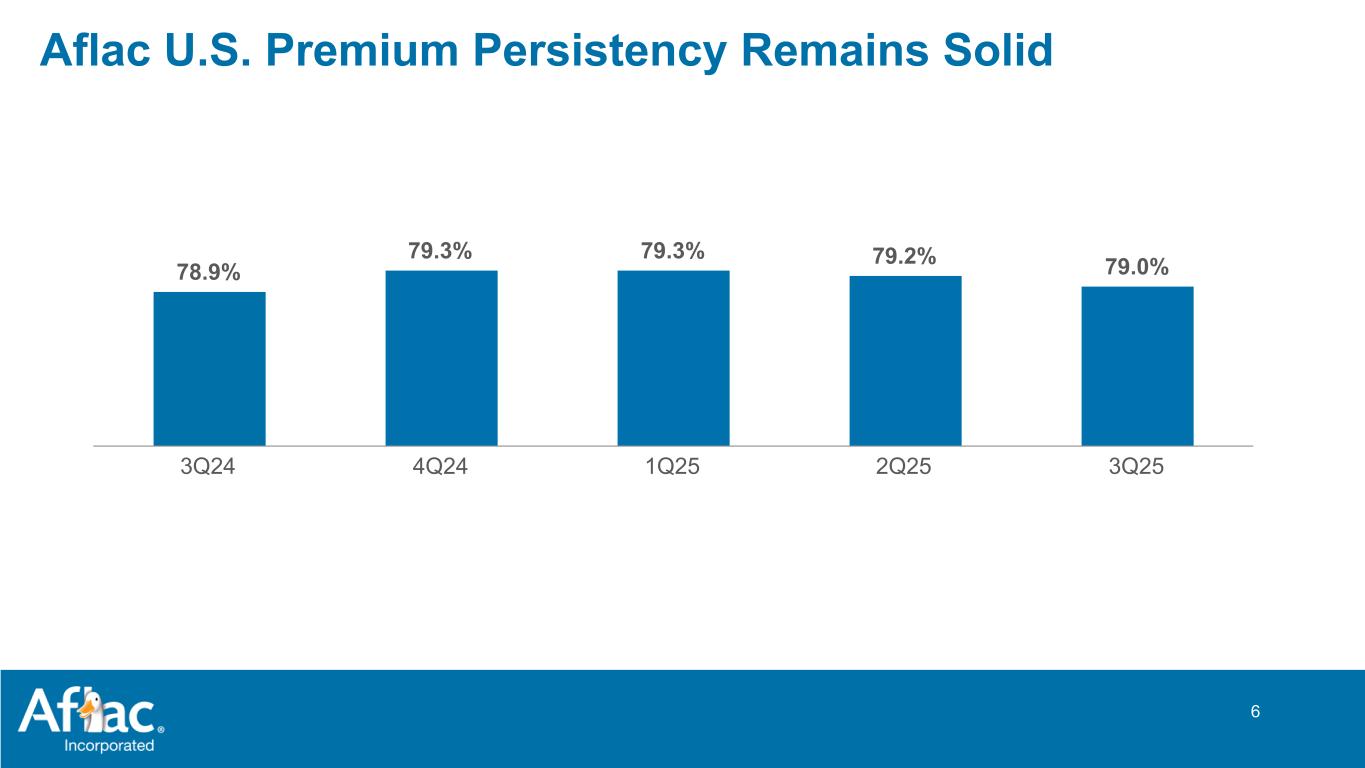
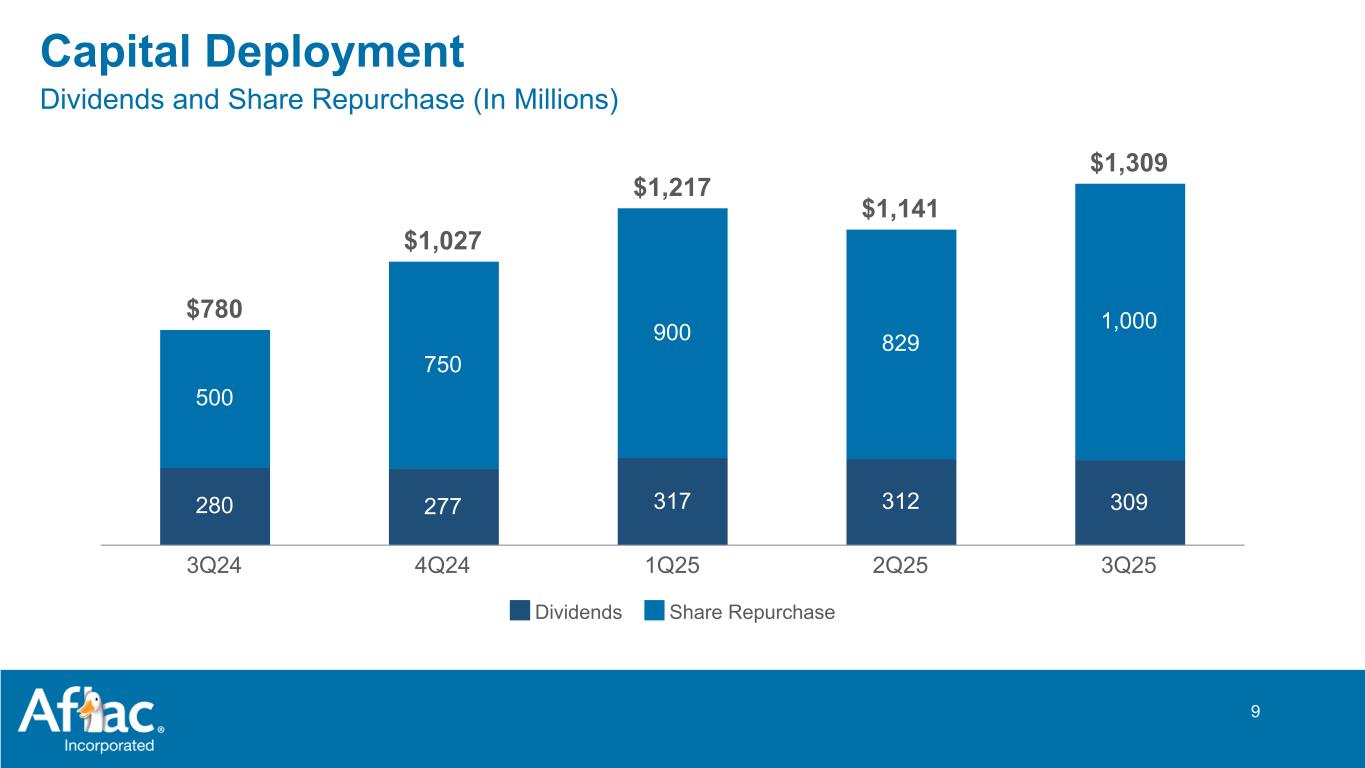
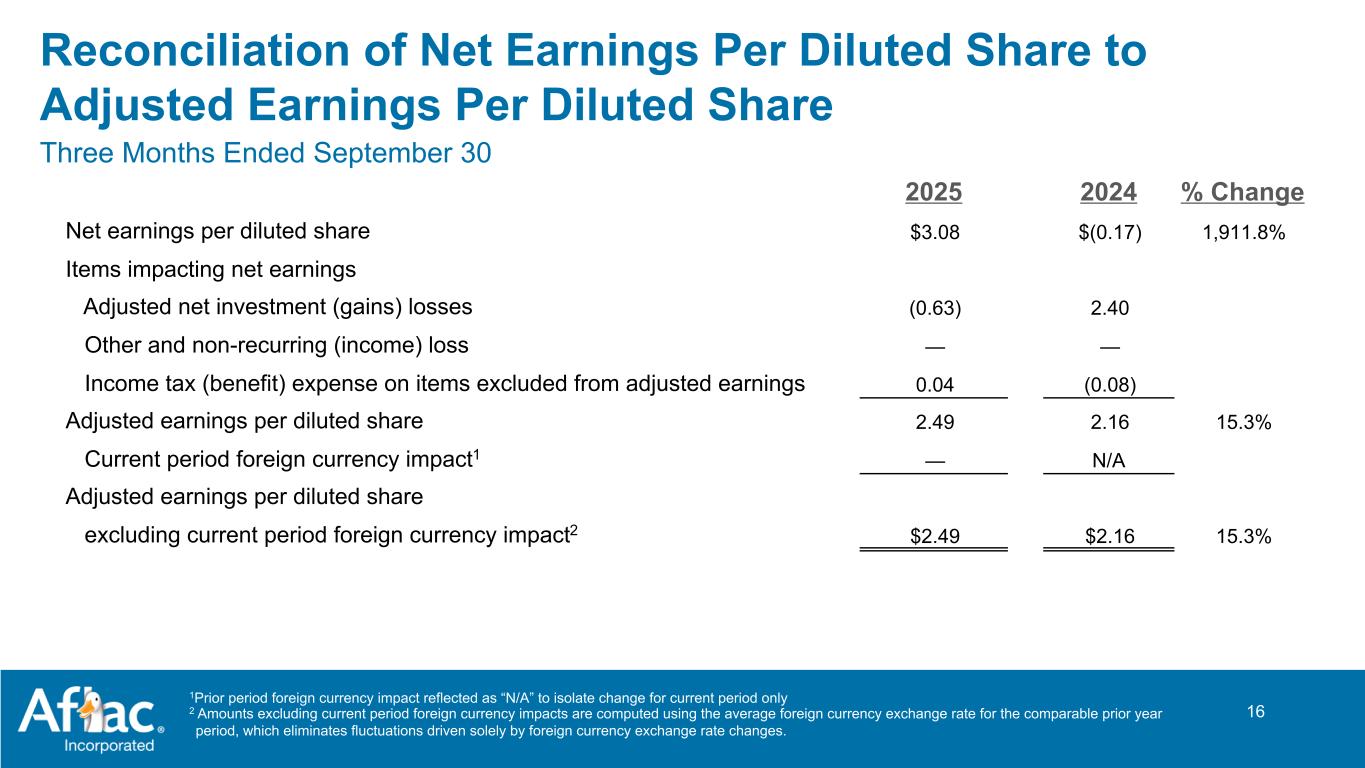
Thank you, David, and good morning, everyone. We're glad you joined us. Aflac Incorporated reported net earnings per diluted share of $3.08 and adjusted earnings per diluted share of $2.49 for the third quarter of 2025. We believe that these are strong results for the quarter, leading to a very good first 9 months of the year. Max will expand upon these results in a moment. But before he does, I'd like to make a comment on our operations. Beginning with Aflac Japan, I am very pleased with Aflac Japan's 11.8% year-over-year sales increase, especially the 42% increase in cancer insurance sales. These strong sales were driven largely as expected, by sales of Miraito, our cancer insurance product launched in March. As part of our ongoing strategy, we continue to emphasize and promote the importance of third sector protection to new and younger customers with our innovative first sector product, Tsumitasu. We believe the repricing of this product for new policies effective in September has the potential to benefit its sales. We saw positive sales growth across all distribution channels. Overall, I believe we have the right strategy to meet our customers' financial protection needs through their different life stages. Our ability to maintain strong premium persistency is a testament to Aflac's reputation, our strategy and our customer recognition of the value of our products. By maintaining this level of persistency and adding new premium through sales, we are partly offsetting the impact of reinsurance and policies reaching paid-up status and maintaining strong persistency continues to be vital to the future of Aflac Japan. Being where customers want to buy insurance has always been an important element of our growth strategy in Japan. Our broad network of distribution channels, including agencies, alliance partners and banks continually optimize opportunities to help provide financial protection to Japanese consumers. We will continue to work hard to support each channel as we evolve to meet the customers' changing needs. Turning to Aflac U.S., we generated $390 million in new sales during the third quarter, which was a 2.8% year-over-year increase. More importantly, we maintained strong premium persistency of 79% and increased net earned premiums by 2.5%. We continue to focus on driving more profitable growth by exercising a strong underwriting discipline and maintaining strong premium persistency. We believe this will continue to drive net earned premium growth. At the same time, Aflac U.S. has continued its prudent approach to expense management and maintaining a strong pretax margin, as Max will expand upon in a moment. In both Japan and the United States, I believe that consumers need the products and solutions Aflac offers more than ever. When a policyholder transforms into a claimant, Aflac becomes more than an insurance company; we become a partner in health and a supporter of their family in their time of need. As a pioneer and leader in the industry, we are leveraging every opportunity to convey our products can help fill the gap during challenging times, providing not just financial assistance, but also compassion and care. At the same time, we generate strong capital and cash flows on an ongoing basis while maintaining our commitment to prudent liquidity and capital management. We continue to be very pleased with our investments, producing solid net investment income. As an insurance company, our primary responsibility is to fulfill the promises we make to our policyholders while being responsive to the needs of our shareholders. Our financial strength underpins our promise to our policyholders balanced with the financial flexibility and tactical capital deployment. I am very pleased with the company's capital deployment. In the third quarter, Aflac Incorporated deployed a record $1 billion in capital to repurchase 9.3 million shares of our stock and paid dividends of $309 million. This means we delivered $1.3 billion back to the shareholders in the third quarter of 2025. Especially as we celebrate Aflac's 70th anniversary on November 17, we treasure another milestone, 43 consecutive years of dividend increases. We remain committed to extending this record supported by our financial strength. At the same time, we have maintained our position among companies with the highest return on capital and the lowest cost of capital in the industry. 2025 also marked 2 other significant milestones for Aflac: the 30th anniversary of what is now known as the Aflac Cancer and Blood Disorders Center of Children's Healthcare of Atlanta and the 25th anniversary of the Aflac Duck. These are significant milestones that celebrate the privilege of benefiting the lives of millions of people. Today's complex health care environment has produced incredible medical advancements that come with incredible costs. We are reminded that one thing has not changed since our founding in 1955. Families and individuals still seek a partner and solutions to help protect themselves from financial hardship that not even the best health insurance covers. Thanks to our relevant products, financial strength, powerful brand and broad distribution, we believe Aflac's outstanding solutions make us the ideal partner. We also believe in the underlying strengths of our business and our potential for continued growth in Japan and the United States, 2 of the largest life insurance markets in the world. We continue to take action to reinforce our leading position and build on our momentum. I'll now turn the program over to Max to cover more details of the financial results.
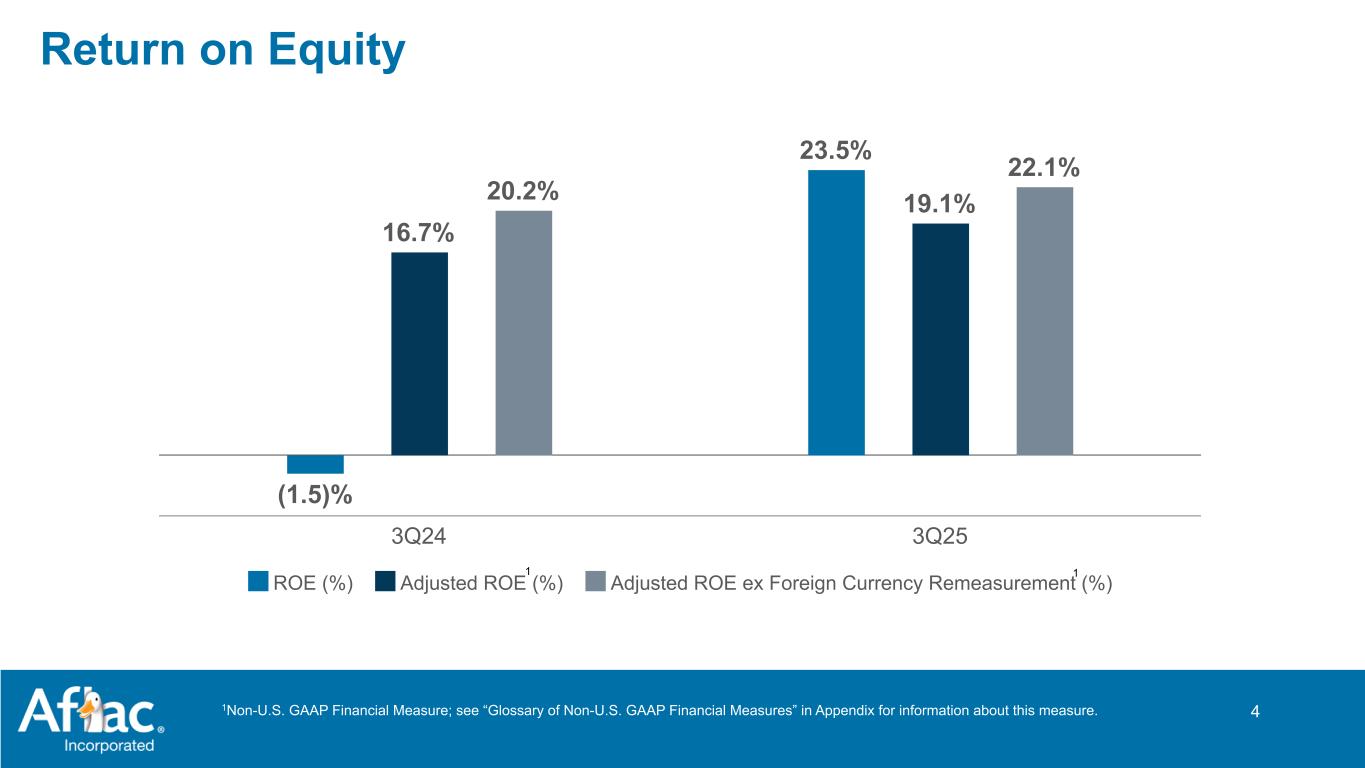
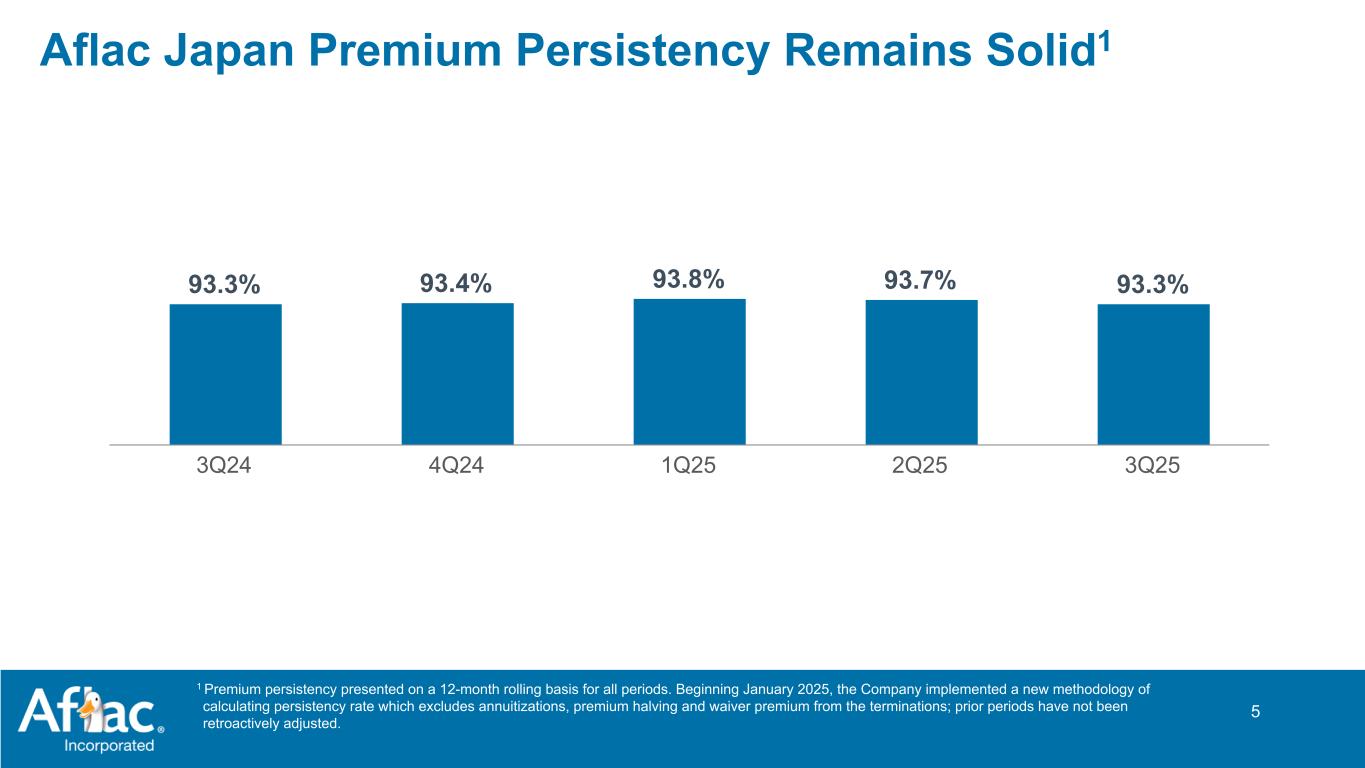
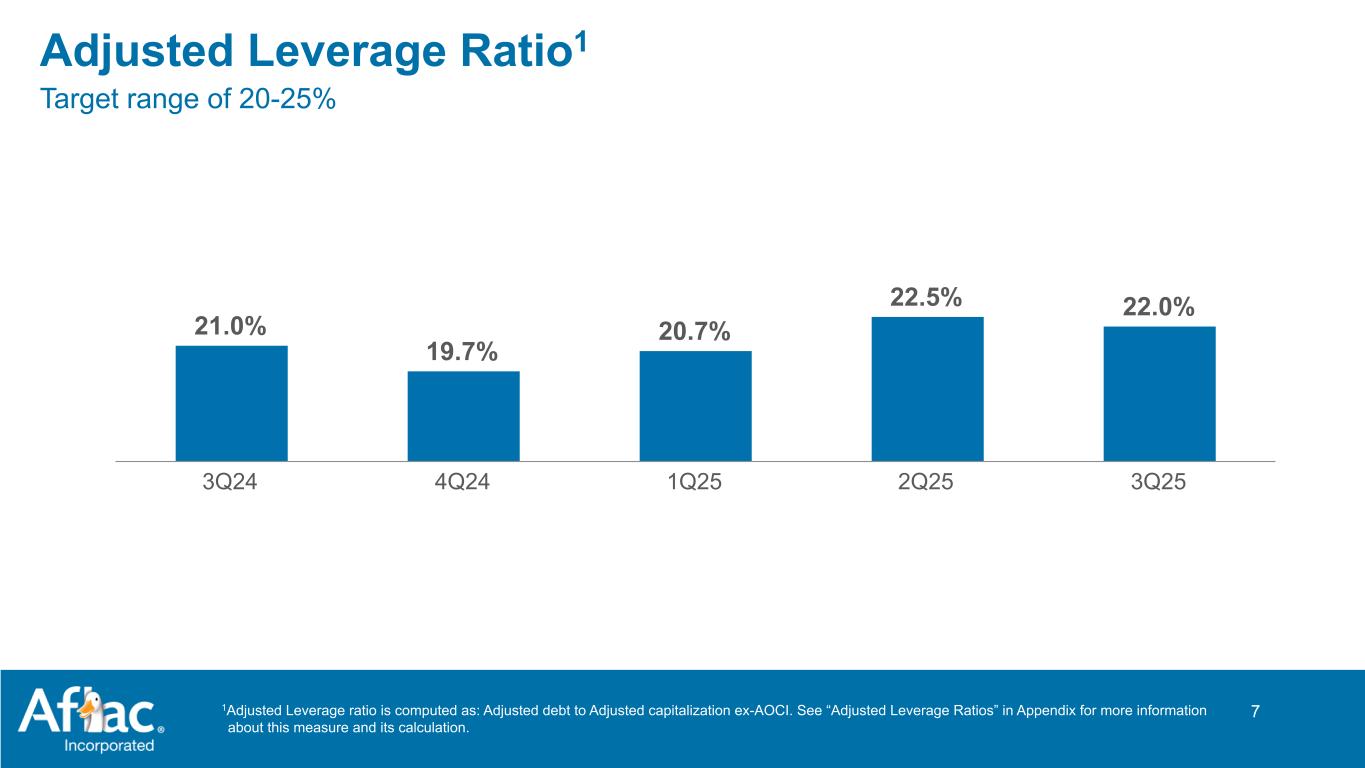
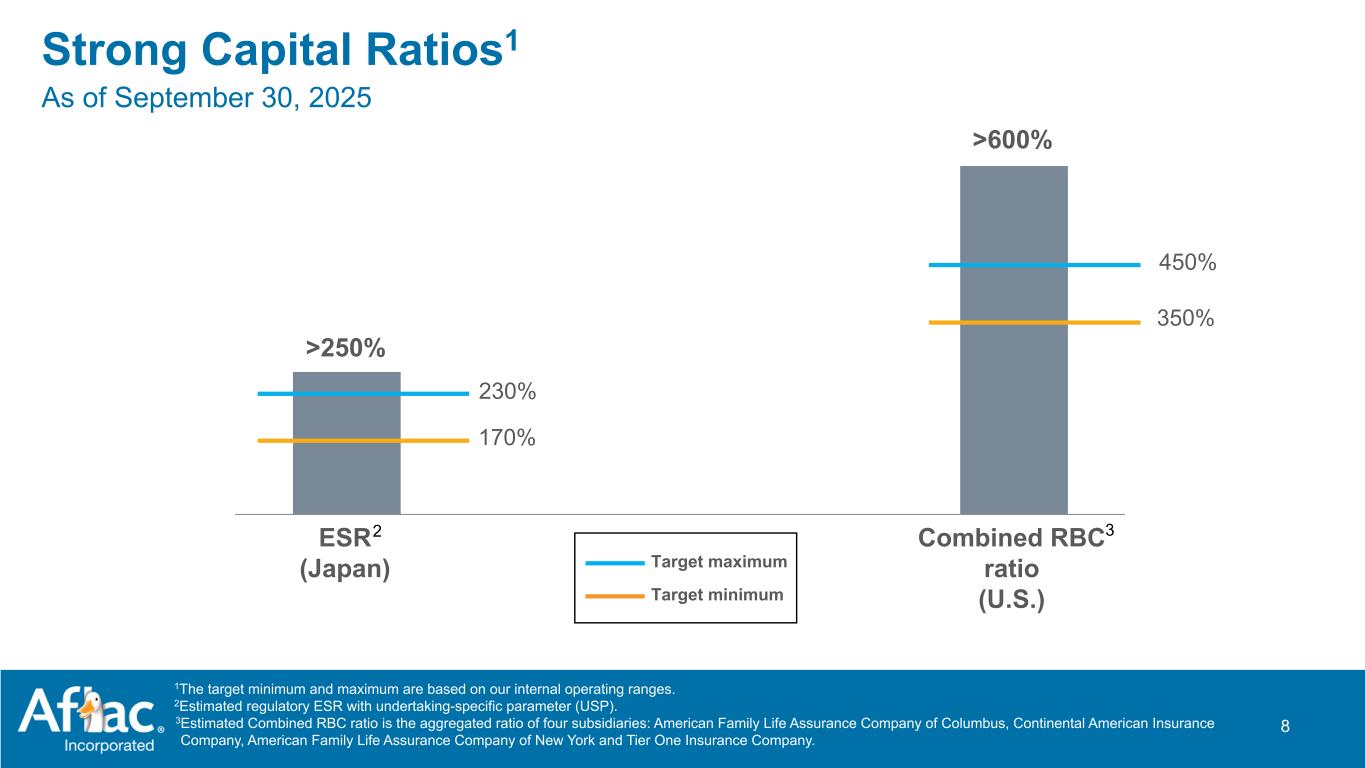
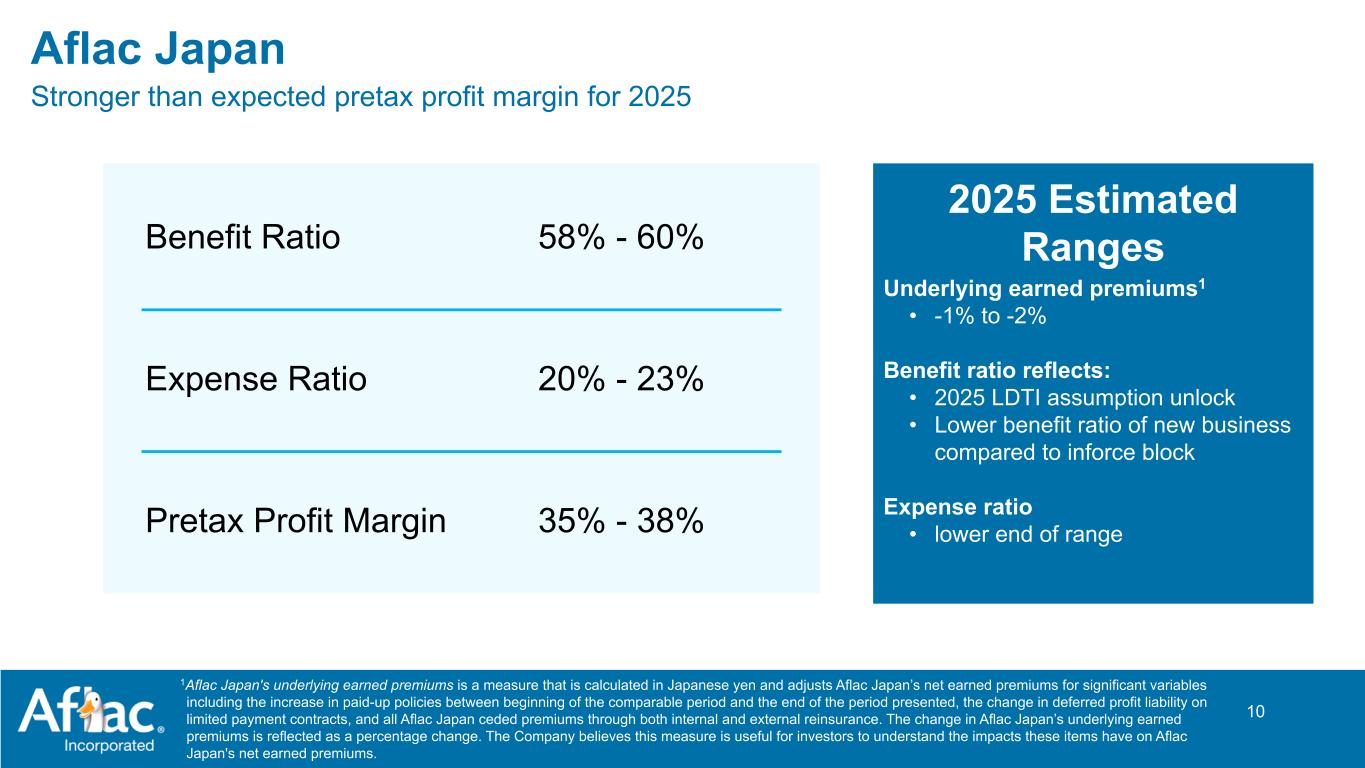
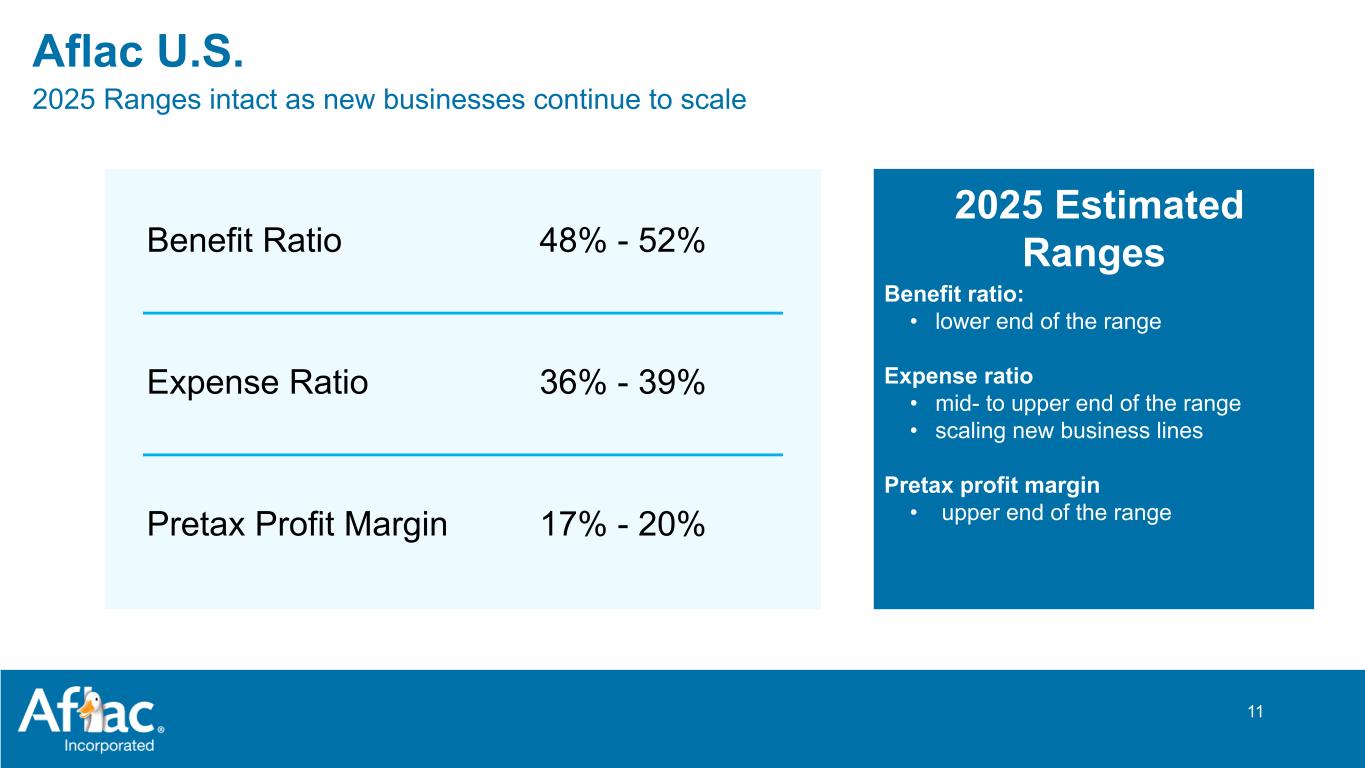
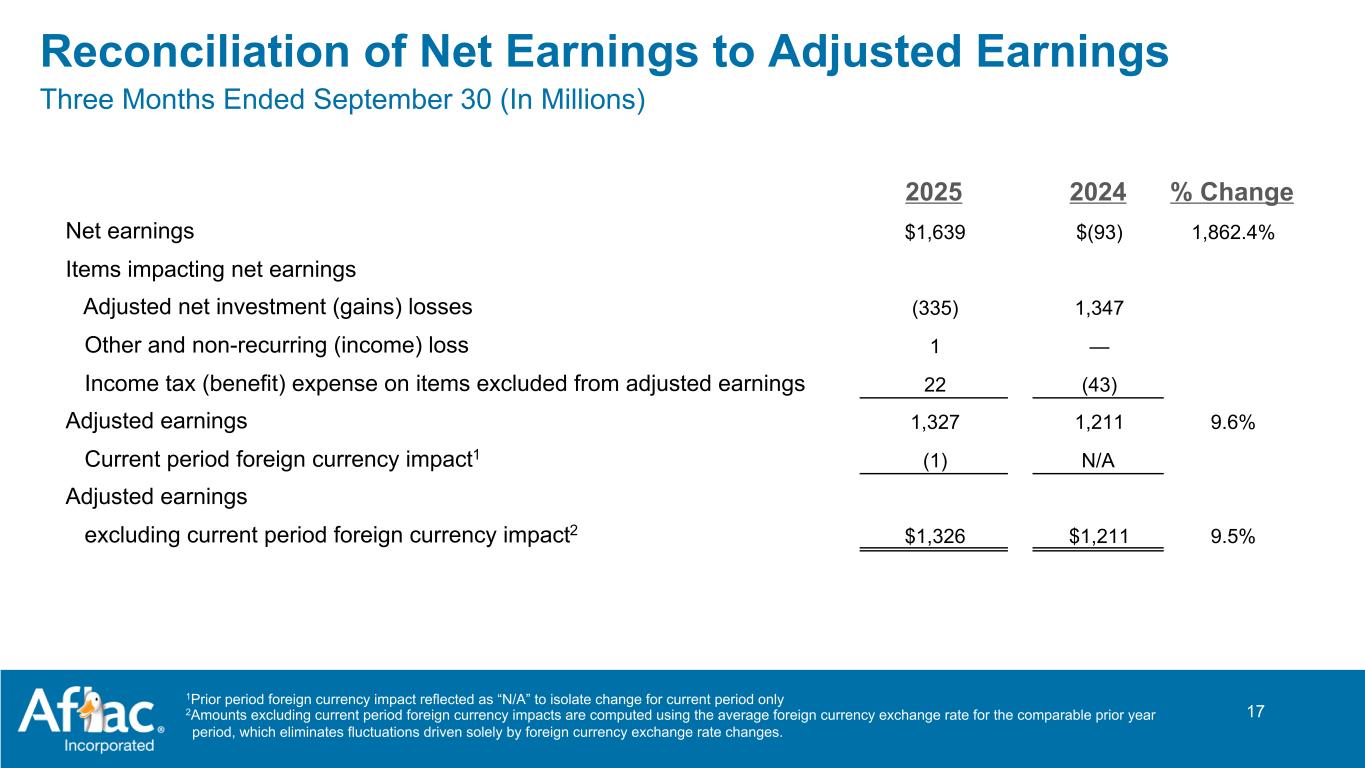
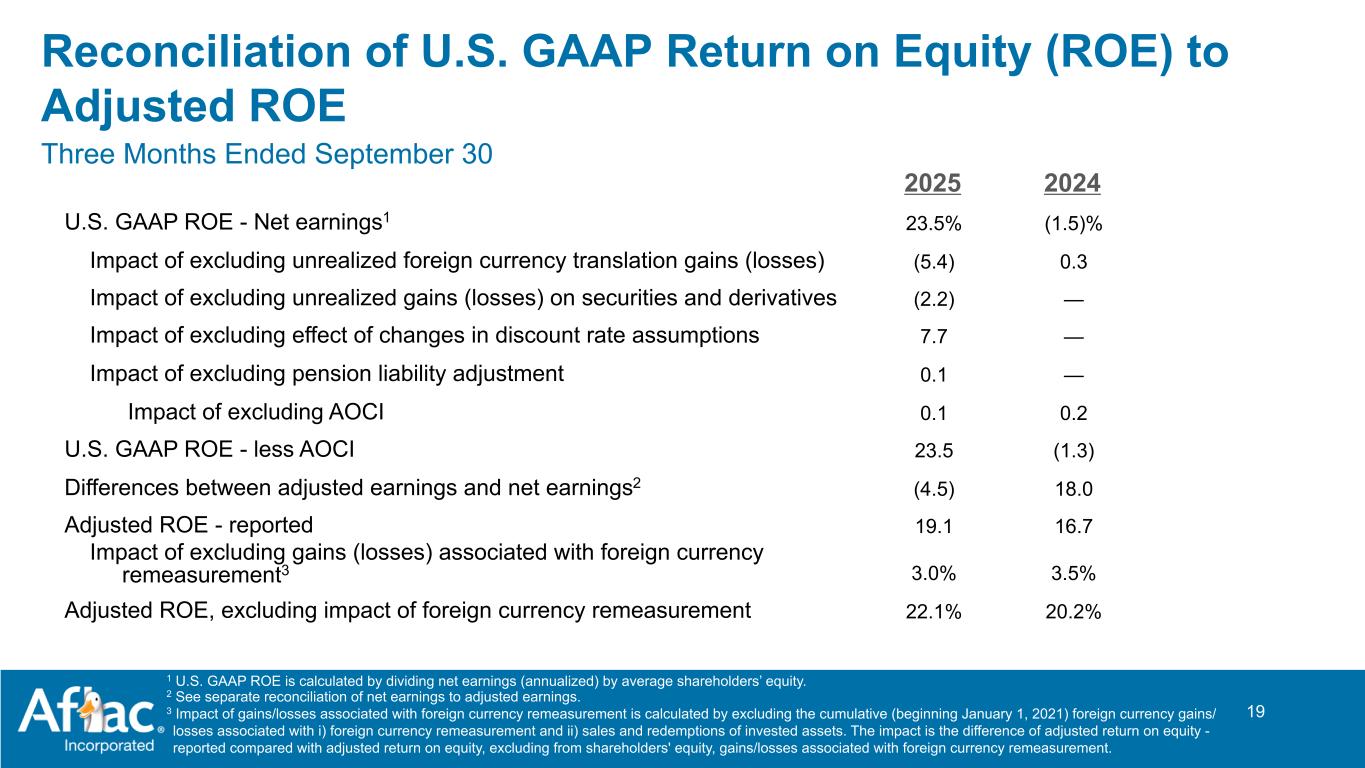
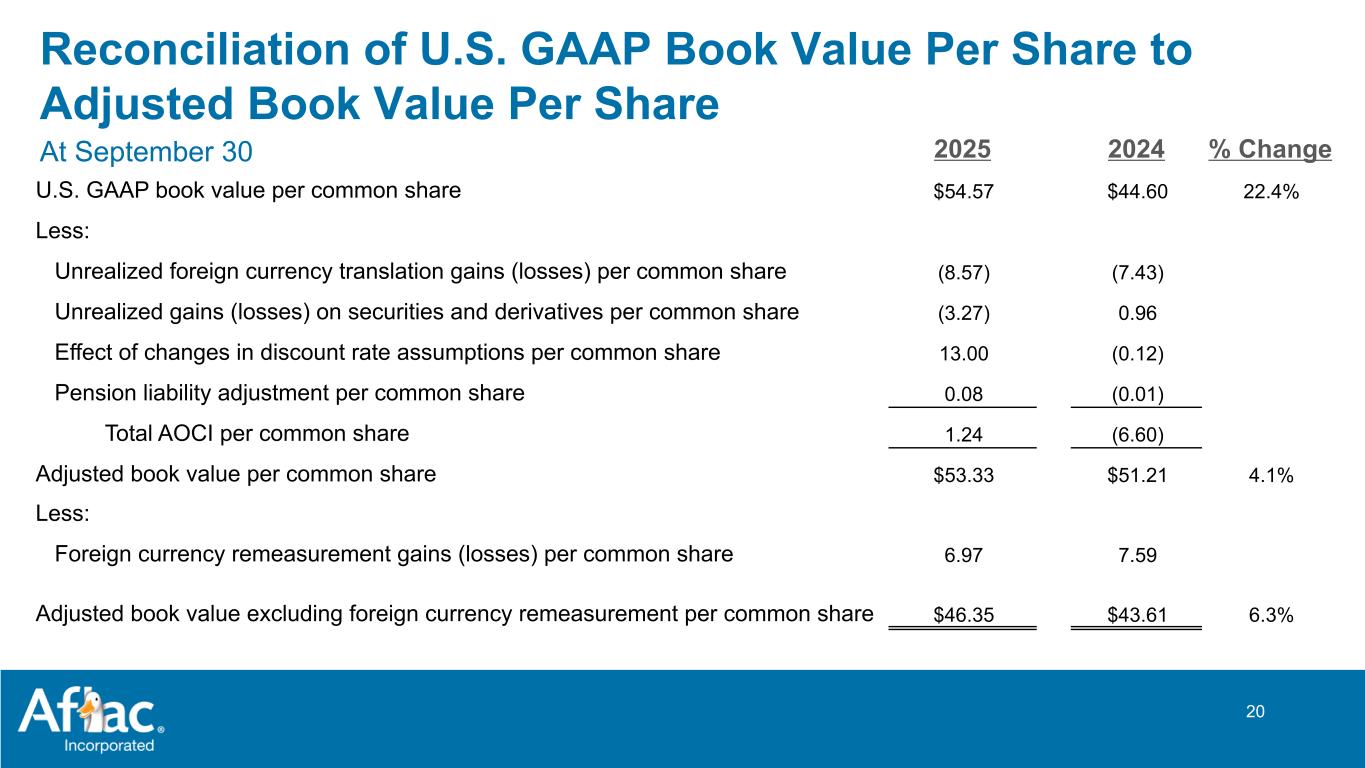
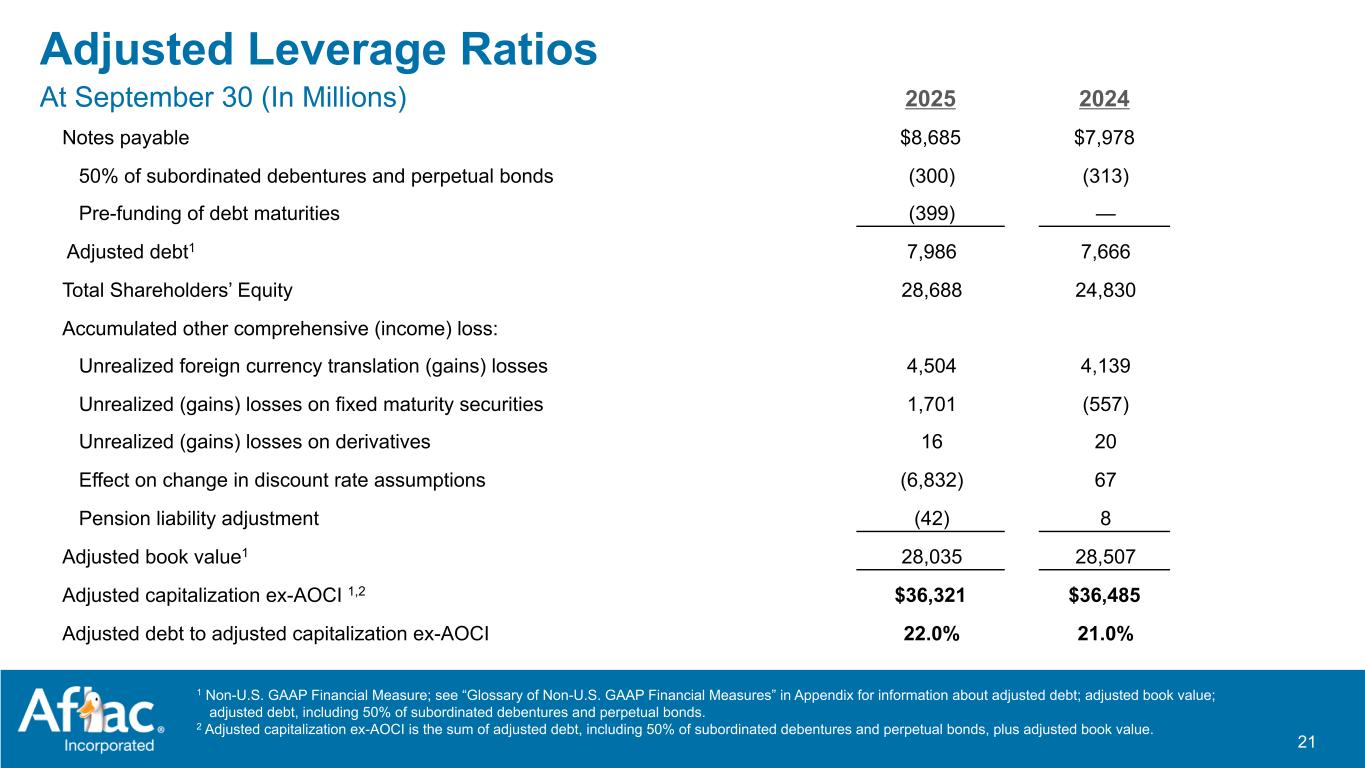
Thank you, Dan. I will now provide a financial update on Aflac Incorporated's results. For the third quarter of 2025, adjusted earnings per diluted share increased 15.3% year-over-year to $2.49 with no impact from FX in the quarter. In this quarter, remeasurement gains on reserves totaled $580 million, reducing benefits and also increasing the deferred profit liability in the earned premium line by $55 million. The total net impact from the Q3 assumption update increased EPS by $0.76 variable investment income ran in line with our long-term return expectations. In our U.S. business, as part of our strategic technology plan as we optimize efficiencies and migrate to the cloud, we terminated a services contract early, which led us to book a one-time termination fee of $21 million in the quarter. Adjusted book value per share, excluding foreign currency remeasurement increased 6.3%. The adjusted ROE was 19.1% and 22.1%, excluding foreign currency remeasurement, a solid spread to our cost of capital. Overall, we view these results in the quarter as very good. Starting with our Japan segment, net earned premiums for the quarter declined 4%. Aflac Japan's underlying earned premiums, which excludes the impact of deferred profit liability, paid-up policies and reinsurance declined 1.2%. We believe this metric better provides insight into our long-term premium trends. Japan's total benefit ratio came in at 39.3% for the quarter, down nearly 10 percentage points year-over-year. The third sector benefit ratio was 27.8% for the quarter, down approximately 14 percentage points year-over-year. We estimate the impact from reserve remeasurement gains to be 26.6 percentage points favorable to the benefit ratio in Q3 2025. Long-term experience trends as they relate to treatments of cancer and hospitalization continue to be in place, leading to continued favorable underwriting experience. Persistency remained solid year-over-year and in line with our expectations at 93.3%. With refreshed product introductions, we generally see an uptick in lapse and reissue activity, causing reported lapsation to increase. We did experience this uptick with our recently launched cancer product, but overall lapsation remains within our expectations. Our expense ratio in Japan was 19.8% for the quarter, down 20 basis points year-over-year, driven primarily by an increase in expense capitalization rates resulting from higher sales. For the quarter, adjusted net investment income in yen terms was relatively flat at JPY 98 billion. The pretax margin for Japan in the quarter was 52.2%, up 750 basis points year-over-year, notably driven by the unlock of actuarial assumptions. But even adjusting for that, a very good result. Turning to U.S. results, net earned premium was up 2.5%. Persistency increased 10 basis points year-over-year to 79%. Our total benefit ratio came in at 45.6%, 200 basis points lower than Q3 2024, driven by the unlock. We estimate that the reserve remeasurement gains impacted the benefit ratio by 480 basis points in the quarter, largely driven by the assumption unlock and claims remaining below our previous long-term expectations. Our expense ratio in the U.S. was 38.9%, up 90 basis points year-over-year. This was primarily driven by the one-time early contract termination fee of $21 million that I referred to earlier and the timing of advertising spend. Even though we incurred a one-time fee as part of our overall strategy, we anticipate reduced costs and improved efficiency, which will offset the termination fee over the next few years. Our growth initiatives, group life and disability, network dental and vision, and direct-to-consumer had no impact on our total expense ratio in the quarter. This is in line with our expectations as these businesses continue to scale. Adjusted net investment income in the U.S. was up 1.9% for the quarter, primarily driven by higher variable investment income compared to a year ago. Profitability in the U.S. segment was very strong with a pretax margin of 21.7%, a 90 basis point increase compared with a strong quarter a year ago. In Corporate and Other, we recorded pretax adjusted earnings of $69 million. Adjusted net investment income was $66 million higher than last year due to a combination of lower volume of tax credit investments and higher asset balances, which included the impact of the internal reinsurance transaction in Q4 2024. Our tax credit investments impacted the net investment income line for U.S. GAAP purposes negatively by $6 million in the quarter with an associated credit to the tax line. The net impact to our bottom line was a positive $2 million in the quarter. Higher total adjusted revenues were offset by higher total benefits and adjusted expenses of $64 million, driven primarily by internal reinsurance activity, higher costs pertaining to business operations and higher interest expense. We continue to be pleased with the performance of our investment portfolio. During the quarter, we increased our CECL reserves associated with our commercial real estate portfolio by $28 million net of charge-offs, reflecting continued distressed property values. We did not foreclose on any properties in the period. Our portfolio of first lien senior secured middle market loans continues to perform well with increased CECL reserves of $7 million in the quarter, net of charge-offs. For U.S. statutory, we recorded a $7 million valuation allowance on mortgage loans as an unrealized loss during the quarter. On a Japan FSA basis, there were securities impairments of JPY 476 million in Q3, and we booked a net realized loss of JPY 189 million related to transitional real estate loans. This is well within our expectations and has limited impact on regulatory earnings and capital. During the quarter, we also enhanced our liquidity and capital flexibility by $2 billion with the creation of 2 off-balance sheet pre-capitalized trusts that issued securities commonly referred to as PCAPs. Unencumbered holding company liquidity stood at $4.5 billion, which was $2.7 billion above our minimum balance. Our leverage was 22% for the quarter, which is within our target range of 20% to 25%. As we hold approximately 64% of our debt in yen, this leverage ratio is impacted by moves in the yen-dollar exchange rate. This is intentional and part of our enterprise hedging program, protecting the economic value of Aflac Japan in U.S. dollar terms. Our capital position remains strong. We ended the quarter with an SMR above 900% and an estimated regulatory ESR with the undertaking specific parameters, above 250%. While not finalized, we estimate our combined RBC to be greater than 600%. These are strong capital ratios, which we actively monitor, stress and manage to withstand credit cycles as well as external shocks. Given the strength of our capital and liquidity, we repurchased $1 billion of our own stock and paid dividends of $309 million in Q3, offering good relative IRR on these capital deployments. We will continue to be flexible and tactical in how we manage the balance sheet and deploy capital in order to drive strong risk-adjusted ROE with a meaningful spread to our cost of capital. For 2025, we now expect that the benefit ratio in Japan will be in the 58% to 60% range. And we continue to expect the expense ratio to be at the lower end of the 20% to 23% range as we pursue various growth and strategic initiatives. As a result, we expect Aflac Japan's pretax profit margin to be in the 35% to 38% range. In the U.S., we continue to expect the benefit ratio for 2025 to be at the lower end of the 48% to 52% range and the expense ratio to be in the mid- to upper end of the 36% to 39% range as we continue to scale new business lines. At the same time, we expect pretax profit margin for 2025 in the U.S. to be at the upper end of the 17% to 20% range.
Speaker 0
Thank you, Max. Before we begin our Q&A, we ask that you please limit yourself to one initial question and a related follow-up. You may then rejoin the queue to ask additional questions. We'll now take the first question.
Speaker 3
I wanted to touch on sales and maybe start with the U.S. It looks like dental and group sales were very good, but your core voluntary product sales were down quite a bit year-over-year. Just can you talk about what you're seeing across your product offerings?
Speaker 4
Yes. Joel, this is Virgil. Let me give you some commentary on that. First, let me start with where you started your question with. Yes, what we're seeing is in the market as the brokers have become more involved with selling supplemental benefits, they are leaning toward group products. So therefore, we are seeing some pressure on our individual products. I will tell you, though, that our focus is to continue to grow our average weekly producers and looking for an increase in recruiting this year. Having said that, along with recruiting comes conversions, we had an 8% increase in converting those recruits into producers for us, and then we saw overall productivity of 16%. We are seeing very strong production though in the investments we made in our buy-to-bills. With our lab business, we achieved a 24% increase during the quarter. We also won the contract with the state of Maine to provide claims administration for their paid family medical leave program. It's really a testament to the type of service we're providing in that market. And also, we stabilized our dental operations, and we are seeing a 40% increase for the first 9 months, which is strong. So our agents have returned back to selling those products. We are entering the broker market with those products, but a continued focus though on growing our Aflac nation, getting our veterans active to really drive, as you pointed out, the individual products. Overall, I would say one more comment, though, I'm pleased for the year. We are at $1 billion for the first 9 months. We are focused on persistency, which means we are still providing some strong underwriting criteria to ensure though that we are making the right decisions for long-term performance. And that's why you see the overall strong performance that we have with profitability, which exceeded our expectations.
Speaker 3
Got it. That's helpful. And then maybe shifting just to Japan sales. They were good in the quarter. Can you just provide some more color on how the cancer sales trended in the quarter? And then how demand is for the new Tsumitasu repriced product?
Yoshizumi, would you mind taking that question?
Speaker 5
My name is Yoshizumi, responsible for sales and marketing. I am pleased to report that we are very satisfied with our third-quarter results, which significantly improved compared to the second quarter. This success was mainly driven by our cancer insurance product, Miraito. One standout feature is its flexible protection design, allowing customization for everyone, including those who already have cancer insurance and those who do not. It appeals to younger and middle-aged individuals, as well as customers of all ages. Additionally, it includes plans for children, a unique offering from Aflac, along with a premium waiver function and premium-based plans. This cancer insurance is distinct to Aflac, supported by our 50 years of history, and it is showing strong performance across all distribution channels. As for Tsumitasu, we underwent a rate revision and began to see solid sales growth in September. The two main products driving our sales are Tsumitasu and Miraito, and we expect this positive momentum to continue into the fourth quarter. Our primary distribution channel is associate channels, particularly with Japan Post Group, our alliance partner, who is performing well. We aim to maintain this momentum and finish the year strong in the fourth quarter. That's all from me.
I would like to add that I was recently in Japan to discuss the Tsumitasu product and evaluate its performance with the banks. I met with 29 regional banks and visited 4 shinkin banks, as well as the Head of the Association of Shinkin Banks. The response to Tsumitasu has been very positive. While it's difficult to predict exact sales figures, our data shows that we are attracting a younger demographic with this product. Initially, we estimated that 40% of our customers would be in their 30s and 40s, but it has exceeded 50%, which is a significant improvement. This trend is encouraging and suggests long-term benefits for us. Additionally, I'm very pleased with the performance of our Miraito product, which has seen remarkable growth this year, thanks to our sales team's efforts. I completely agree with Yoshizumi on this. I also had Virgil visit twice during the quarter to motivate the team and recognize their hard work, especially since Yoshizumi joined us during the challenging COVID period. It's been a successful year for him, and we anticipate this productivity will continue throughout the year.
Speaker 6
My first question is just a follow-up on the repricing of the policies in September. Did you mention that was Miraito? What was the difference since I believe you launched that in June? What was actually repriced in September? Did you lower pricing? Can you provide a bit more detail?
Tom, the repricing related to Tsumitasu. And what we did was, as yields have increased throughout the year, we increased the assumed interest rate on the product and moved that up. And that relates both to the underlying rate, but also the discounted advanced premium rate that we moved up from 25 basis points to 1%. And that's a pretty meaningful move that we did.
Speaker 6
Got you. So cancer is just playing out as you expected?
Yes. No repricing on cancer.
Speaker 6
Got you. And just for my follow-up, so I guess I'm thinking about your launch of medical in Japan next year. And I'm not asking for specific numbers per se, but I guess it's a broader question. If I think about you now have 2 products selling simultaneously doing pretty well. And wondering, as you add a third, how do we think about your ability to support 3 products at once? Because I think historically, Aflac was really a one product at a time company and now you have 2 going, doing pretty well. How do you think about the launch of a third product? And do you think that can translate into over JPY 80 billion in sales from a ballpark perspective to where we could get to overall premium growth flattening or even maybe beginning to grow?
Speaker 7
This is Koide speaking from Aflac Japan. We have recently completed a marketing and sales transformation in January, and the new structure is now implemented for the development of cancer medical assets and nursing care. Previously, our organization was function-based for product development and marketing, but we have transitioned to a more cross-functional approach, allowing product development and marketing to occur in parallel across all three brands. The goal of this transformation is to enable us to launch all three brands or products simultaneously and provide direct support for them. With this new structure, we have seen positive results, having successfully launched Miraito and Tsumitasu at the same time. We are also planning to introduce a new medical insurance product at the end of December. I am confident that under this new organization, we will effectively manage all three brands concurrently and independently. The sales teams have experienced the success of Miraito and Tsumitasu and are now eager to achieve similar success with the upcoming medical insurance launch. That concludes my remarks.
Comment about what was just covered. The Miraito will be somewhat affected when we enter the medical sector. An agent has limited time each day to sell. When they make calls based on their current focus, if they've been promoting cancer insurance for a year, introducing a new product like medical will typically work to their advantage. However, with Tsumitasu, the approach is different, and we are targeting consumers in a way we haven’t previously. I want to ensure it’s understood that there is usually a decline in sales of an older product after introducing a new one because the essence of sales is to offer exciting new options to encourage more engagement. This phenomenon does occur, and I wanted to clarify that for you, Tom, since I believe you were the one who asked the question.
Speaker 7
May I add one more thing? This is speaking. Our alliance partner focuses solely on cancer reinsurance, so they will not be affected by the new medical insurance launch. Regarding the new structure of the three brands, the teams are collaborating and supporting other products rather than working in isolation. We anticipate that the launch of the appealing new medical insurance will positively influence Tsumitasu and other offerings within our company.
Speaker 8
My questions are focused on the U.S. business. With the success and the growth of the buy-to-build initiatives, have we crossed over the period of investment and are now starting to yield some earnings from those efforts?
Speaker 4
Thank you, John. It's Virgil. I want to clarify that we haven't reached scale yet. However, we are experiencing growth, particularly in the lab segment, where there have been quarters that show positive results. Nonetheless, we need to achieve more scale to maintain that consistency. So, I can't make any claims just yet. Regarding our dental segment, we still need more growth. We have managed to stabilize, and I'm very pleased with our operational performance. The challenges we faced have significantly diminished. Over the first nine months, we saw 40% growth, but to reach the necessary scale, we will need to increase sales and drive earned premium. The trajectory is promising, but we haven't arrived at our destination yet. Max, do you have anything to add?
I want to add something. I'm very pleased with what's going on. When I look at it last year and look where we are this year, we're running way ahead, and it's nice to see that. And so Virgil is correct. We need more, but it's come a long way, and I am very pleased with what I've seen them accomplish.
One of the businesses has become profitable this year, while two others have not. However, it will still take some time before we achieve our target profitability. While breaking even is one goal, our aim is to ensure these businesses reach sufficient profitability overall, which will still require a few years.
Speaker 8
And my follow-up question on the U.S. Given the comments about more of the broker distribution going into group products, how do you get larger in that? Can you talk about maybe efforts organically and potentially inorganically?
Speaker 4
I would like to mention two points regarding that, John. First, we had to ensure that the right set of products was available and are focused on providing a unified experience. The positive trajectory we're observing in our lab products indicates that brokers are embracing it. We are delivering an excellent level of service, and our brand has gained significant strength in this area, allowing us to win cases. As we look ahead to 2026, our objective is to bundle these products with our other VB products. We have referred to this as a halo effect in the past, but it is crucial for us to have these products combined so that brokers can offer a cohesive solution. It’s not merely about presenting an underwriting offer; it also involves providing the necessary technology and processes to support that. This is our primary focus. Additionally, our dental products are growing, primarily driven by our agents. We are eager to engage brokers and encourage them to implement it in some of their larger cases. By combining these efforts, we believe we will continue to grow consistently strong in the group space, as this has been our focus with those buyer deals. John, let me ensure I address the second part of your question. What was your follow-up question?
Speaker 8
Yes. I think you covered the first part from the organic. I was asking is the inorganic opportunity for good scale there.
Speaker 4
Thank you for that, John. I will tell you that as I've taken over now my role as President of the corporation, I've worked behind the scenes with all our leadership teams, primarily Max and I were making sure that we've got a strong corporate development arm. My point on that is that we're going to make sure we've got the right rigor and discipline to be looking out in the market for any opportunity. We're going to be very deliberate, though. So we are preparing to make sure that we have that discipline, that rigor to be looking. But at the same time, though, we have not seen anything become available that has attracted us that can really move our operations. So we're not going to just make a move to make a move, but the discipline that we have, we're making sure that we're ready if and when there is an opportunity.
Speaker 9
I guess I had a follow-up on that last question on inorganic. I think last year at your investor conference, I think your views were you wanted to build out the newer U.S. capabilities and give it a few years to see if it was working before you'd really consider anything larger from an M&A standpoint. It sounds like things are going better than you expected when it comes to the progress in the U.S. So I just wanted to follow up and maybe can kind of circle back to what you had said last year. When it comes to inorganic, are you mostly looking at smaller things that would add capabilities? Or would you actually consider something more meaningful?
Speaker 4
I believe the key point we highlighted last year is the importance of focus. It's challenging to pursue new ventures while there are significant opportunities right before us, particularly with our life and disability platform, which we are prioritizing for scaling. We are actually surpassing the growth trajectory we initially set. Additionally, when our dental operations were unstable, that became a clear priority as well. Both markets present substantial opportunities, and consumers continue to demand those products, which is why we are concentrating our efforts there. However, regarding smaller opportunities, we remain very aware of advancements in AI and have established a clear framework for our operations. We aim to be efficient and effective in managing our business, with technology playing a crucial role in our progress. We will always keep an eye on potential business segments and external opportunities, although our primary focus will remain consistent. Aflac's success has been driven by its innovative history; we were pioneers in the supplemental insurance and cancer insurance markets. We are committed to continuing our legacy of innovation moving forward.
I would just add that I don't think our views on M&A have changed. We believe what we are currently building is effective, and we are making good progress. Our core business is performing exceptionally well, so we are not in a position where we need to take action. While we have the flexibility and opportunity, we also understand that we operate in niche businesses, which makes it challenging to find complementary companies and integrate them due to our specialized operations in areas like distribution and administration. Considering all of this, I would say our views and opinions have not really changed.
Speaker 9
And then you had a 64% to 66% Japan benefit ratio target over the next few years coming into this year. Following the assumption review in Japan, do you think that's still a good range? I know there's some ongoing benefits from that.
So Ryan, if you look at our underlying benefit ratio for the quarter, it came in at 65.9%. I think that's a reasonably good range going forward. Keep in mind that when we give guidance, we generally do not include any further unlock assumptions in those ranges. So the long-term range of 64% to 69% looks good to us. Obviously, we benefit from the 130 basis points lower net premium ratio and also from the overall mix as we continue to grow our in-force contribution from the third sector block, predominantly cancer. When you take all of that together, we mentioned a year ago that in the range of 64% to 66%, we would start at the high end of that range and trend lower throughout the forecast period. As we sit here today after the current unlocking and considering our experience, that still holds.
Speaker 10
Could you talk a little bit about why the Japan cash earnings have been so high over the last few years and how long this could persist?
Thank you, Wilma. The 2 main drivers of the high FSA earnings and therefore, ultimately dividends from Aflac Japan to Aflac Inc. over the last couple of years has really been driven by 2 factors. The first one is actually the weakening yen. And the way the FSA accounting works is that on U.S. dollar assets held on the Japanese balance sheet, you recognize the full impact from FX movements at the maturity of those bonds. And we obviously generally buy a lot of 5-year and 10-year tenors. And that means that you have to go back and look at what the yen was 5 years ago and 10 years ago. In particular, if you look at where the yen was 10 years ago, it was significantly stronger than what you have today. That means that as those bonds mature, you realize a very significant FX gain. As an example, 10 years ago, you roughly had a yen at JPY 1.05 relative to the dollar. If those bonds mature today at 1.50, that is close to a 45% appreciation of that asset that gets recognized at the time of maturity. So this boosts the FSA earnings in the near term. The other impact that you've seen since 2022 is that we have executed a series of reinsurance transactions between Aflac Japan and Aflac Bermuda. When we do that, there's also a release of reserves in the Japan segment, and that is boosting the FSA earnings as well. So I would say that those 2 components have been the main driver of the very high FSA earnings that you have seen.
Speaker 10
And just a follow-up. It sounds like that could persist for at least a couple more years. And then along the same lines, can you just talk about the higher share repurchases in the quarter? And if that's something that you expect to see as more of a run rate?
So as long as you have a yen that is weakening, you would continue to have a tailwind from maturing U.S. dollar assets. If you have a yen strengthening, you could have the opposite. So I do want to caution you that this goes both ways. The other factor, we do continue to evaluate further reinsurance transactions. And if we were to execute any in the future, that is also likely to create FSA earnings and therefore, higher cash coming through. But if you look at the underlying FSA earnings, that has generally been on a core basis, a little bit over JPY 200 billion per year. And then the way I would think about it is that, that's sort of a core underlying base. And then on top of that, you have the FX gains and any sort of gains coming through as it relates to reinsurance on top of that as well. In terms of buybacks, our philosophy has not changed. It is a function of our capital ratios that we have, the cash levels that we have at the holding company, as well as the capital formation that we see going forward. And then obviously, we evaluate all the different kinds of deployment opportunities that we have throughout the company and the enterprise. And where we see good returns, that's where we have the capital allocated to. In the quarter, we obviously saw good levels and attractive IRRs on the capital that we deployed into share repurchase. And that's the reason why you saw that being a little bit higher than what you've seen in previous quarters.
Speaker 11
I wanted to come back to John Barnidge's line of questioning on Aflac U.S. And this comment that you made about the brokers pivoting back to, I guess, true group product and you sort of reinvigorating Aflac Nation. Is this a new development? I don't remember you talking about this in the past. And the reason I ask is, fourth quarter is traditionally your big group broker quarter in terms of U.S. sales. And I'm just wondering if it's a new development, should we start thinking about how that could impact fourth quarter of '25 sales?
Speaker 4
Suneet, this is Virgil. I want to express that our pipeline for the fourth quarter appears strong. I'm confident that we will meet our sales targets as planned. The pipeline suggests we can expect consistent performance for the quarter. Overall, the fourth quarter looks promising. I wouldn’t say there have been any changes. In fact, our growth in the large case sector and within our life, absence, and disability products is encouraging, as we are outpacing our previous forecasts. We are also continuing to build relationships with brokers and are considering bundling our life, absence, and disability products with our core group VB offerings. However, I must note that the current average producer numbers are weaker, leading to a stronger performance in our group products and weaker results in our individual offerings. It's crucial that we focus on revitalizing Aflac Nation and look forward to a more robust recruiting year. But it’s not only about recruiting; we need to ensure conversions as well. I'm pleased with our 8% conversion rate and our productivity at 16%. Our focus remains on growing our producers, as they significantly contribute to individual business sales.
Speaker 11
Okay. All right. That makes sense. And then maybe a follow-up on the U.S., Virgil, if I could. So if I look at annual sales, they've been sort of traveling around $1.5 billion and it looks like this year might be pretty close to that as well. And I know you're focused on earned premium growth of 3% to 5%, but obviously, sales is pretty important. And a few years ago, we talked about a $1.8 billion kind of target. Just wondering what needs to happen to get to some level of sales like that?
Speaker 4
Yes. I'll begin with the buy-to-bills, which stemmed from our underperformance in the dental product. Currently, we are approximately two years behind our expectations. Despite this, I am optimistic about recovering our operations, and I am very pleased with the 40% growth we've experienced in the first nine months, even though it is still a year or two later than anticipated. When we initially projected those numbers, we expected annual sales from dental to be higher at this point. My aim is to recover and finish strong this year, and then as we move into 2026, get closer to the original numbers we predicted years ago. Additionally, regarding bundling, our goal isn't to be the best in dental but rather to combine dental with our VB products. In the third quarter, I noticed that for every dollar of dental sold, we sold about 85 cents worth of VB. This is exactly what we are aiming for. As we boost dental sales and recover that segment, we will also see an uplift in that individual block. This is part of the reason for our lag. Lastly, we are currently addressing the number of producing agents as well.
Yes, this is Dan. Let me add one other thing. I've always talked about evolution, not revolution. We're making some internal changes that are positive evolutions. For instance, we write according to classifications 5s and 6s, which are high turnover areas like nursing homes. Writing that business didn’t make sense because there was too much turnover, resulting in low claims. Additionally, there was no profit due to high expenses. A few years ago, we didn't forecast stopping sales in that area, but we have now because it’s not beneficial for anyone—neither the company nor the consumer, especially after observing the loss ratio. So we've moved on. We are evolving and implementing changes, aiming to clean things up and enhance profitability, especially with the buy-to-bills. They've done a commendable job with that, and while we’re not where we want to be, we are progressing in the right direction. It’s a significant step forward, better than I expected, and I’m very optimistic about it, and what Virgil said is absolutely correct.
Speaker 11
Just a quick follow-up. I'm not sure what you meant by 5s and 6s, but in any event, how big of a headwind is that issue?
Well, what I mean by 5s and 6s is the classifications. Certain areas like if you're working in a lumber mill, that's the highest rating you can get because accidents occur more. So the higher the number, the higher the probability you're going to have claims or whatever it might be, if it's a high persistency. But the best would be a white collar worker in an air-conditioned room working day-to-day and just counting numbers. That's the safest one we can give the best rate to. And a lot of people were not writing or what I'll just call less poor persistency business and less profitable business.
Suneet, we have basically gone through a project to classify all our different accounts by profitability, and we're tiering them between 1 and 6. And then we have essentially adjusted to some extent, the commission schedules accordingly to make sure that we capture more of the more profitable business and less of the less profitable business.
Speaker 12
I have a couple of questions about the U.S. business as well. Firstly, regarding claims trends, it appears that your benefits ratio has been rising when we adjust for actuarial reviews and remeasurement gains. I'm curious to know how claims experience and supplemental products have returned to normal, or if they have worsened compared to the favorable conditions we previously saw. Is this change related to the mix of business and growth in group insurance products or something else? Specifically, what are you observing in terms of claims trends in supplemental policies?
Jimmy, let me kick it off on the benefit ratio. So there are essentially 3 factors that are pushing up our underlying benefit ratio to the higher levels now into the 50s. First of all, we went through actively a round of endorsements and benefit enhancements of our underlying policies. This applies to our cancer product. This applies to our accident product. This applies to our hospital product because simply, they were too low, especially coming out of the pandemic. So part of it is that we have pushed that through. Then you also have the cyclical component that because claims were very low, there's also an element of catching up impact that you are seeing now as well coming out of the pandemic, especially as it relates to cancer claims. During the pandemic, there was a significant amount of undetected cancers that post-pandemic as more people go for their regular annual checkups, these are now being detected. So we see, therefore, a little bit of a catching up impact on that line of business. And the last piece to the benefit ratio is mix. So a greater proportion of our in-force are now gradually sitting in higher benefit ratio product categories like life and disability and also dental and vision. And as sales grow of those product categories, they will become a greater proportion of our overall in-force. And therefore, when you look at the total U.S. benefit ratio, that will structurally move up over time.
Speaker 12
Okay. But nothing alarming in terms of claims in supplemental going up beyond what you would have assumed?
Speaker 13
Just one on your margins in Japan. To what degree are you now like assuming future improvement in cancer and hospitalization trends, I guess, versus maybe your prior assumption and how you've seen recent experience trends?
In our updated assumptions, we have included our recent experiences. We also expect some further improvement, reflecting a long-term trend of positive development. However, this improvement is quite limited. I want to emphasize that while there is some improvement, it is very minor and is factored into our future actuarial assumptions for cancer.
Speaker 14
And then a follow-up, just wondering about your perspective around private credit, given it's been in the headlines lately. I guess, can you just talk about your outlook for that asset class and what kind of experience Aflac is being in its portfolio?
Sure. Thank you for the question, Jack. Private credit is not something that's new to us or to the industry by any means. We're very comfortable with our current strategy as it relates to private credit. To state the obvious, there's 2 risks you need to understand and you need to underwrite. This is a credit asset. You need to have very strong credit management capabilities, and it needs to focus on bottoms-up security level underwriting with a disciplined top-down portfolio management approach. And then the second obvious risk factor is liquidity and making sure you're stressing to make sure that you've got the liquidity you need to meet obligations across the organization. And we obviously do both of those. As it relates to the credit cycle and things we're seeing there, nothing systemic that would suggest we're at the beginnings of a serious credit cycle. Corporate balance sheets remain strong. We've not seen a discernible trend in downgrades or credit deterioration across our portfolio. In our structured private credit space, all of our holdings are performing in line with expectations. I'm very confident that if we do get a turn, our portfolio is going to perform well. Defaults and downgrades generally are isolated in below investment-grade portfolios. We have been very cautious in how we've built that exposure. So we feel very good about our overall private credit and aren't too concerned. We didn't have any exposure to the names that have been in the news lately, and we think our disciplined underwriting is going to allow us to do very well if and when the cycle does turn.
Speaker 0
This concludes our question-and-answer session. I would like to turn the conference back over to David Young for any closing remarks. Thank you, Andrea, and thank you all for joining us here today. If you have any follow-up questions, please reach out to Investor and Rating Agency Relations, and we look forward to speaking to you soon. Have a great day.
Operator
The conference has now concluded. Thank you for attending today's presentation, and you may now disconnect.