Operator
Good morning, everyone, and welcome to the AFLAC Incorporated fourth quarter 2025 earnings conference call. All participants will be in a listen-only mode. Should you need assistance, please signal a conference specialist by pressing the star key followed by zero. After today's presentation, there will be an opportunity to ask questions. To ask a question, you may press star and then one on your touchtone phone. To withdraw your questions, you may press star and two. Please also note today's event is being recorded. I would now like to turn the floor over to David Young, Vice President of Capital Markets.
Please go ahead. Good morning and welcome. Thank you for joining us for Aflac Incorporated's fourth quarter 2025 earnings call. This morning, Dan Amos, Chairman and CEO of Aflac Incorporated, will provide an overview of our results and operations in Japan and the United States. Then Max Broden, Senior Executive Vice President and CFO of AFLAC Incorporated, will provide more detail on our financial results for the quarter, current capital, and liquidity. These topics are also addressed in the materials we posted with our earnings release, financial supplement, and quarterly CFO update on our investors.aflac.com. For Q&A today, we are joined by Virgil Miller, President of Aflac Incorporated in Aflac US, Charles Lake, Chairman and Representative Director, President of Aflac International, Masatoshi Kuide, President and Representative Director, Aflac Life Insurance Japan, and and Brad Dislin, Global Chief Investment Officer, President of AFLAC Global Investments. Before we begin, some statements in this teleconference are forward-looking within the meaning of federal securities laws. Although we believe these statements are reasonable, we can give no assurance that they will prove to be accurate because they are perspective in nature. Actual results could differ materially from those we discussed today. We encourage you to look at our annual report on Form 10-K for some of the various risk factors that could materially impact our results. As I mentioned earlier, the earnings release with reconciliations of certain non-U.S. gap measures and related earnings materials are available on investors.aflac.com. I'll now hand the call over to Dan. Dan?
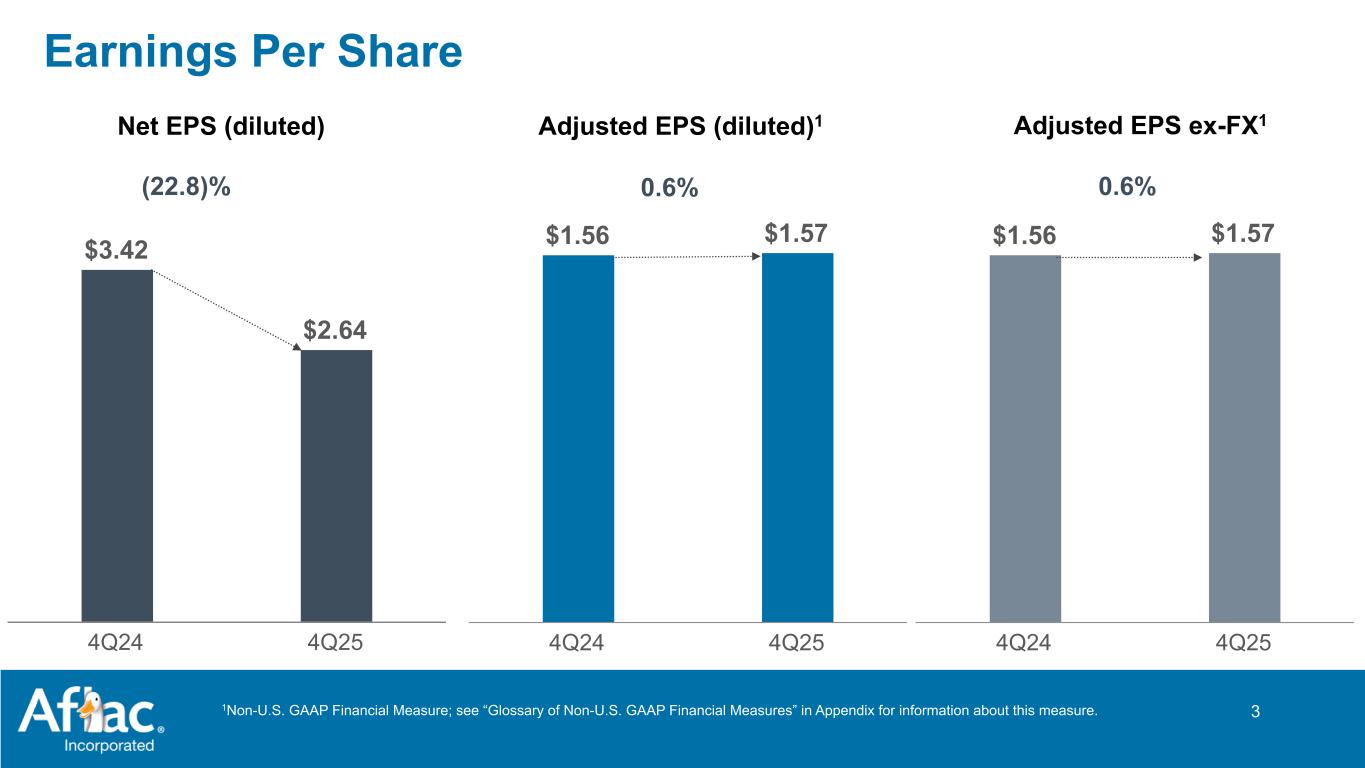
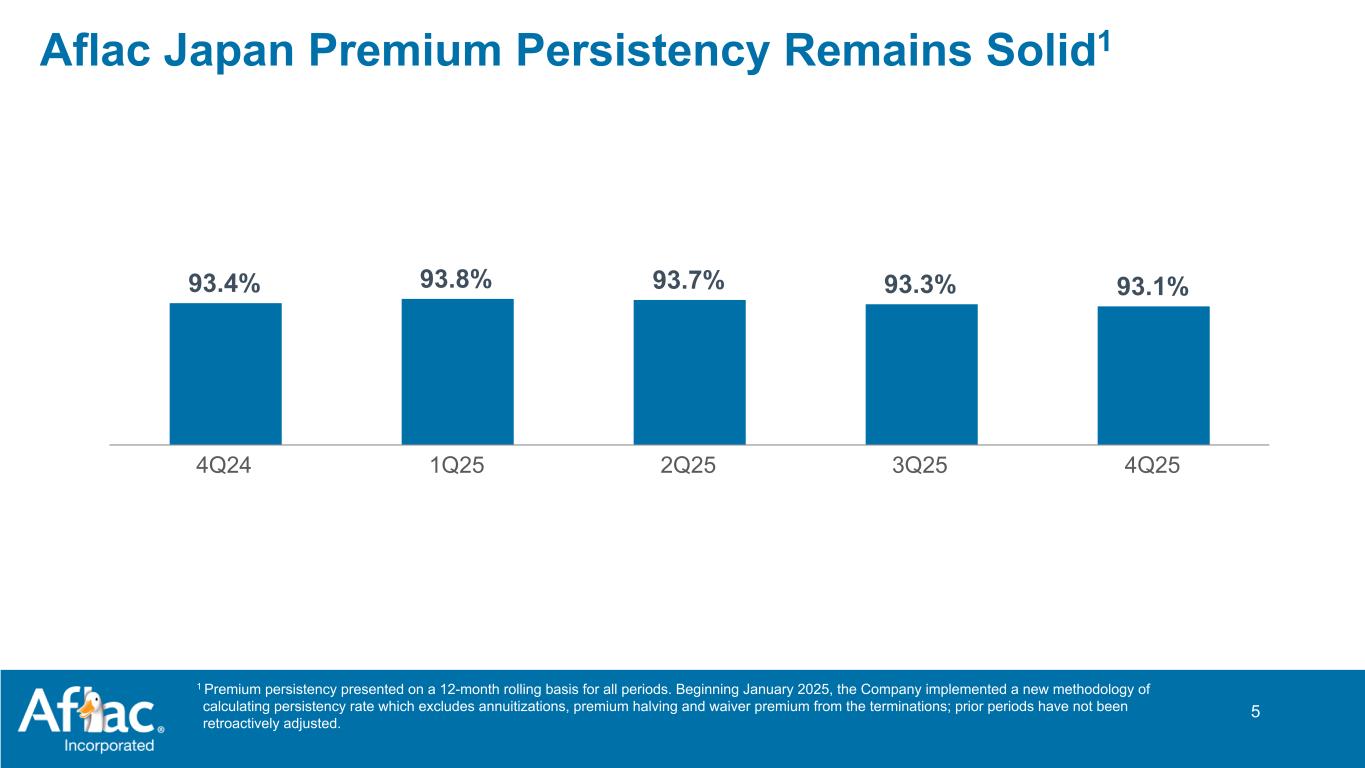
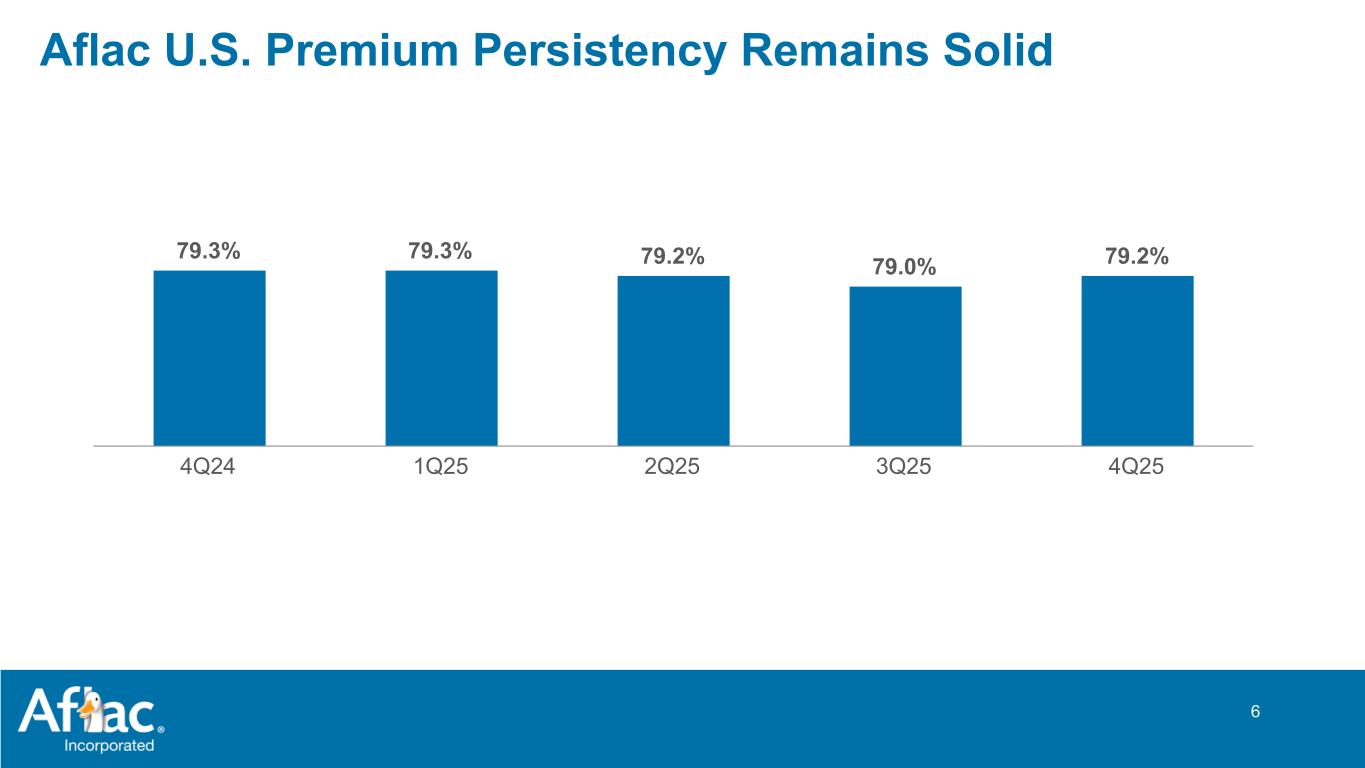
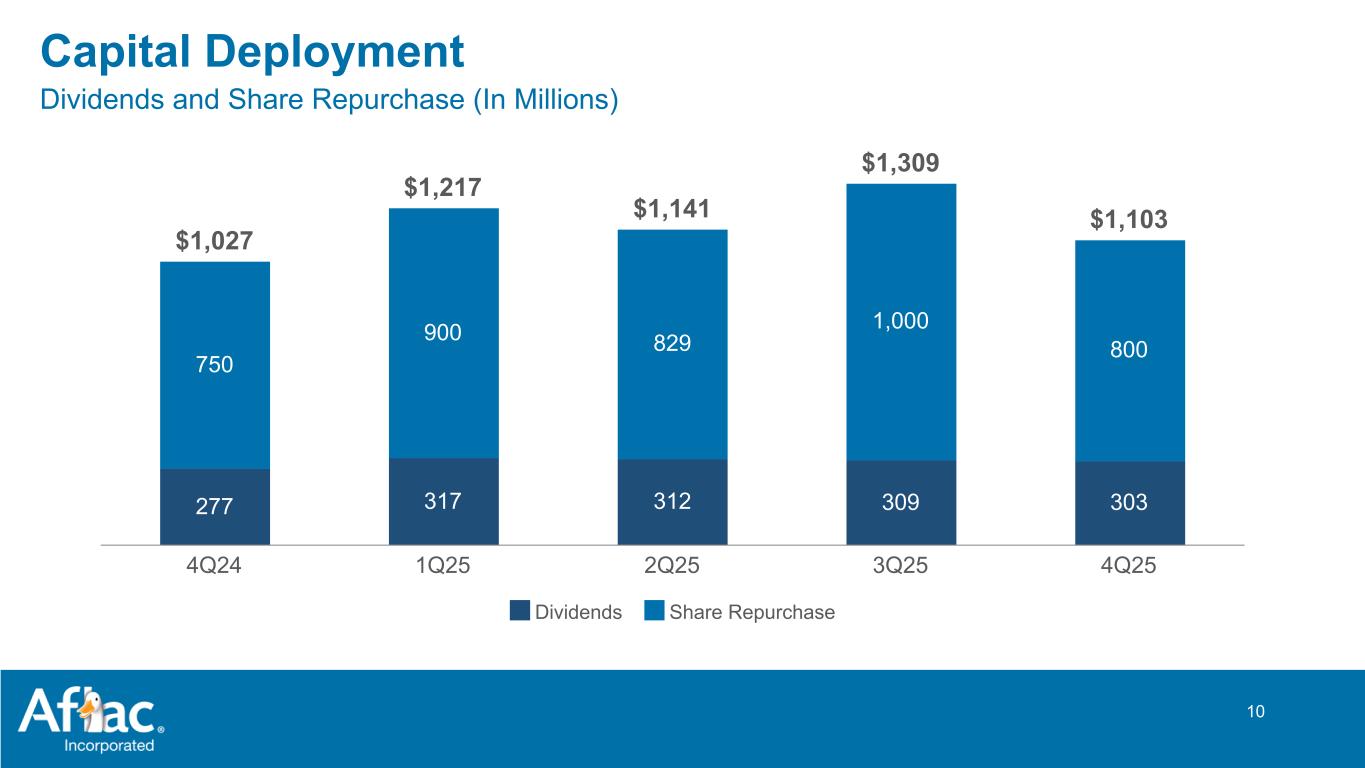
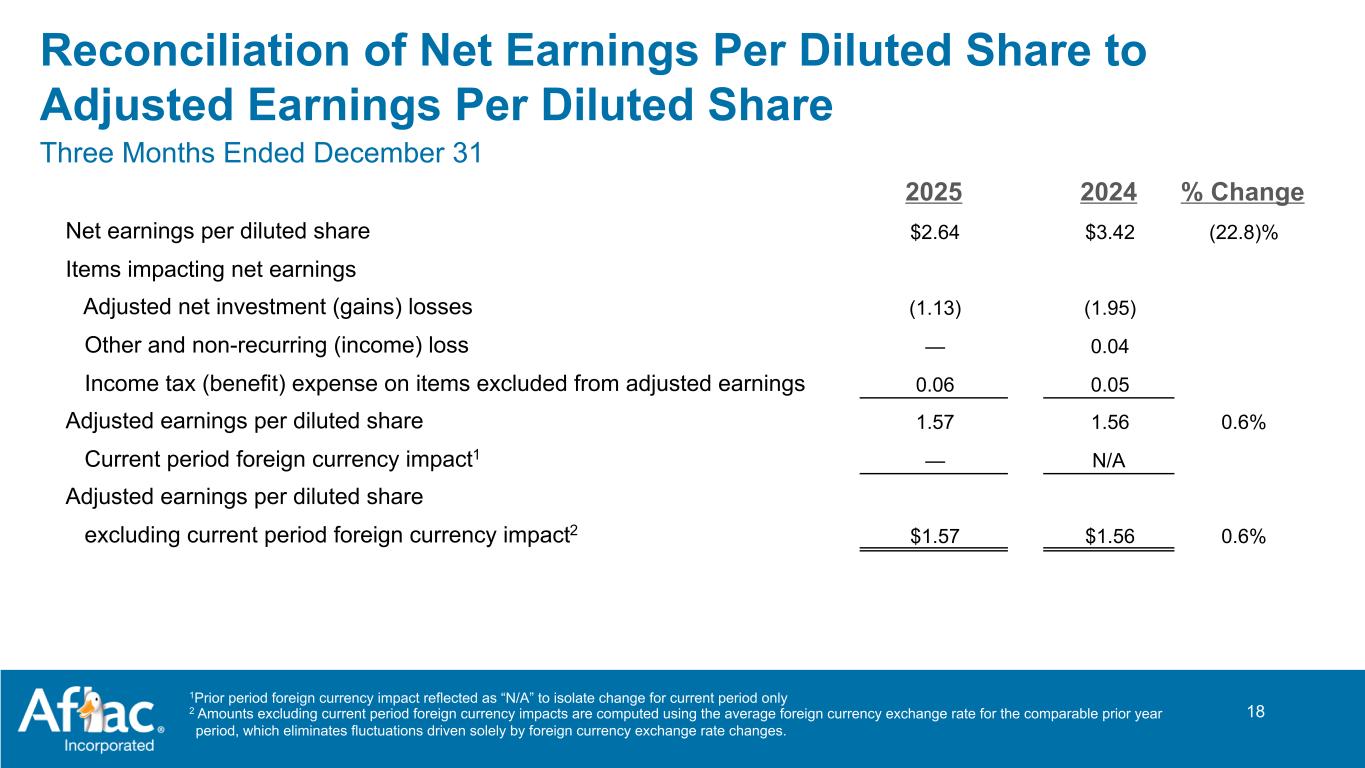
Thank you, David, and good morning, everyone. We're glad you joined us. AFLAC, Inc. reported fourth-quarter net earnings per diluted share of $2.64 and adjusted earnings per diluted share of $1.57. For the year, AFLAC, Inc. reported net earnings per diluted share of $6.82 and adjusted earnings per diluted share of $7.49. since. Max will expand upon these strong results for the quarter in a moment, but before he does, I'd like to comment on our operations. Beginning with Japan, I am very pleased with AFLAC Japan's sales increase of 15.7% for the fourth quarter and 16% for 2025. These strong sales results were driven largely by the remarkable 35.6% sales increase mainly due to Marito, our latest cancer insurance product, launched in March. While still early, we are also excited about the positive reception our newest medical product, Anshin Palate, has received since its late December introduction. As part of our ongoing strategy, we also continue to emphasize and promote the importance of third sector protection to new and younger customers with our innovative first sector product, Sumitas, which was repriced in September. However, while premium persistency reflected lapses tied to the launch of Moraito, it still remained strong at 93.1% for the year. Our success with so many policyholders who realized the value of Aflac's products and keep them is a testament to Aflac's reputation, our strategy, and our customers' recognition of the value of our products. By maintaining this level of persistency while adding new premium through sales, we look to offset the impact of reinsurance and policies reaching paid-up status in the future. Maintaining strong persistency continues to be vital to the future of Aflac Japan. For the year, we also saw an increase in sales through each distribution channel. Being where the customer wants to buy insurance has always been an important competitive strength of our growth strategy in Japan. Our broadened networks of distribution channels, including agencies, alliance partners, and banks are dedicated to continually optimizing opportunities to help provide financial protection to Japanese consumers. We will continue to work hard to support each channel as we evolve to meet customers' changing needs. Overall, I believe we have put in place the right people and the strategy to meet our customers' financial protection needs through their different stages of life. Turning to AFLAC U.S., we generated nearly $1.6 billion in new sales in 2025, over one-third of which came from the fourth quarter. More importantly, we maintained strong premium persistency of 79.2% and increased net earned premiums by 2.9% for 2025. We continue to focus on driving our profitable growth by exercising a strong underwriting discipline and maintaining strong premium persistency. We believe this will continue to drive net earned premium growth. At the same time, AFLAC-US has continued its prudent approach to expense management and maintaining a strong pre-tax margin as MAX will expand upon shortly. In both Japan and the United States, consumers continue to face financial hardships due to increasing out-of-pocket medical expenses. That is exactly where we come in as partners to be there when our policyholders need us most. As the pioneer of cancer insurance and the leader in the industry, our management teams, employees, and sales networks approach every day as a chance to help our policyholders fill the gap during challenging times, providing not just financial protection, but also compassion and care. At the same time, we generate strong capital and cash flows on an ongoing basis while maintaining our commitment to prudent liquidity and capital management. We continue to be pleased with our investments, producing solid net investment income. As an insurance company, our primary responsibility is to fulfill the promises we make to our policyholders while being responsive to the needs of our shareholders. Our financial strength is the foundation that backs up our promise to our policyholders, balanced with the financial flexibility and tactical capital deployment. I am very pleased with the company's financial strength, which supports our capital deployment, including the board's decision to increase the first quarter of 2026 dividend by 5.2%. In 2025, Affleck, Inc. deployed a record $3.5 billion to repurchase 33 million shares of our stock and paid dividends of $1.2 billion. We treasure our 43 consecutive years of dividend increases and remain committed to extending this record. Combining share repurchase and dividends, we delivered nearly $4.8 billion back to the shareholders in 2025. In doing so, we have maintained our position among companies with the highest return on capital and the lowest cost of capital in the industry. 2025 also marked three significant milestones for AFLAC, the 70th year since the company's founding, the 30th anniversary of what is now AFLAC Cancer and Blood Disorders Center of Children's Healthcare of Atlanta, and the 25th anniversary of the AFLAC Duck. Each of these noteworthy milestones demonstrates the staying power of the financial protection AFLAC's products help provide and the privilege of helping enrich the lives of millions of people. In today's complex healthcare environment, our relevant products, financial strength, powerful brand, and broad distribution network uniquely positions Aflac as the ideal partner for consumers as they navigate the financial strain from out-of-pocket medical costs. The enduring foundational strengths of our business and our capacity for continued growth in Japan and the U.S., two of the largest life insurance markets in the world, support our leading position and build on our momentum. I will now turn the program over to Max to cover more details of the financial results.
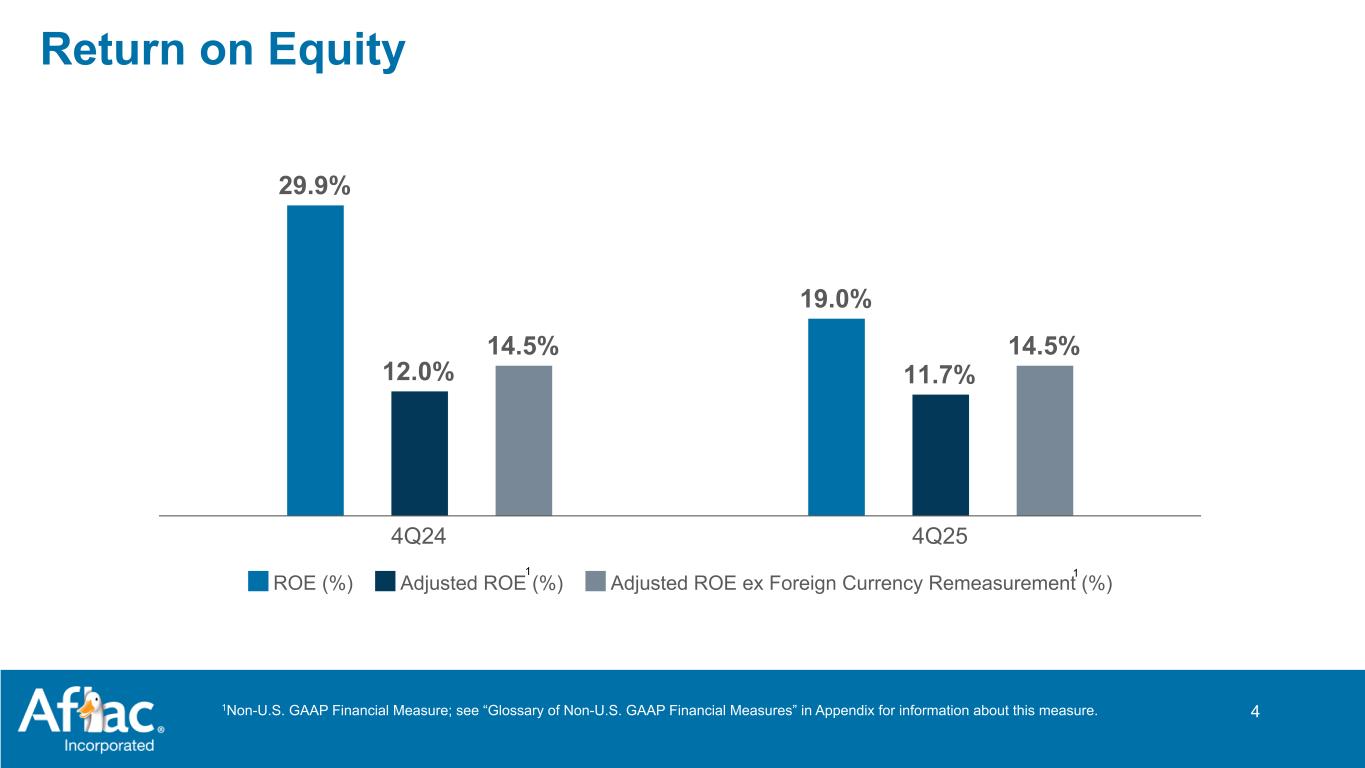
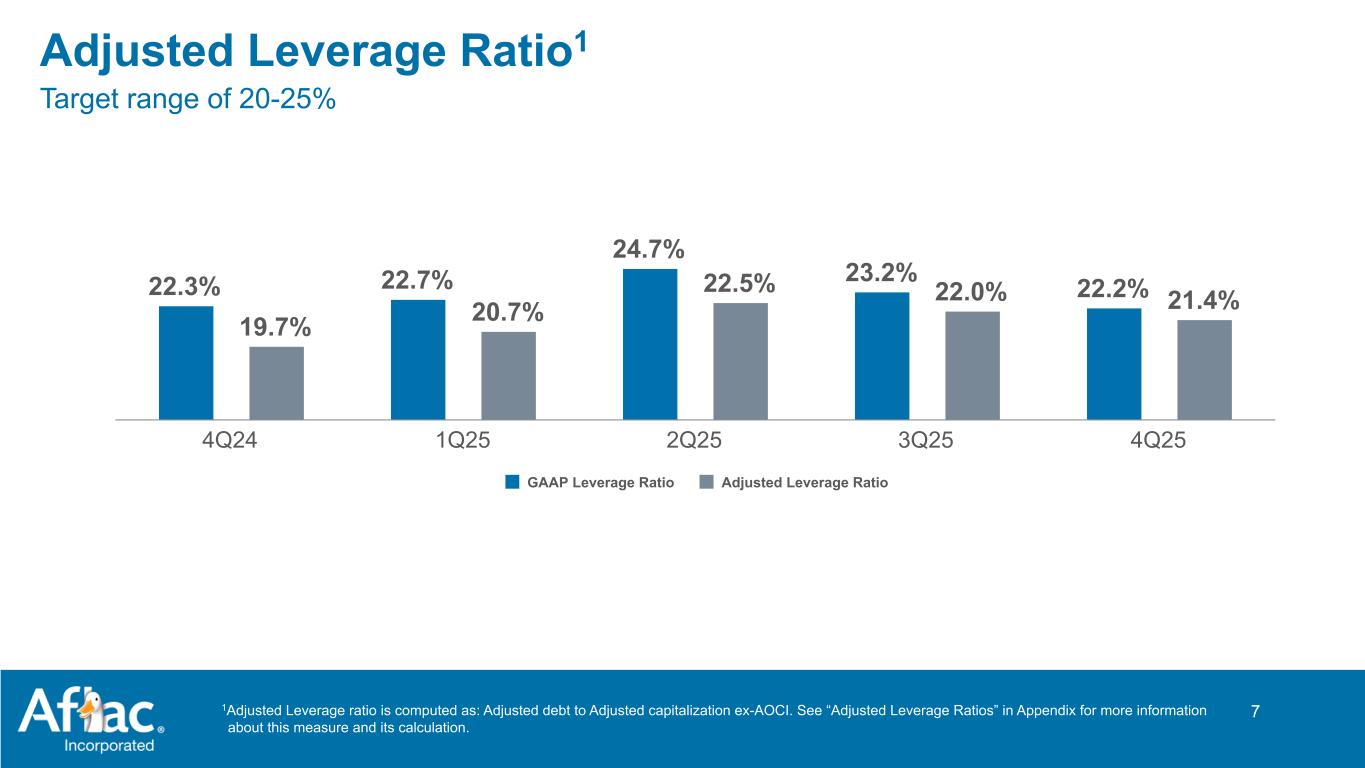
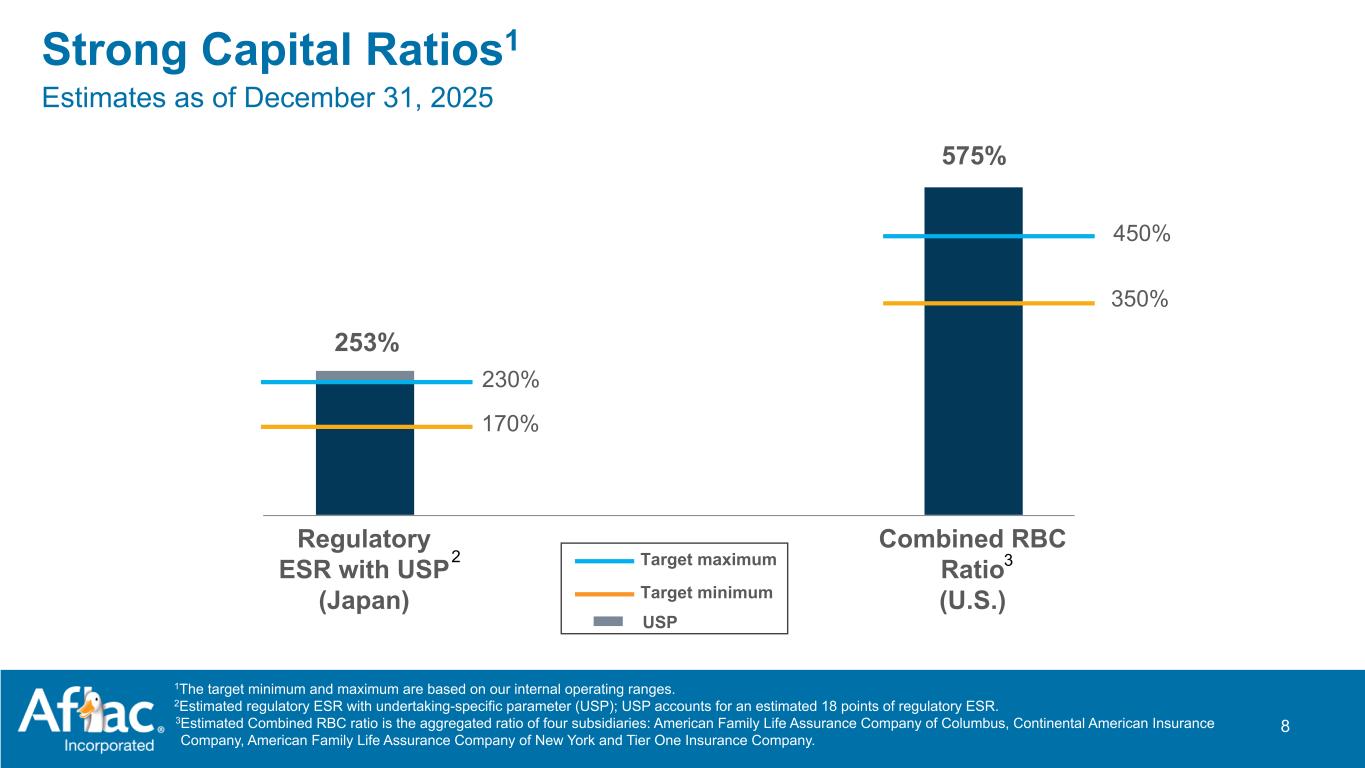
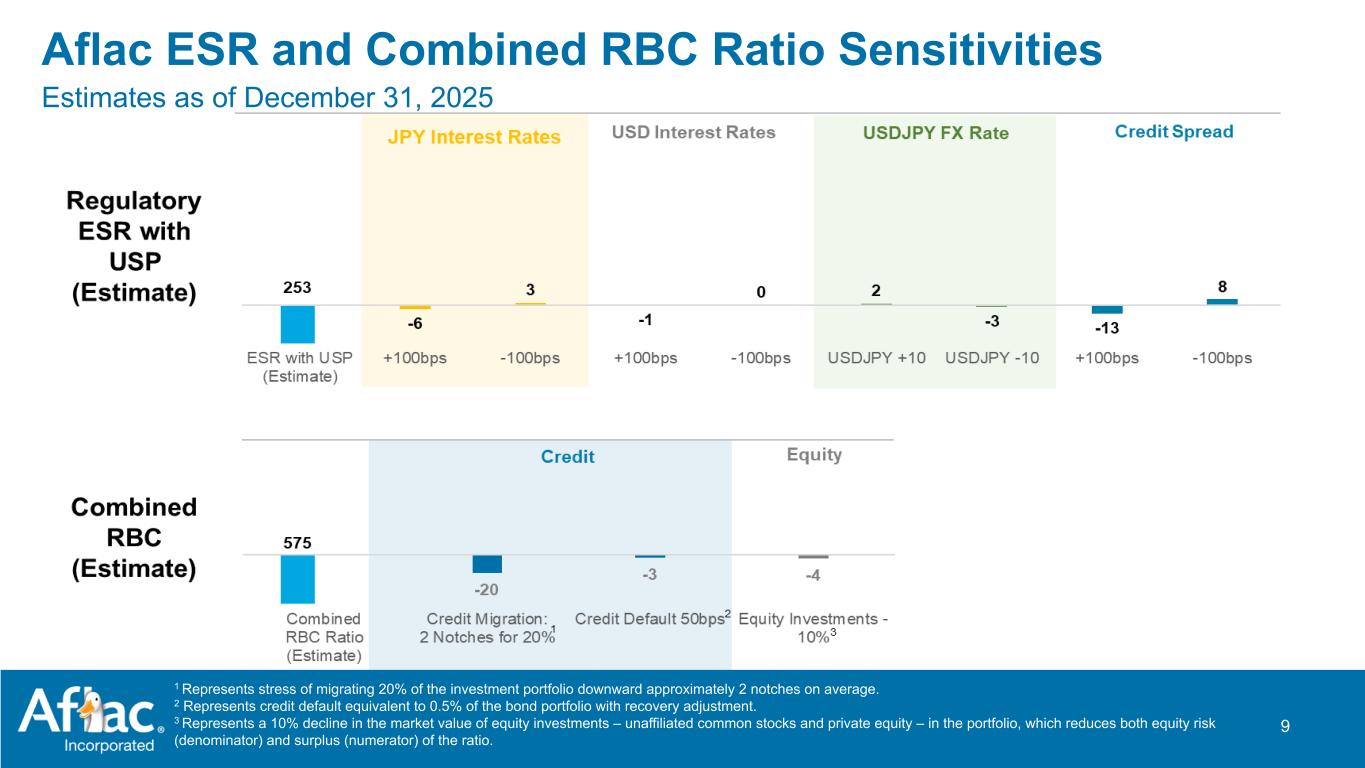
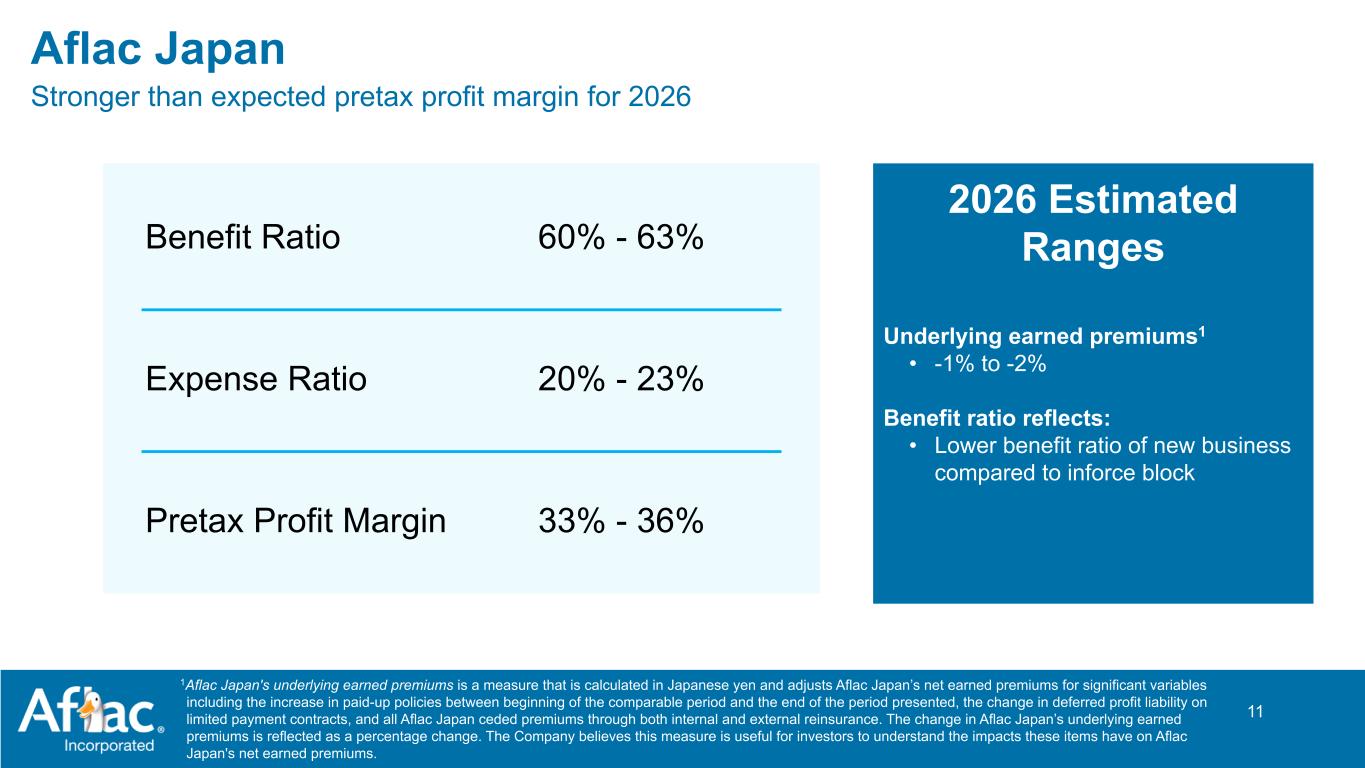
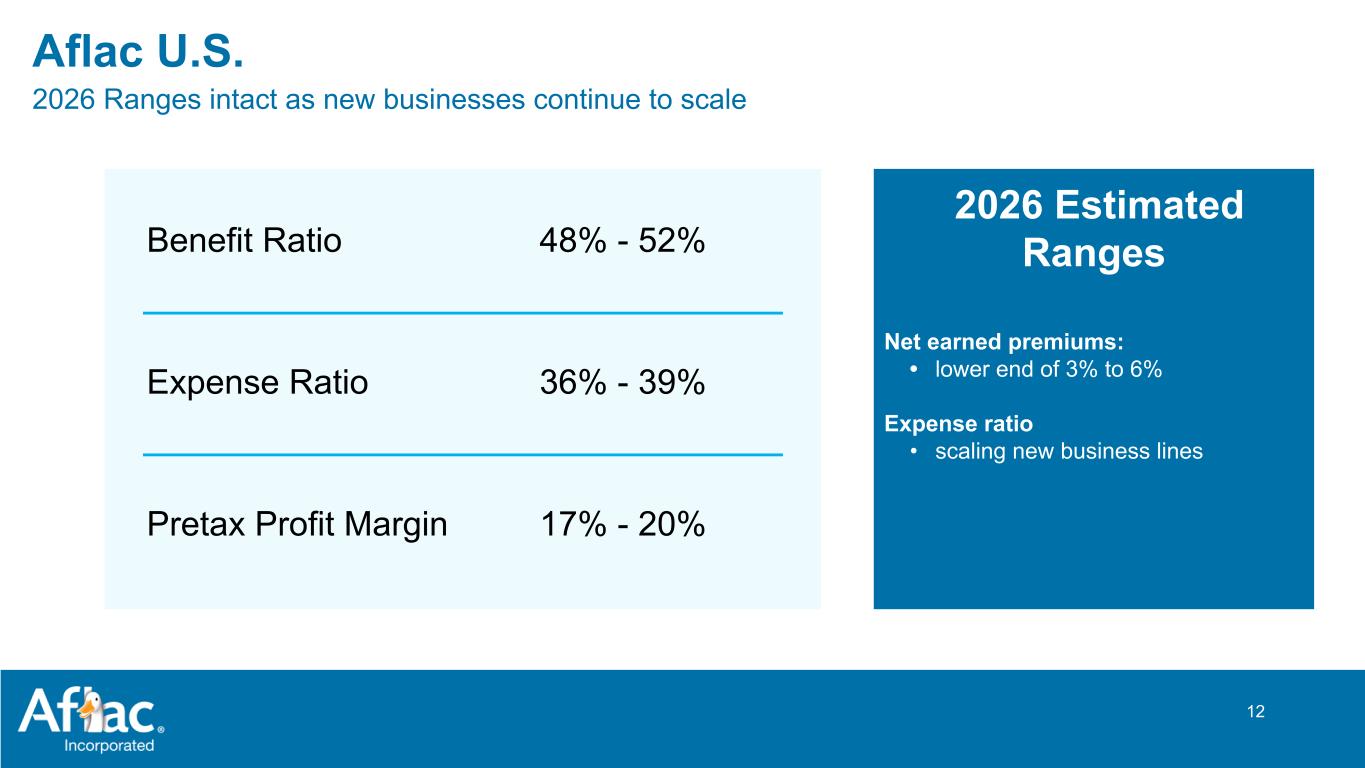
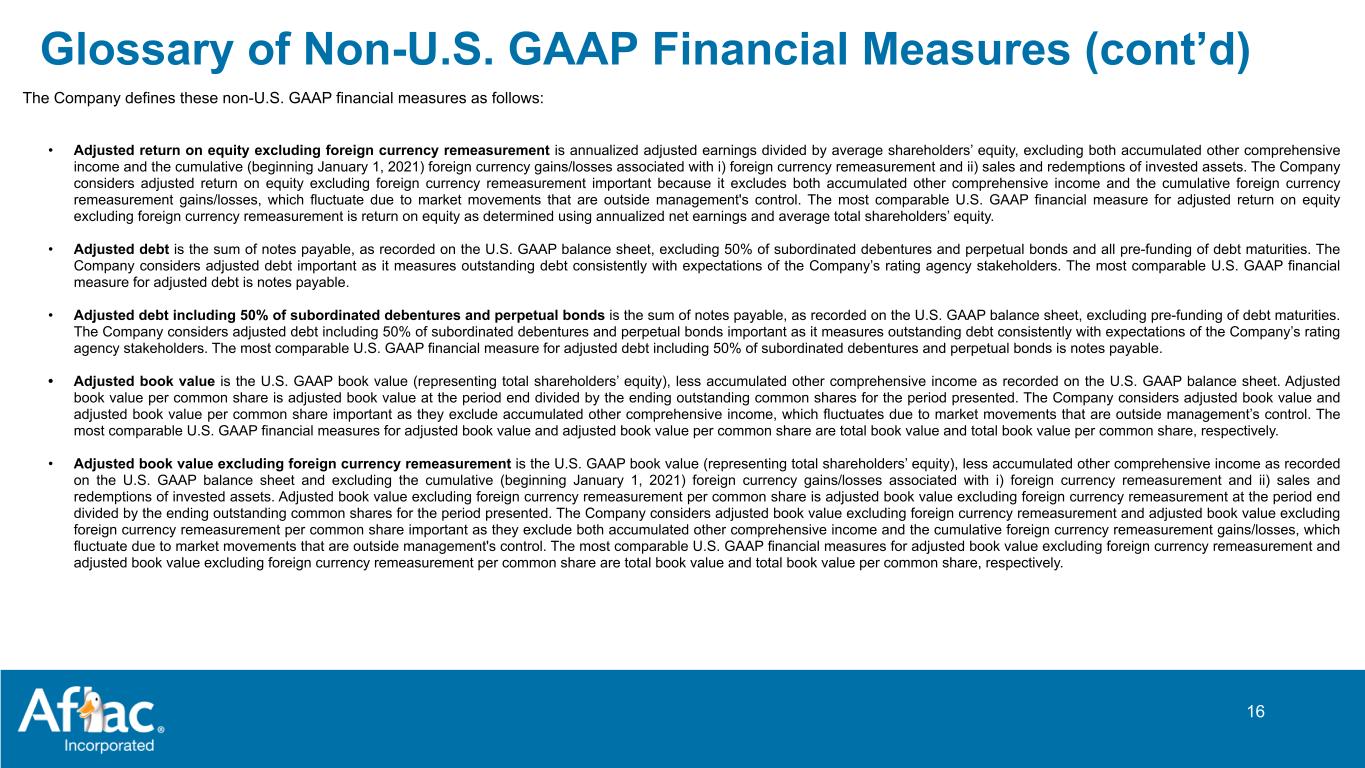
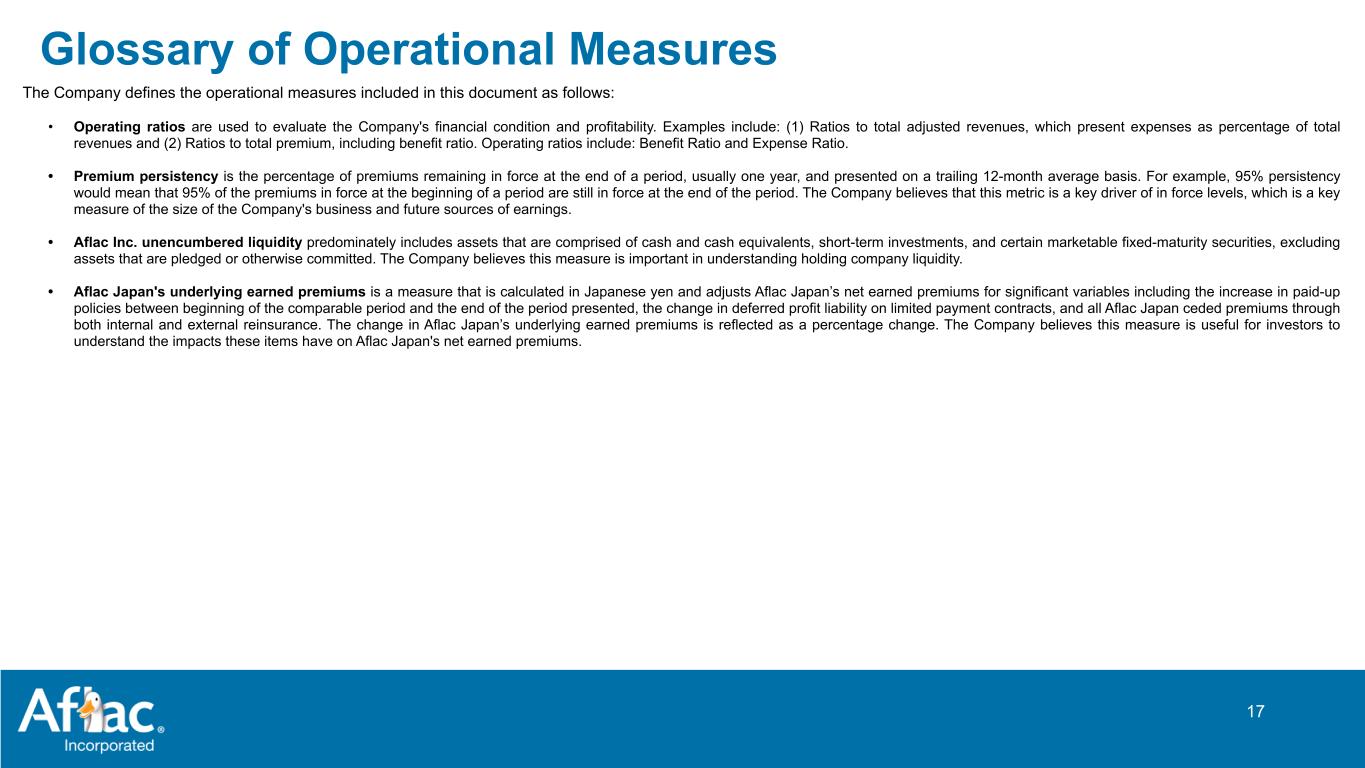
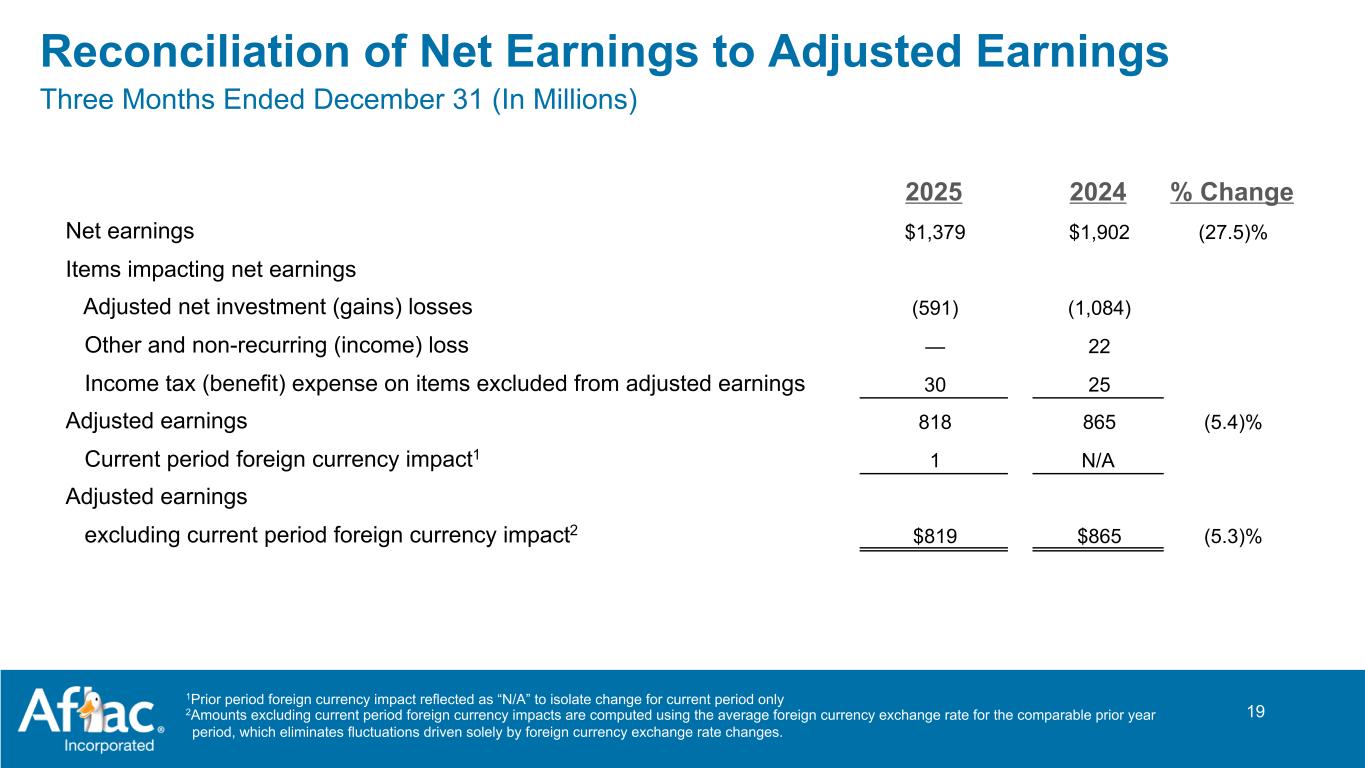
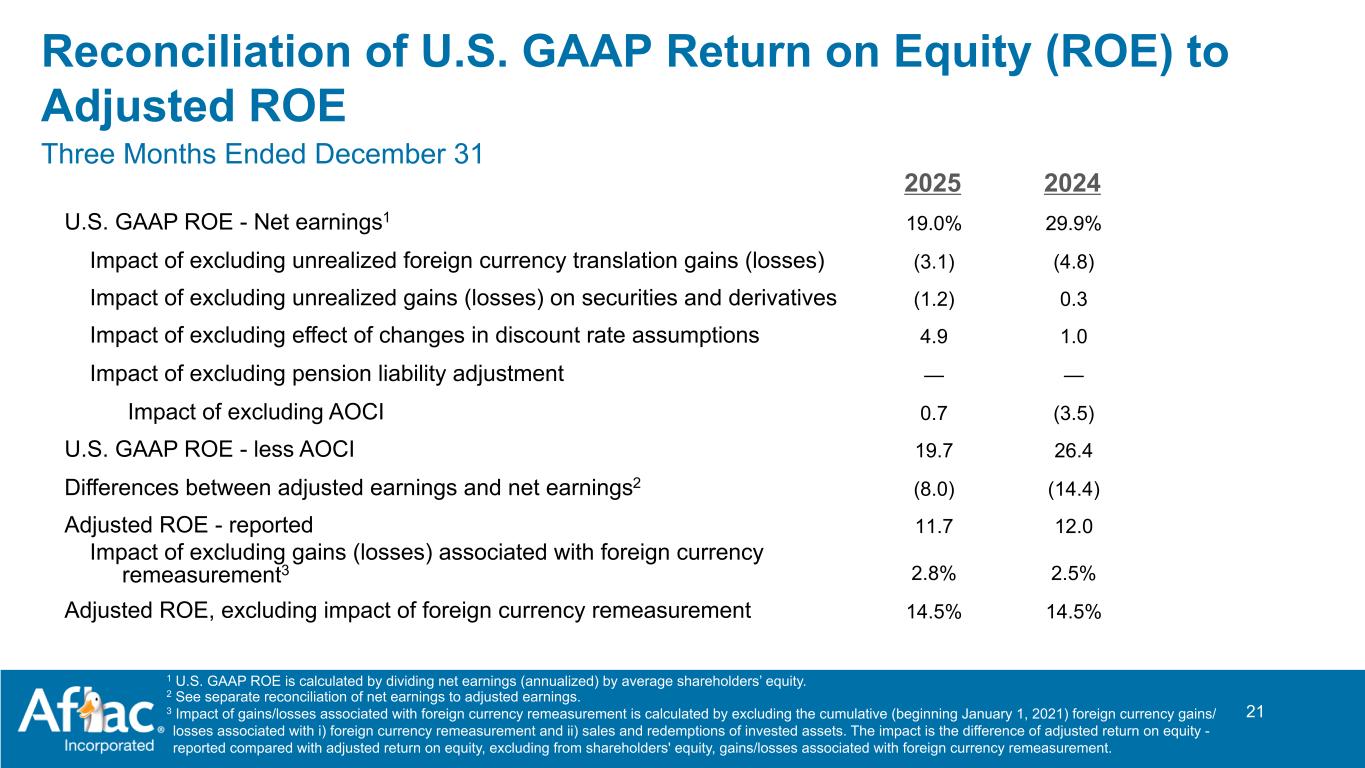
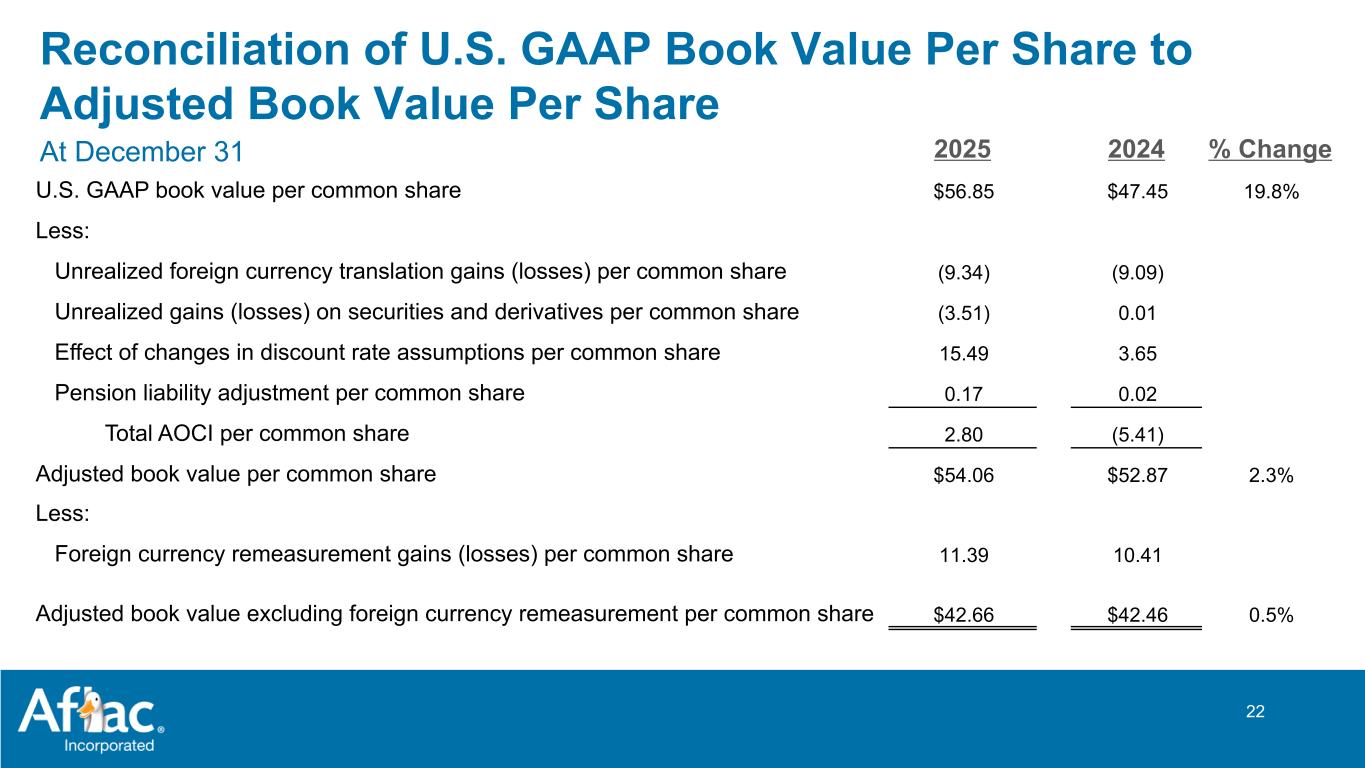
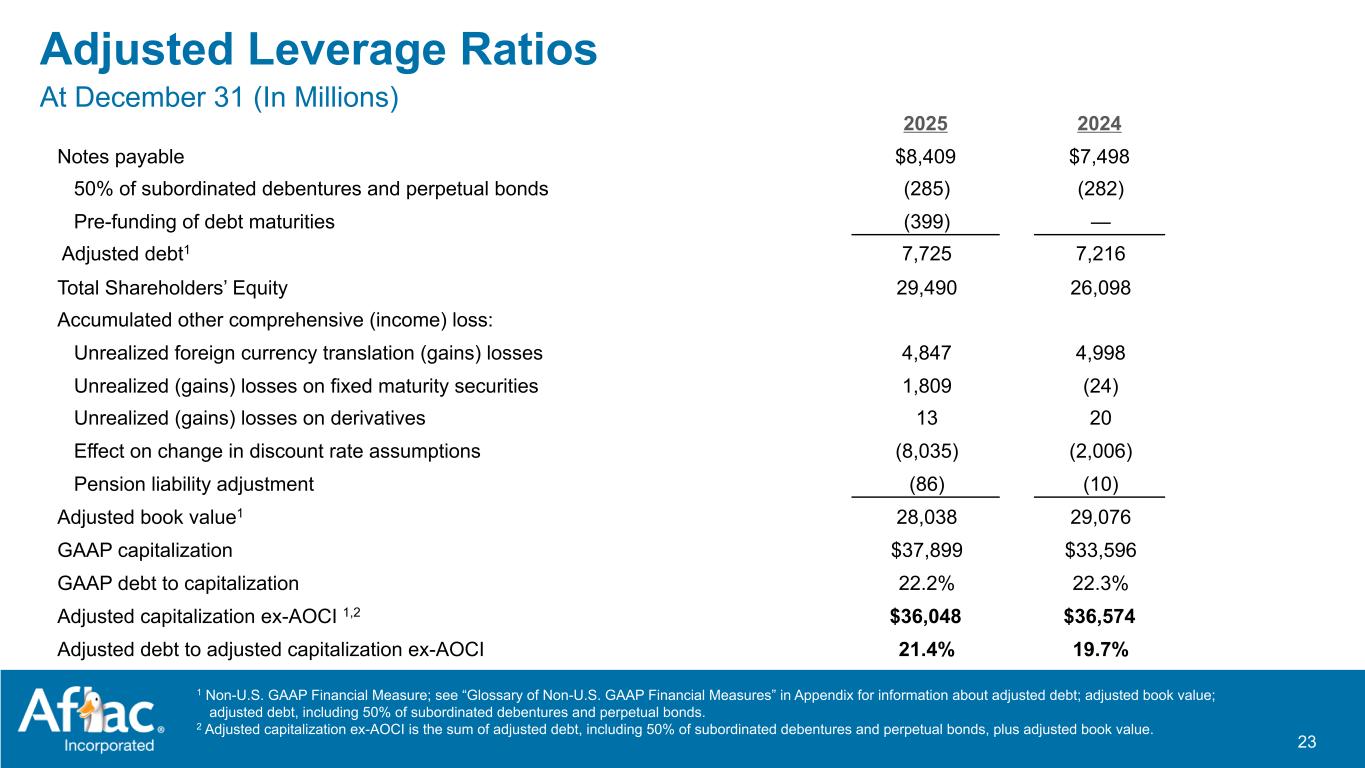
Max? Thank you, Dan. For the fourth quarter of 2025, adjusted earnings per diluted share increased 0.6% year-over-year to $1.57, excluding effect of foreign currency in the quarter. In this quarter, remeshment gains on reserves totaled $36 million, reducing benefits. Variable investment income ran $12 million below our long-term return expectations. Adjusted book value per share, excluding foreign currency re-measurement, increased 0.5%. The adjusted ROE was 11.7% and 14.5%, excluding foreign currency re-measurement. A solid spread to our cost of capital. Overall, we view these results in the quarter as solid. it. Starting with our Japan segment, net earned premiums in yen terms for the quarter declined 1.9%. Affleck Japan's underlying earned premiums, which excludes the impact of deferred profit liability, paid-up policies, and reinsurance, declined 1.2%. We believe this metric provides a clearer insight into long-term premium trends. Japan's total benefit ratio can mean at 65% for quarter, down 150 basis points year over year. We estimate the impact from reserve remeasurement gains to be approximately 110 basis points favorable to the benefit ratio in Q4 2025. Long-term experience trends as they relate to treatments of cancer and hospitalization continue to be in place, leading to continued favorable underwriting experience. Persistency remains solid year over year and in line with our expectations at 93.1%. With refreshed product introductions, we generally see an uptick in lapse and reissue activity, causing reported lapsation to increase. We did experience this uptick with our recently launched cancer insurance product, but overall lapses remain within our expectations. Lapses on our first sector savings block remain low and in line with previous periods, despite the increase in yen interest rates. Our expense ratio in Japan was 22% for the quarter, up 120 basis points year-over-year, driven primarily by sales promotion expenses associated with higher sales. For the quarter, adjusted net investment income in yen terms was down 3.9%, primarily driven by lower floating rate income on our U.S. dollar book and lower variable investment income, partially upset by higher U.S. dollar fixed income due to higher volume. The pre-tax margin for Japan in the quarter was 31.3%, down 30 basis points year over year, a very good result. Now turning to U.S. results, net-end premiums were up 4%, while premium persistency declined slightly by 10 basis points year over year. It remains strong at 79.2%. Our total benefit ratio came in at 48.6%, 230 basis points higher than Q4 2024, driven by prior year endorsements and higher claims activity on our individual voluntary block, as well as a higher benefit ratio on group life and disability. We estimate that reserve remeasurement gains impacted the benefit ratio by approximately 140 basis points in the quarter. Our expense ratio in the U.S. was 40.4%, up 10 basis points year-over-year, primarily driven by timing of spend from previous quarters. Our growth initiatives, group life and disability, network dental vision, and direct-to-consumer increased the expense ratio by 60 basis points in the quarter. This is in line with our expectations, as these businesses continue to scale. Adjusted net investment income in the U.S. was down 2.8% for the quarter, primarily driven by a reduction in floating rate assets and corresponding rates. Profitability in the U.S. segment was solid with a pre-tax margin of 17.4%, a 230 basis points decrease compared with a stronger quarter a year ago. In corporate and other, we record a pre-tax adjusted loss of $31 million in the quarter. Total premiums decreased on closed blocks of business. Adjusted net investment income was $1 million higher than last year due to a combination of lower volume of tax credit investments and higher asset balances. Our tax credit investments impacted a net investment income line for U.S. GAAP purposes negatively by $43 million in the quarter, with an associated credit to the tax line. The total fourth quarter earnings benefit from tax credit investments was $13 million. Adjusted earnings declined due to lower revenues and higher adjusted expenses, driven primarily by higher costs pertaining to business operations and higher interest expense, partially offset by lower net benefits and claims. We continue to be pleased with the performance of our investment portfolio. During the quarter, we did not record any charge jobs for the commercial real estate portfolio. Additionally, we did not foreclose on any properties in the period. On our portfolio of first lien senior secured middle market loans, we recorded charge-offs of $22 million in the quarter. For U.S. statutory, we recorded a $3 million valuation allowance on mortgage loans as an unrealized loss during the quarter. On a Japan FSA basis, there were net realized gains of $380 million for securities impairments in Q4, and we booked a valuation allowance of $87 million related to transitional real estate loans. This is well within our expectations and has a limited impact on regulatory earnings and capital. In the third quarter of 2025, we enhanced our liquidity and capital flexibility by $2 billion with the creation of two off-balance sheet pre-capitalized trusts that issued securities commonly referred to as PCAPs. With increased off-balance sheet capital resources and improved liquidity flexibility we have lowered our minimum liquidity balance at the holding company by 750 million dollars to 1 billion dollars this means that Aflac Inc unencumbered liquidity stood at 4.1 billion dollars which was 3.1 billion dollars above our minimum balance at the end of the quarter the The full PCAP facility remains undrawn. Our adjusted leverage was 21.4% for the quarter, which is within our target range of 20-25%. As we hold approximately 63% of our debt in yen, this leverage ratio is impacted by moves in the yen-dollar exchange rate. This is intentional and part of our enterprise hedging program, protecting the economic value of AFLIC Japan in U.S. dollar terms. Our capital position remained strong. We ended the quarter with an SMR above 970 percent and an estimated regulatory ESR with the undertaking specific parameter, or USP, of 253 percent. We estimate that the USP benefits the regulatory ESR by 18 points. We estimate our combined RBC to be 575%. These are strong capital ratios which we actively monitor, stress, and manage to withstand market volatility and credit cycles as well as external shocks. We last updated our ESR sensitivities at our financial analysts briefing in December 2024. Since then, we have seen significant movements in both the dollar-yen and yen interest rates. So we wanted to provide an updated estimate before the ESR comes into effect on March 31st. We have deliberately improved our ALM during this time, which has led to reduced exposure to interest rate risk. We generally have lowered our sensitivities to market risk factors. We have also refreshed the sensitivity analysis related to our combined RBC ratio in the U.S. I will characterize these refreshed estimates also as being in line with what we shared at FAB in December 2024. Given the strength of our capital and liquidity, we repurchased $800 million of our own stock and paid dividends of $303 million in Q4, offering good relative IRR on these capital deployments. We will continue to be flexible and tactical in the way we manage the balance sheet and deploy capital in order to drive strong risk-adjusted ROE with a meaningful spread to our cost of capital. Before concluding, I would like to address our 2026 outlook. At our 2024 financial analyst briefing, I've provided ranges for net earned premiums, benefits and expense ratios, and pre-tax profit margin for each segment for 2025 through 2027. These ranges remain substantially intact for 2026, but with a couple of exceptions. For AFLIC Japan, we expect underlying earned premiums to decline 1% to 2% in 2026, and we also expect the expense ratio to be in the 20% to 23% range. However, we expect the benefit ratio in Japan to be in the 60% to 63% range and the pre-tax profit margin to be in the 33% to 36% range. In the U.S., we continue to expect net earned premium growth to be in the lower end of the 3% to 6% range. We also expect the benefit ratio for 2026 to be in the 48% to 52% range and the expense ratio to be in the 36% to 39% range as we continue to scale new business lines. At the same time, we expect pre-tax profit margin for 2026 to be in a range of 17% to 20%. Thank you. I will now turn the call back over to David for Q&A.
Thank you, Max. Before we begin our Q&A, we ask that you please limit yourself to one initial question and a related follow-up. You may then rejoin the queue to ask additional questions. We will now take the first question.
Operator
And ladies and gentlemen, we'll now begin that question and answer session. To ask a question, you may press star and then one. To withdraw your questions, you may press star and two. Our first question today comes from Wes Carmichael from Wells Fargo.
Please go ahead with your question. Hey, good morning. I had a question on the Japan business, and Max, I think you touched on this a little bit in your prepared remarks, but in particular in savings products, Waze, first sector, You know, we've seen super long yields in Japan rise pretty considerably, and I think more broadly there's some concern that we could see additional, I guess, surrenders with interest-sensitive products. So, curious if you expect higher levels of surrender going forward. I know that was pretty stable recently.
Great question. Yes, obviously we've seen quite significant moves up, especially at the long end of the yen yield curve lately. And if everybody is 100% efficient in their behavior, you would expect both demand and potentially a lapsation of in-force policies to increase somewhat. We have not experienced that yet, but obviously it's something that we closely monitor and prepare the company for.
Got it. Thank you. And my follow-up's just on capital. It seems like you've got a lot of flexibility in terms of regulatory solvency in Japan and the U.S., but also at the parent, too. And you continue to be pretty tactical with the buyback. But curious, if once ESR is printed in 2026, is there any change to the thinking around M&A or capital deployment, just given the capital flexibility you have? And maybe what could be incremental for you?
You know, from a capital standpoint, we've been traveling with significant capital for quite some time. And we continue to both enhance and increase the flexibility of both the sources and how we can use that as well. When it comes to M&A, that's predominantly an operational and strategic question, and that secondarily is a financial question. So the way we evaluate M&A, it really goes through those lenses, and it needs to take all those boxes. But the fact of the matter is, do we have capital available if we wanted to do something? That is absolutely true. But I would also acknowledge that we are operating in a relatively narrow niche, both in the United States and in Japan. And to sort of find operational and strategic targets within those niches is relatively difficult to find. So we continue to obviously evaluate things, but for the time being, we're very happy with the businesses that we have.
Operator
Our next question comes from John Barnage from Piper Sandler. Please go ahead with your question.
Good morning. Thank you for the opportunity. My question is around Japan. Can you maybe talk about the lower benefit ratio embedded in the guidance? and I think it's based on Japan new business versus the enforced block. I know there's been some repricing and new products being introduced, but how enduring does that benefit seem to be? Thank you.
Thank you, John. So there's a couple of factors that is pushing our benefit ratio down on a gap basis in 2026. The first one I would put in a more permanent category, And that is, as we updated our actuarial assumptions in the third quarter of 2025, we lowered the net premium ratio by about 130 basis points. That is for the full enforced block, and that was obviously a one-timer in the third quarter, but it also feeds through into the future net premium ratio as well. So that is directly impacting the benefit ratio for future periods by 130 basis points lower, all things being equal. The other impact is with new product introductions that we've seen on our cancer product. And as we now introduce our medical product, we've seen an elevation of lapse and reissue activity when those product introductions take place. when you have lapse and reissue increase and the old policies that lapses and we will then release the reserves associated with those policies and it runs through our gap financials lowering the benefit ratio and generally speaking we have lower reserves on our older policies than the new policies that we are reissuing so that also has an impact the last piece is if you go back and analyze our full in force, we did sell quite a lot of life insurance savings policies in the years 2010 through 2016, and this is the old waste product. That waste product runs through our gap financials with a very high benefit ratio. On an economic basis, it carries a significantly lower benefit ratio, but on a gap basis, it's very high. That block obviously is in runoff, And as that block shrinks, then obviously the mixed impact is such that our total benefit ratio is then lower. So I will characterize those three factors as the main factors for the lower benefit ratio expected in 2026.
Thanks, Max. my related follow-up sticking with japan uh on distribution looks like sumitaso got repriced and ancient palette got introduced can you talk about what you see as a total addressable market for these new products and then within the context of mariacto uh an ability do you need to reprice that thank you thank you for your question This is Yoshizumi speaking from marketing and sales divisions of Affleck Japan.
As you mentioned, we went through a rate revision last September.
And since then, sales are growing steadily. and the purpose of watching Sumitas is to respond to the citizens' needs of asset formation as the government is also promoting people to shift from saving to investment. So our purpose was to encourage those young and middle-aged generation to promote such activities. So our market audience will be those individual customers who seek for yen denominated level payment products. But in fact, actually, the Tsumitas is also gaining popularity from middle age to older generation. This is a result from gaining attention and popularity from affluent customers who prefer to pay with the DAP or discounted advanced premium option. One of the Tumitas strengths is the fact that we can change the premium rate in a timely manner with agility. So going forward, whenever we see a necessity given the interest rate, given the interest rate market situation, when time comes, we will increase or decrease our premium rate as necessary. That's all from me.
This is Dan. Let me just make a couple of comments about sales to have a more concise way of you looking at it. But Moraito, our newest cancer policy, did terrific, better than we even thought. And we feel like it was a product that was wanted and needed by the consumers, and that's what's driving it. Saying that, we had enormous sales in 2025, and we would expect sales to be more level. where I think you'll see an increase in sales will be at the medical product. And also the potential is for sumitas, depending on what interest rates do. But that has the potential. But overall, cumulatively, we expect a good year in Affiliate Japan in regard to sales and the job they're doing. And I want to personally thank all of them on the other end from Japan for the job that they did in 2025 in setting an enormous record for us to work toward again in 2026.
Operator
Our next question comes from Joel Hurwitz from Dowling and Partners. Please go ahead with your question.
Hey, good morning. Wanted to touch on U.S. sales. So the overall growth track, pretty in line with what you guys saw in the first three quarters of the year, but it It looks like the supplemental health growth was better while disability sales were down. Virgil, can you just talk about what you saw in terms of sales in the quarters and, I guess, any color on how the group life and disability and dental sales were versus expectations?
Yes. Good morning. Thank you, Joel. Let me just give an overview of sort of the performance throughout, and I'll give you a little bit more detail of some of the numbers behind the scenes. Again, overall for the year, we did $1.6 billion overall. So I'm pleased with that sales number, how we came out. And when you asked about the buy-the-bill specifically, they made up 20% of the overall So what am I calling the buy-the-bill? Just a reminder, the life absence and disability. And overall for the year, that line of business was up 11.3%. Network Dental and Vision, but just the dental product itself, a network, was up 48.8% for the year. And then our direct-to-consumer platform, we refer to as Consumer Markets, was up 10.5%. So that's where I get to combine 20% of total of the $1.6 billion. So overall, I am very pleased with how those businesses performed. And a lot of that sales in that life and disability was sales of a life product, to your point. But again, definitely overall good performance. The other thing I would say to you is when you look at the year, you know, it was pretty much consistent. We ended up overall 3.1%, but we did have good earned premium growth of 4% during the quarter, right at, you know, 2.9 to 3 for the year. Persistency remained strong, 79.2%. So when I look at the overall, I look at a good, solid, balanced performance for the year for us.
Okay, great. And then, Max, just a quick one on ESR. In your prepared remarks, you had said that the uplift from the USP was 18 points. I think the last time you disclosed it was a couple of quarters ago, it was 30 points. Can you just take us through the drivers of the decline in that?
The main driver of that decline is related to the level of yen interest rates. So as yen interest rates go higher, the impact from the USP will decline a little bit.
Operator
Our next question comes from Jack Matten from BMO. Please go ahead with your question.
Hi, good morning. I just did one follow-up on the Japan benefit ratio. Any way for us to think about the statutory or economic margin change that you're seeing? I know there's different dynamics between how the ways product accounting works and the net premium ratio change is also a big driver, but the GAAP update. But just wondering, putting it all together, are you still seeing a better trend on a statutory margin basis?
Yeah, so the main difference between the FSA benefit ratio and the US GAAP benefit ratio, it relates to the net premium ratio. So what I referenced there was that the net premium ratio on a US GAAP basis will lower our benefit ratio by roughly 130 basis points in 2026 relative to the first three quarters of 2025. That impact will not occur on an FSA earnings basis, but the other drivers will. So think about it this way, that essentially when you look at the decline in the benefit ratio in 2026 over 2025, about one-third of that is driven by the lower net premium ratio. The other two-thirds will occur both on U.S. GAAP basis and on an FSA earnings basis.
That's helpful. And just to follow up on your Bermuda entity, I mean, any change to your kind of outlook on how you expect to use that entity over time? I know you've kind of talked in the past about reinsuring up to 10% of your enforce in Japan. Is that limit something you're still evaluating, or could it be revised higher over time?
Yeah, so to date, we've seeded roughly 6% of our AppLite Japan balance sheet to Bermuda. we have a midterm target to get to 10%.
We do not think of that as an absolute limit. I think over time, we will risk assess that number and evaluate if there's a higher internal limit that would make sense for us. The bottom line is that we see significant capacity for continuing seeding business between our subsidiary in Japan and our reinsurance affiliate in Bermuda.
Operator
Thank you. Our next question comes from Sunit Karnoff from Jefferies. Please go ahead with your question.
Great, thanks. That was a helpful caller on the Japan benefit ratio, Max. I appreciate that. I was wondering if you could maybe do the same for the U.S. benefit ratio because the guide is 48 to 52, I believe, and it looks like you've been traveling kind of more in the mid-40% range, So, I don't know if you're assuming some reversion to the mean or something, but just some color on that would be helpful.
So, there's a couple of factors going on impacting the benefit ratio in the U.S., and some of them are for specific lines of business, and some of it is driven by mix of business as well. So we have, as outlined in the script, we have actively increased the benefit ratios on a number of products, utilizing endorsements, also increasing benefits. This applies specifically to our cancer product in the U.S. on an individual basis. It also applies to our accident policy. these products were running very low during the pandemic due to low claims utilization, and we have actively gone in and increased those future benefit ratios associated with those products. So that in itself will continue to push our benefit ratio slightly higher. At the same time, when you look at the total benefit ratio, there's a mixed impact as well. Virgil just outlined that the sales of group life and disability and dental and vision specifically are increasing quite significantly for us. These businesses are gradually becoming an increased proportion of our total in force and they carry a higher benefit ratio than our core voluntary benefits products. So what that means is that over time, that mixed impact will move our benefit ratio slightly higher as well. And you see some of that happening in 2026.
Okay, got it. Then I guess maybe for Virgil or Dan, you know, we're hearing a lot more about this sort of K-shaped economy and sort of given your target market, just wondering what sort of impacts do you expect um in terms of both consumer behavior but also in terms of uh agent recruiting potential thanks yeah this is virgil let me start and let me work backwards then what you just said about the age of recruiting uh so first i would say we were up for the year with our career recruiting uh you know to your point on the environment we certainly monitor inflationary rates.
We monitor unemployment rates. We look at any material impacts. Of course, we look at anything related to interest rates, U.S. dollar rates, but I can't tell you right now that had any material impact on us this year. What we did was we put a deliberate focus on our career channel. We are dedicated and still believe in an agency. We increased it this year in new recruits. we were able to have a higher conversion rate than we normally have. So 16% of those converted into sellers as we go through that process. And then the last thing I'll say is that we increased the productivity. So I totally agree with you that there's, you know, volatility in the market if you look at through these lands, but they had no material impact on us. The other thing I would point out too, though, is that we're also looking at things that we can do to make sure that consumers get access to our products. you see us continue to be dedicated to you know making sure we have a strong brand out in the market did we know that there were some changes this year about 22 million Americans were affected by ACA we still sell our products though alongside major medical we we do not we do not want to see people go uninsured but you need to carry a major medical plan alongside of supplemental health and we did see an increase though in activity coming from that group going to our direct to consumer channel so we want to make sure that we offer our products however people need to get access to them and we did have a 10.5 percent increase in that channel itself so overall i will tell you no material impacts we are certainly making sure that our distribution is still networked through our agency force we remain dedicated to it with recruitment and conversion We have strong relationships with our broker channel. Again, we continue to see increases in broker sales and group sales year over year over year. So, Dan, any further comment?
No, I think we're expecting 2026 to be a good year for us, and we're looking forward.
Operator
Our next question comes from Tom Gallagher from Evercore ISI. Please go ahead with your question.
Good morning. First question is back to Virgil on the U.S. You know, I heard Max's comment that you've had significant increases in group sales. Can you talk about what kind of levels we're talking about here for group versus non-group sales? Yeah, I'm just curious because I'm wondering, you know, if there's like explosive growth in group, what's happening to your voluntary benefits? because the total sales number is still pretty low.
Yeah, thank you for that question. Yeah, so let me start with the voluntary benefits of four traditional products. And remember, we are carrying probably one of the, not probably, we're carrying a large block that other competitors just don't have, which is a great thing for Aflac. That block is certainly produced for Aflac many, many years. It delivers high profitability ranges. We are still committed to that, mainly driven through our agency force. I want to make sure I state that, and we stand committed. We continue to enhance our products there with revising our accident and our cancer products in that space. But what you're saying, though, overall is that our traditional business has been flat to negative for the past few years, including last year. So when you have that anchor of a core business, you don't see the tremendous explosive growth that you are seeing, that we are seeing, though, on the group side. So if you look at isolated just on group policies and products themselves, benefits, the overall growth would have been 14%. We would have been much higher than the industry or any competition. And going underneath that, I'll be more specific as I share some of the numbers. The network dental product is filed as a group benefit. It was up 48.8%. Life absence of disability, if you were to combine that block of business, was up 11.3%. And then the original traditional group benefits we bought, we remember we purchased Continental American, it's now an AFLAC group chassis, more core VB, was up 11.7%. So again, solid growth in the group space, driven by brokers. Our broker relationships are very strong. And as you can see, I'm very, very pleased with those numbers. The focus continues to be two things for us. A, we're going to unify those channels, though. One of the things that we can do a better job of, and we're focused on in 2026, is making sure through that group lens that we give one unified experience. We're investing in a unified experience through platform and technology and also how we go to market. That is one of the things we will continue to work on and deliver. But then the second thing, we're making some additional investment, though, in the traditional business. We're going to continue to enhance our products. We're going to continue to recruit, but we're also enhancing the technology. We've improved our enrollment platform that we just released in the first quarter of this year, and we're expecting that to be a better.
This is Dan. I want to make one other comment, and that is, if you reflect back over the COVID period, and you look at our distribution channel it wasn't the product that changed things it was the number of producers out in the field force selling for us they were pulled away to a degree because it was total commissions and they were shut down and replacing those people has taken some time but we are having success with that and we've been working on the quality of the producers, and they've been producing at a faster pace than our old and new producers, and so that's to give you some context on why that old channel has slowed down. So it's part of recruiting, recruiting, recruiting.
Okay, thanks for that, Dan and Virgil. My follow-up is on Japan. I guess listening, Dan, to you describe the sales outlook in Japan for 26, it sounds pretty good, which follows a very good 25. Curious why that's not translating to better earned premium growth. We're still in that negative 1% to 2% range. On a core basis, are we more likely to see an inflection in 2027?
We're somewhat... So if you think about Japan, it's a very enforced block. And the new sales that we're adding each year is relatively small relative to the total enforced block because of the high persistency that we have. So it takes quite some time for increased sales to sort of get to that level where you're really adding growth to the overall enforced block. COVID had a couple of years where our sales dropped quite significantly and the delta between sales and lapses was significant. And we are closing in on that gap now. And once that turns positive is eventually when we are going to have net earned premium growth in Japan. So we see that within a reasonable future. But even going into 2026, we still expect that lapses will be greater than total sales.
Operator
Okay, thanks. Our next question comes from Alex Scott from Barclays. Please go ahead with your question.
Hey, I just had a follow up on the Japan premium growth. No, no, you got it to sort of the underlying growth, but could you talk about any of the more, you know, I guess non-underlying or non-core parts of it just so we, you know, are making sure we understand how the guidance kind of looks with the actual premiums that'll come in? Because I know there's some paid up policies and maybe reinsurance impact.
I just want to make sure I have that clear so in the guidance that we give on negative one to negative two percent on that metric just to uh to go back to the fourth quarter and we were at the lower end of that or the better end of it at negative 1.2 percent so what we adjust for is the deferred profit liability impacts any paid up impacts and then also any reinsurance so if we execute any reinsurance throughout the year, that is not contemplated in that guidance. So for example, if we were to decide to move any significant block of business seeding from AFLAC Japan to AFLAC Bermuda, then obviously the net earned premiums is expected to be impacted in AFLAC Japan. That being said, those earned premiums would show up in the Bermuda's legal entity instead and show up in the corporate and other segment so it's just premiums out of one pocket into the other so to speak so it wouldn't impact the total premiums for the total enterprise but the the three components that the net earned premiums that was negative 1.9 percent in the fourth quarter and the underlying on 1.2 the vast majority of that is paid up status and then a little bit component of that is the deferred profitability. There was very little impact from reinsurance in the fourth quarter.
So is it fair to take that delta between what we saw in 4Q and underline versus actual and assuming no more reinsurance? That's a fair way to think about the difference that we'd potentially see in 26. Is that right?
I would expect that impact to be slightly smaller. And And the reason for that is that we have a declining balance of a paid-up impact.
Okay, that's all helpful. And then as a follow-up, I wanted to ask about technology. And obviously, we're getting a lot of questions from clients on artificial intelligence and how it affects different areas of our market. So I'd be interested in your take on what you see, obviously, as opportunities, as also risks of disintermediation here or there. And then maybe separately, if you could just talk about any kind of exposure that you're focused on in the investment portfolio, like software and so forth.
Why don't I start with the last part there, Alex? Obviously, the software is getting a lot of attention now with all that's going on in the AI world. In our credit portfolio, we have about 1.5% of total exposure to software-related companies. About half of that is in our middle market loan portfolio, where you'll recall this is a very well-diversified portfolio, all first lien, senior secured positions, very small average sizes of about $15 million. And then the other half is investment-grade exposure and carries an A- rating. So there's a lot to like about these software companies from a credit standpoint. We're well aware of the threat from AI, and we're watching it very closely. But right now, we feel very comfortable with our overall exposure to software.
And this is Virgil. Let me give it to you from an operational standpoint, what we're doing within our businesses. So I spent a lot of time last year in Japan. First, I want to commend our Affleck Japan team. we are making investments in exploring how we can leverage AI in a variety of different ways there working very strongly with the FSA and I would say to you that we're focused a lot on the enrollment process of how we distribute our products we're also looking at by way of what AI could do by way of product innovation and some of the learnings that we've learned through our Japan counterparts we're leveraging here also in the U.S. For the U.S., what we focused on is first looking throughout all company and how AI can assist in making people better at what we do. What we're saying is that technology, we're not looking to replace the people. It's a high-touch business when it comes to delivering on that promise and paying claims. We want to make sure that ai is assisting us with that so what we've done is where we can automate some of the more routine processes within the claims area a larger percentage of our claims especially in all the traditional business more than 60 percent is automatic automated using a lot of the machine learning techniques we apply ai to actually give the the claims adjudicator advice on what to look for, but we do not deny or have any claim fully adjudicated by automation without a final person making that decision. We're also looking at, though, how we can help with our enrollment processes here in the U.S. So when I mentioned that we're rolling out some enhanced automation in our enrollment that's going to make our agents more efficient as they meet with consumers face to face, a lot of how we prepared that technology was done through AI in the background of how we were able to get it to market so fast, normal, much faster than our normal process before. So I will conclude just by saying we are certainly looking at how we can leverage AI going forward. It is a part of our DNA, but right now it's more in an assist role as far as how we're leveraging it as part of our rollout.
Operator
And with that, ladies and gentlemen, and we'll be concluding today's question-and-answer session. I'd like to turn the floor back over to David Young for any closing remarks.
Thank you, Jamie, and thank you all for joining us today. I hope you'll mark your calendars also for December 3rd to join us for our financial analyst briefing, and we'll be sending out more information in regard to that closer to that date. In the interim, if you have any questions, please reach out to Investor Relations. We'll get back to you or try and help and respond to your question as soon as we can. Thank you all for joining. Have a good day.
Operator
And with that, ladies and gentlemen, we'll conclude today's conference call and presentation. We thank you for joining. You may now disconnect your lines.