Operator
Good day, and thank you for standing by. Welcome to the Eagle Bancorp, Inc., fourth quarter and year-end 2025 earnings conference call. At this time, all participants are in a listen-only mode. After the speaker's presentation, there will be a question and answer session. To ask a question during the session, you will need to press star 11 on your telephone raise. To withdraw your question, please press star 11 again. Please be advised that today's conference is being recorded. I would now like to hand the conference over to your speaker today, Eric Newell, Chief Financial Officer of Eagle Bancorp, Inc. Please go ahead.
This is Eric Newell, Chief Financial Officer of Eagle Bancorp. Before we begin the presentation, I would like to remind everyone that some of the comments made during this call are forward-looking statements. We cannot make any promises about future performance, and we caution you not to place undue reliance on these forward-looking statements. Our Form 10-K for the fiscal year 2024, Form 10-Qs, and current reports on Form 8-K, including the earnings presentation slides, identify important factors that could cause the company's actual results to differ materially from any forward-looking statements made this morning, which speak only as of today. EGO Bank Corp. does not undertake to update any forward-looking statements as a result of new information, future events, or developments unless required by law. This morning's commentary will include non-GAAP financial information. The earnings release, which is posted in the Investor Relations section of our website and filed for the SEC, contains reconciliations of this information to the most directly comparable GAAP information. Our periodic reports are available from the company, online at our website, or on the SEC's website. With me today is our President and CEO, Susan Reel, and our Chief Lending Officer for Commercial Real Estate, Ryan Reel. I'll now turn it over to Susan.
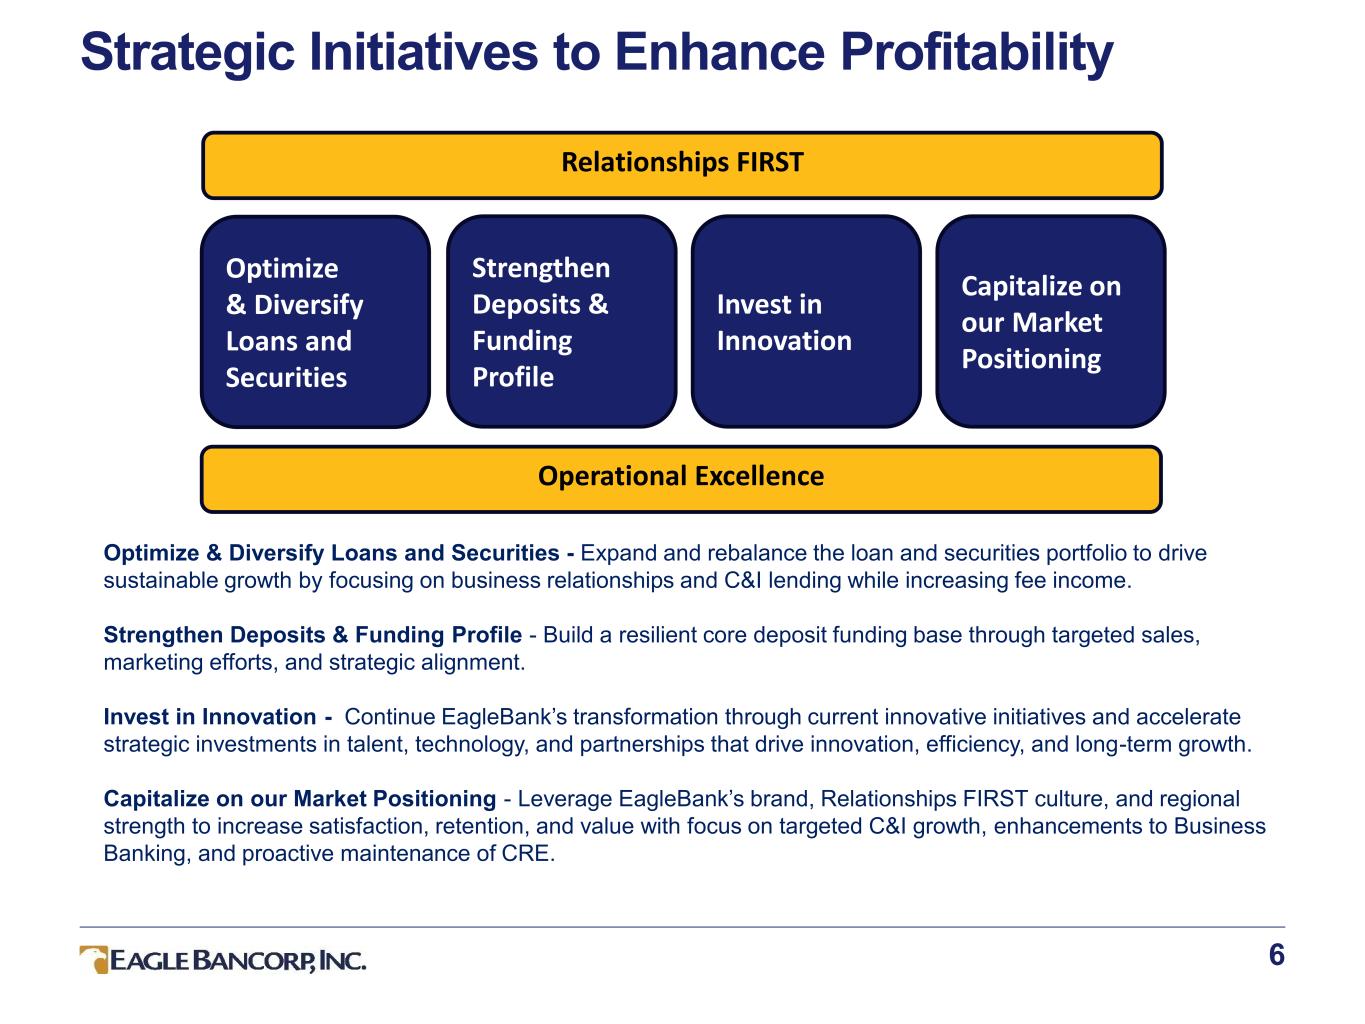
Thank you, Eric. Good morning, and thank you for joining us. The fourth quarter marked an important inflection point for Eagle Bank. Over the course of the year, we took actions to diversify our balance sheet, reduce risk, and strengthen the overall quality of the franchise. These efforts became clearly visible in the fourth quarter as asset quality metrics improved meaningfully and our balance sheet mix moved closer to the profile we believe is necessary to sustainably support durable earnings. Importantly, these improvements were the result of intentional decisions, disciplined balance sheet management, and a continued focus on reducing concentration risk. While these steps created near-term expense pressure, they significantly improved the underlying risk profile of the company and enhanced our flexibility going forward. As we enter the new year, our focus shifts from remediation to execution. We are operating with a stronger foundation, improved asset quality, and a more disciplined funding approach. This will position us to drive more consistent earnings and improve returns. I'll now turn the call over to Eric to walk through the quarter's results in more detail. up.
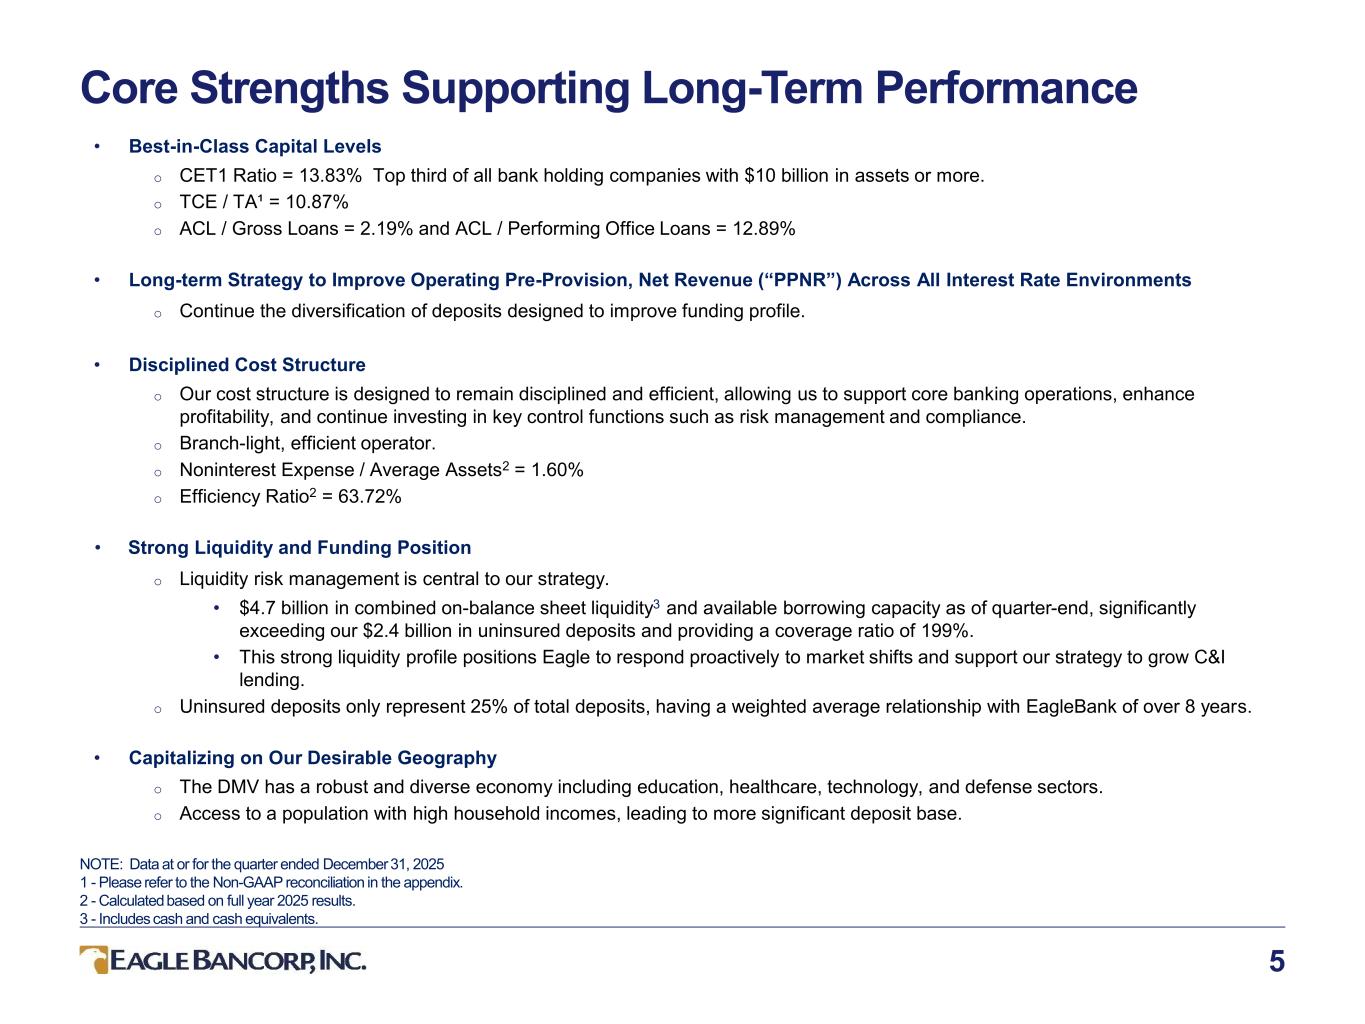
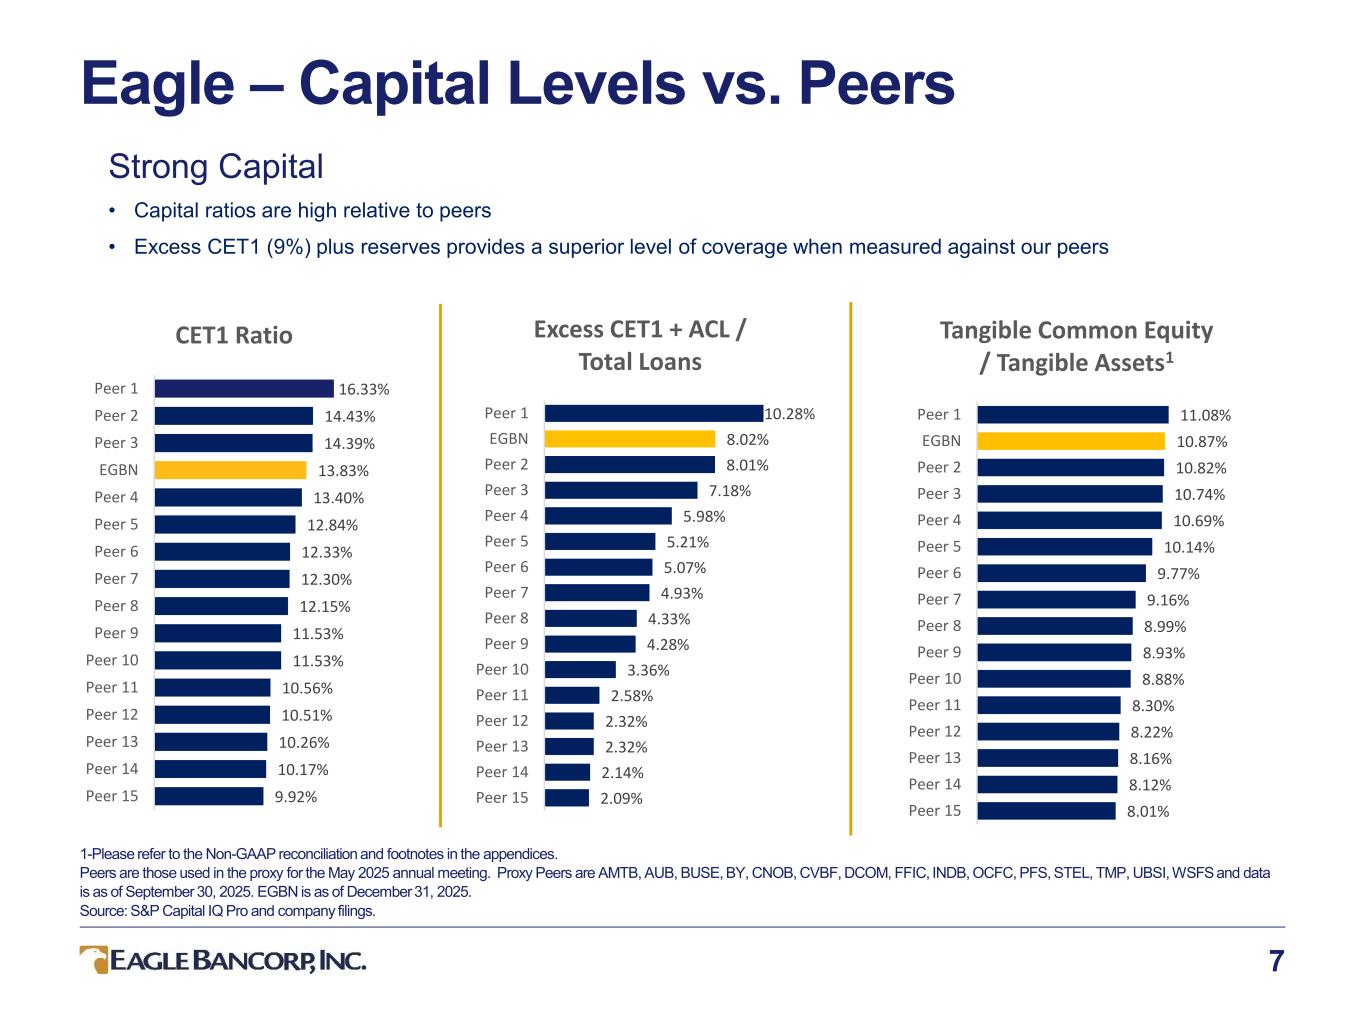
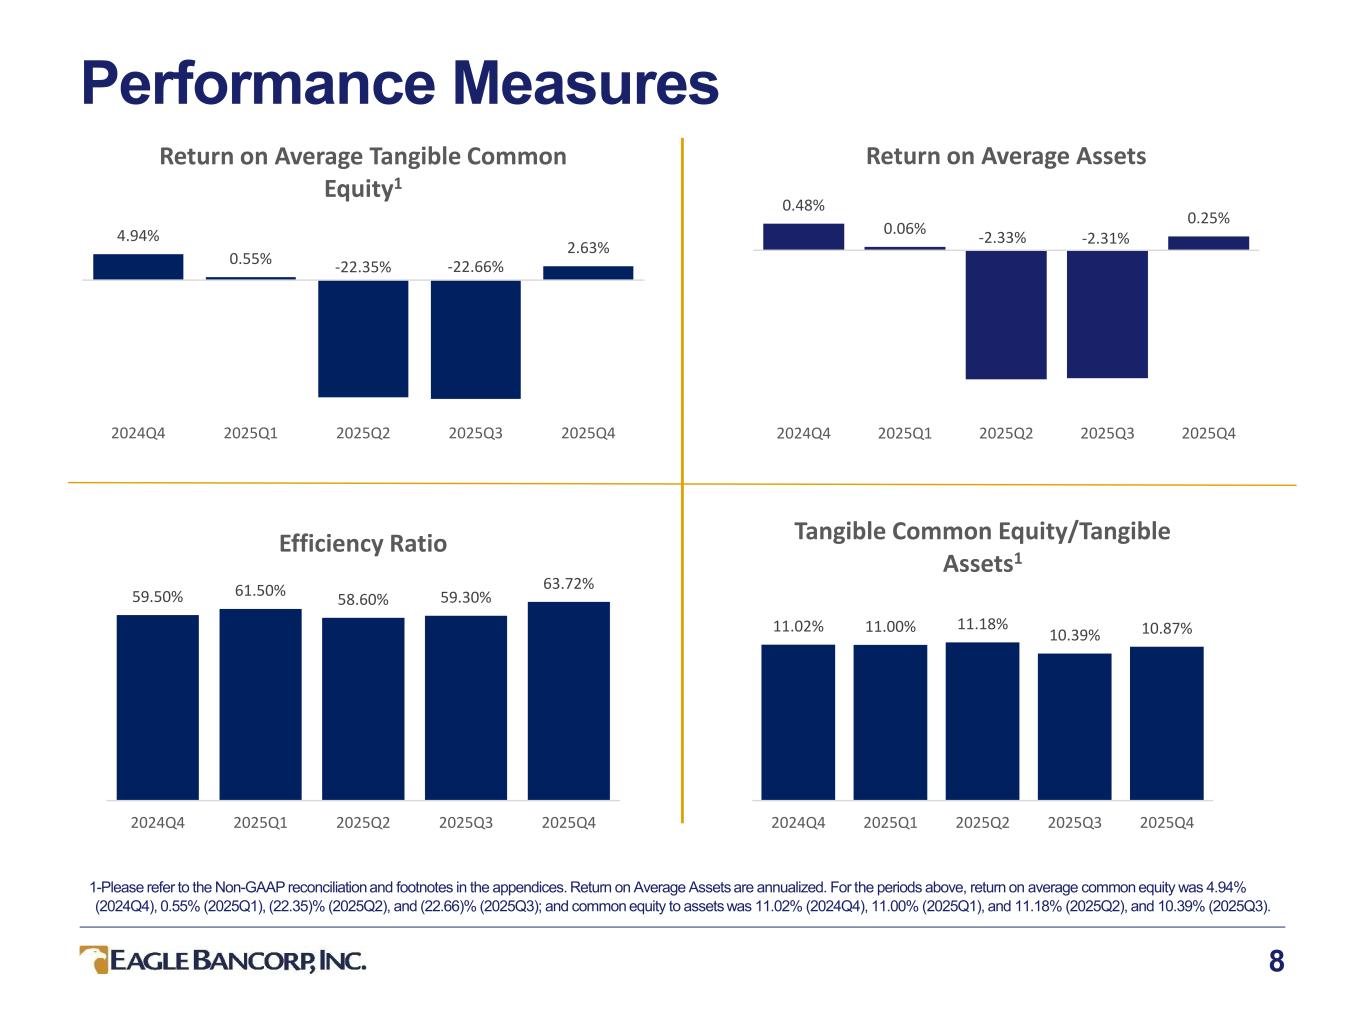
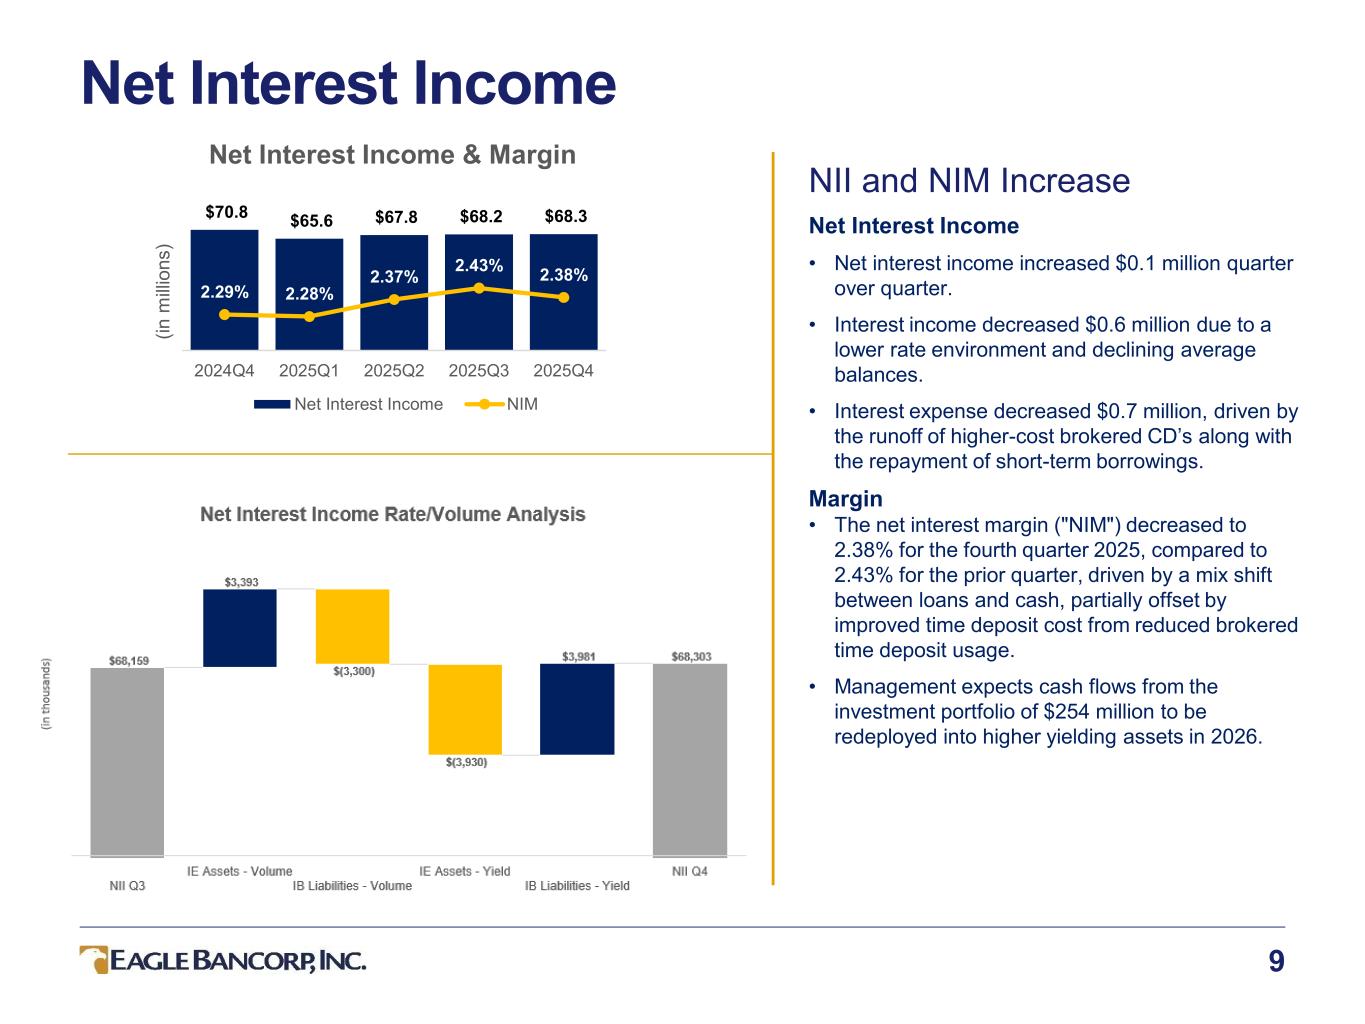
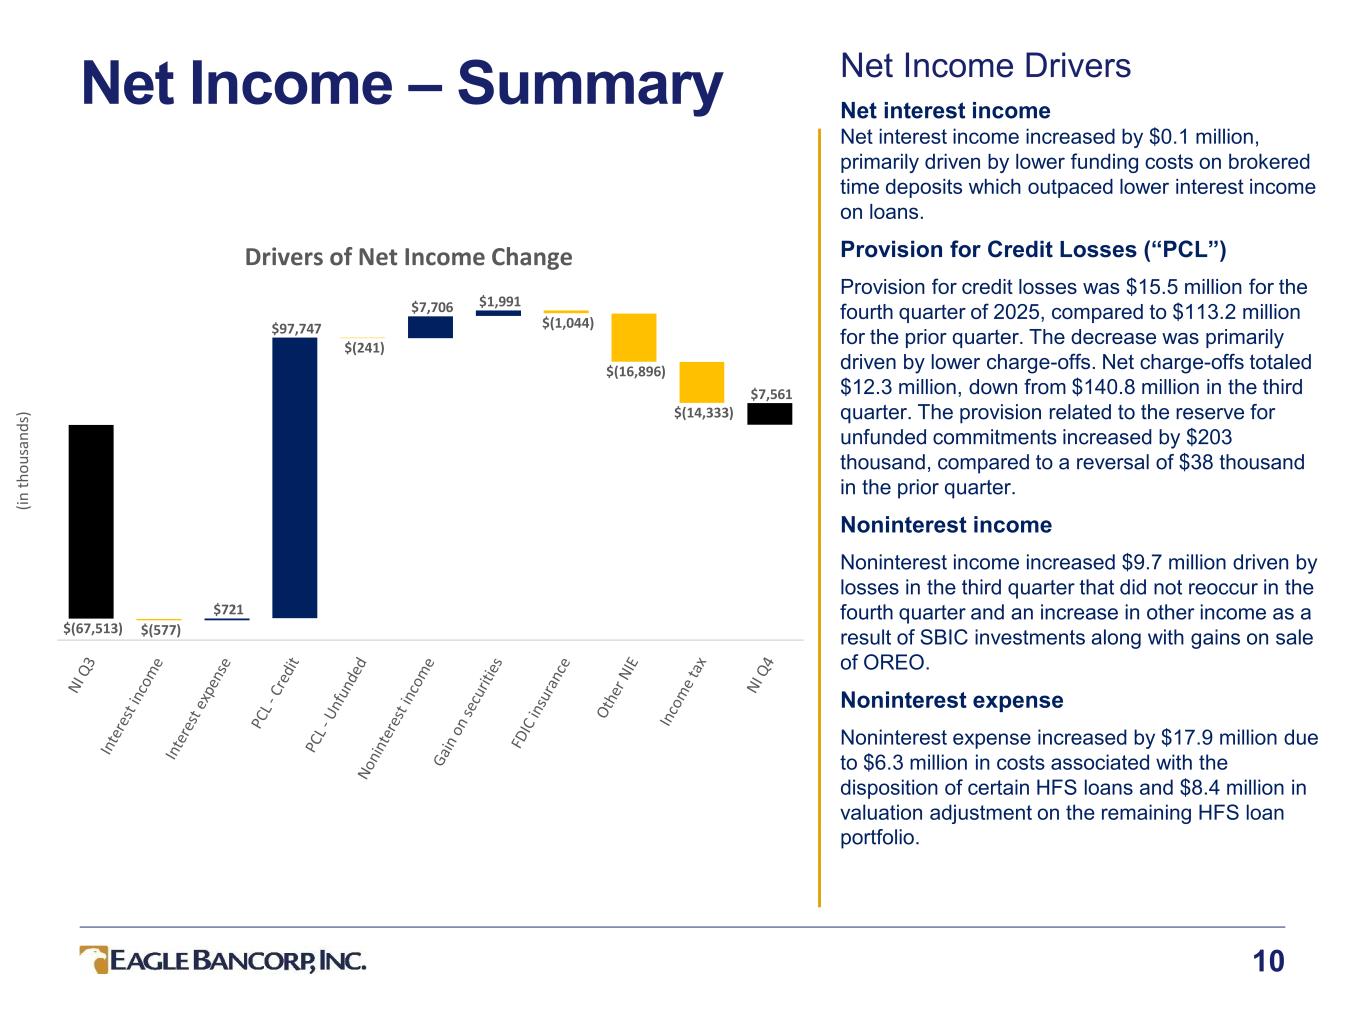
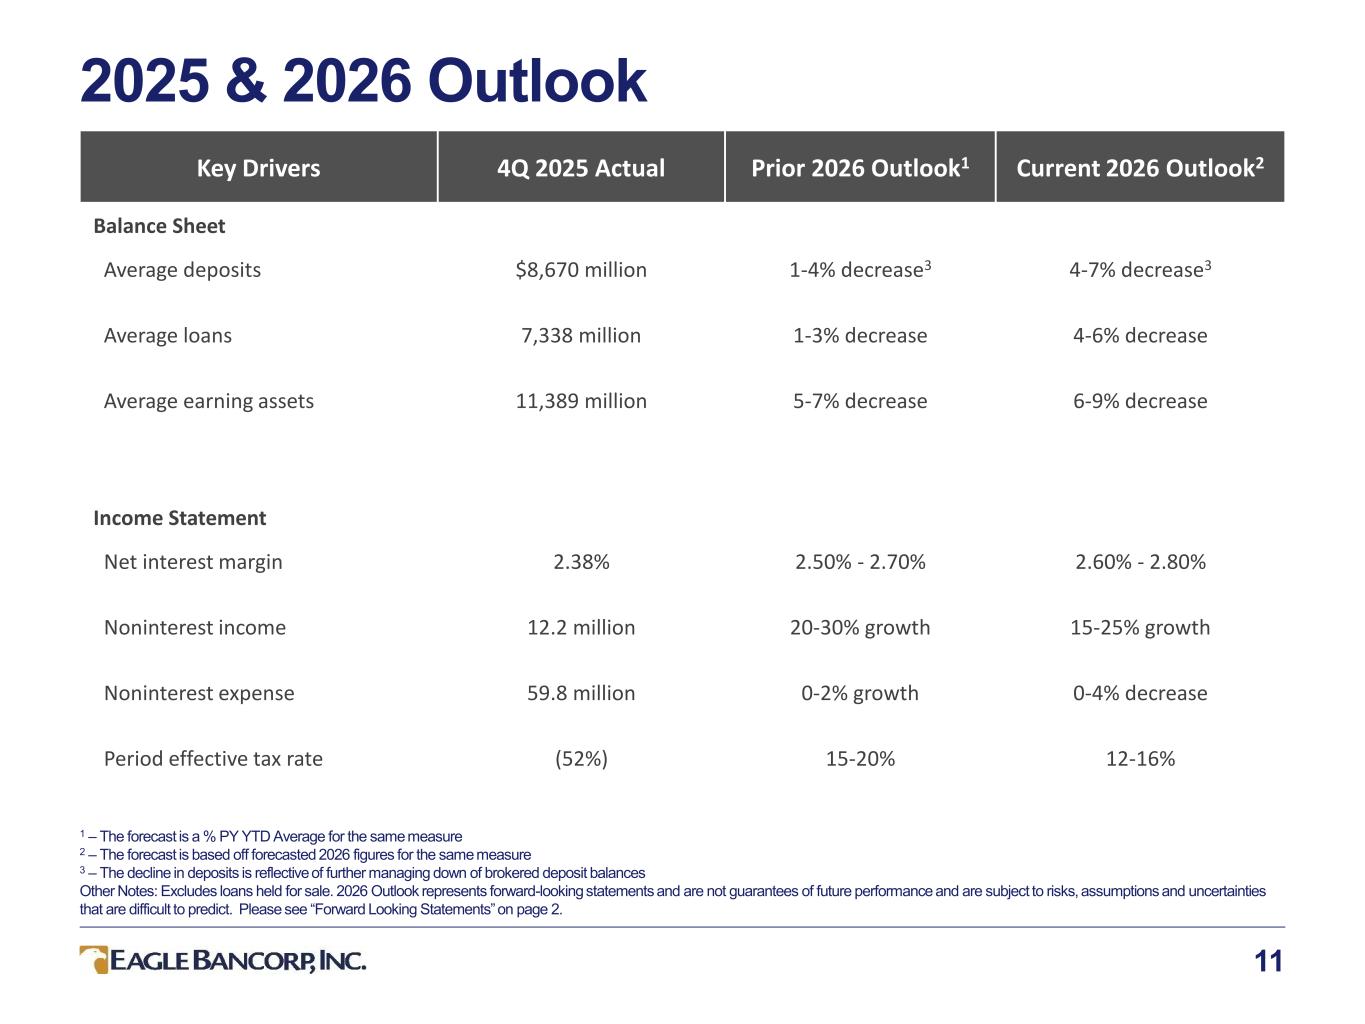
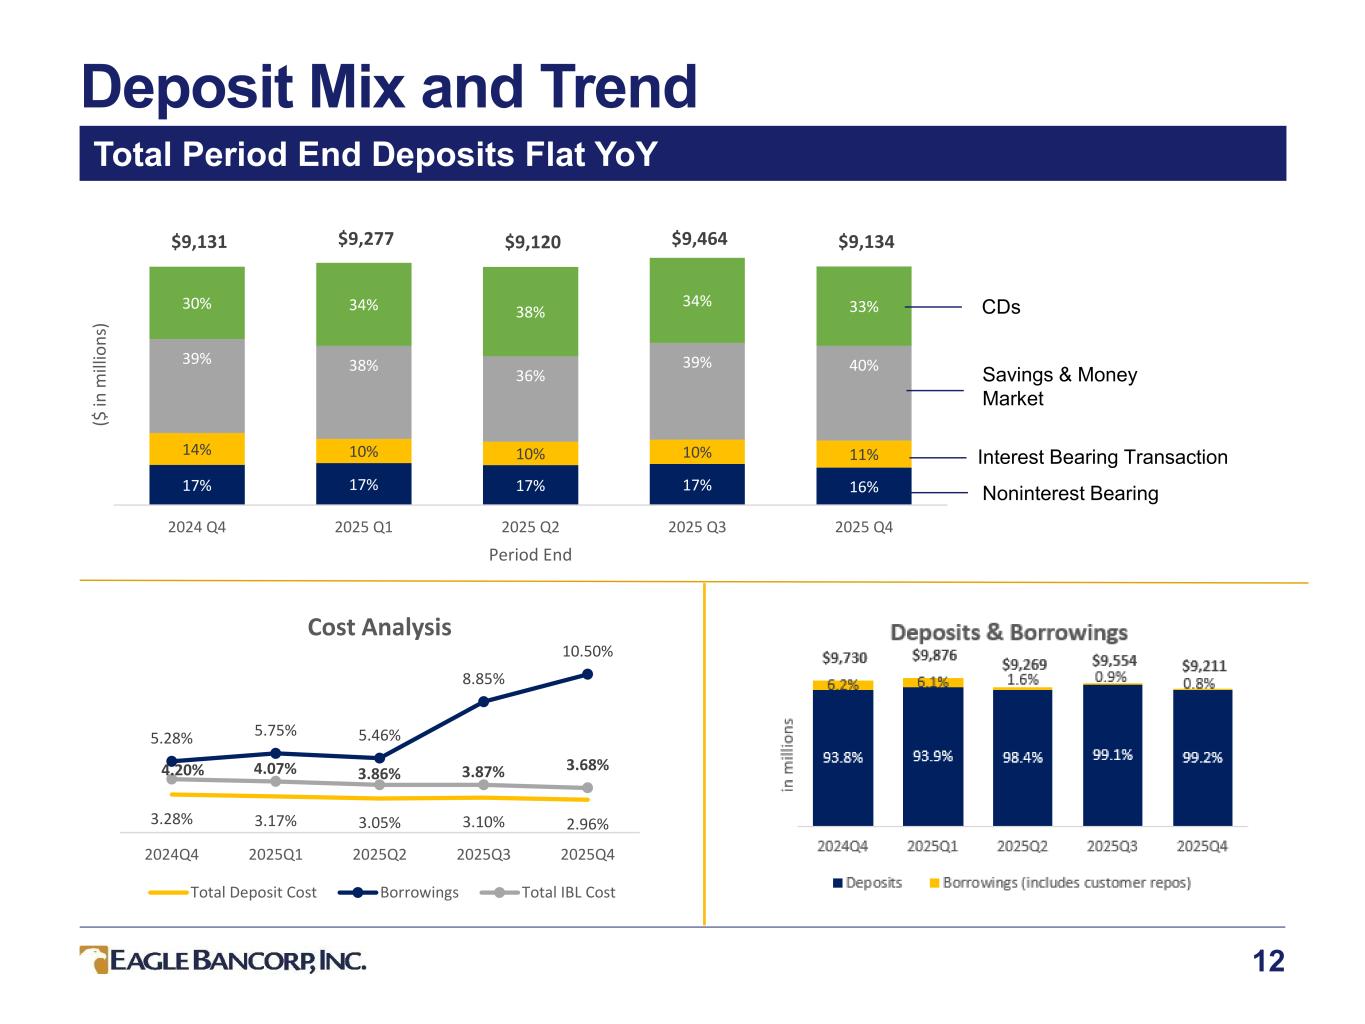
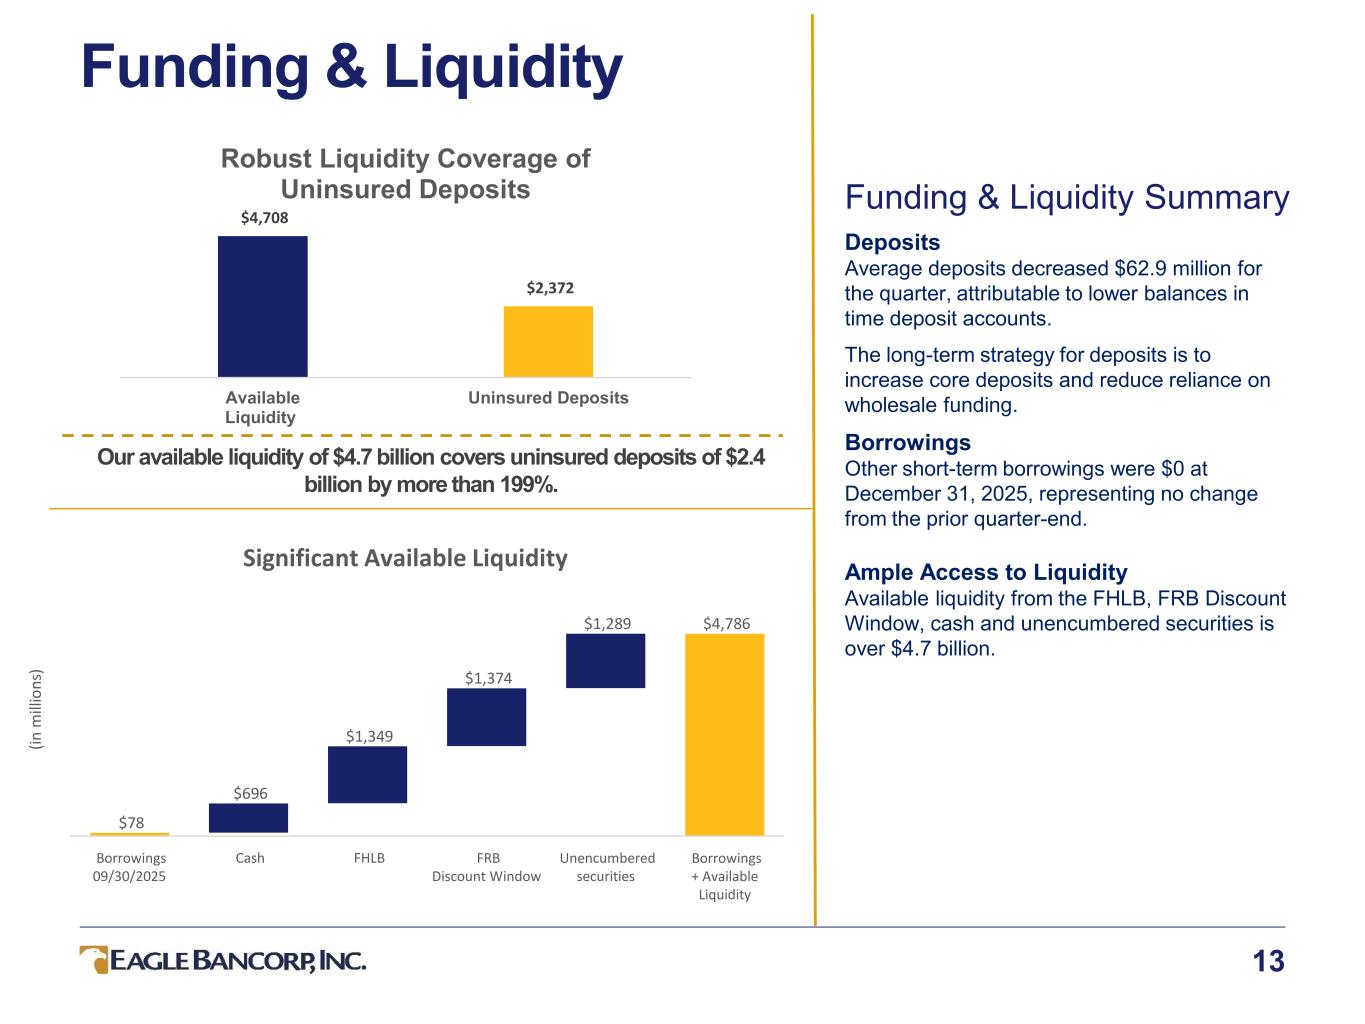
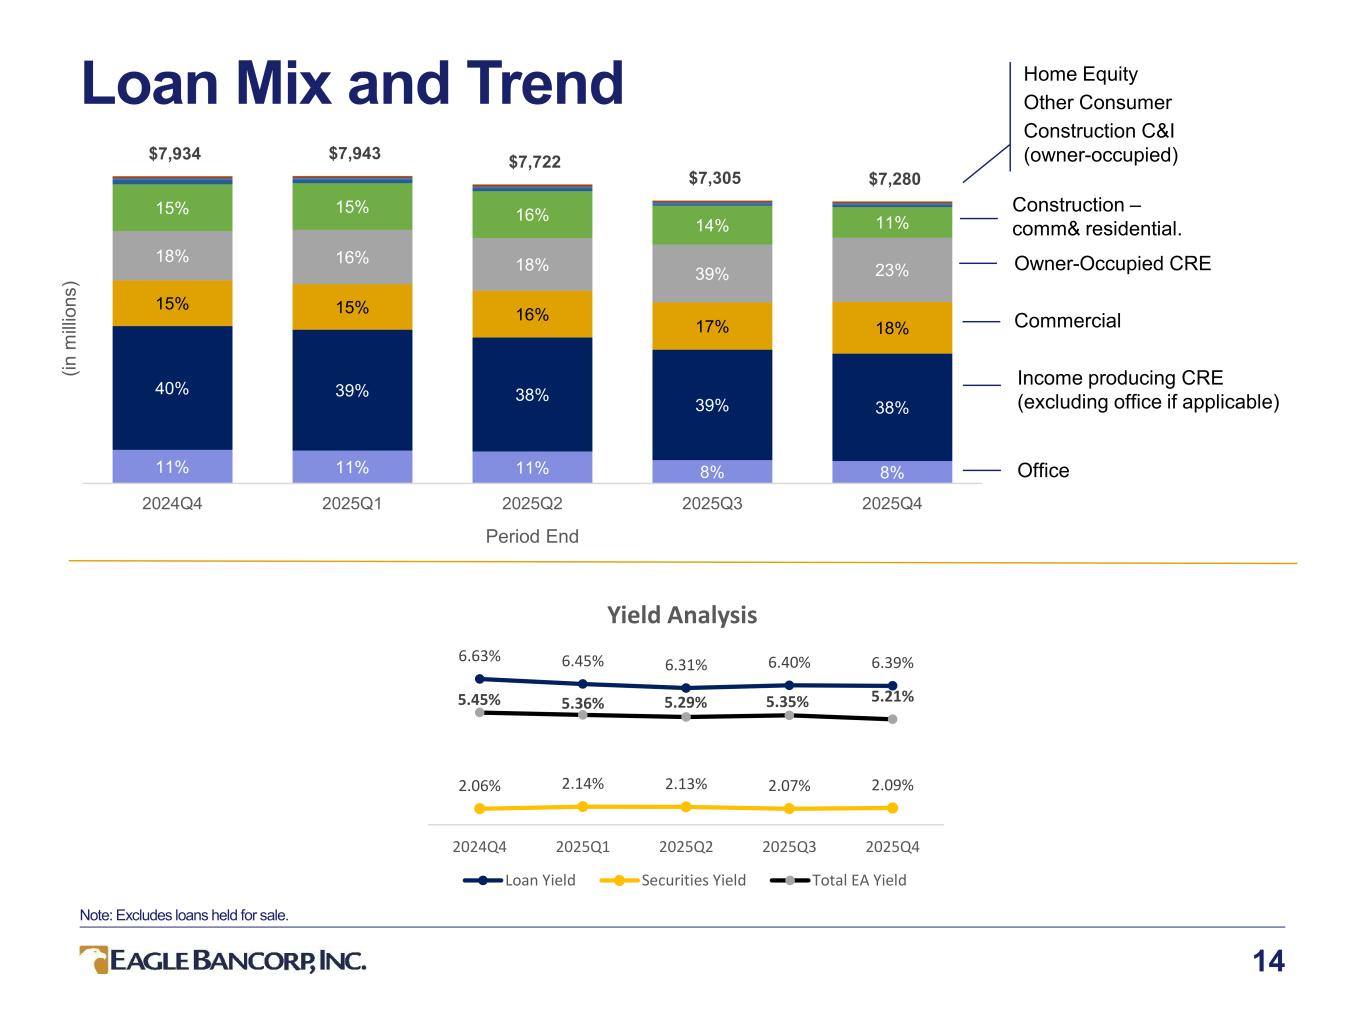
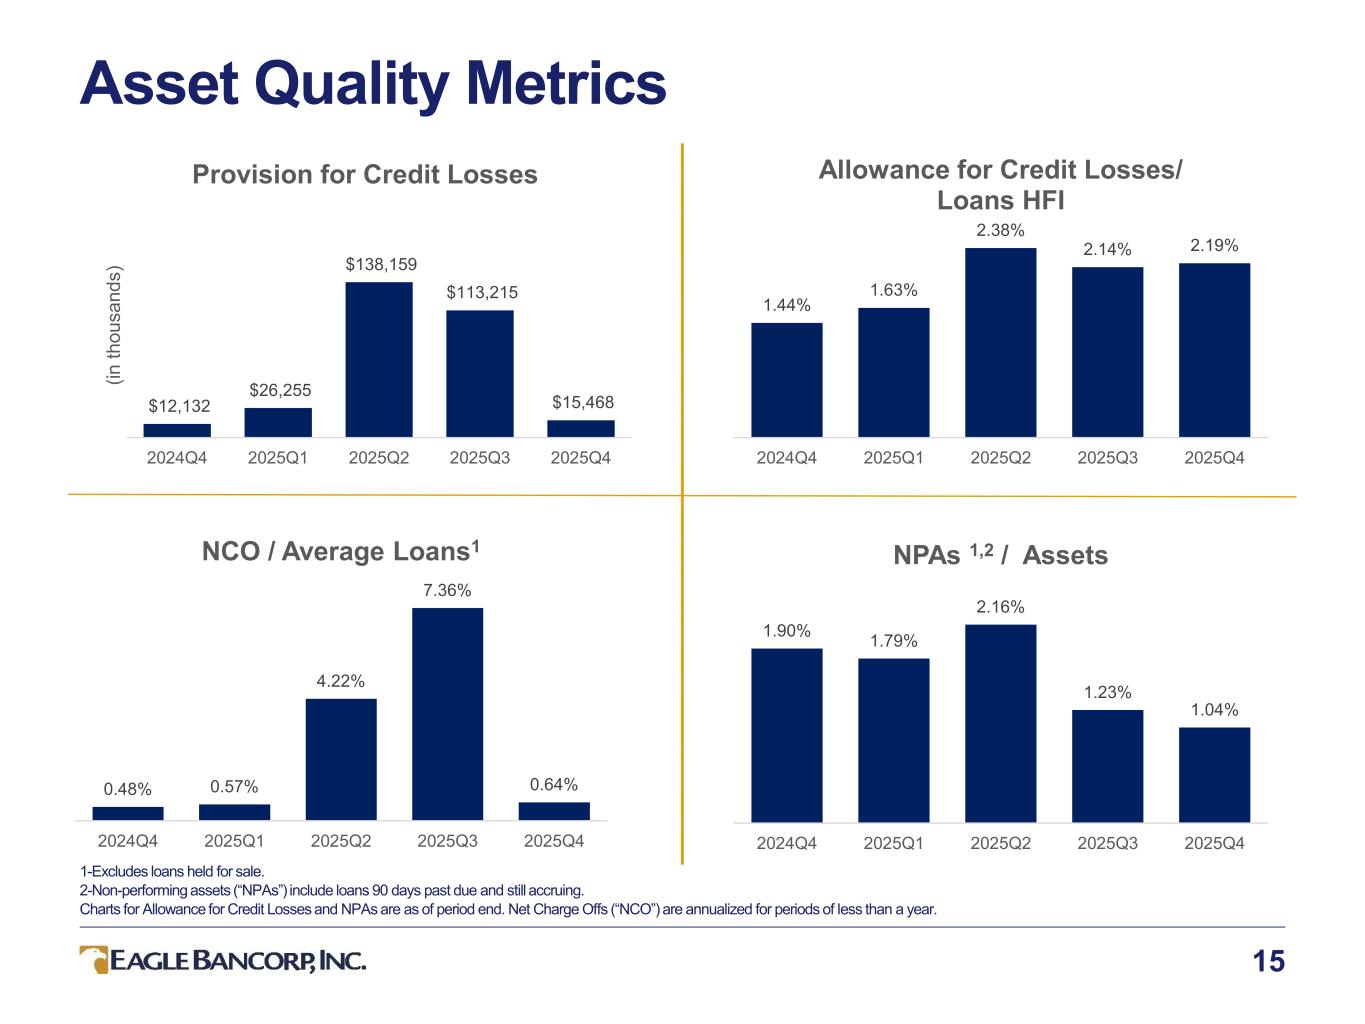
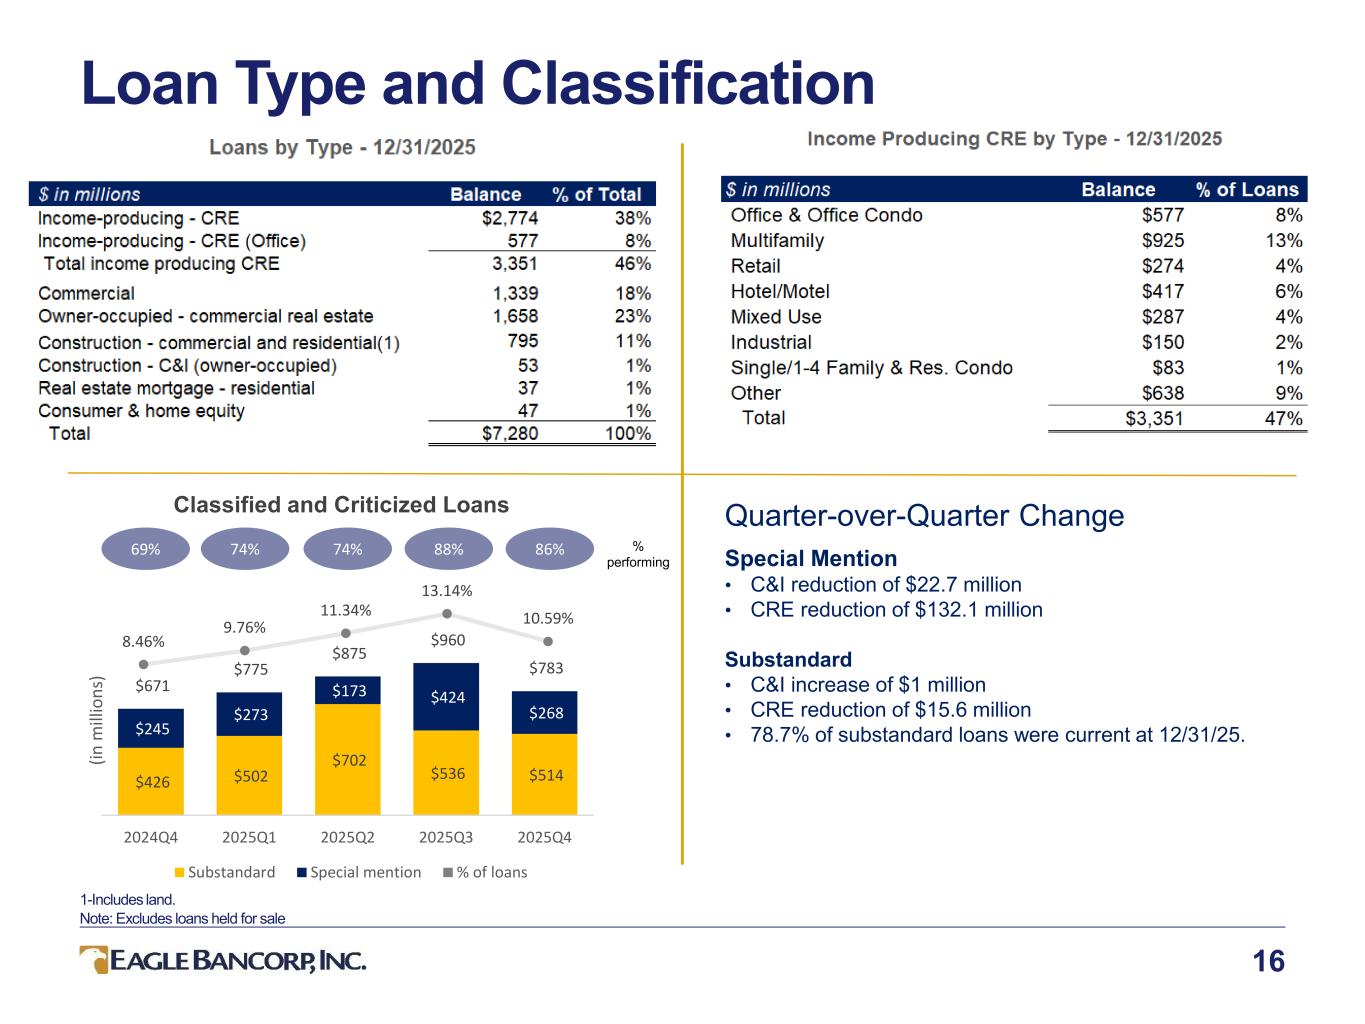
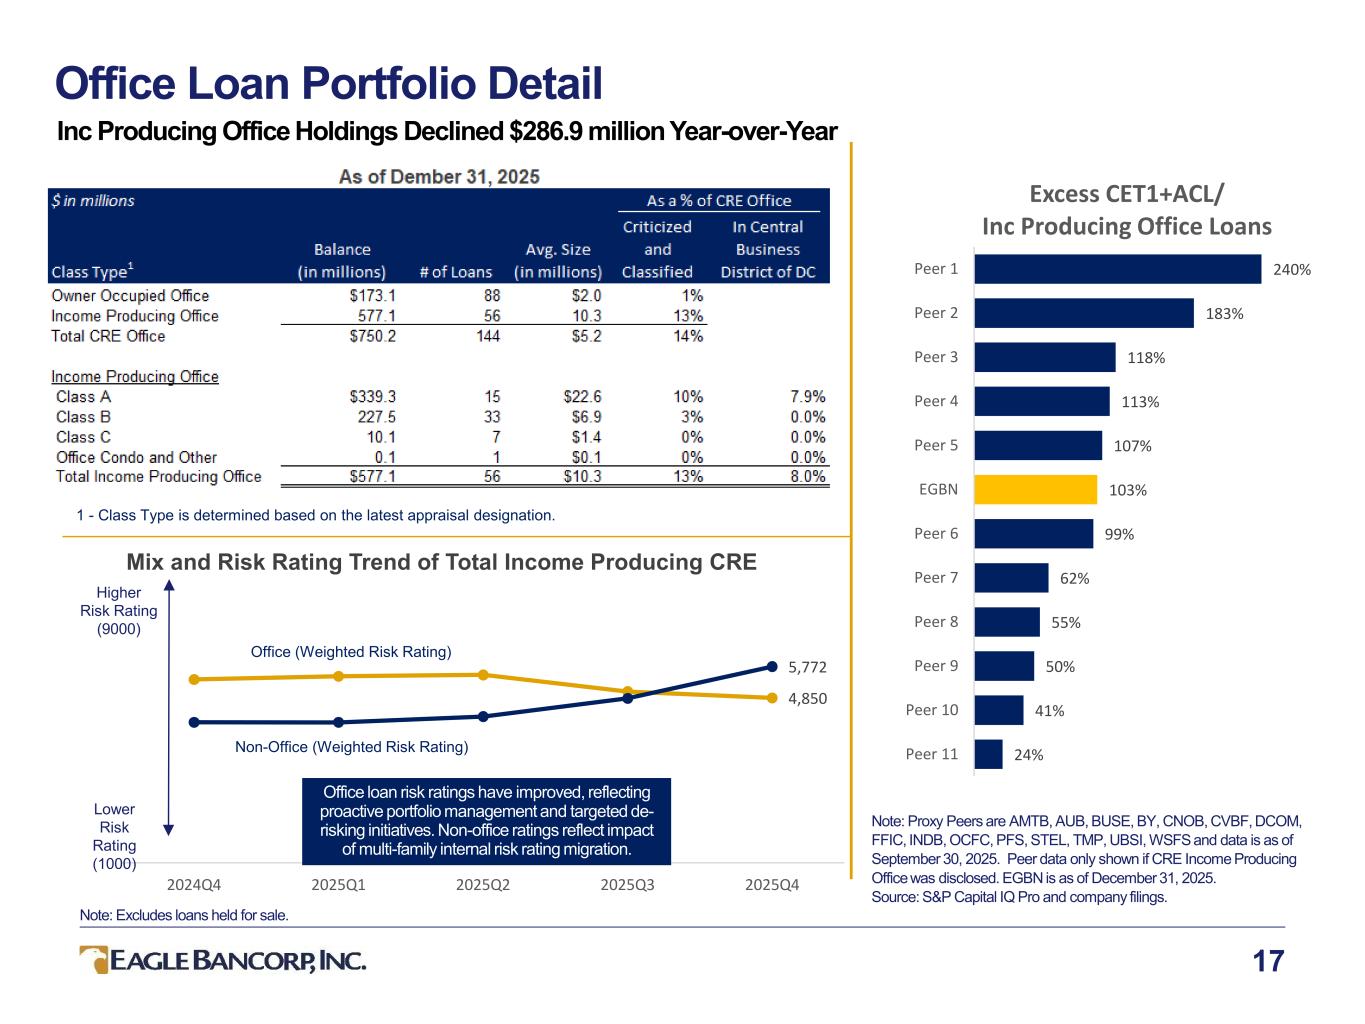
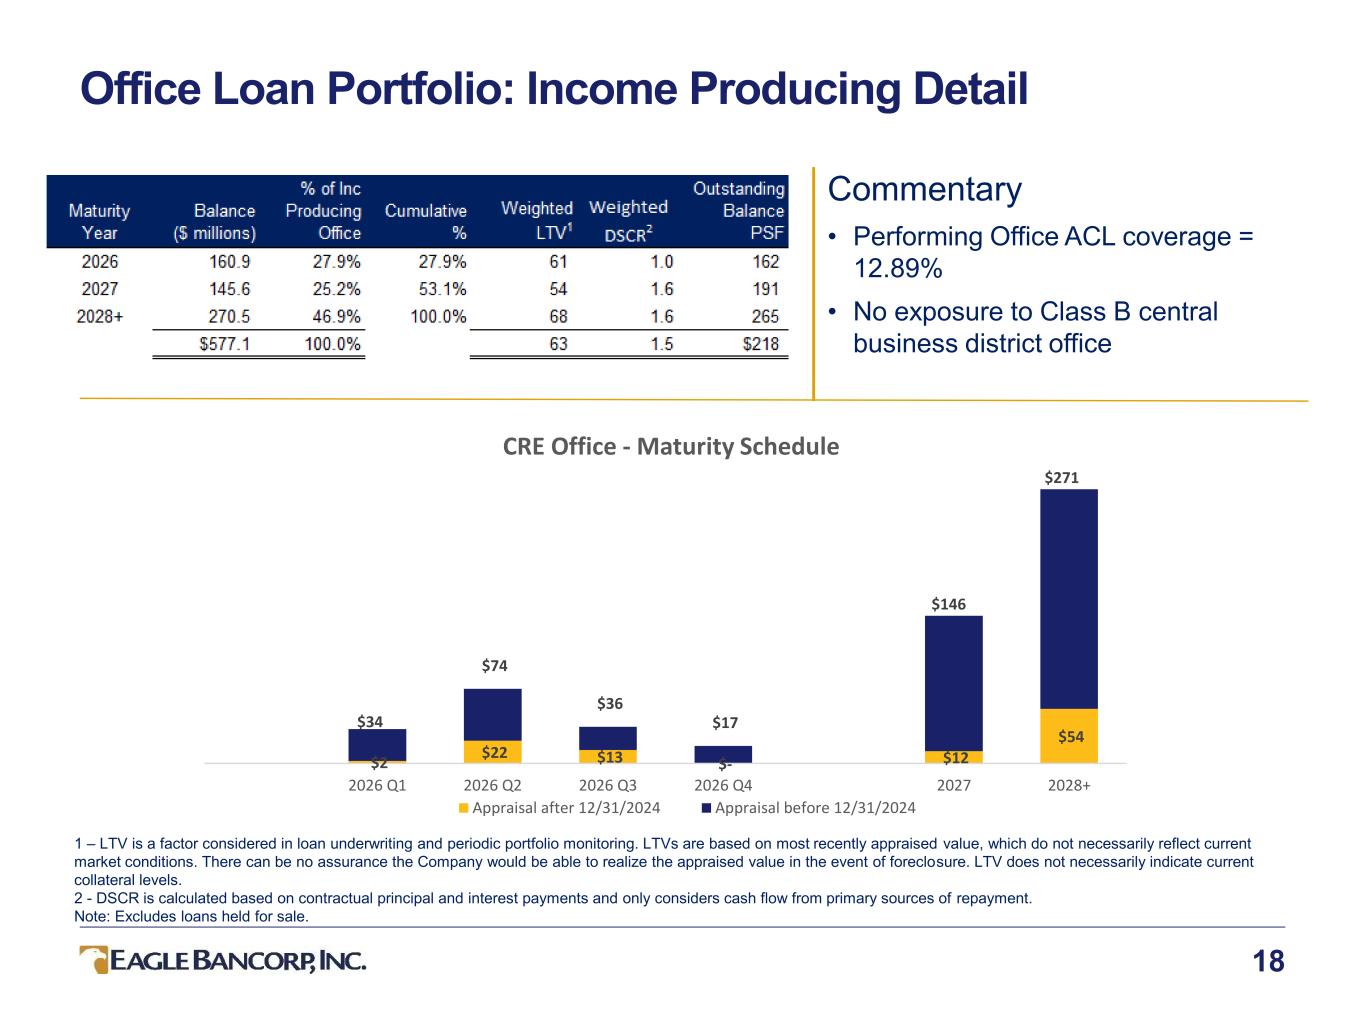
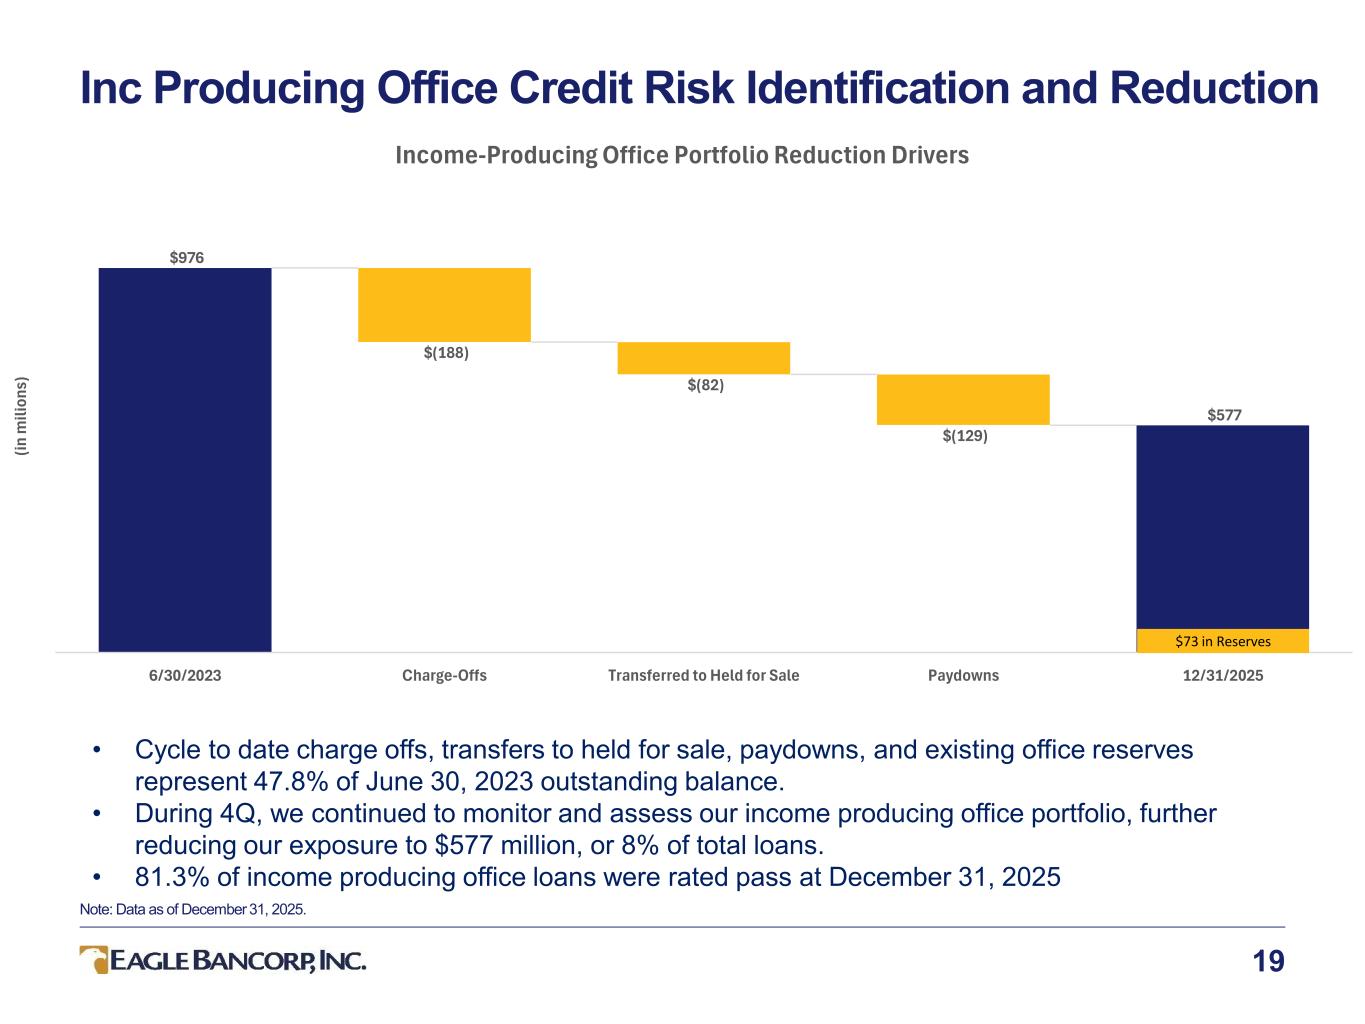
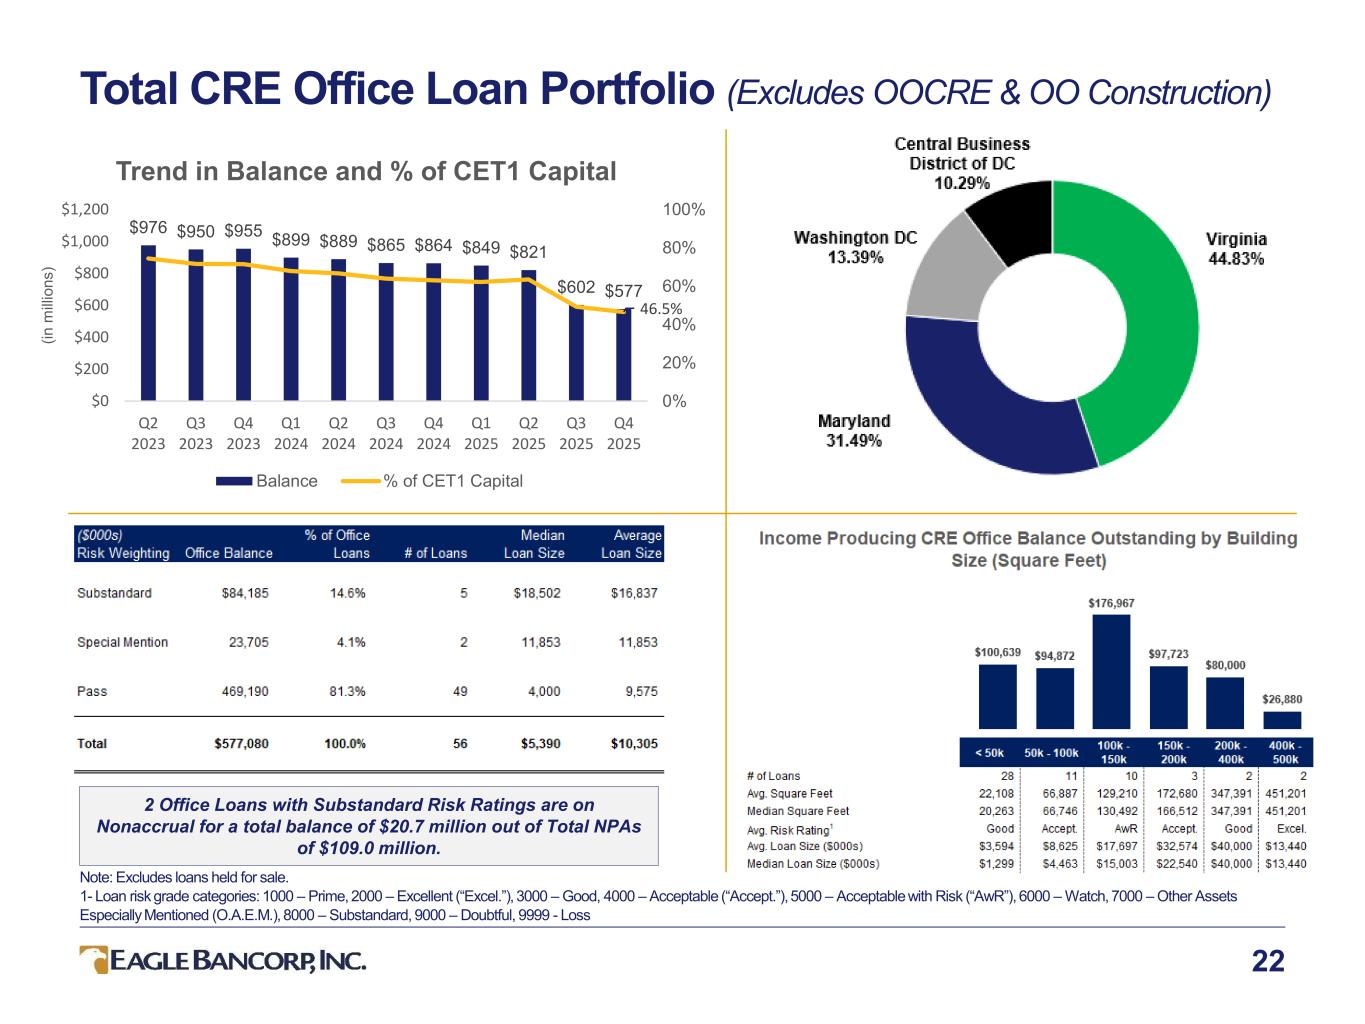
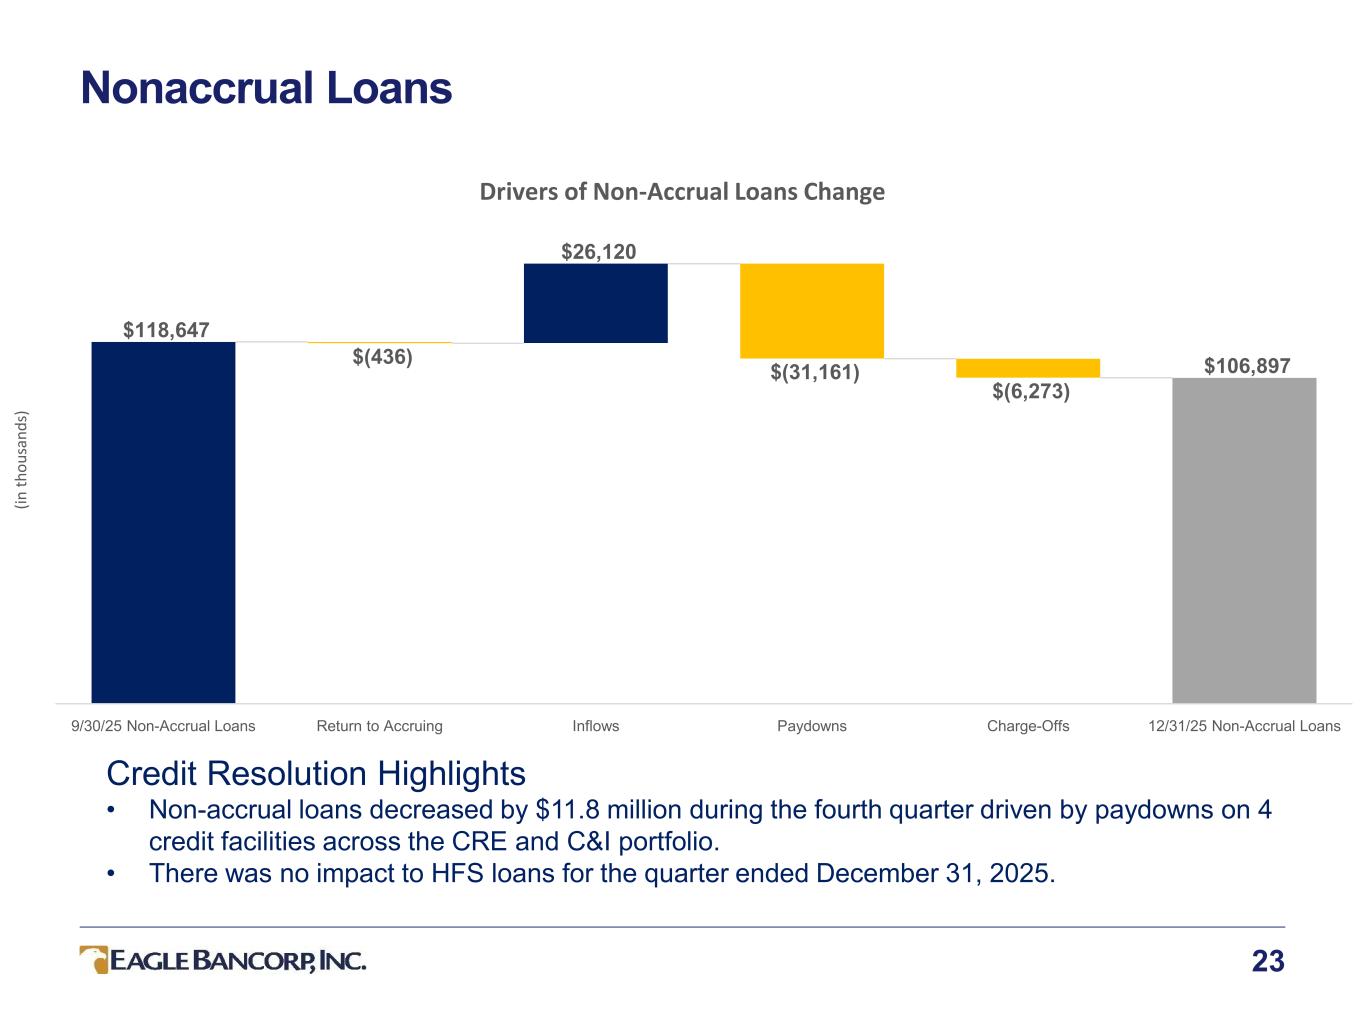
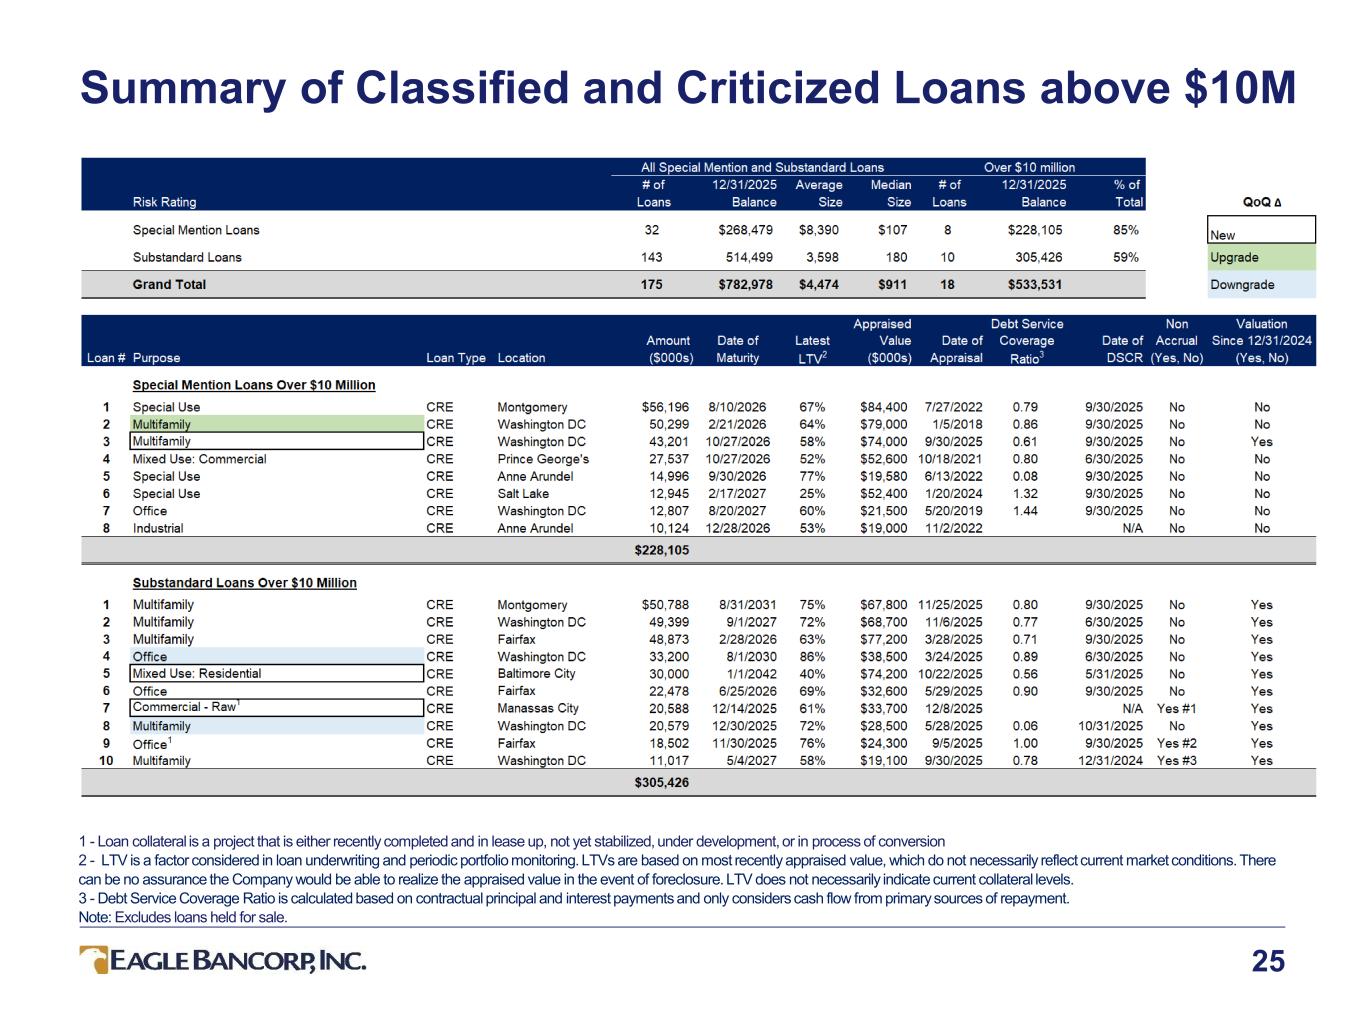
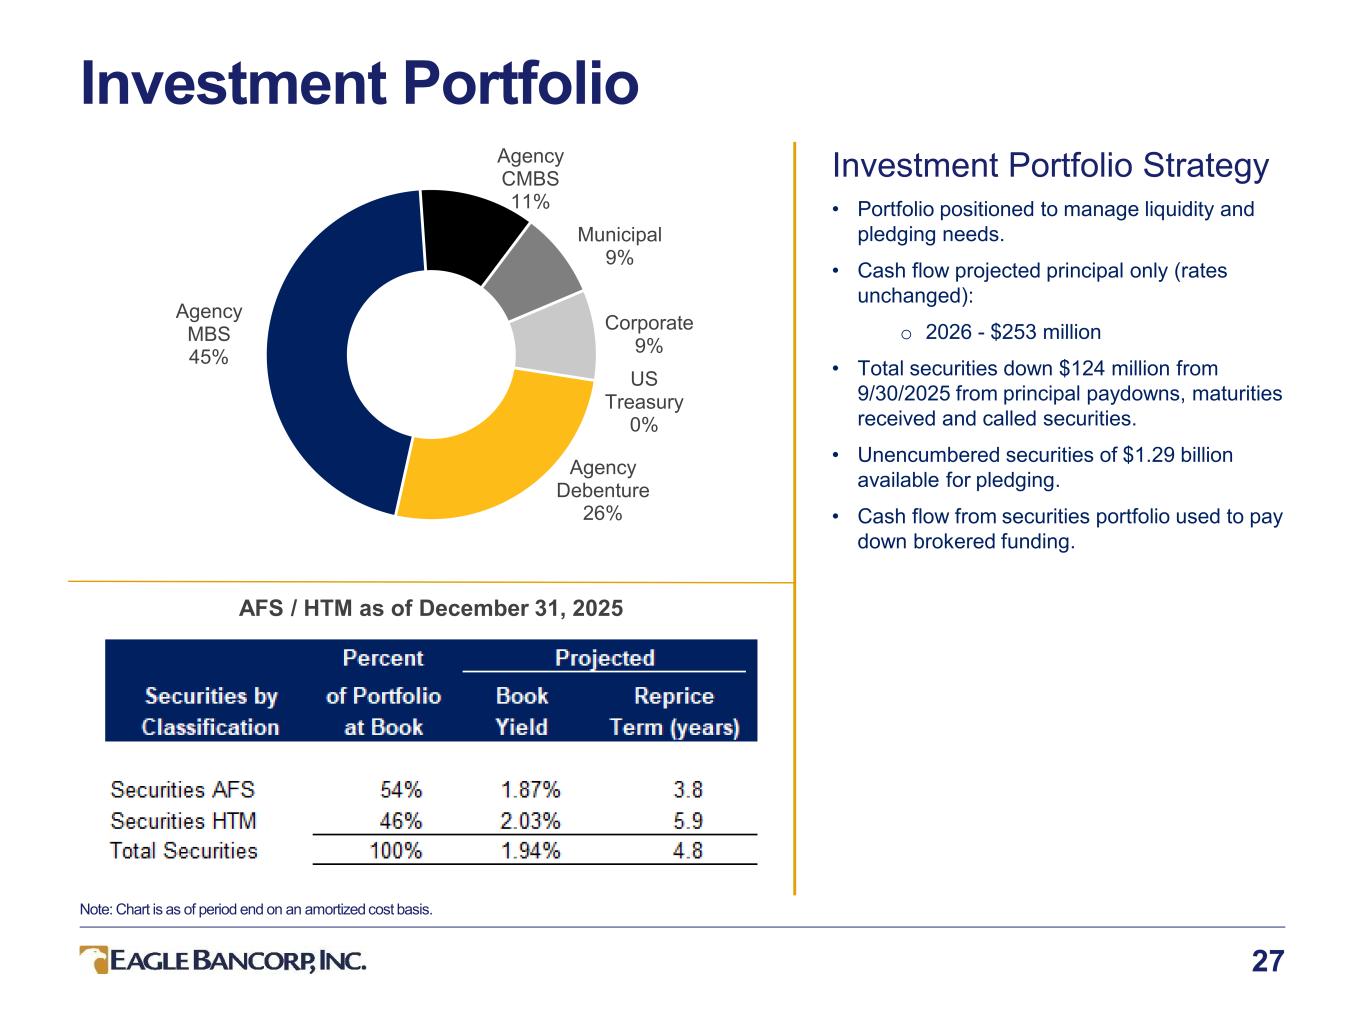
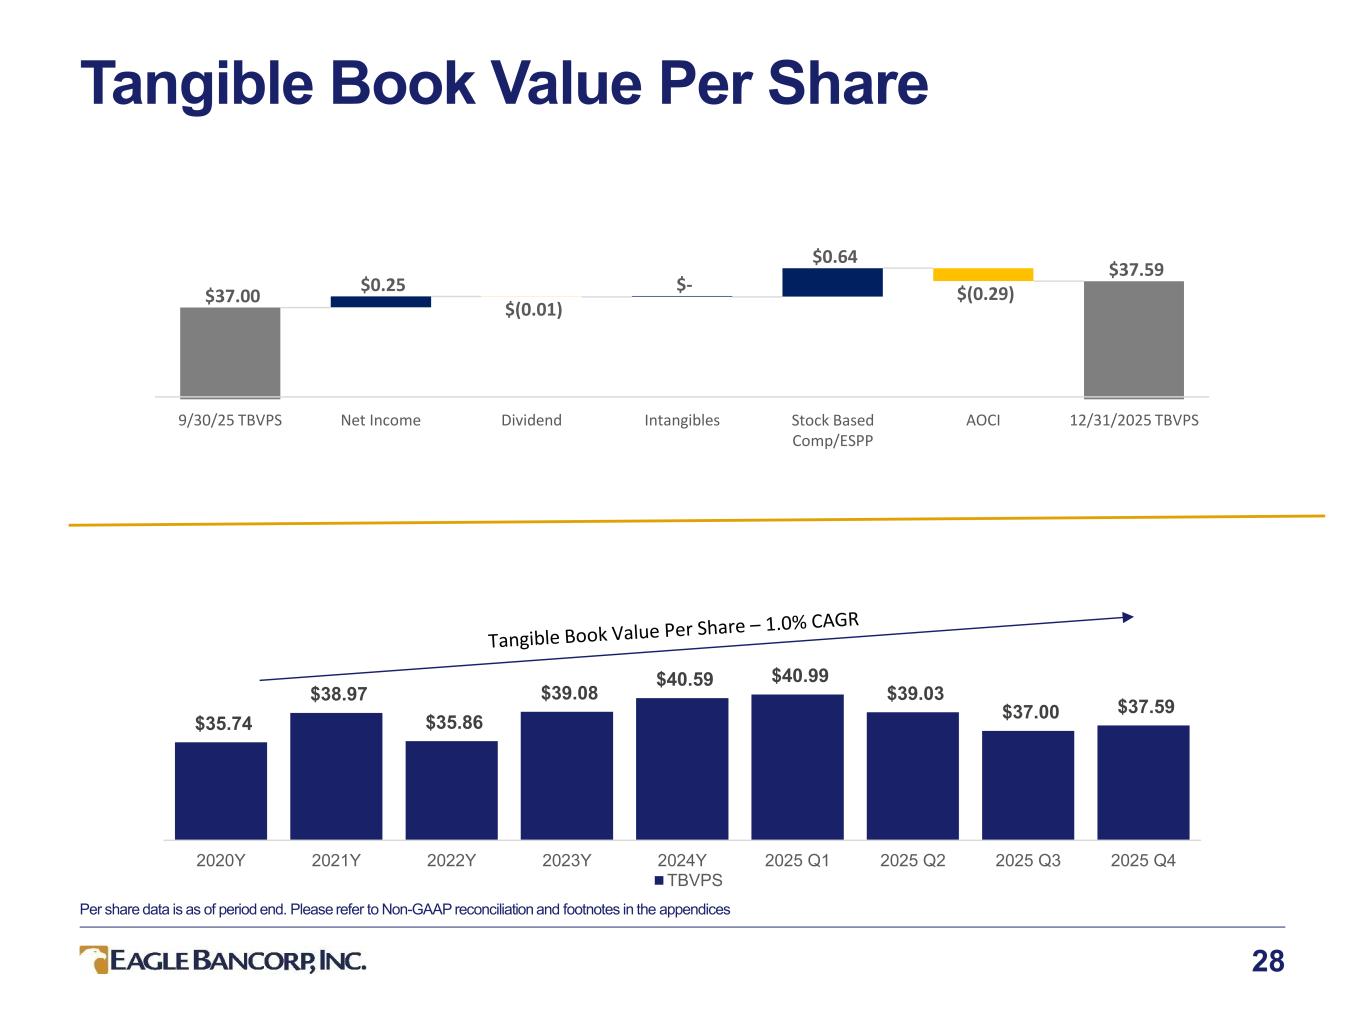
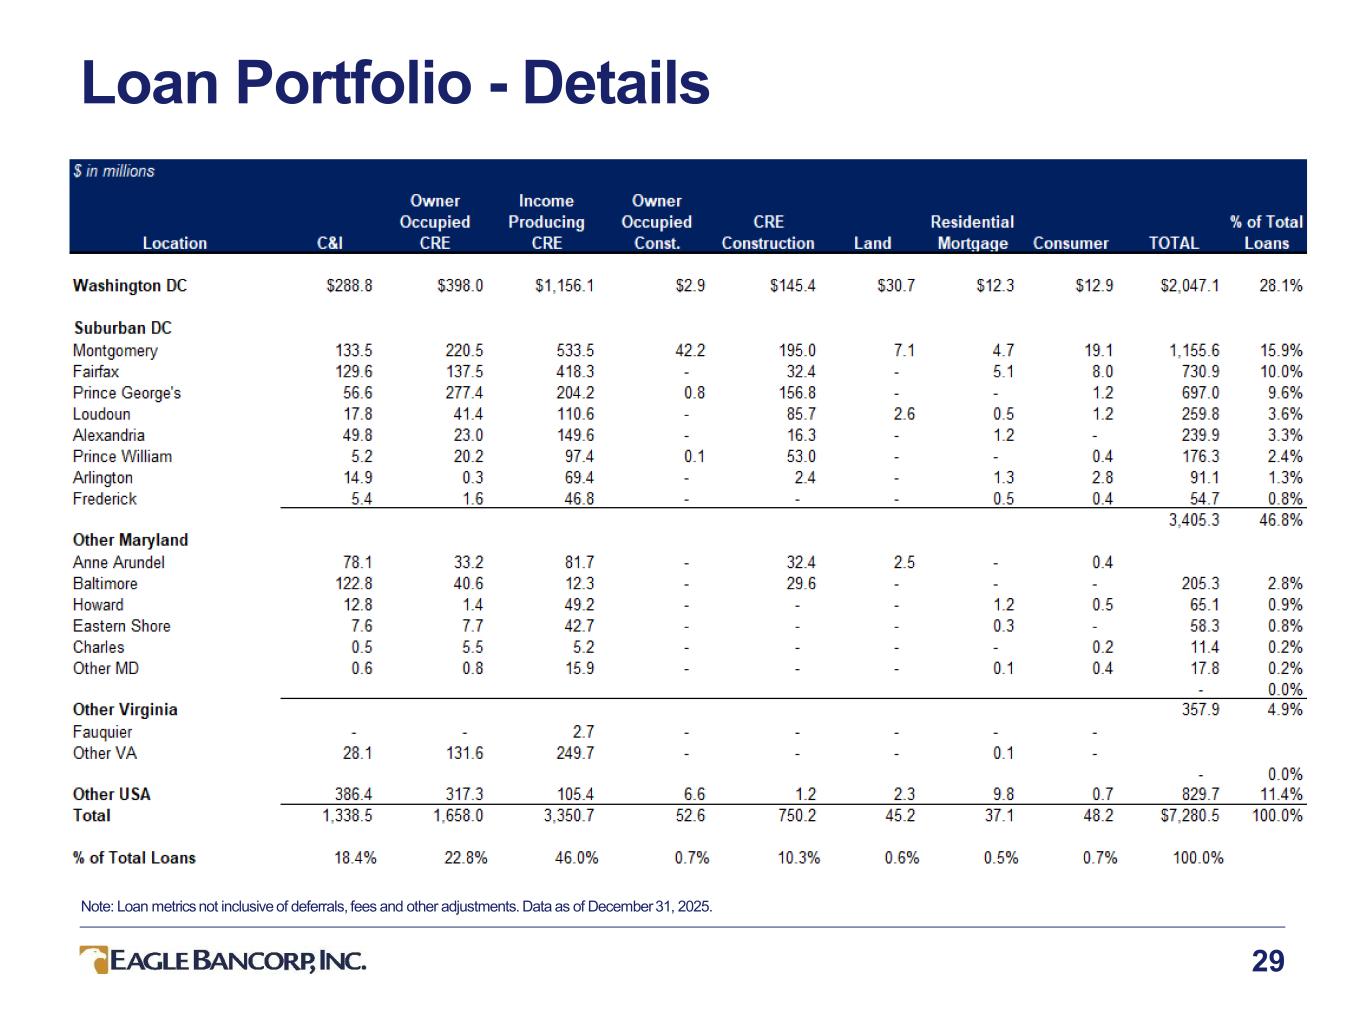
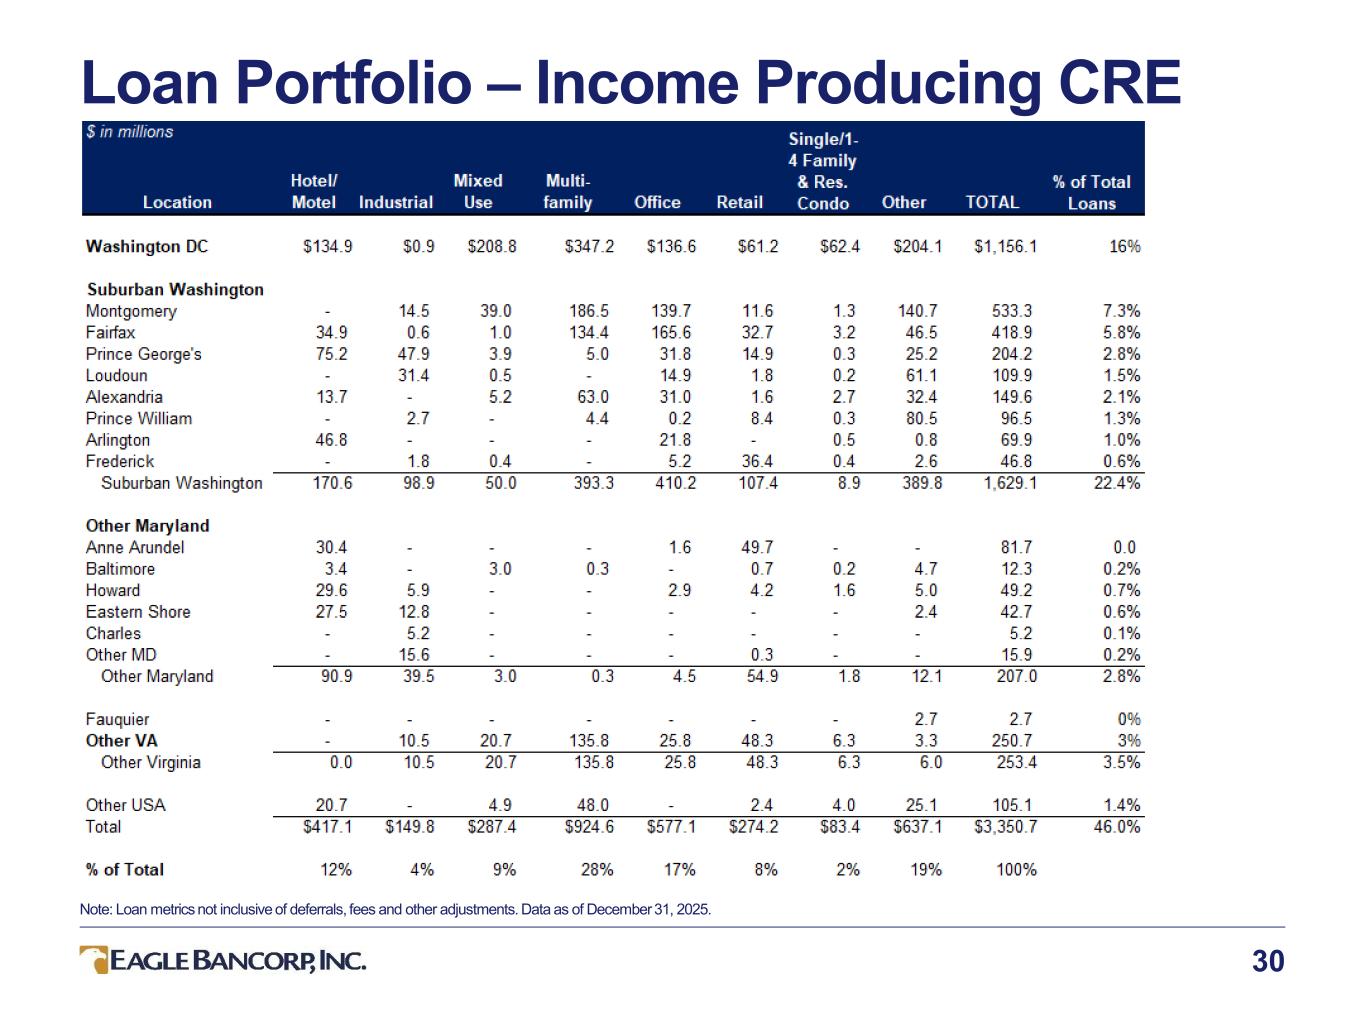
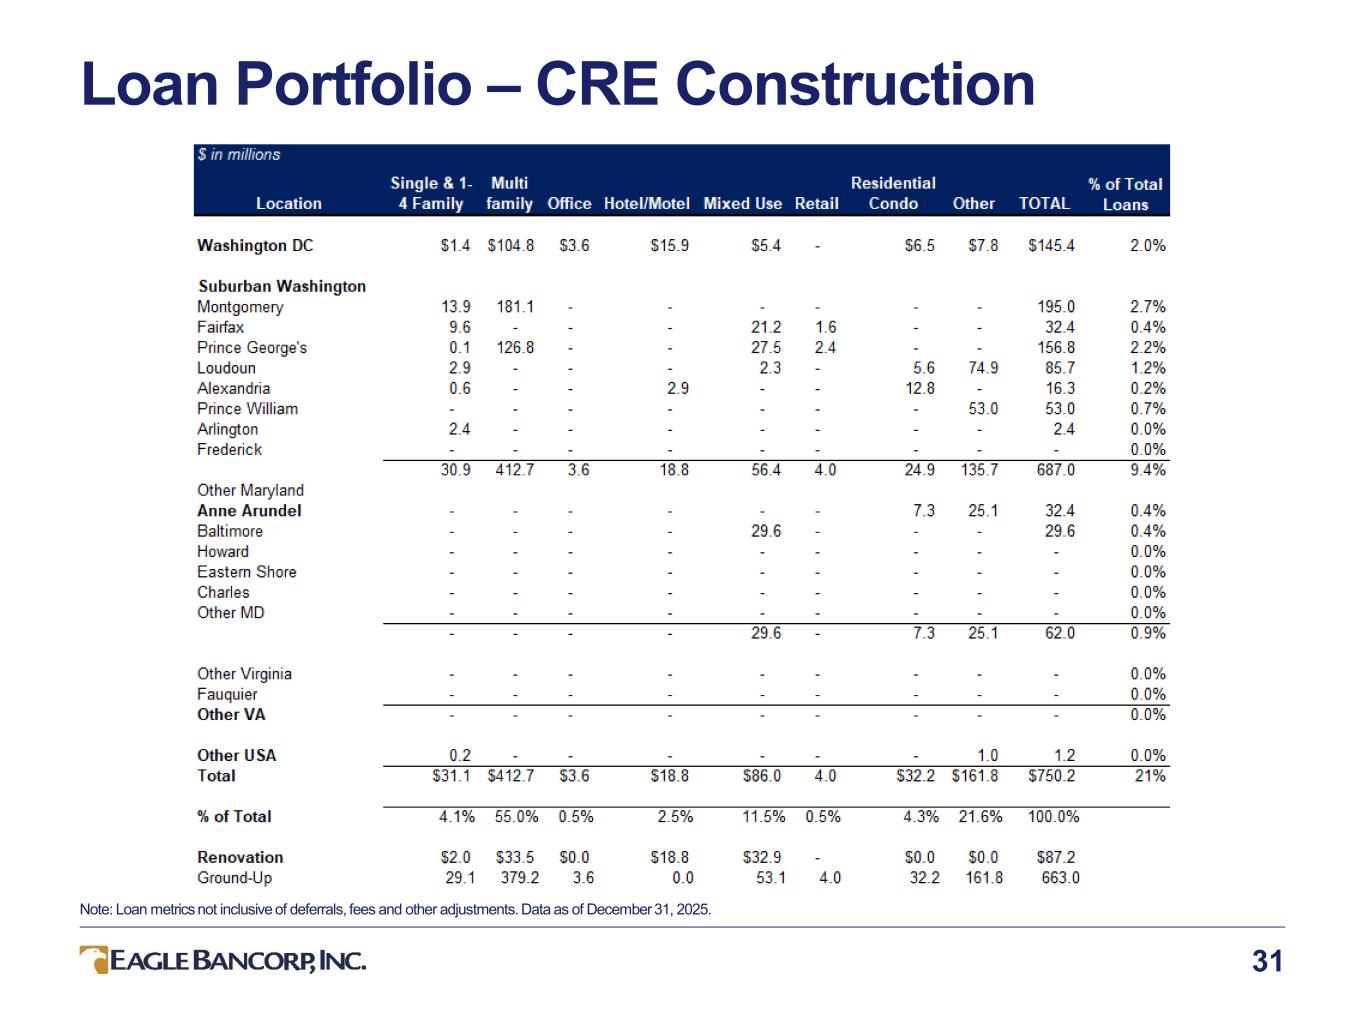
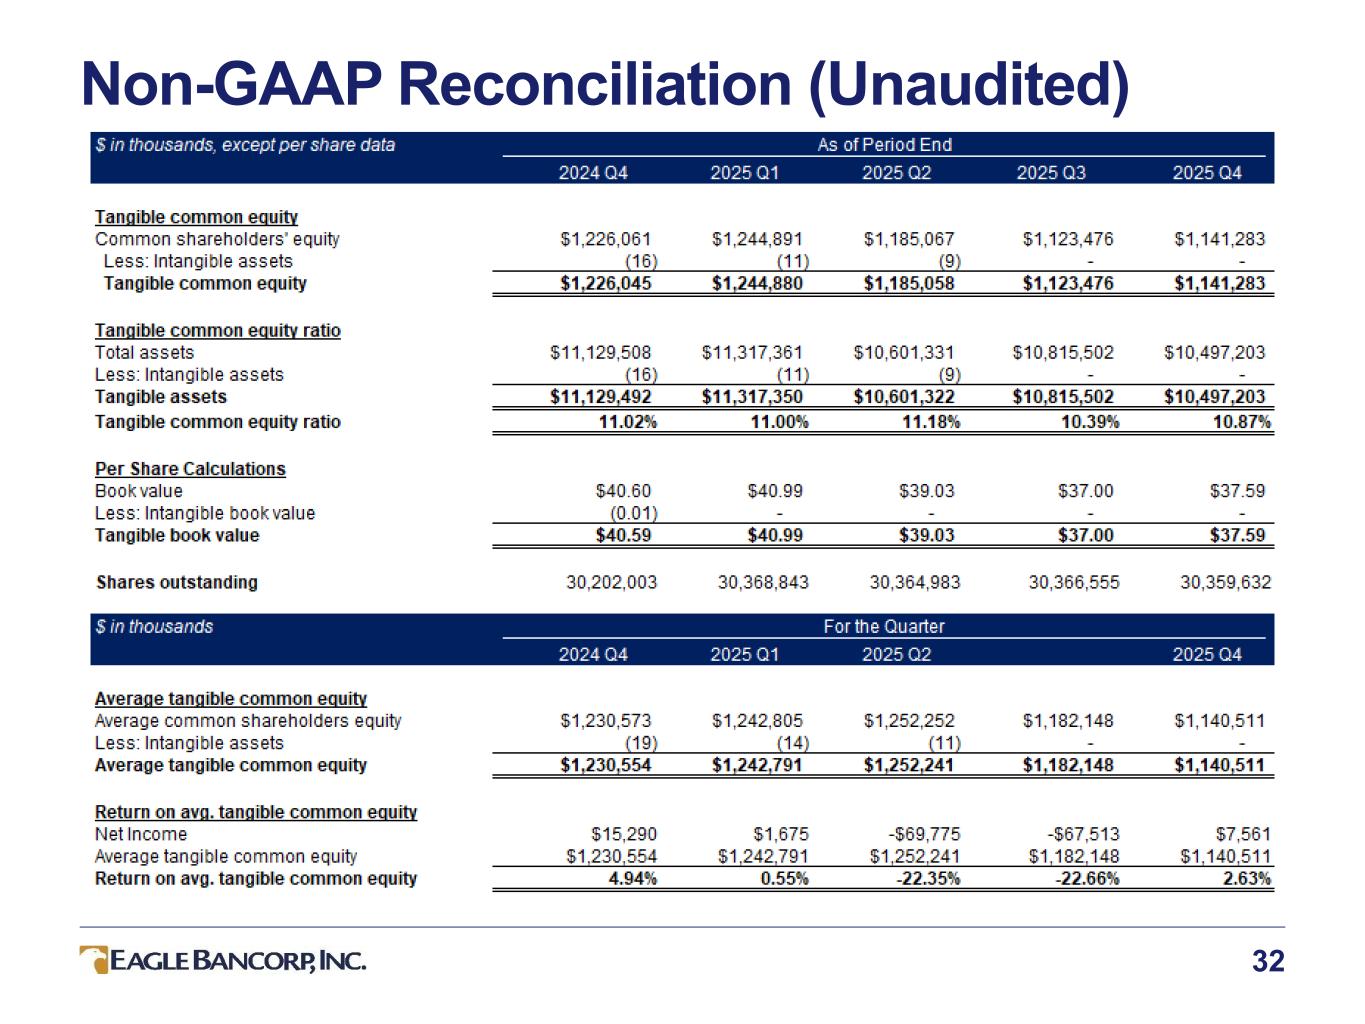
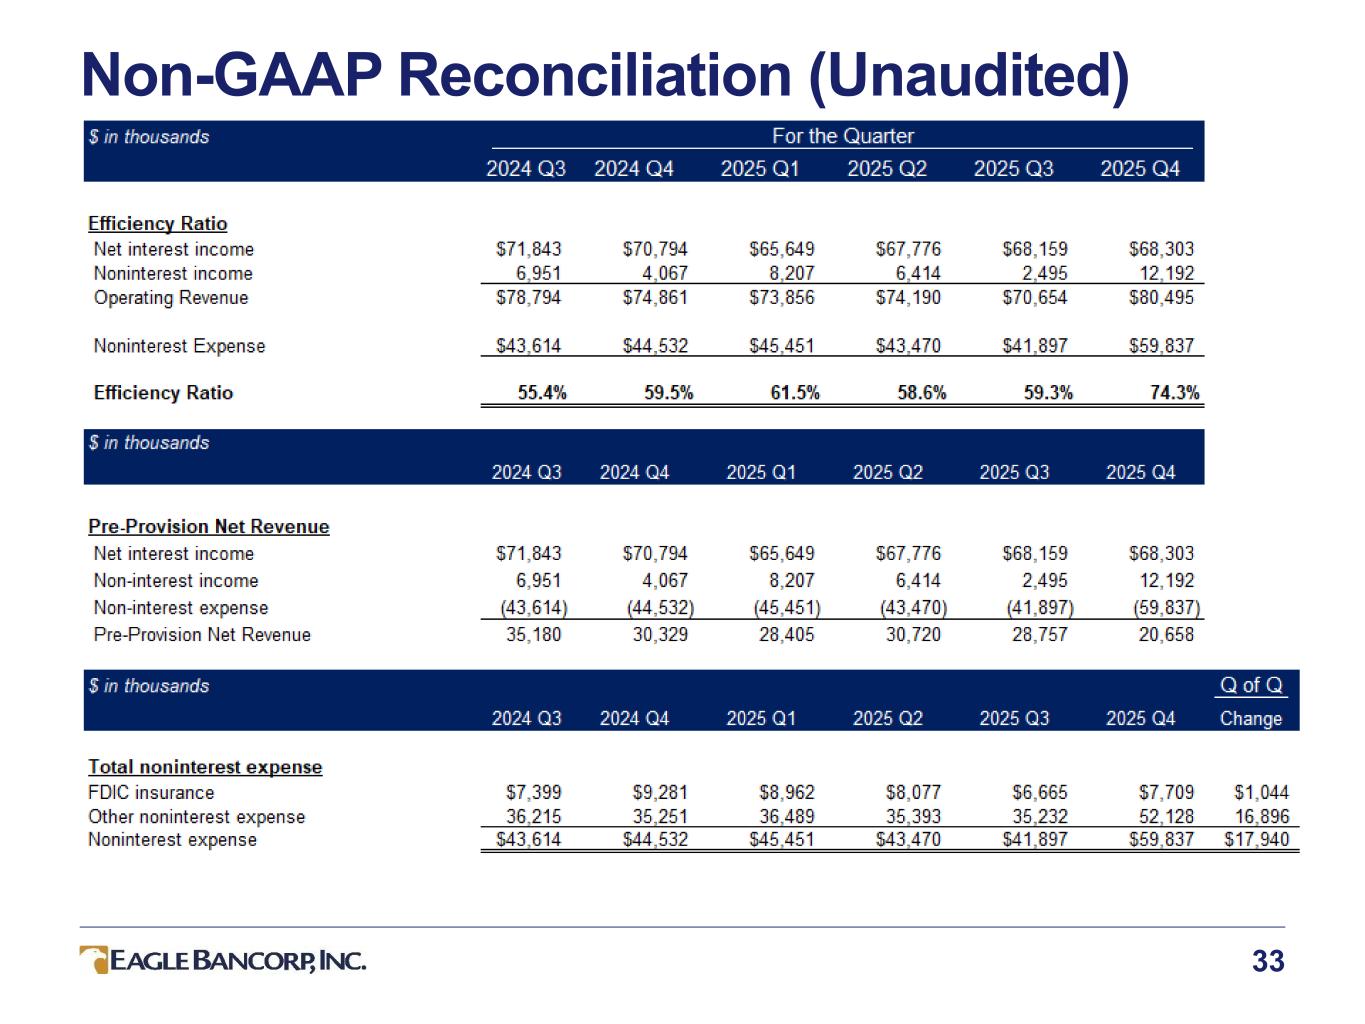
We reported net income of $7.6 million, or $0.25 per diluted share, compared with a $67.5 million loss, or $2.22 per share, last quarter. Let's start with asset quality. The fourth quarter results reflected the tradeoffs we discussed on our prior call. Credit stability supported book value, while plans held for sale loan dispositions created some pressure on fourth quarter earnings. In the quarter, $14.7 million was recognized relating to higher expenses associated with a disposition of held-for-sale loans, as well as mark-to-market expenses. At December 31, we had $90.7 million of loans held for sale, a decline of $45.9 million from the prior period, which includes $8.4 million of mark-to-market adjustments due to updated valuations informed by proposed or under-contract disposition activities. We recognize $1.1 million of loss on the $77.9 million of loans sold during the quarter. At December 31, 2025, non-performing loans declined to $106.8 million, down $12 million from the prior quarter, and represented 1.47% of total loans. Slide 23 of our earnings deck shows the walk between linked quarters for inflows and outflows of non-accrual loans. Total non-performing assets declined $24 million to $108.9 million, representing 1.04% of total assets as compared to 1.23% in the prior quarter. The land loan transferred to Oreo in the third quarter was sold during the fourth quarter with a gain of $900,000. special mention and substandard loans totaled $783.4 million at year end declining $175.1 million from the prior quarter this represents 10.6% of total loans at year end declining from 13.1% at September 30th provision for credit losses declined $97.7 million in the fourth quarter and totaled $15.5 million. Our allowance for credit losses ended the quarter at $159.6 million, or 2.19% of total loans. Of that total, we have $73 million of reserves associated with income-producing office loans, representing 13% of the $577.1 million outstanding at year end. Net charge-offs declined $128.6 million from the third quarter and totaled $12.3 million in the most recent quarters. Loans 30 to 89 days past due totaled $50 million at December 31, up $20.8 million from last quarter, primarily due to a participation loan, which was in process of being renewed and was booked yesterday for closure. Office loans totaled $577.1 million, and of that total, $469.2 million are pass-rated. Loans that exceed $5 million and are pass-rated are undergoing quarterly reviews. Smaller office loans have stronger credit enhancements than the larger office loans that we've worked through cycle to date. The fourth quarter saw dramatic reductions in our CRE and ADC concentrations as expected payoffs, resolutions, and the completion of construction projects drove down our CRE concentration ratio, which is a measure of CRE loans to total risk-based capital and reserves. That ratio declined to 322%, and the AGC concentration ratio, which measures acquisition, development, and construction loans over the same denominator, declined to 88% for the company as of year-end. From an earnings standpoint, pre-provisioned net revenue was $20.7 million. Included in that is $8.4 million in held-for-sale, mark-to-market expenses, and the $6.3 million in disposition costs related to loan sales. Net interest income grew $144,000 to $68.3 million as the decline in deposit and borrowing costs outpaced a modest reduction in income on earning assets. VIM declined five basis points to 2.38%, primarily driven by a mixed shift between loans and cash, partially offset by improved time deposit costs from reduced brokered time deposit usage. Non-interest income totaled $12.2 million compared to $2.5 million last quarter. The increase was primarily due to losses that did not reoccur in the fourth quarter and other income as a result of SBIC investments and the gain on the sale of Oreo. Non-interest expense increased $17.9 million to $59.8 million due to the $6.3 million in costs associated with a disposition of certain held-for-sale loans and $8.4 million in valuation adjustments on proposed transactions for the remaining held-for-sale loan portfolio. Our capital remains strong. Tangible common equity to tangible assets is 10.87%. Tier 1 leverage ratio is 10.17%, and CET1 is 13.83%. Tangible book value per share increased 59 cents to $37.59 as earnings added to capital. Continued deposit growth and a rising proportion of insured balances underscore the resilience of our funding base. With $4.7 billion in available liquidity, we maintain two times coverage of uninsured deposits. During 2025, our teams have reduced brokered deposits by $602 million while increasing core deposits $692 million, and we expect continued progress in 2026. The improvement reflects coordinated efforts among our C&I teams, branch network, and digital platform. Finally, turning to 2026, we are optimistic about our ability to expand pre-provision net revenue as outlined in our updated 2026 forecast on slide 11 of our earnings deck. While we expect average deposits, loans, and earning assets to decline on a year-over-year basis, this reflects deliberate balance sheet repositioning rather than operating pressure and reflects prioritization of shareholder returns and profitability. Loan balances entering 2026 begin from a lower level due to paydowns and resolutions that occurred throughout 2025, and the investment portfolio runoff in 2025 further reduces average earning assets. On the funding side, lower average deposits in 2026 primarily reflect the continued runoff of brokered funding as we prioritize building core deposit relationships. This shift in funding mix is expected to improve profitability. As a result, we're forecasting a meaningful expansion in net interest margin, with NIM expected to range between 2.6% and 2.8% for the year. This improvement is driven largely by a reduction in higher cost brokered deposits. Non-interest income is expected to increase by approximately 15% to 25%, while non-interest expense is expected to decline between flat and 4%. Importantly, this reflects normalization following elevated expense levels in the fourth quarter of 2025, which was previously discussed, and we do not expect to reoccur. Taken together, these trends support our confidence in expanding pre-provision net revenue in 2026 despite a smaller average balance sheet. I'll turn it back over to Susan for final comments ahead of the Q&A.
The fourth quarter tangibly demonstrates the progress we've made at Eagle Bank executing on our strategic plan. The actions we took throughout 2025 to address credit risk, reduce loan concentrations, and improve balance sheet quality are now clearly reflected in our results we exited the year with an improved risk profile higher core deposit higher core deposits allowing for reduced use of wholesale funding and improved visibility into the sustainability and trend of our earnings as we look ahead our focus will transition from foundational initiatives to consistent performance while we are not yet where we want to be in terms of bottom-line performance, were optimistic about the franchise's direction. Before we conclude, I want to thank our employees for their continued dedication and professionalism. Their commitment has been instrumental in navigating a challenging period and positioning the company for the future. With that, we'll be happy to take any questions.
Operator
Thank you. As a reminder, to ask a question, please press star 11 on your telephone and wait for your name to be announced. To withdraw your question, please press star 11 again. Please stand by while we compile the Q&A roster. And our first question comes from Justin Crowley of Piper Sandler. His line is open.
Hey, good morning, everyone. I want to start off on the asset dispositions, of course. You know, really encouraging progress. And, you know, it's obviously great to see not a whole lot in additional loss through the sales that got done. I was wondering if you could talk just a little more on what's left in health for sale in terms of the expected timing. I know you mentioned some agreements in place, and you took the additional mark through the expense line. So maybe just the confidence level in the current carrying value, what's left there.
Hi, Justin. This is Eric. At year end, we had $90.7 million of loans held for sale, and they're carried at the lower of cost or fair value. We did have that mark that ran through non-interest expense at year end to take into consideration fair value, which is informed by under contract or negotiating to a contract on disposition of approximately two-thirds of that portfolio. Right now, two-thirds of that portfolio is scheduled for resolution and disposition in the first quarter, but it's not done until it's done. So, you know, it could bleed into the second quarter.
Okay, got it. And then, you know, of course, you have the wide-ranging third-party review. But what's the thinking or expectation on the potential, if there is any, for any further moves into held for sale? Could this be it? Or is there a possibility that as we get through the year and credits with maturities a bit further out, perhaps get a closer look that you could see additional inflow into that bucket? What's kind of the thought there?
In looking at the total criticized in classified portfolio, which is 783 million at year end, down from 960 million. There certainly could be situations, Justin, where we might decide that selling the loan is the best strategy to maximize value to the shareholders. So I don't want to say that we're done there. There certainly could be situations that arise. I don't suspect you're going to see it at the pace of what you saw in 2025, and it's a case-by-case assessment.
Got it, and then I guess outside of office, and maybe one for you, Ryan, but, you know, it's certainly good to see some, what I thought was stabilization and actually some signs of improvement in multifamily. You know, it looks like a handful of some of these larger watchlist loans, got some updated appraisals that show some breathing room. I was just wondering if you could talk a little bit about the trends you're seeing there and if, you know, at this point we can maybe expect to see things continue to look better in that area?
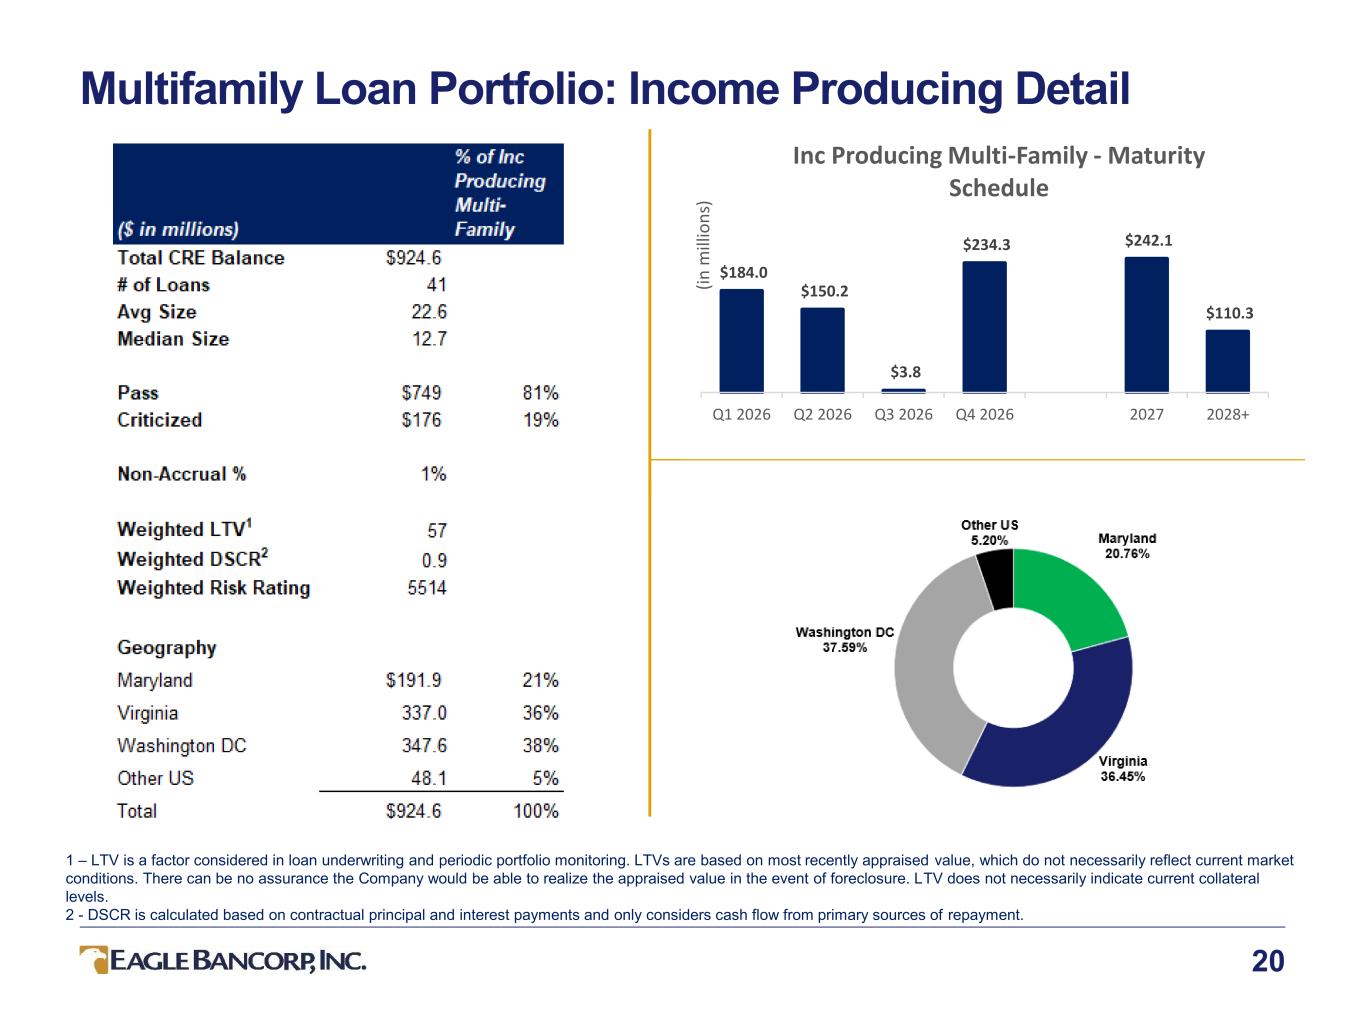
I think that, you know, we'll continue to be proactive in the problem one identification and looking at the portfolio on a regular basis as we have been. So what's in there, you've seen, to your point, Justin, there's been some migration positively and negatively in that criticized and classified population. Valuation, again, continues to be strong relative to the office market, where we saw significant losses, obviously, right? The multifamily market, the valuations have held up. Cap rates in our region are still sub-6% when compared to the national average of just over 6%. So we feel good about that and where our exposure is we're monitoring the income performance some of these are in lease up you know recently delivered properties so the the my my prognostication is that you will continue to see stabilization and improvement within that multifamily portfolio okay and then it just you know for the total loan portfolio just you know as far as where the reserves shook out this quarter with it moving a bit higher, including the increase in the office ACL.
Just, like, bigger picture, how are you thinking about eventually seeing that number move lower and, you know, maybe using it to absorb just any further charge-offs without, you know, the provisioning to match it?
The office overlay or the portion of the ACL that's attributed to the performing office did increase even though that's a qualitative aspect to the calculation it's driven quantitatively by experience that we've we've incurred throughout the prior 12 months in office and so when you quantitatively put that together it's driving approximately 45% of reserves and our substandard loans about 50 percent of that in our special mention loans and 50 percent of that for launch so when you put that all together that's what what comprises of the 73 million of reserves associated with the
577 million of performing office so as we move forward and we have less lost content in our look back period you'll see that ease off so the idea would be lower from here um if you know all goes according to plan as you as you see it today that is the way the calculation works um and then maybe just one last one and you know i know it's one quarter here and there's still some work to do but you know obviously a lot of positive signs uh and so you know when you think about capital planning over maybe the more medium term you know how do you think about the levels you're at with maybe a clearer picture on lost content um and you know i don't know if it's a bit premature but you know when do you think you could start entertaining a more offensive stance on capital management when you think about things like, you know, buybacks or the dividends? Again, I know it's kind of early days here, but just, you know, thinking a little bit more medium or long term.
We are going to continue to be prudent and use caution in terms of capital management. I would point to the criticized and classified loan level and where we're at. We need to continue to see continued migration down, so a favorable trend. The one quarter is not a trend, so we need to see two or three more quarters, and we also need to see a more absolute level that's acceptable before management would consider talking further to our board about additional changes in our capital management approach.
Okay, very helpful. I will leave it there. Thank you all so much.
Thanks, Justin. By the way, Justin, you asked how we would characterize the level of capital, and I would say it's strong.
Got it. Understood and agreed.
Operator
Thank you. And our next question comes from David Ciaverini of Jefferies. Your line is open.
Hi. Thanks for taking the question. So I just wanted to follow up on credit quality. Clearly a good update here. Can you talk about your confidence level that credit issues are behind you? Are you seeing any signs of lingering potential deterioration?
David, again, I point back to the criticized classified portfolio of $783 million. There's a lot of prudent credit management process that we're putting around that. Finance, credit, special assets teams are looking at that portfolio. We also spend time looking at the watch portfolio to understand any trends that could cause negative migration into the criticized classified. So, given the level of review on this portfolio every quarter, as well as pass-rated multifamily and office loans that are greater than $5 million, they're undergoing a quarterly review as well. we're not seeing any developing new trends based on what we see today and what we know today.
I would just simply add to that we have given problem loans and just loans in general high attention that we're constantly looking at them. That will not change. We will not slow down on that. So we'll continue to focus on reviewing and monitoring our loans.
Our expectation, David, will be that the criticized classified loan portfolio continues to decline throughout the year.
Great. And in terms of the dispositions, you mentioned two-thirds scheduled for the first quarter. It sounds like the level of buyer interest is high. Can you talk about what you're seeing in the secondary market? Are these private credit funds? Are they other banks? And is that a fair characterization that the buyer interest is high for these loans?
So, David, this is Ryan Reel. The buyers are a range of types of folks. The two-thirds that you're referencing, that Eric referenced in his comments, there's a range in that population, too. There's investors that are supporting local developers to convert to an alternate use some of the historic office properties. There's existing ownership that is looking at their situation and evaluating the go-forward plan and in some cases being willing to come in and purchase their own debt. In each and every case, we've said this for a number of quarters now, We are looking at every possible outcome and every possible path and determining on a case-by-case basis what the best path forward is to optimize the results for the bank and its shareholders. That continues to be the game plan in each and every case.
And then on the loan loss provision on a go-forward basis, Eric, you mentioned back in October that you're hopeful to get to a normalized level in early 2026. how should we think about it from here? Are we kind of at that point of getting to a normalized level? And how would you kind of define that normalized level? Are we talking kind of where we were in the second, third, and fourth quarter of 2024, kind of in that 10 million range? And any comments there?
Yeah, David, looking at the crew size classified portfolio level where it's I think that that would inform a provision expense level that's a little bit greater than what you were indicating from 2024, just given that that portfolio was smaller at that point. But we're not, I'm gonna say the obvious here, but we're not gonna see provision levels that we saw in 2025. But I think that there could be some provision expenses that are more heightened than 2024, given the level of where credit size and class size. But it's also important to say what I said last quarter, that capital will continue to, or credit is not going to cause further degradation of book value.
Got it. That makes sense. Thank you.
Operator
Thank you. And our next question comes from Catherine Mielor of Keith, Marrette & Woods. Your line is open.
Thank you. Good morning. One follow up on credit. Thank you. Good morning. Just one follow up on credit. The special mention was great to see that decline. I know it looked like you had maybe an upgrade from substandard and then a new credit, but then you had some come off. And so I was just curious if you could give us a bit more discussion on the credits that were upgraded or came out of special mention, just some stories or color around what those credits were, what caused them to move out, and just so we can kind of understand some of the puts and takes within that category. Thanks.
Sure. So, Catherine, this is Ryan. Big categories that help the positive migration there are improved performance at the property level. And then in certain cases, there are structural enhancements to that loan that may have been under-considered, if you will, in the past with updated information and proof of the willingness and capability of those sponsors to stand behind their credit. we made some of those upgrade decisions as well got it okay great um and then i guess i'm going to maybe try again on the on the provisioning piece i think i think that's that's the biggest question we all have is where do we put our provision expense for 26 and i guess that's the magic number but um as i look at the res as i look at the reserve um i mean it should be fair
that we should see the, I guess the question is how much, how much of a, how much of current expectations of losses you think are in the reserve? And is it fair as you continue to work through this level of classified, which to your point, Eric, is still very high, right? Still 10%. We still have a lot to work through, but your reserve is also very high, over 2%. So as you kind of keep working through that, at what point should we see the reserve start to decline? and where's a fair number or at least maybe a range of where that kind of trends to towards the end of the year?
You know, given our one quarter of improvement, I think it's prudent for management to be cautious about where we think the provision expense in telling you all what we think provision expense is. We certainly have our views on it given what we've worked on. And I can tell you that we do expect the ACL coverage to decline this year. We do expect that there is potentially lost content in that $783 million, some of which we've identified and have reserved for through specific reserves. So it is sitting in the ACL. But we also have some unidentified migration, portfolio migration, that are things that we don't know about yet. So I guess, Catherine, I probably am going to punt a little bit and try not to answer your questions with specificity until, I think, next quarter, if we have another continued trend, then I think we could be a little more focused in answering that question for you.
Yeah, that makes sense. That makes sense, fair enough. And then maybe my last question is just it was nice to see the inflows of new credits blow dramatically this quarter, which we would have expected just given the portfolio review we saw last quarter. But there were a couple of – like you had a couple of inflows, new credits that kind of came in to special mention, for example, that $43 million multifamily credit. So for the new credits that came in this quarter, what happened this quarter that your loan review did not catch? And is there anything within that that we should kind of be thinking about that would be a risk of new migration in the next couple of quarters?
Yeah. So with specificity on that $43 million loan, Catherine, that's a newly built multifamily property in a particular sub-market of Washington, D.C. that saw an influx of supply. So while this property was nearing stabilization, there was a sort of hiccup in that stabilization process because of that inflow of supply, reintroducing concessions in that sub-market. Reacting to that, We worked with the sponsor to put in place a go-forward plan that has cash flow sweeps and other mechanisms in it to protect the bank. The reality is that the supply, the new supply under construction in our region is very, very small. It's less than half of what it's been historically. So with the passage of time, those units will be absorbed. Those concessions will burn off, and the stabilization will occur, and we'll have enhanced credit structure on that particular loan through that stabilization period. So that's what happened in that quarter was just that, right? The information came through on the, you know, pickup and supply and the, you know, plateauing, frankly, of that stabilization process.
Great. Very helpful, caller. All right. Thank you. Thank you.
Operator
Our next question comes from James Abbott of Diligence Capital Management. your line is open.
Hey, good morning, everyone. I wanted to see if we could get some additional color on a CNI loan growth. It was about $120 million. That's about a 40% annualized rate. Could you provide a little context as to whether the loans are coming through SNICs? Are they bilaterals? Maybe some yields, that kind of thing, just so that we can understand the color around that type of production, and secondly, is it sustainable?
So the growth of our C&I platform is a sustainable expectation that we should all have. The growth level seen in the fourth quarter at that enhanced growth level is probably not a sustainable figure. Speaking to the diversity question, James, the C&I portfolio does not have great concentration really in any industry. There are some syndications and participations in that number. That is not an ongoing strategy that we're going to employ. Evelyn and her team have done an excellent job of bringing in relationships with debt and deposit balances on the other side of the balance sheet. So that's where you see it, and the numbers are reflective of that. You see actually greater in the fourth quarter deposit growth in the CNI book than you do loan growth.
Sorry, Ryan, could you just give us some sort of sense for maybe the typical size of those deals that were coming in during the quarter? Are they typically 5s and 10 millions or more 20 and 30 million sort of relationships?
I'd say more on the higher end of the range that you just cited probably 15 to 30 that's an off-the-cuff number I'm not looking at the portfolio to justify it but I'd say probably on average it's in that 15 to 30 range okay thanks very much then also I had a question probably for Eric could you maybe give us some context for the cash level that you're holding and then the broker deposit level and I suspect it's probably a negative spread at this point, and you're probably working to address that. But could you give us a sense for what the brokered deposit level is today and then how much you anticipate bringing that down? Can you use cash to pay that down, et cetera?
Yeah, a couple things. There was, when you look at average cash in the fourth quarter, it was definitely higher than normal, and it was in anticipation of paying down a material level of brokered deposits that were coming up for a stated maturity. So we were holding that cash in anticipation of paying down those brokered deposits. We have, on an average basis, we do have a third-party payment processor that does hold some deposits with us in the middle of the month that can cause the averages to increase at a high level, but it generally isn't a period and doesn't impact period-end cash that much. In terms of brokered deposits at year-end, we have, excluding two-way deposits, we have $1.56 billion that has a weighted rate of 4%. And we're going to continue to work that down through 2026.
And Eric, are there maturity dates on those that you could give us some sense for? Is it pretty spread out throughout the year? And how much do you think you can attack? Do you think you can get rid of half of that in 2026 or just any sort of context on that?
Yeah, of the $1.56 billion in brokered, $715 million of that is a brokered CD. So I would say it's probably spread throughout the year. And our goal is to reduce a lot of those CDs down to close to zero.
Operator
Thank you. And our next question comes from Christopher Maranek of Denny Research. Your line is open.
Speaker 10
Hey, thanks. Good morning. I think that Ryan addressed a little bit of this question in the last few callers, but I was curious about sort of the surprises for past loans going bad in the future. It would seem that you have smaller loans if that indeed is the case. And I just wanted to sort of talk through sort of, you know, where would there be larger loans that could surprise, that are past now, but that could surprise if they were downgraded in the future?
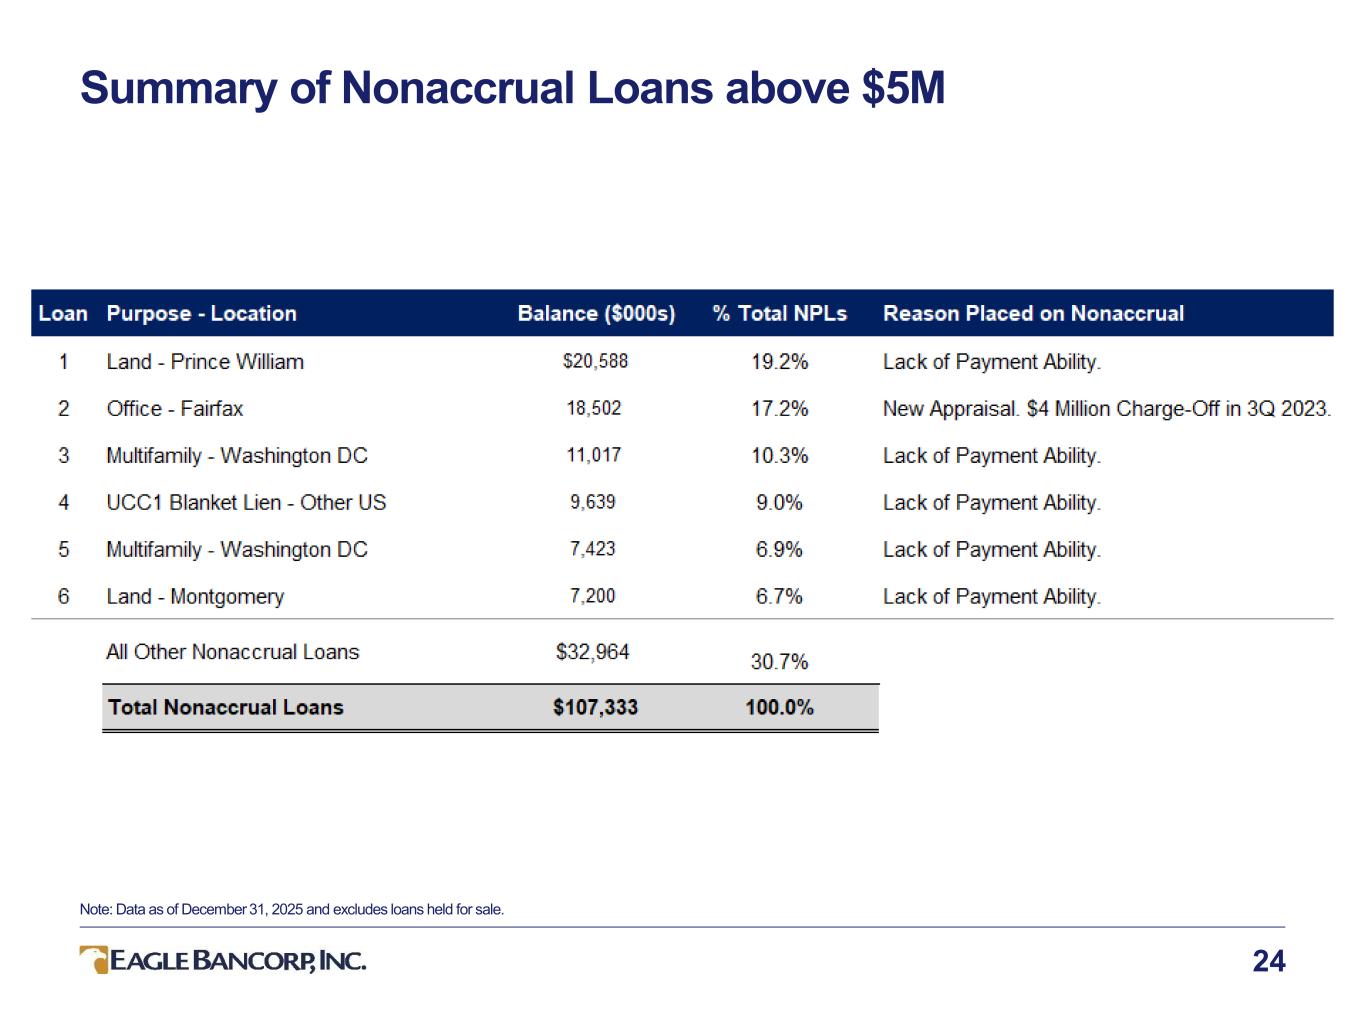
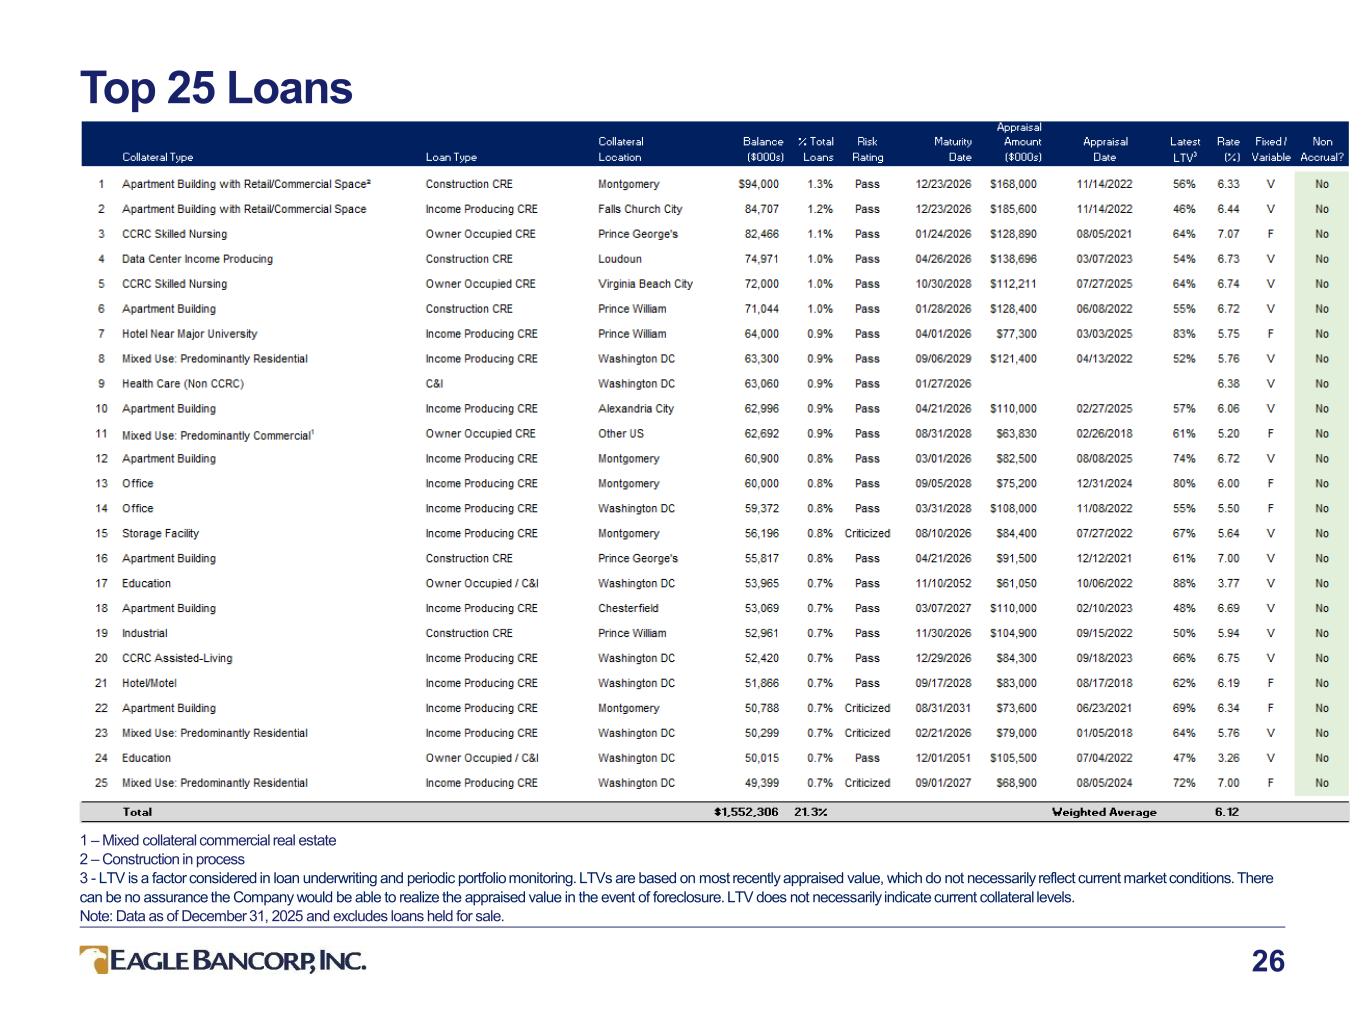
Well, hey, Chris, how are you? The top 25 list shows where they are, shows the type of exposure there is. Again, these, you know, to Eric's earlier point, multifamily loans that are past rated and in size greater than $5 million, we're looking at on a quarterly basis. office properties are there. There's not an asset. There's some slight headwinds in the multifamily space, which is what we've talked about, again, with the back-end valuation issue not there relative to what we've seen in office. The surprises coming into the substandard category, there was one particular land loan that we found out had some characteristics in it that came to light during the last quarter, and they were material and impactful. That's still, you know, we're working through that situation and coming up with the determination of where it is. The other transaction that came in, the mixed-use residential into the substandard category, that is a multifamily construction loan that we're a participant in, a 50% participant in, that had some challenges relative to the agency takeout that is committed to on that. The workout plan has already been addressed, and, in fact, we anticipate a full payoff of that by the end of this month. So that's a material thing. It's also notable that two of the top 11 loans that are listed in the top 25 loan list in multifamily have been refinanced, And the aggregate balance there is about $130 million. So there's good and positive migration from a balance perspective. And we don't anticipate any fundamental issues like we've seen in office. And therefore, the surprises should be limited with all the risk mitigation structures and processes we've put in place.
And just to build off what Ryan is saying, the theme here is that the proactive credit at risk management characteristic, or the behaviors that the management team with credit in the line have deployed this year to reduce the amount of surprises that we may have seen in earlier years and periods and be very thoughtful about and having a high level of attention and identifying the primary source of repayment and if there's weaknesses or issues there, we will appropriately risk rate that loan so we can monitor it, and it allows us to intervene much earlier in the process, which will maximize our options to maximize shareholder value in the event that there is some disposition that needs to occur.
Speaker 10
Great. Thank you both for that. I appreciate the additional caller. And then, Eric, I know that the guide for 26 is to have shrinkage of the balance sheet, And I'm just curious if there's a point where you may get to where it's stable and grows slightly before year-end, or do you think you'll be shrinking for the entire calendar year?
I actually don't believe we're going to shrink for the entire calendar year. I suspect we'll see CRE that continue to decline in the first half of the year, and then there'll be some stabilization in the back half of the year, which will then support growth, period end growth in the second half of 2026. And the last question, sorry, go ahead. Well, I was just going to add, you know, the period end is a little different given that we're making money on the averages and, you know, we're comparing the period end of 2026 compared to the average of last year.
So that's why you're seeing that forecast in terms of declines on average earning assets got it great thanks again for that and then just a last question I know the C&I balances grew quarter on quarter are you still hiring producers in that part of the operation we absolutely are still looking for strong producers in that area great thank you Susan Evelyn has her hand out there, constantly reviewing, and there are some candidates that we are exploring.
Speaker 10
Thank you again for taking all of our questions today.
Operator
Thanks, Chris. Thank you. I'm showing no further questions at this time. I'd like to turn it back to Susan Real, President and CEO, for closing remarks.
Thank you very much for your participation and questions during the call, and we look forward to seeing you again next quarter.
Operator
This concludes today's conference call. Thank you for participating, and you may now disconnect.