Operator
Good morning, ladies and gentlemen, and welcome to the EastGroup Properties, Inc. Fourth Quarter 2024 Earnings Conference Call and Webcast. At this time, all lines are in listen-only mode. Following the presentation, we will conduct a question-and-answer session. This call is being recorded on Friday, February 7 of 2025. I would now like to turn the conference over to Marshall Loeb, President and CEO. Please go ahead.
Good morning, and thanks for calling in for our Fourth Quarter 2024 conference call. As always, we appreciate your interest. Brent Wood, our CFO, is also on the call. And since we'll make forward-looking statements, we ask that you listen to the following disclaimer.
Speaker 2
Please note that our conference call today will contain financial measures such as PNOI and FFO that are non-GAAP measures as defined in Regulation G. Please refer to our most recent financial supplement and to our earnings press release, both available on the Investor page of our website, and to our periodic reports furnished or filed with the SEC for definitions and further information regarding our use of these non-GAAP financial measures and a reconciliation of them to our GAAP results. Please also note that some statements during this call are forward-looking statements as defined in and within the safe harbors under the Securities Act of 1933, the Securities Exchange Act of 1934, and the Private Securities Litigation Reform Act of 1995. Forward-looking statements in the earnings press release, along with our remarks, are made as of today and reflect our current views of the company's plans, intentions, expectations, strategies, and prospects based on the information currently available to the company and on assumptions it has made. We undertake a duty to update such statements or remarks, whether as a result of new information, future or actual events or otherwise. Such statements involve known and unknown risks, uncertainties, and other factors that may cause actual results to differ materially. Please see our SEC filings, including our most recent annual report on Form 10-K for more detail about these risks.
Thank you, Keena. Good morning, I'll begin by expressing my gratitude to our team. They put in significant effort throughout 2024 in what was not always a stable environment. I'm proud of the outcomes they achieved amid these challenges. Our fourth quarter results highlight the strength of our portfolio and the ongoing durability of the industrial market. In terms of performance, we saw funds from operations increase by 5.9% for the quarter and 7.9% for the year, excluding involuntary conversions for each year. For more than a decade, our quarterly FFO per share has consistently surpassed that of the same quarter in the previous year, showcasing a reliable long-term trend. Annual leasing stood at 97.1%, with occupancy at 96.1%. The average quarterly occupancy was 95.8%, which remains historically robust, although it is down over 200 basis points from the fourth quarter of 2023. Our quarterly re-leasing spreads were reported at 47% GAAP and 29% cash. For year-end results, we achieved 50%, 30%, and 36% GAAP and cash, respectively, and cash same-store NOI grew by 3.4% for the quarter and 5.6% for the year, despite declines in occupancy during both periods. Moreover, we possess the most diversified rent roll in our sector, with our top ten tenants now representing only 7.2% of rents, a decrease of 70 basis points from year-end 2023, and spread across more locations. We believe that our geographic and revenue diversity serves as a strategic advantage to stabilize future earnings growth, regardless of the economic climate. In summary, we are satisfied with our performance in 2024, including a record lease volume within our operating portfolio this past quarter. Additionally, we are observing an increase in prospect activity. While we aim to convert these prospects into signed leases, we remain optimistic about the improving economic conditions and limited new supply. Although “green shoots” may be a frequently used term, we are hopeful that the trend continues, leading to a stronger latter part of 2025. Our focus is on creating value through increasing rents, acquisitions, and development. This strategy enabled us to end the quarter at 97.1% and continue to enhance rents across the portfolio. We are enthusiastic about the acquisition opportunities we announced, which were finalized late in the fourth quarter. In Dallas, we acquired four fully leased buildings next to the DFW Airport, increasing our holdings in that submarket to about 2.7 million square feet. In late December, we finalized the acquisition of four fully leased buildings, expanding our presence in the Phoenix area. Overall, our acquisitions are driven by two main criteria: first, they must be immediately accretive, and secondly, they should enhance the long-term growth profile of our portfolio, thereby increasing NAV per share. Furthermore, in each of these instances, we have expanded our position in fast-growing, land-constrained submarkets. As we have previously mentioned, our development projects are motivated by market demand within our parks. We anticipate that our 2025 starts will reach $300 million, with most of these projects planned for the second half of the year. Although our development activity is picking up, decision-making continues to be deliberate, with prospects concentrating on later phases of the construction timeline. Ultimately, our starts will align with ground-level demand to guide the pace of development. Looking ahead, the ongoing decrease in the supply pipeline is encouraging, with the construction pipeline at its lowest since early 2016. Assuming demand remains relatively steady, we expect the market to tighten in 2025, enabling us to continue increasing rents and seize development opportunities. As demand strengthens, our objective is to capitalize on development prospects earlier than our private competitors, leveraging our team's expertise, our strong balance sheet, existing tenant needs for expansion, and our available land and permits. Brent will now address several topics, including our assumptions for the 2025 guidance.
Good morning. Our fourth quarter results demonstrate the excellent work of our team, the strong performance of our portfolio, and the ongoing effectiveness of our established strategy. FFO per share for the fourth quarter was $2.15 compared to $2.03 for the same quarter last year, marking a 5.9% increase. From a capital perspective, we continue to engage with the equity market. During the quarter, we issued common shares for a total of $159 million and settled share agreements for $308 million, with an additional $37 million settled after the quarter ended. Overall, the transactions in the fourth quarter were executed at an average price of $178 per share. Currently, we have $30 million in outstanding forward agreements and full availability on our $675 million credit facilities. In December, we repaid two unsecured notes totaling $120 million. After the quarter, we refinanced a $100 million unsecured term loan, reducing the credit spread by 30 basis points, which results in approximately $1.5 million in savings over the next five years. Despite changing capital markets, our balance sheet stays robust and flexible with strong financial metrics. Our debt to total market capitalization stands at 15%. Our debt-to-EBITDA ratio has decreased to 3.4x, and our interest and fixed charge coverage ratio is at 11.5x. Looking ahead to 2025, we estimate FFO guidance for the first quarter will be between $2.05 and $2.13 per share, and for the year, between $8.80 and $9. The midpoints suggest increases of 5.6% and 7.1% from the prior year, excluding gains from involuntary conversions due to insurance claims. Approximately 37% of the expected annual G&A expense is anticipated to occur in the first quarter, mainly due to accelerated expenses for employees eligible for retirement under our equity incentive plans. Our rent collections remain strong, with tenant defaults limited to a few larger customers. We expect a consistent run rate of around 30 basis points of revenue for uncollectible accounts in 2025. Key operating assumptions for our 2025 guidance include an average occupancy midpoint of 96%, a cash same-property midpoint of 5.9%, $300 million in new development starts, and $150 million in strategic acquisitions. Our projected capital proceeds of $450 million are planned to be a mix of equity issuance and revolver usage. There are four debt instruments set to mature in 2025, totaling a modest $145 million. In conclusion, we are satisfied with our solid results from 2024 and thank all EastGroup team members who are participating in the call today. As we move forward into 2025, we will continue to leverage our financial strength, the expertise of our team, and the quality and location of our multi-tenant portfolio to guide us into the future. Now, Marshall will provide final remarks.
Thanks, Brent. In closing, I'm proud of our 2024 results, and I'm excited about the outlook for 2025. Internally, we continue to grow earnings while strengthening the balance sheet. Others have described the environment as churning, which seems accurate. Against this backdrop, we're focusing on three key strategies. First, we're maintaining high occupancies while pushing rents. Second, we're advancing development starts where submarket opportunities allow. Lastly, over the past two years, we've identified several attractive long-term investment opportunities, which are much more prominent in a stable market. Looking at the broader picture, I appreciate our positioning as our portfolio benefits from several long-term positive trends such as population migration, near-shoring and onshoring developments, evolving logistics, and historically lower vacancies in shallow bay markets. Our management team has a strong track record over the long term, and our portfolio quality in terms of constructions and locations improves each quarter. Our balance sheet is stronger than ever, and we're enhancing our diversity in both tenant base and geography. Finally, I want to congratulate our friend and board member Eric Bolton on his upcoming retirement from MAA. Eric has made a lasting positive impact on MAA, and in his spare time, he's contributed to EastGroup as well. We'll now open up the call for any questions.
Operator
Our first question comes from Andrew Berger from Bank of America.
Speaker 4
This is Andrew on for Jeff Spector. Marshall, you mentioned the word green shoots earlier. I'm just curious if you're seeing this in any particular market?
I wouldn't say thankfully, no. I mean yes and no. It's not limited to any market. It felt pretty broad-based, really kind of late last year where prospect activity started to pick up. And thankfully, that's continued into this year. Even in California, which we've mentioned before has had some credit challenges and has been a slower market, we're seeing pretty good signs of vacancy that we're making progress on in L.A. But even there, the activity has increased. So again, it could change next week, but we're encouraged by the situation and we just need to convert those tours, proposals, and letters of intent into signed leases. I'm pleased that it's not just in Florida or Texas; it's pretty broad-based across the portfolio.
Speaker 4
Got it. I appreciate that color. And maybe as just a follow-up. I know your portfolio is more focused on consumption, but obviously, with tariffs being pretty topical over the past several weeks, I'm curious if that's come up in any conversations with your tenants and any themes that are worth calling out?
No, it's not come up in any tenant conversations that I'm aware of. I do think it's got to affect how people think about them, and we can talk a little later in the call as well about it. To us, it really affirms as you mentioned, this is why we want to be near the consumer. Look, if your shoes come from China, Mexico, or the U.S., we just want to be near where that customer is buying their goods and services. And that's why we try to stay clear of ports, even though we're in some port cities; we steer clear of the port because that seems much more volatile where that end user last-mile consumption is stickier, and so we view it as a way to really kind of smooth out or avoid earning shocks by staying ideally near the consumer and, in most cases, we are near a growing consumer base.
Operator
Our next question comes from the line of Alexander Goldfarb from Piper Sandler.
Speaker 5
And I forget if it's one or two questions, but it sounds like it was two. So just with that in mind, Marshall, on the development side, I think you said it was record leasing in the operating portfolio, but the development leasing was a little bit slower, but then you commented that you want to ramp development. So are you anticipating a return of the eventual development demand? Or are you seeing it real-time where your positive development comments are supported by increased expansion demand by tenants?
Yes. The good news is that we have a lot of analysts following EastGroup. We were trying to limit it to one question to maintain the trend.
Speaker 5
I'll keep it to one. I'll keep it to one.
Thank you, Alex. Last year, we reduced our development starts for the first time in several years due to a lack of leasing in the market. However, if you examine our timeline, you'll see that we initiated several projects in the fourth quarter. The situation varies by submarket, but our development starts are expected to increase this year, particularly in the latter half. This is influenced by supply reaching an eight-year low. If anyone is interested, in our investor roadshow there's a slide around Page 16 that illustrates vacancy rates by product size, highlighting the limited supply in Shallow Bay. The sector is experiencing low supply and vacancy. We estimate that starting late this year, with about 9 or 10 months to complete a building, we will require about a year to lease it up. Given the current activity, we anticipate that demand will strengthen, making it an opportune time to accelerate development. Our guidance reflects this expectation, with more tenants likely moving into developments in the second half of this year and an uptick in development starts during that same period.
Operator
Our next question comes from the line of Craig Mailman from Citigroup.
Speaker 6
Just want to touch on the delevering you guys have been doing. When I look at the balance sheet, you guys are down to 3.4x debt to EBITDA, and you issued some equity that was relative to us, a little bit below NAV. Just kind of trying to get a sense of are you guys trying to position the balance sheet to do a bigger transaction? Or is the capital deployment on the development side just not pencil with where debt rates are today? Just trying to get a sense of where you think the optimal leverage is for you guys? Or is this just kind of building capacity for the future?
Sure, I’ll respond. It's not our intention to lower the balance sheet for any specific reason or to reduce leverage. We have limits that we haven't approached, and we have metrics on the upper end we don't want to exceed for a healthy balance sheet. This situation has arisen from an unusual but prolonged period where we've seen equity as a more favorable investment compared to debt. In the past, this included alternatives like the revolver. This past quarter, our position was likely at the lower end of our preferred range, close to our net asset value, though that’s not an exact measure and varies widely. There's a significant difference in estimates among analysts that follow us. We're focusing more on cost spread. The main reason for issuing equity is due to our team's success in securing excellent acquisitions recently, which has given us solid justification to raise capital. We're aiming to capitalize on these opportunities. This year, in our guidance, we’re planning for a mix of revolver use, which is currently low, and equity; we're open to carrying a bit more balance on the revolver. It's a dynamic situation. If interest rates stabilize at some point, we see long-term potential for EastGroup, which would allow us to access more capital. In summary, this stance reflects our assessment rather than being a deliberate strategy.
Speaker 6
Thank you for that information. I’d like to ask a follow-up question. Regarding your comment about development decision-making occurring later in the process, I understand that this was the case during the last cycle when pre-leasing was taking place. Could you provide some insight into the tenant pool for the available development space you have, including the Starship space and the comparable space that you reclaimed?
Sure. I really appreciate both perspectives. The tenant pool seems to be more positive now. It makes sense to me that tenants are taking longer because as the supply increases significantly, every prospective tenant has a broker who wants to ensure the space is ready when they tell their clients it's available. With completed options or second-generation spaces, they want to avoid situations like saying a space will be ready in June but not being ready until August. They've had the time to wait, and during the peak, there was a fear of missing out. This situation has really boosted our development since we were finishing a lot of what we built. We typically expect a year to lease up. The good news is that unlike in the financial crisis, we have active names and prospects; as one of our team members mentioned, while they would be more willing to offer free rent, they don’t know who to offer it to. Here, we do have tenants and ongoing negotiations, but the decision-making process has slowed down. I’ve seen some data indicating that it takes about nine months to decide. However, I believe we're beginning to see some improvement in the first half of the year. Recently, I’ve noticed a couple of spaces where tenants have actually lost out on opportunities. It feels unfortunate for those who didn't make timely decisions, but we haven't seen that happen in 18 to 24 months. With supply at an eight-year low and vacancy rates quite low, this should encourage tenants to act with more urgency. Looking at our situation, I’m optimistic about our opportunities this year. We have budgeted for positive developments in the second half of the year based on our expectations. We're pleased with the current activity; if things improve sooner, we'll increase our construction efforts, and if not, we’ll scale back as we did last year. We also have a sizeable space in Charlotte and another in South Bay related to Starship, which faced bankruptcy issues in the fourth quarter. Although we don’t have many large tenants, we do have 20 tenants over 200,000 square feet. Unfortunately, two of them went bankrupt last quarter after struggling for a year, but we're still seeing good activity. I’m optimistic about the negotiations on both of these spaces, and as soon as we secure anything, we will inform you. Overall, I’m cautiously optimistic about our current activity and how we’re approaching the year. I love showing the spaces; we just need to finalize the deals.
Operator
Our next question comes from the line of Todd Thomas from KeyBanc Capital Markets.
Speaker 7
This is AJ Peak on for Todd. So just to piggyback real quick off of Craig's question. Could you just quantify a little bit the development leasing in regards. So I think back in November, you said that the decision-making was taking 15 to 16 months. Previously, it had been within that 12-month time frame. Could you just quantify? Or is it still kind of that 15- or 16-month time frame?
It's becoming more similar. I believe things are gradually changing, and our development pipeline has been revealing. When I review what we've completed over the past few years, even with some projects taking longer than anticipated, our output last year yielded 7.8%, exceeding our underwritten expectations despite additional carry costs. We're not facing significant pushback on rents and tenant improvements; rather, it's about getting clients ready to move forward. Nationally, renewals as a percentage of signed leases have increased, now sitting in the 30% range compared to the 20s over the past few quarters. I anticipate this will decrease, and although it seems like things are shifting, we're still in the early stages. I think people will begin to feel the urgency to secure space to avoid missing opportunities like what happened previously. I don't foresee a repeat of the last frenzy, which caused some of the current challenges in Los Angeles and led to widespread investment in industrial development. Hopefully, we won’t reach that level of overheating again. It appears we are in a cyclical business; after a slowdown, this year seems to be picking up, with increased activity over the last couple of months, particularly from mid-fourth quarter to now. We're pleased with the year’s start and are slightly ahead of our initial projections, and I hope we can maintain that momentum as the year progresses.
Speaker 7
Okay. That's helpful. And then just real quick, how are you thinking about rent change in '25? I guess, what sort of range would you expect to achieve on new and renewal leasing? And how far through the 2025 lease expirations are you? And what has rent change looking like so far year-to-date on that pool?
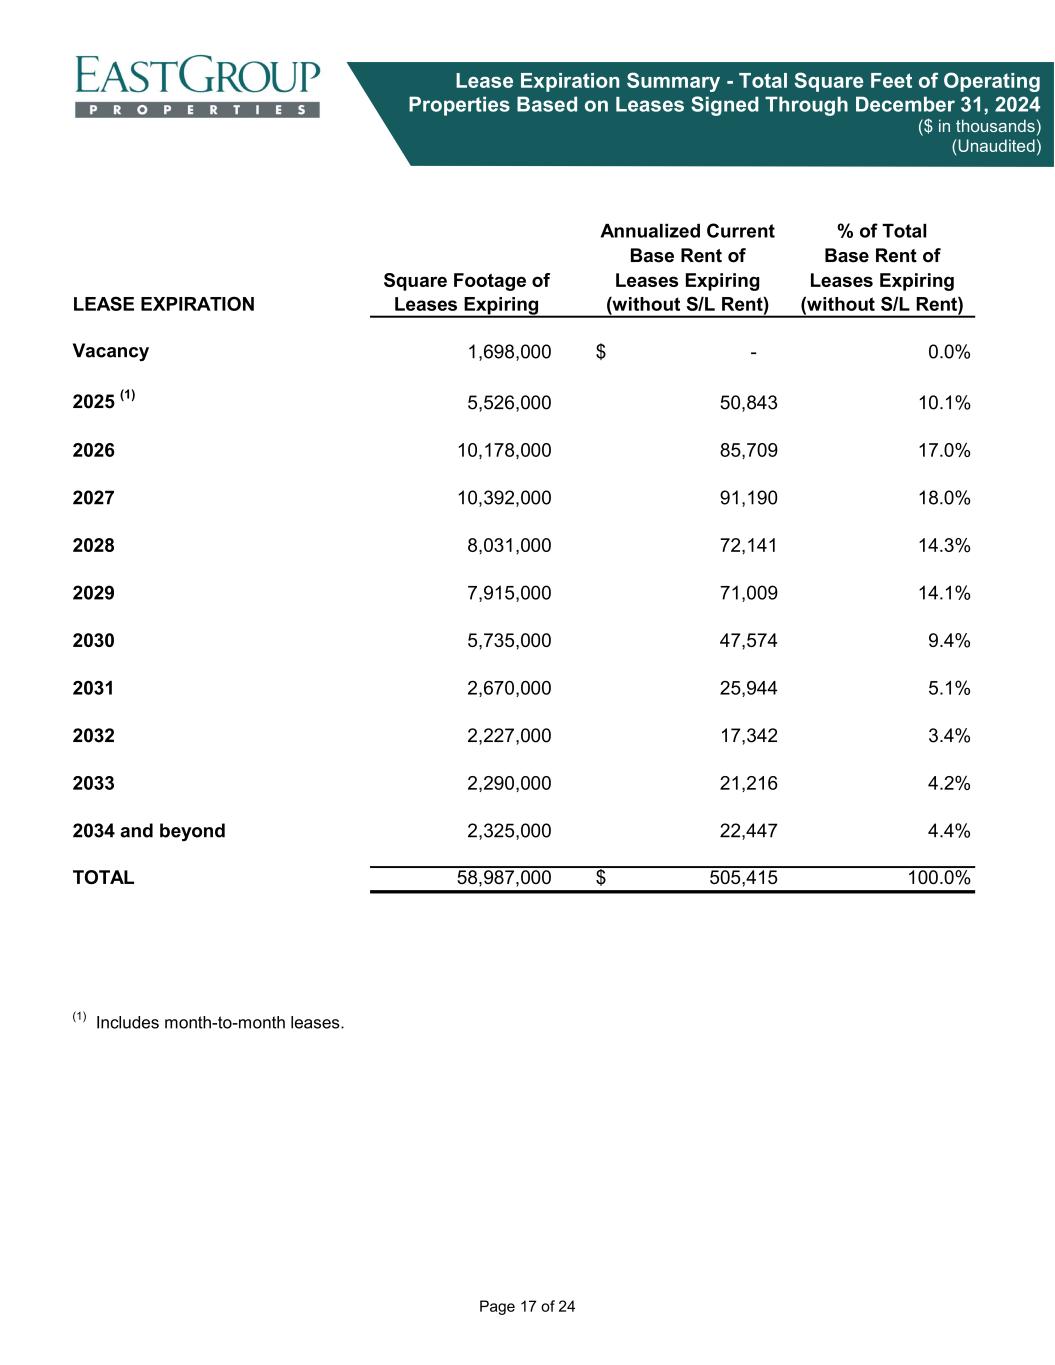
In terms of rent changes for the year, I'll let Marshall share his thoughts, but I want to highlight that we've reduced our exploration schedule since we put the supplemental together. We're down to just 8% remaining for the year of 2025 expirations. We report rent changes as we sign leases, so much of the activity for the '25 expirations and renewing those tenants took place in '24. Once we finalize those leases, we report the results. I’d say we’ve been quite steady in this area. It's stable and remains at a healthy level. Our rental rates continue to show strength, maintaining about a 50% increase, which has been consistent since the beginning of the year. We're not experiencing significant challenges; it's more about attracting clients needing space and increasing foot traffic rather than hitting the rates we need, which hasn't been a problem due to tight supply and positive signs of more traction. Looking ahead, I'd expect that by the end of the year, our average rent change might be slightly below what we've experienced in the past few years, but it still feels robust.
Operator
Our next question comes from Rich Anderson from Wedbush.
Speaker 8
Okay. Just a five-part question here, just kidding. I'll hand over the line. Marshall, I want to ensure I grasp the rhythm of your developments and the $300 million in starts. In the past, one development has informed the next based on on-the-ground activity, giving you confidence to proceed. Is that not quite happening yet, but you notice significantly less supply, so you wish to prepare for that? Perhaps things will start to come together later this year. Is it somewhat abstract right now regarding how you usually initiate developments, but you believe it will come eventually? You're discussing starts in the $300 million range. Am I understanding that correctly? Maybe you can provide some additional details.
Good morning, Rich. I'll provide a detailed response. You're correct that it's mostly the former situation. One of the advantages of EastGroup is its straightforward model, allowing people like Brent and me to manage effectively. Once a building nears completion, we move on to the next project. This approach has served us well in favorable conditions and even during last year's slower market, where we began several buildings in the fourth quarter. Specifically, one of those was a second building in Tampa, as the first one achieved full occupancy. The others were in markets like Greenville and Spartanburg, where we didn't have ongoing development and want to maintain our presence. We did lose one of our top ten spaces because the tenant outgrew us, and we weren't ready with new development to cater to their needs. Thus, we're primarily focused on initiating new projects as inventory decreases in those submarkets. Additionally, as we approach the end of the year, we believe we'll see a slight uptick in development starts. Many private developers have been sidelined, and obtaining zoning and permits for industrial projects has become increasingly challenging, resulting in delays for them. We expect a period, especially initially in the Shallow Bay sector, with reduced private competition, enabling us to meet the growth demands of our tenants and those nearby. Our team is optimistic about completing Phase II and progressing into Phase III. The $300 million figure is mainly back-end weighted, and we clearly recognize the tasks ahead based on our construction schedule. There’s a substantial amount of space that presents an opportunity, and if we can secure leases earlier, we will take action. We're committed to monitoring market signals and responding when there's demand for more supply. I sense there is a squeeze coming, and although I've predicted it too early in the past, I believe it may finally materialize toward the end of this year.
Operator
Our next question comes from the line of Nick Thillman from Baird.
Speaker 9
Maybe I just wanted to touch a little bit on the pickup in leasing costs in the quarter. Obviously, some of it could be related to just mix with the more new leasing. Wanted to get a little bit more color on that? Was there any individual leases that were pulling that number up? And then also, Brent, maybe just any comments you have on expectations for retention in 2025?
Yes. I'll jump in, Nick. Over the past couple of years, we've maintained a consistent cost per lease per year, which was just under a dollar, around $0.90 for 2022 and 2023. This year, it rose to $1.80, evenly split between tenant improvement and leasing components. It's not due to specific leases but rather a combination of inflationary pressures on tenant improvements, which have made construction costs higher per square foot, along with the office component, and repainting. We appreciate the 50% increase in rents, which correlates with the rise in leasing commissions as well. This trend appears operational rather than specific. If inflation stabilizes and leasing commissions keep rising, it would suggest we’re pushing rents higher, which would affect our rates. We had a productive year, achieving a 78% retention rate for the last couple of years, with an average close to two-thirds. Currently, we don't foresee any significant tenants we are concerned about regarding potential vacancies. There were some spaces that became vacant in the fourth quarter, as mentioned by Marshall, but I anticipate a similar pattern across the board as we have experienced over the last few years.
Operator
Our next question comes from the line of Eric Borden from BMO Capital Markets.
Speaker 10
Brent, I just wanted to go back to your comments around the bad debt guidance assumption of 30 basis points. It sounds like that is just general conservatism for the year? Or correct me if I'm wrong, is there any specific tenant that was allocated to? And then I was just curious if I get your thoughts on your current thinking for lease termination income for the year.
Sure. We received some inquiries about the absence of specific line items for term fee income and bad debt that were previously reported. We've decided to withhold some of those specific line items for now and will provide more details later this quarter. Our team, along with some peers, is continuing to work on our harmonization efforts. Going back to 2017, we synchronized our definitions and reporting practices for non-GAAP measures with some peers, and it has come to our attention recently that we are unique in that alignment. Looking ahead to 2025, we expect about 30 basis points for bad debt, which translates to roughly $2.2 million evenly spread throughout the year. This is approximately a third less than what we reported in 2024. Last year was challenging regarding uncollectible rents, with four tenants significantly contributing to the bad debt, particularly one tenant who accounted for about 30% of our total bad debt, despite having over 400 tenants in our portfolio. The top four tenants represented about 70% of our bad debt, which is unusual for us, but larger tenants had a role in this. We do not anticipate a similar situation for the upcoming year. Currently, all 17 or 18 tenants in our portfolio that occupy over 200,000 square feet are up to date with their payments. The issues causing the bad debt last year have been resolved and should not impact the current year. For the year, we're projecting about $2.2 million for bad debt and $1.1 million for term fee income, which are not specific to any tenant. When combined, this results in approximately $0.02 per share. This is another reason for withholding those line items. We are cautiously optimistic based on what we have observed so far, and given that we have addressed some issues with troubled tenants, we aim to return to a more historical run rate of around 30 basis points this year.
Operator
Our next question comes from the line of Blaine Heck from Wells Fargo.
Speaker 11
We saw some interesting and maybe counterintuitive moves in the operating portfolio lease rates in some of your markets quarter-over-quarter. So I was hoping you could comment on the decreases in Texas markets, San Antonio and Port Wharf in particular, and then increases in California where San Francisco, L.A., and San Diego saw a pretty significant positive movement, whether those are driven by specific situations or be more indicative of any trends that you're seeing in those markets?
Blaine, it's Marshall. I've organized my thoughts. In San Francisco, the team successfully filled some vacancies. Currently, when I consider California, we have noted the 260,000 square feet in Dominguez as a vacancy, along with another 68,000 square feet in North County, San Diego related to another bankruptcy. These represent our primary vacancies and are important for us this year. At present, we're mostly occupied in California, with many tenants, and we anticipate some changes throughout the year, which is encouraging. In Charlotte, the occupancy took a significant hit in the fourth quarter primarily due to the 300,000-square-foot bankruptcy. Currently, we are looking at prospects in both locations that could potentially be subdivided into two tenants in L.A. and perhaps three in Charlotte, with discussions ongoing with one tenant at each site. We aim to backfill those spaces. The situation can largely be attributed to specific market conditions, where two large tenants went bankrupt, leading to increased vacancies. In Texas, particularly in Austin, we recently completed the Stonefield project just south of the city in Hays County, which is a good location and building, close to our acquisitions from last year. We have a positive outlook on the Austin market long-term, although Hays County currently has ample supply, which increased the vacancy rate when we delivered that space. These situations exemplify the dynamic nature of tenant movements we are encountering. For example, we have some space in Fort Worth, which isn't a large part of the market there, but at our Park North project, we are making progress. However, it tends to be a few spaces here and there. The market can rebound significantly, much like it did in San Francisco, where just one or two tenant changes can notably impact our portfolio. Thanks for articulating it much more concise and for leaving it there. Thanks.
Operator
Our next question comes from the line of Steve Sakwa from Evercore.
Speaker 12
I was wondering if you could just provide a little commentary around the pricing on the acquisitions in the fourth quarter. And maybe just the capital flows that you guys are seeing. And I know acquisition cap rates can kind of be all over the board. But do you think about unlet IRRs? And where do you think unlevered IRRs are for industrial today?
The team did a great job identifying these three acquisitions, each with unique characteristics. Starting in 2023 and extending into 2024, some of the acquisitions came back to the market for a second time, which is what occurred with the Phoenix acquisition. It's a valuable site; the individual managing Arizona for us maintained contact with the seller, allowing us to secure the deal while adhering to our confidentiality agreement. Similar to our interests in Atlanta and DFW, we acquired the site near the cargo terminal, with upscale residential communities just to the north, providing flexible usage for the buildings. We've obtained over 2.5 million square feet in that area and strategically purchased buildings right across the street from four others we own, which supports tenant expansion. In terms of our effective rates, we averaged a little over a 6 yield historically, which was above market expectations. The acquisition market surprisingly tightened in the latter half of last year, with cap rates dropping below four into the fours. We were pleased with our stabilized yields, around the mid-7s for the three properties we purchased, a better position than the broader market. We had previously seen opportunities in distressed assets, but those have become scarce. When assessing returns, we consider immediate cash returns, straight line or capital returns, and mark-to-market values, striving to be prudent in our evaluations. Our capital needs are significantly less than those in sectors like office or retail, facilitating our efforts since we are not burdened with high CapEx like elevator replacements or lobby renovations. We won't focus on IRRs due to past challenges with predicting them accurately on various acquisitions but will examine early years to understand potential outcomes.
Operator
Next question comes from the line of Nikita Bely from JPMorgan.
Speaker 7
What is the rough expectation for market plan growth in your portfolio for 2025? Not the spread, but the actual growth you believe you can achieve in your properties and assets. Is it roughly flat or low single digits this year?
Yes, this is Marshall. I could divide our portfolio into two parts: east of California, which includes everything, and California itself. The LA market is still stabilizing. San Diego and San Francisco are somewhat more stable, but those are the only markets where we have seen negative absorption. Consequently, rents in those areas may still be adjusting. Overall, especially in Nevada and Arizona, I expect our rents to increase slightly above the inflation rate for the first six to eight months of the year. Depending on demand and the low supply levels we are currently experiencing, with direct vacancy around 4%, there is potential for rent increases in the second half of the year as it may take our competitors some time to mobilize and deliver new products. I anticipate growth above inflation in the first half of the year, and if demand continues at its current pace, we could see mid-single digit increases in the latter three to six months.
Speaker 7
The Southern California is probably still flat to negative for the full year, right?
Yes, I would exclude Los Angeles from this discussion. If I could separate San Diego from that, it’s somewhat different, and Orange County seems to be stronger. However, L.A. appears to be experiencing a downturn. We don't have extensive data compared to our peers in that area, but the market previously grew at an impressive pace, faster than any of our other markets. Now, it seems to be declining significantly, showing negative absorption early in the year and struggling to stabilize. I believe rents in L.A. are likely still decreasing, which is concerning given its size.
Operator
Our next question comes from the line of Michael Carroll from RBC Capital Markets.
Speaker 13
Marshall, I wanted to follow up on your comments about the increase in prospect activity. Can you provide more details on what this indicates? Are you just experiencing a rise in lower-quality prospects, or are these potential tenants further along in their decision-making process compared to before?
Michael, it's a bit of both. We've observed a notable increase in the pace of touring. Brokers are actively showing spaces, which is where it all begins. The number of tours from tenant representative brokers has been rising, and this trend continues. As for the latter part of the quarter, we've seen promising developments. We experienced a unique quarter where we signed more leasing square footage than we ever have in the company's history during the fourth quarter, which is a positive indicator. It was somewhat of a mixed bag; although it was a slower quarter for development leasing, it set a new record for portfolio leasing. It's encouraging to see the number of tours increasing in both areas. We currently have multiple letters of intent and leases under negotiation. While these negotiations can change rapidly, they are in progress, and terms are being discussed. Overall, we're optimistic about the activity we've noticed recently, which seems to be intensifying over the past 45 days. Our hope is to maintain this momentum and convert these prospects into signed leases.
Operator
Our next question comes from the line of Ronald Kamdem from Morgan Stanley.
Speaker 14
Great. Just a quick one. I want to ask about the occupancy guidance of 96. Could you discuss the progression throughout the year? Is there a seasonal dip in the first quarter, and do you expect to build from there? My second question is for an update on El Paso, Phoenix, and San Diego, which are key near-shoring and onshoring markets. What are your expectations for this year, and what insights do you have from those areas?
Yes, I'll begin and then let Marshall address those markets. Initially, we anticipate a slight dip as indicated by Marshall's comments, but we are optimistic as we move through 2025. Our leasing assumptions are based on a detailed analysis of individual spaces that help us build our model. We expect a small decline at the start of the year due to known vacancies in places like the cons and Dominic buildings, which we were aware of. We anticipate steady progress during the first half of the year, with improvements expected to start ramping up toward the end of the year. Therefore, the gains are likely to be more significant in the latter half of the year, but we are not expecting much more deterioration as we advance into the year. Instead, we see a possibility to maintain those levels and gradually improve. Now, I'll turn it over to Marshall to discuss the markets you inquired about, Ronald.
Yes, I believe that onshoring and near-shoring will maintain their long-term trend, particularly with the ongoing tariff negotiations with China. Recently, there was a 25% tariff on Mexico that has been placed on hold, making it challenging for manufacturers to plan their operations in Juarez and Tijuana. While Phoenix has a significant supply, our product type and team have effectively ensured we remain well-stocked throughout Arizona, not just in Phoenix. Interestingly, Phoenix stands out as one of our stronger markets, along with Houston, which might surprise some. The market dynamics in Phoenix are favorable. We anticipate development in Nogales, which should benefit both Tucson and Phoenix. El Paso is performing well, though not as robustly as Dallas or Houston, but we are experiencing good leasing activity. Rent levels in El Paso have stabilized after a period of rapid increases over the last year and a half. San Diego, meanwhile, has faced challenges with about ten consecutive quarters of negative absorption, but it appears the market may be improving. Currently, we have one vacancy there, and another tenant may vacate around the first quarter, which we plan to fill. Among these markets, we are most optimistic about Phoenix, followed by El Paso, which is solid but not exceptional, and then San Diego, where we hope to see a shift to net absorption, a notable trend in our other markets like Dallas and Atlanta, which have seen several quarters of positive absorption.
Operator
Our next question comes from the line of Omotayo Okusanya from Deutsche Bank.
Speaker 15
Can you hear me? So I just wanted to kind of go back to guidance for a quick minute. Some of your comments around just to get rating high-end fourth quarter and some tightness in the acquisitions market. I guess that helps to understand acquisition guidance a little bit better versus how much you did in '24. But I guess from the occupancy perspective, again, you're not really calling for any increase in occupying in '25 versus '24. But there's been a lot of commentary on the call just around green shoots and improve tours and things like that. So I'm just curious why not a better occupancy guidance; maybe there's some offsets toward some of the green shoots in demand that you've been talking about.
Thank you, Tayo. I think it's a bit of both. Acquisitions are among the most challenging line items for us. We want to pursue acquisitions that are sensible, provided the capital markets or debt equity allow for it. As Brent noted, we do have the debt capacity available on our balance sheet. I will take responsibility for last year when we forecasted 138 acquisitions, but we ended up completing just around 3.90. I hope I’m off by that much again this year. We can certainly aim for the goal, but we want to ensure that our investments are smart for our investors. We'll closely monitor the market. It seems like the opportunities for distressed acquisitions are nearly exhausted, but we'll seek them out if possible. Hopefully, we can adhere to our underwriting and strategy and strive to exceed the $150 million target we have in our budget. I hope we perform as well as we did last year in achieving that goal. Regarding occupancy, as I reflect on it throughout the year, there is the letter of intent, followed by lease signing, and then depending on various factors, several months of build-out until the tenant moves in. I'll let Brent provide additional insights, but typically, in the latter half of the year, our occupancy and same-store NOI build as we fill the available space. Initially, there may be some fluctuations during the first half of the year, but it tends to improve in the second half. The occupancy by the last quarter will be significantly higher than it is now, which is already quite strong at 96%, but it will continue to build from there. However, this process takes time, unlike hotel REITs, where it sometimes seems to move faster for tenant agreements, but for us, it often feels drawn out before the tenant can actually move in.
Yes. The only thing I'd add to that, Tayo, is just a reminder that the space of 300,000 feet and then the Starship space is 260,000, which is just over 1% of occupancy right there. This indicates a slight limitation on the rate at which it increases at the beginning of the year as well.
Operator
Our next question comes from the line of Vince Tibone from Green Street.
Speaker 16
Could you discuss how much incremental NOI from development projects that are currently unlet is baked into '25 guidance? I'm just trying to get a sense of how much spec leasing volumes and the timing of that? And like what's exactly kind of incorporated within guidance?
Yes, I think it's consistent. It builds during the year; the vast majority comes in the fourth quarter, probably around 40%, maybe a bit less, and about 30% in the third quarter. So in total dollars, you're looking at around $6 million in the development pipeline for the year. A little more than that is from signed leases today, while approximately 45% is from speculative leasing, which mostly falls in the latter half of the year. This also explains why our starts are higher in the second half, as those buildings have leases signed and move-ins occur, initiating the next phase of the park. So overall, it's about $6 million, with most of it in the latter half of the year.
Yes, Vince, this is Brent. Just to jump out. We've got about $15.8 million down for the year and it's roughly about half of that is already signed lease has spoken for. And again, we've got to get those tenants in and commence, but about half of that is more speculative leasing to occur. And as Marshall pointed out, that's more heavily weighted in the third and fourth quarter. And so just to put exact percentages to about 53% of that 15 points has already signed into the books and then another 47% that's in the back end of the year to be done, to be executed.
Operator
There are no questions at this time. Presenter please continue.
Thanks, everyone, for your time this morning. Thanks for your interest in EastGroup. If we didn't get to your question, Brent and I and the team are certainly available. And we hope to see you next month at the next conference. Take care.
Operator
Thank you. This concludes today's conference call. Thank you for participating. You may now disconnect.