Operator
Good morning, ladies and gentlemen, and welcome to the East Group Properties 4th Quarter 2025 Earnings Conference Call and Webcast. At this time, aligned during a listen-only mode, following the presentation, we will conduct a question-and-answer session. Should you have any questions, please press star 1 on your touchtone phone. We ask that you please limit yourself to one question. If you have additional questions, you may press star 1 again. If at any time during this call you need assistance, please press star 0 for the operator. This call is being recorded on Thursday, February 5th, 2026. I would now like to turn the conference over to Marshall Loeb, CEO. Please go ahead.
Good morning, and thanks for calling in for our fourth quarter 2025 conference call. As always, we appreciate your interest. I'm happy to say that joining me on this morning's call are Reid Dunbar, our president, Stacey Tyler, our CFO, and Brent Wood, our COO. Since we'll make forward-looking statements, we ask you to listen to the following disclaimer.
Please note that our conference call today will contain financial measures such as PNOI and FFO that are non-GAAP measures as defined in Regulation G. Please refer to our most recent financial supplement and our earnings press release, both available on the investor page of our website, into our periodic reports furnished or filed with the SEC for definitions and further information regarding our use of these non-GAAP financial measures and a reconciliation of them to our GAAP results. Please also note that some statements during this call are forward-looking statements as defined in and within the safe harbors under the Securities Act of 1933, the Securities Exchange Act of 1934, and the Private Securities Litigation Reform Act of 1995. Forward-looking statements in the earnings press release, along with our remarks, are made as of today and reflect our current views of the company's plans, intentions, expectations, strategies, and prospects based on the information currently available to the company and on assumptions it has made. We undertake no duty to update such statements or remarks, whether as a result of new information, future or actual events, or otherwise. Such statements involve known and unknown risks, uncertainties, and other factors that may cause actual results to differ materially. Please see our SEC filings, including our most recent annual report on Form 10-K, for more detail about these risks.
Good morning. I'll start by thanking our team.
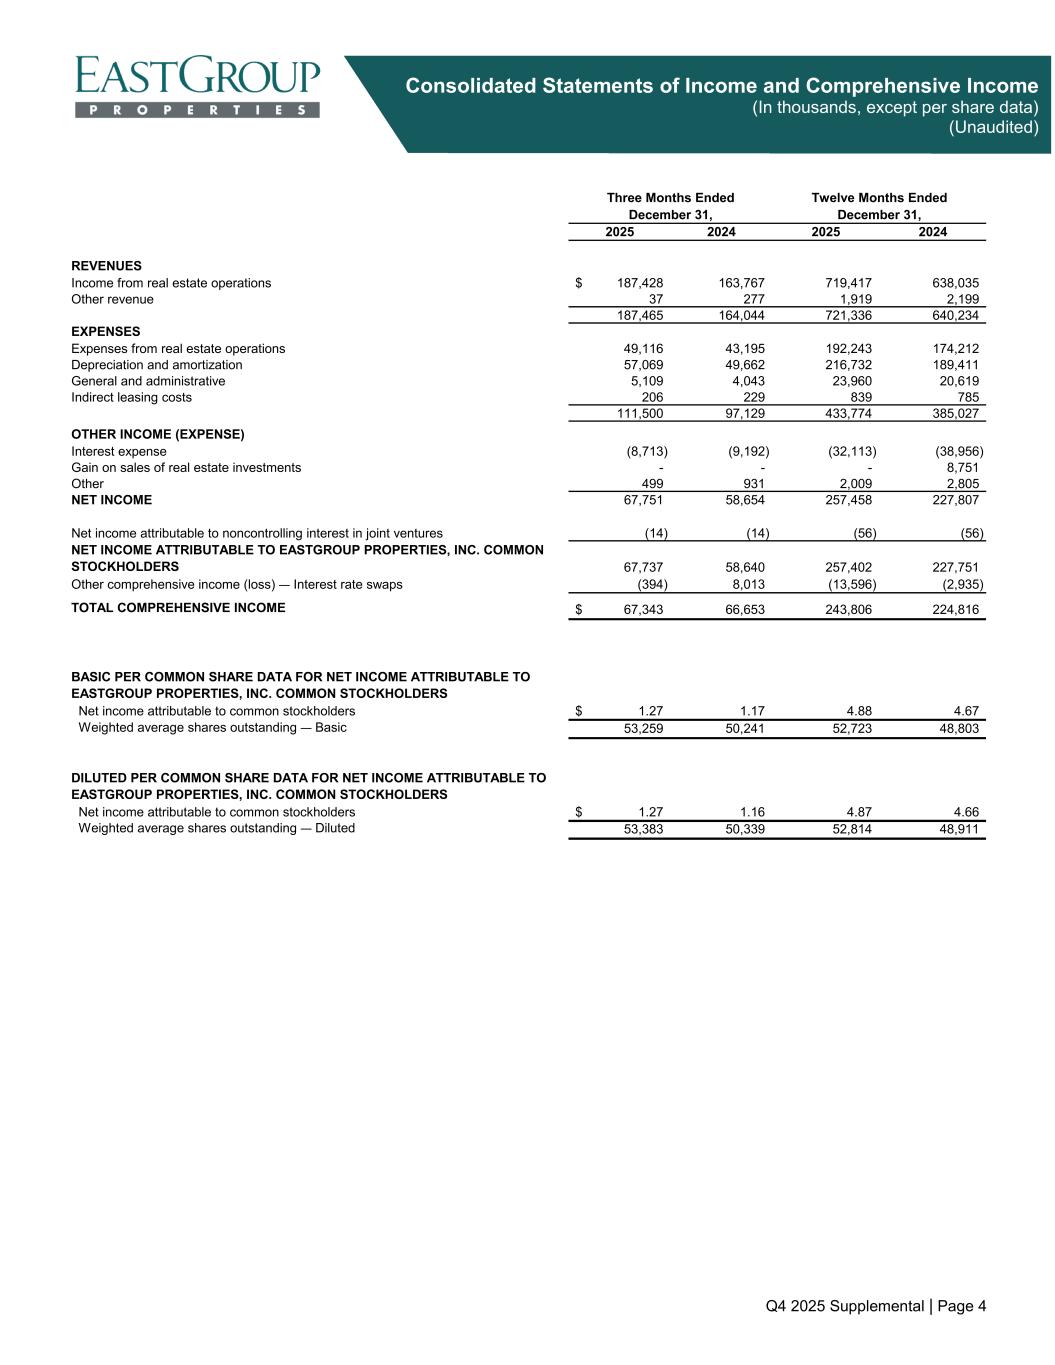
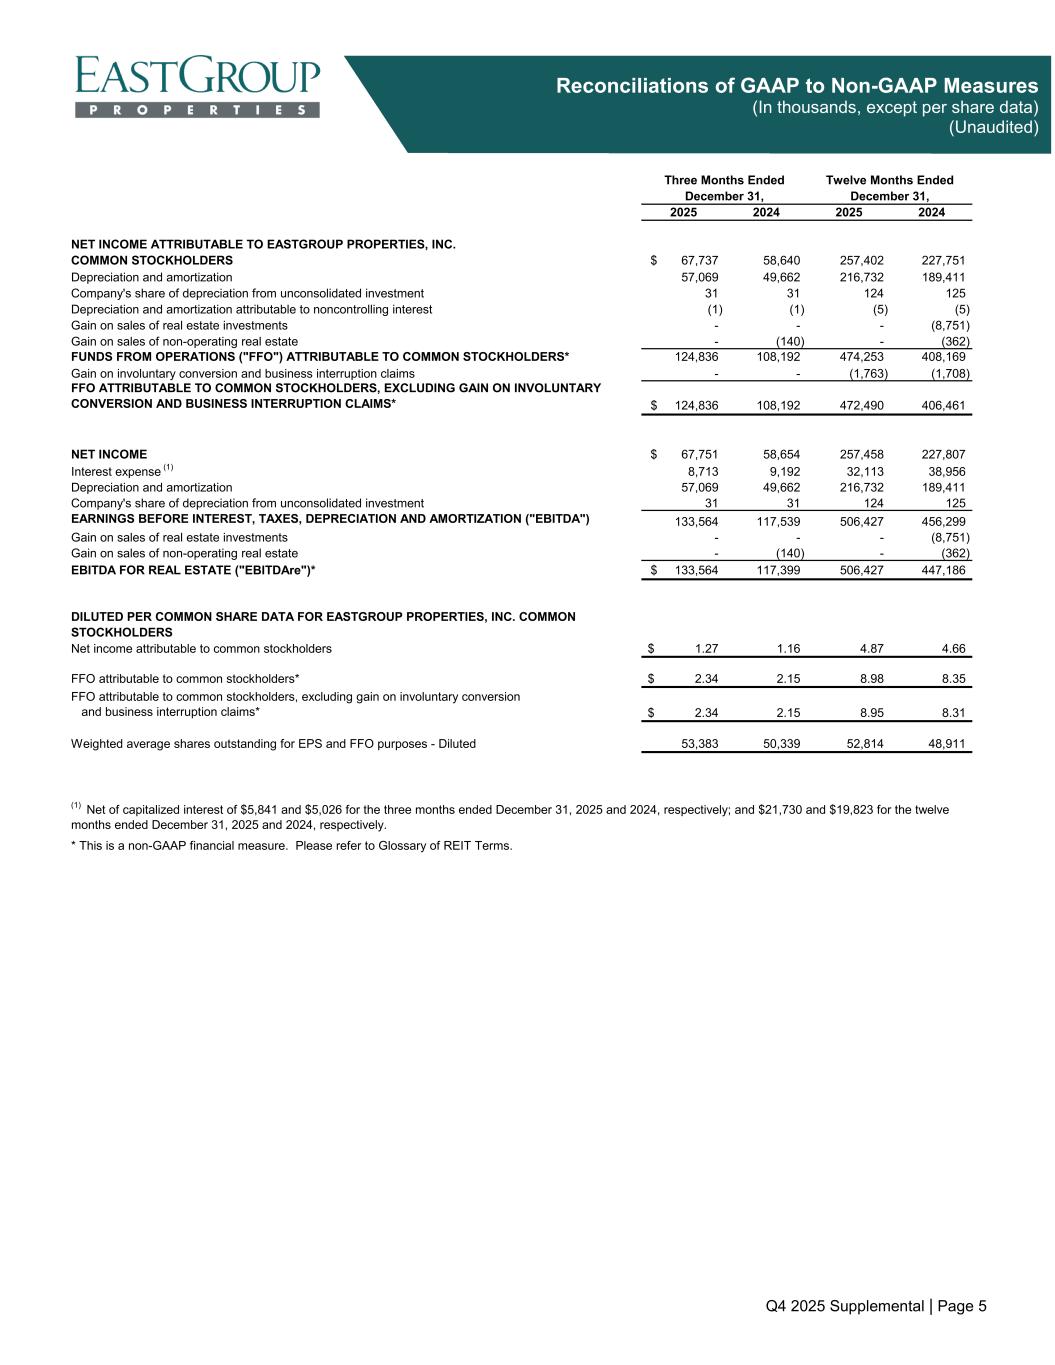
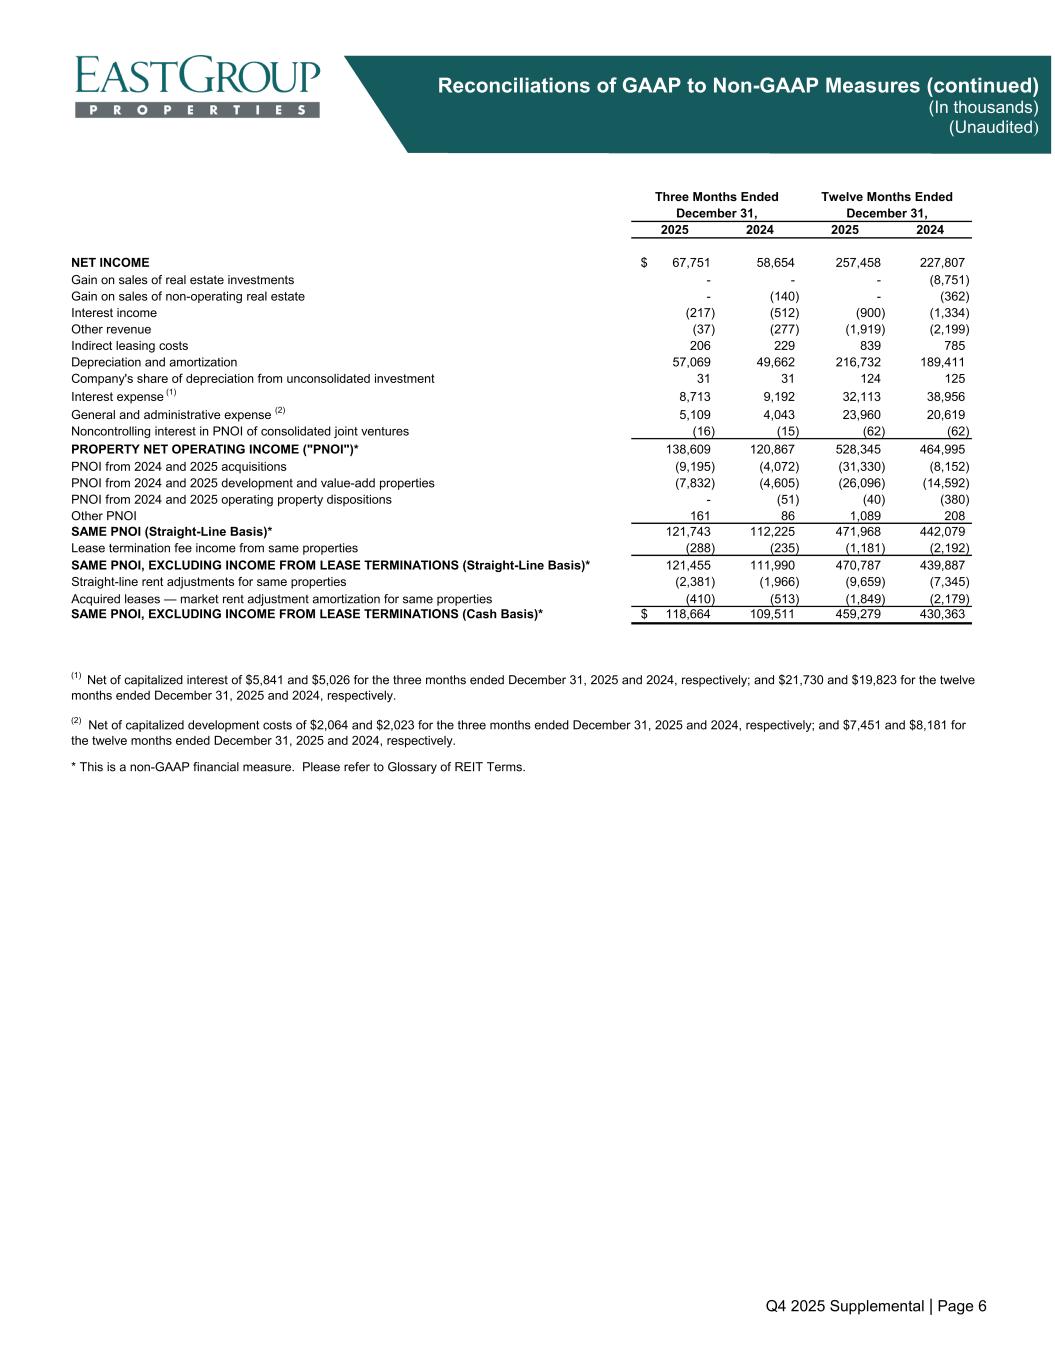
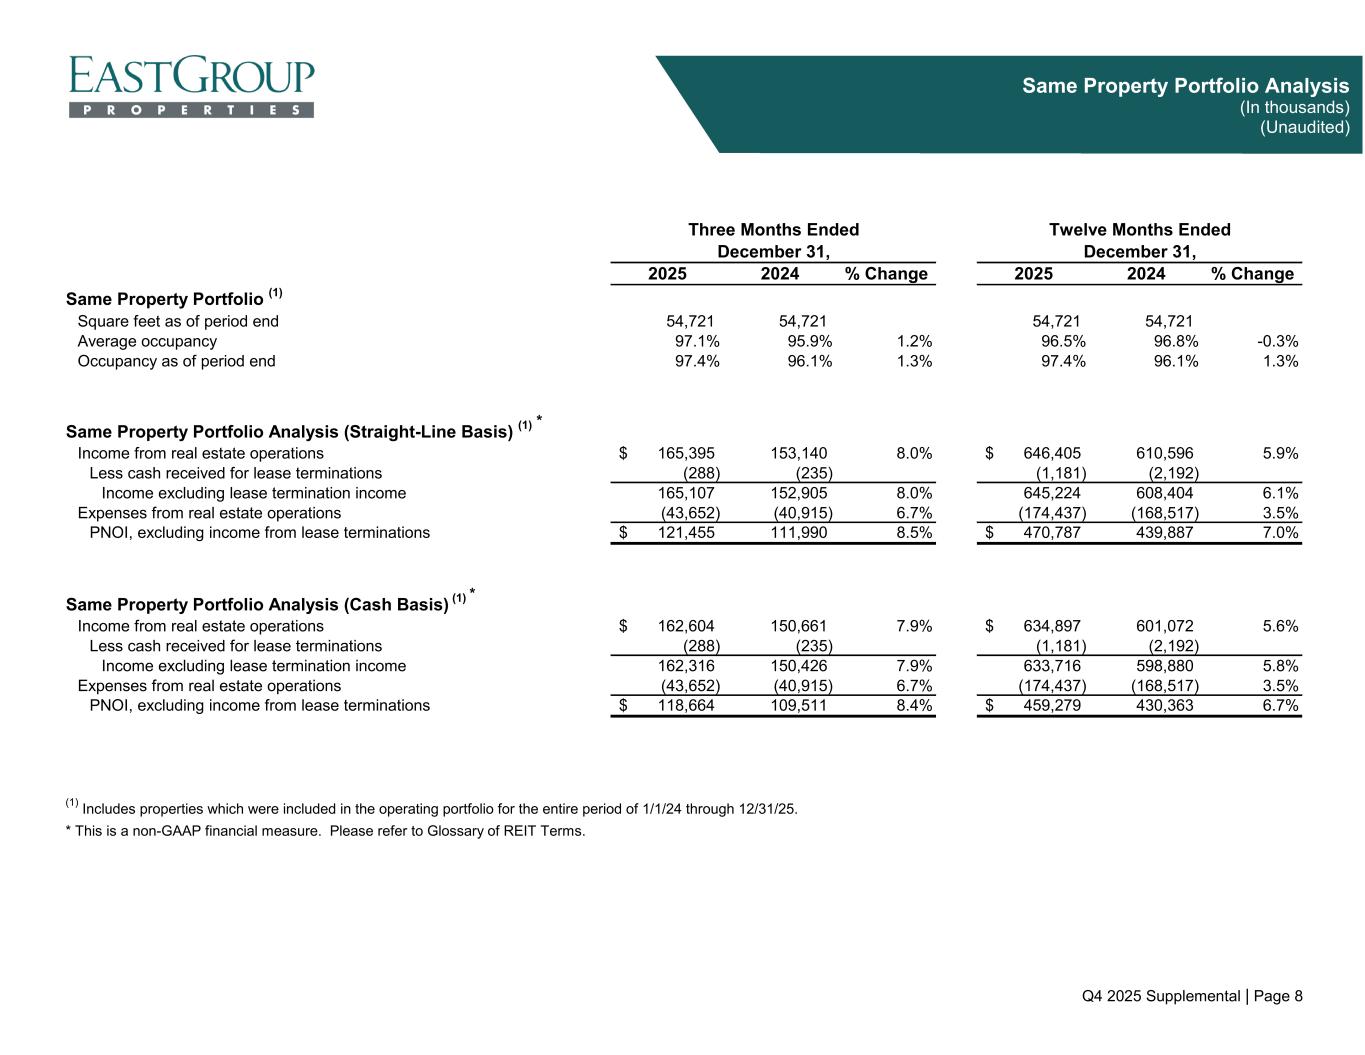
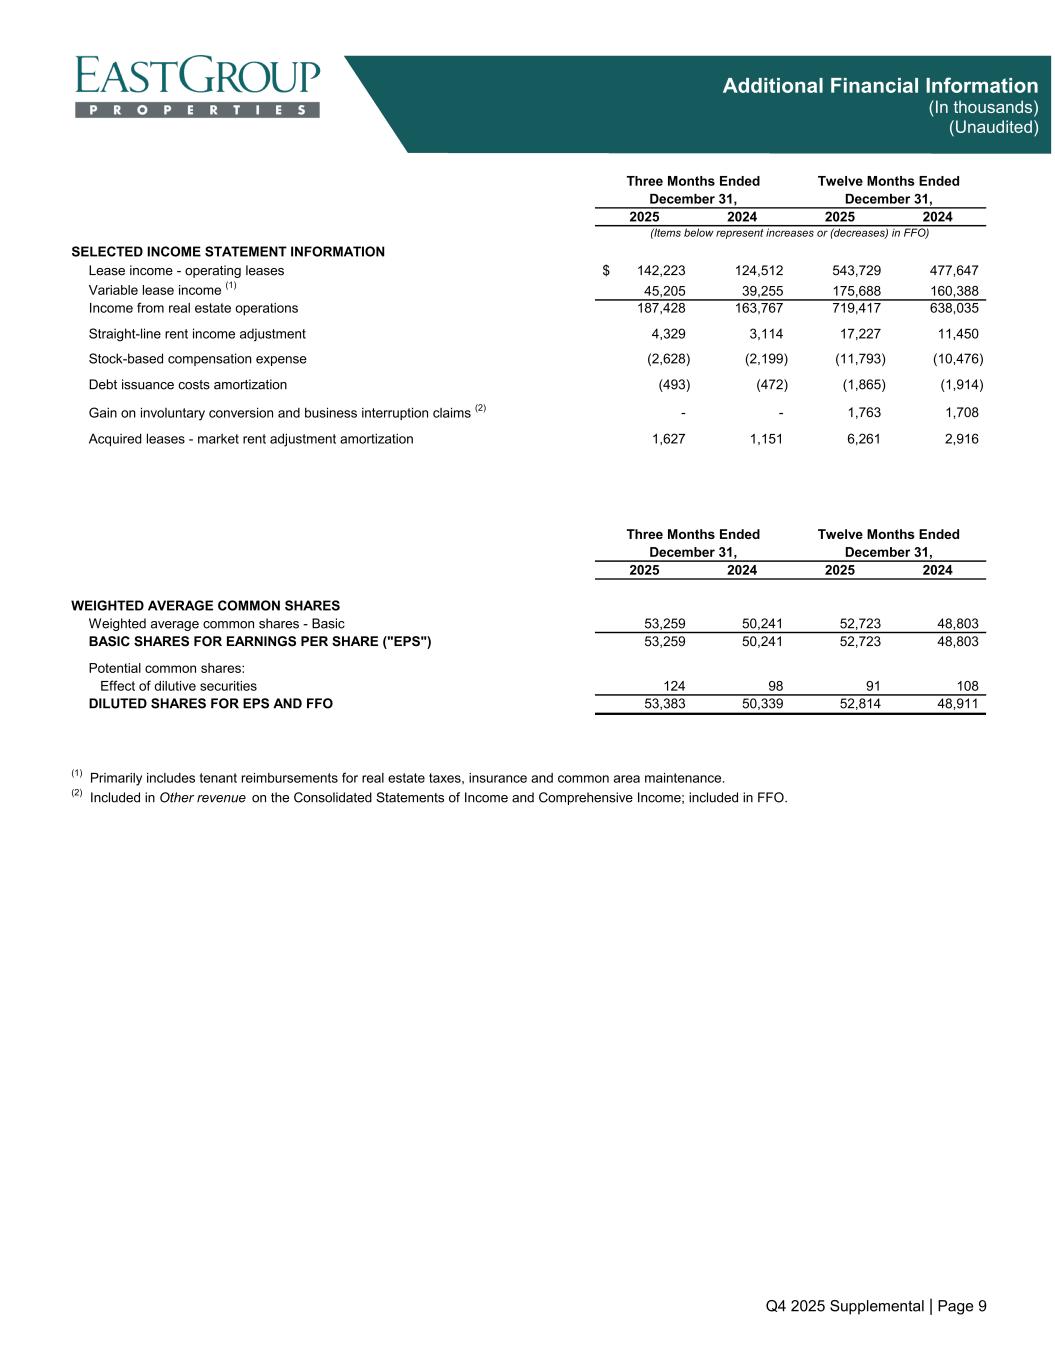
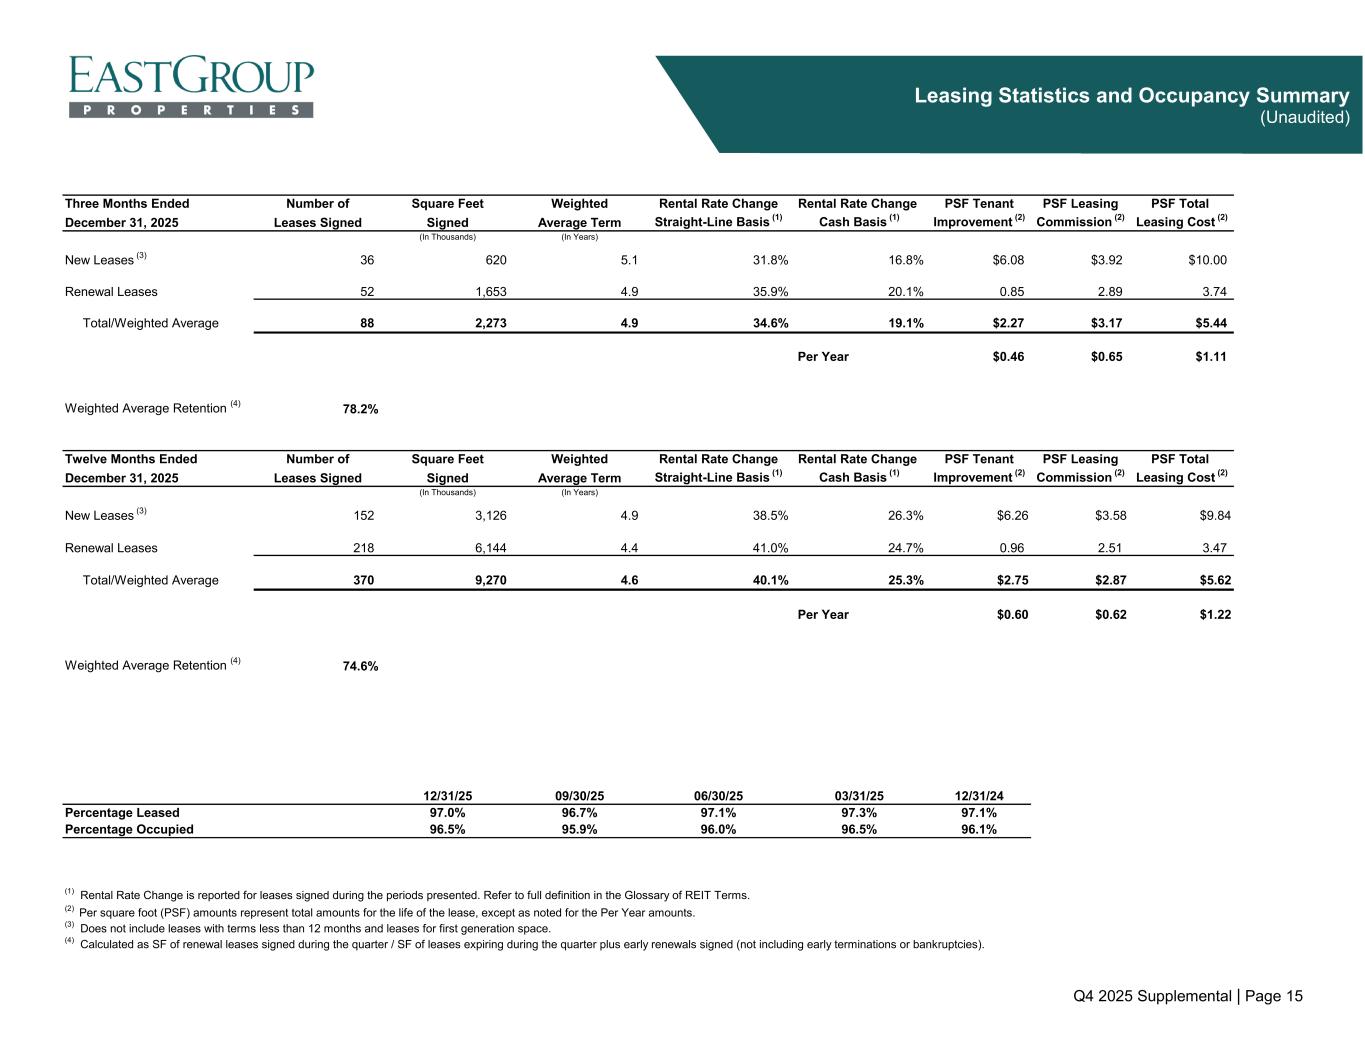
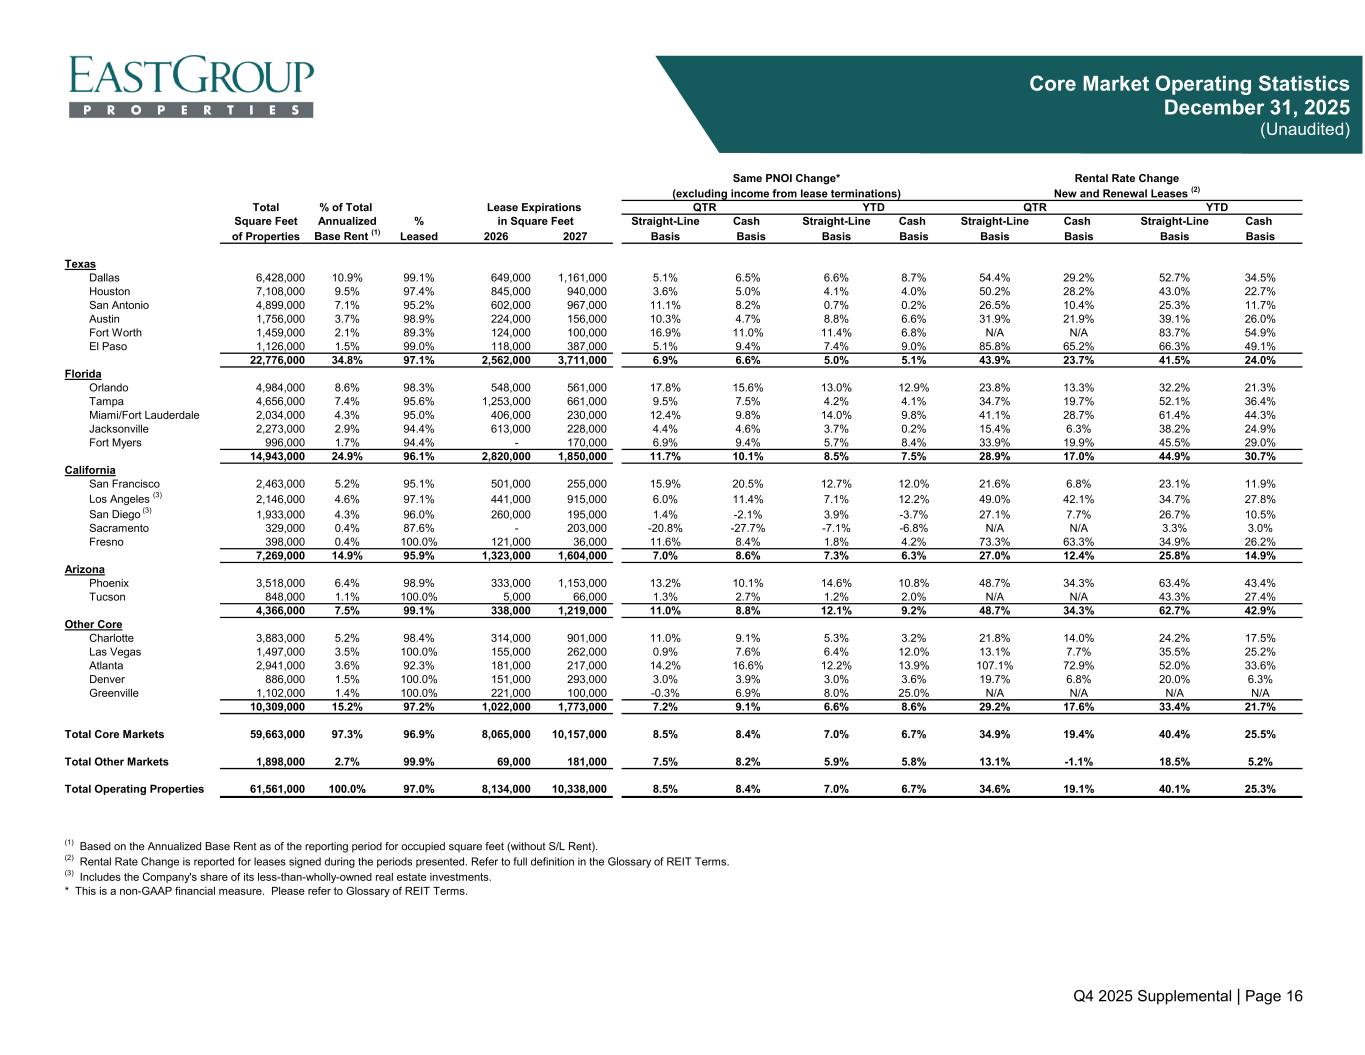
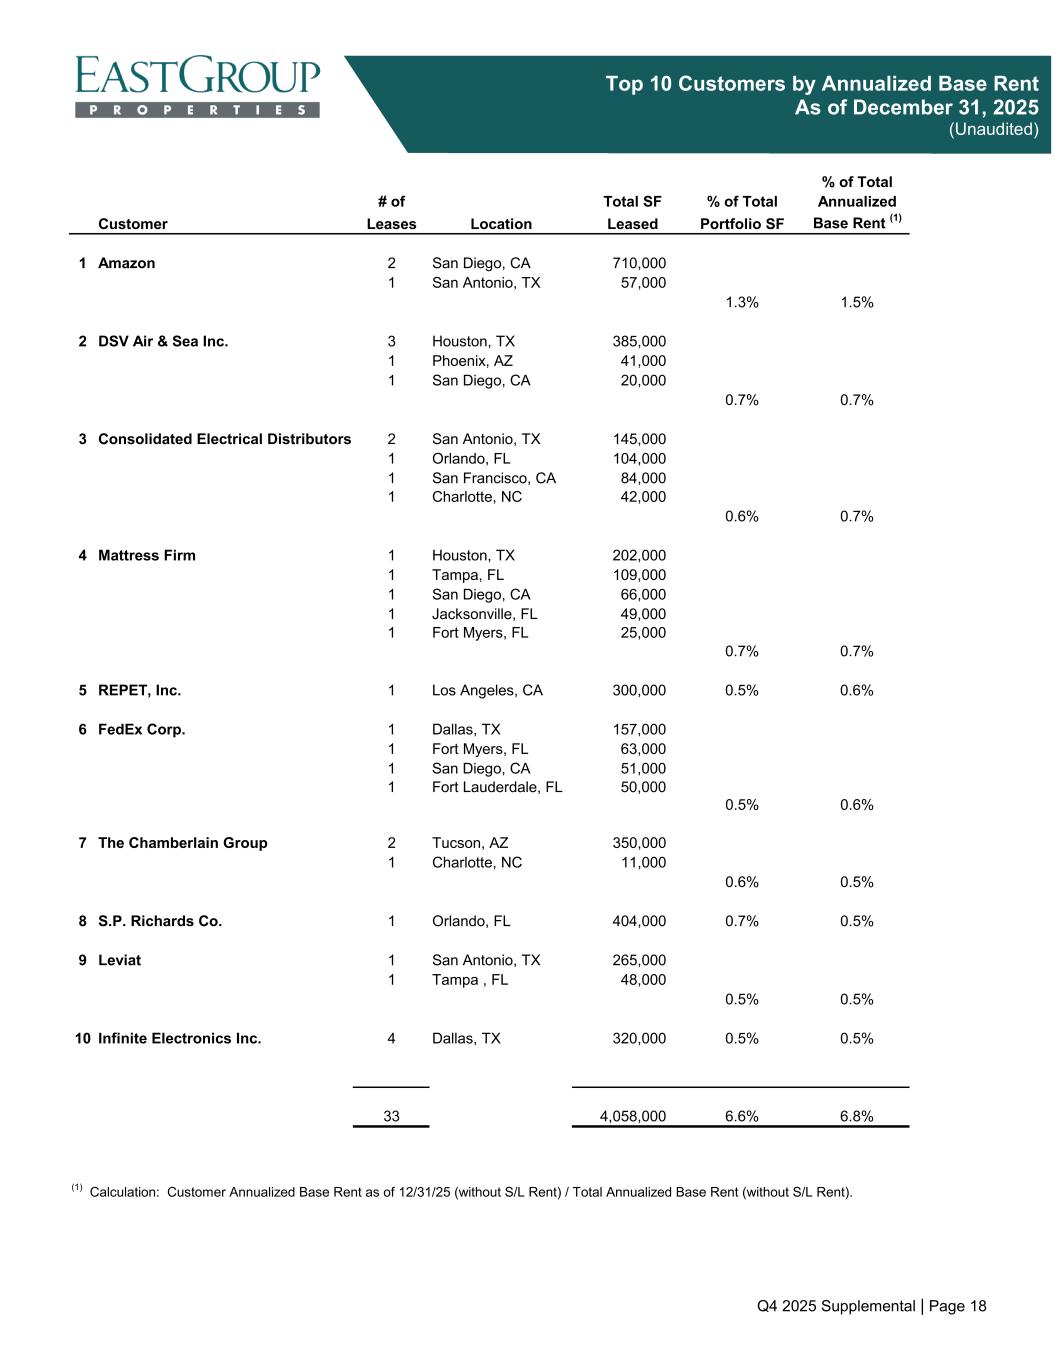
They worked hard through a volatile environment last year, and I'm proud of the results achieved. Our fourth quarter and annual results demonstrate our portfolio quality and resiliency within the industrial market. Some of the stats produced include funds from operations were $2.34 a share, up 8.8% over a quarter, and for the year, FFO per share growth was 7.7%. For over a decade now, our quarterly FFO per share has exceeded the FFO per share reported in the same quarter prior year, truly a long-term trend. Quarter-end leasing was 97% with occupancy at 96.5%. Average quarterly occupancy was 96.2%, which was up 40 basis points from fourth quarter 2024, and reverses a downward trend we've experienced the last several quarters. Also notable was same-store occupancy at 97.4%. This strength shows the trend we've discussed, where the portfolio is well-leased, while development leasing has been taking longer. Quarterly releasing spreads were 35% GAAP and 19% cash for leases signed during the quarter. Annual results were higher at 40% and 25% GAAP and cash, respectively. And cash same-store NOI rose 8.4% for the quarter and 6.7% for the year. Finally, we have the most diversified rent roll in our sector, with our top 10 tenants falling to 6.8% of rents down 40 basis points from last year. We target geographic and tenant diversity as strategic paths to stabilize earnings regardless of the economic environment. In summary, we're pleased with our results and excited about the quantity of development leasing signed during the quarter along with our current prospect activity. Reed will now walk you through more of our fourth quarter details.
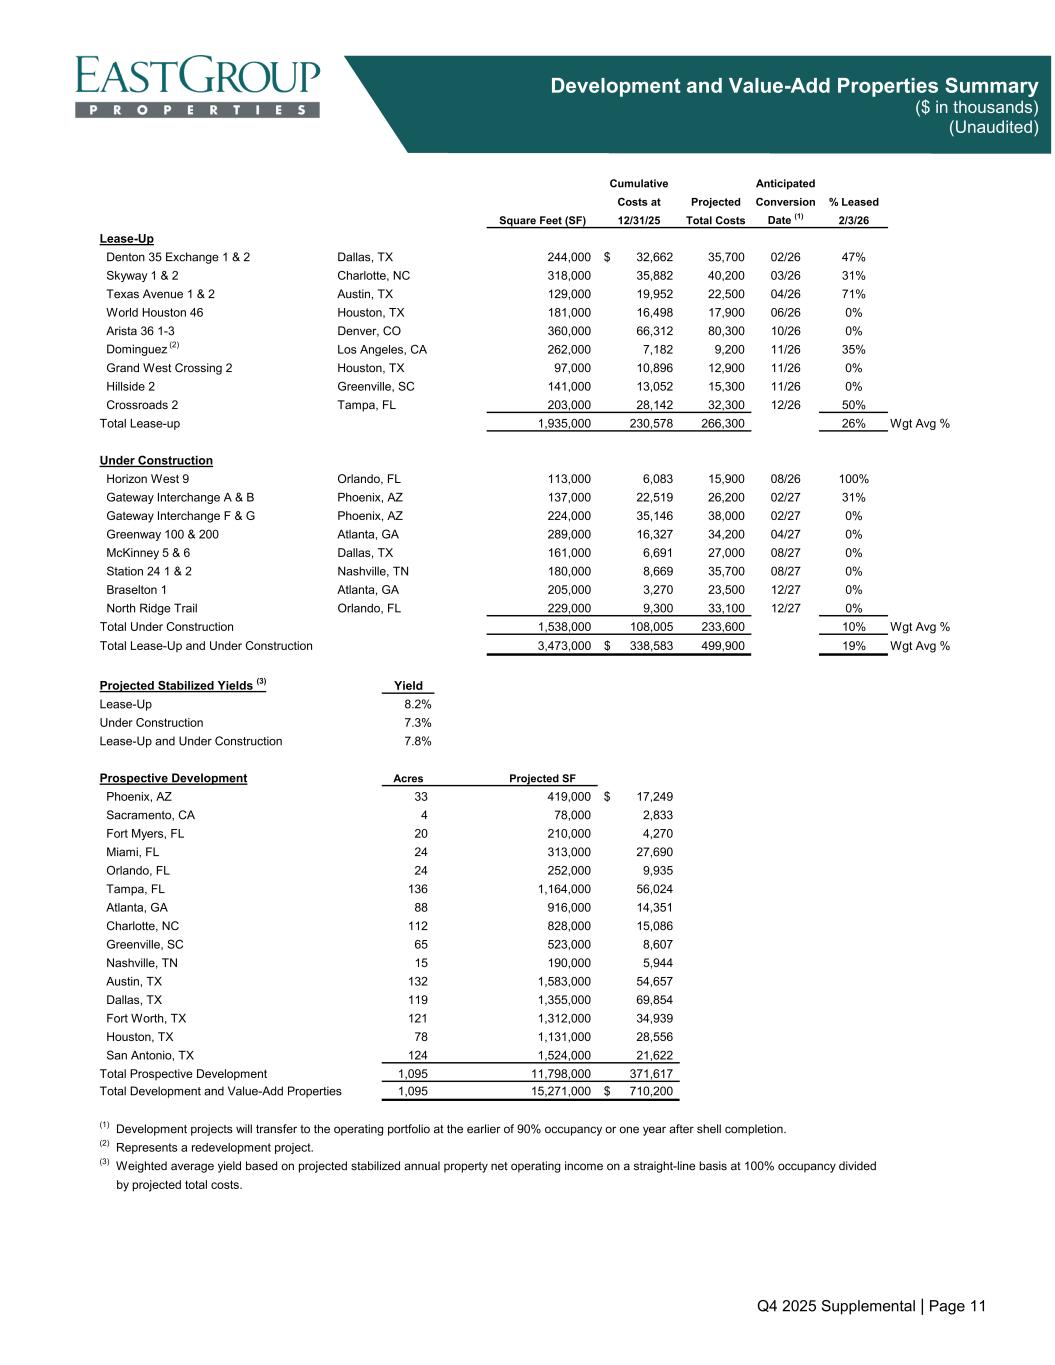
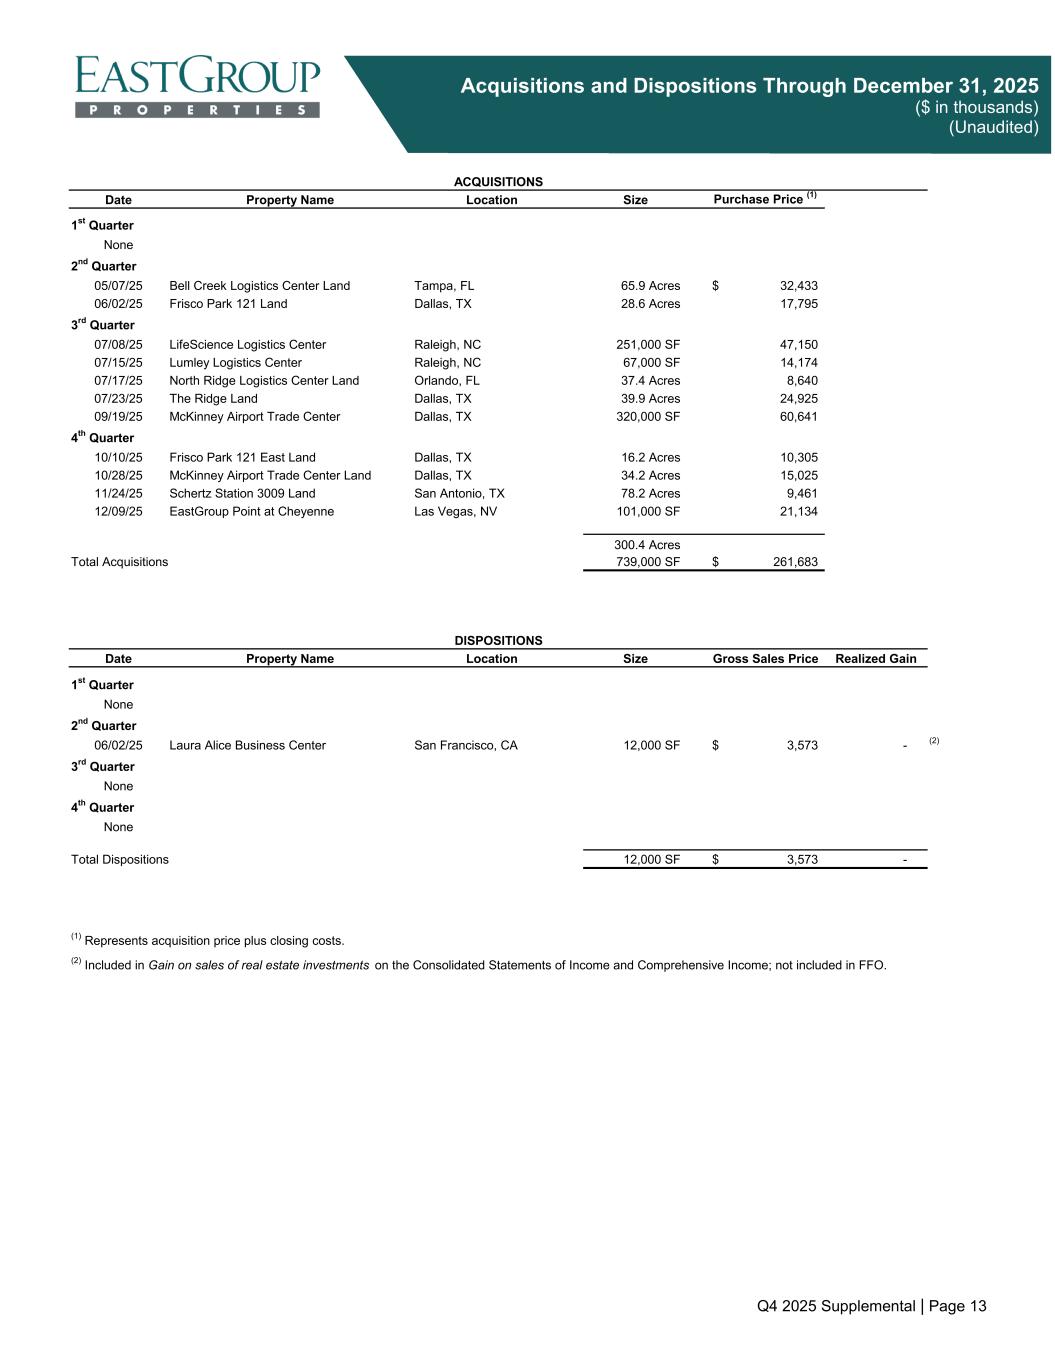
In terms of leasing, fourth quarter improved materially from slower second and third quarter results, especially in development leasing. Our fourth quarter development leasing accounted for 52% of our annual total square footage, which makes it our best quarter of overall leasing in over three years. We're excited to see this pick up in momentum, with the key being sustainability. The headline volatility impacted long-term decision-making last year. We believe businesses are more accustomed to outside noise and simply can only delay expansion decisions so long. We continue seeing a flight to quality, which has contributed to East Group's portfolio occupancy outperforming the broader markets. As Class A Shallow Bay continues to be absorbed and new supply lagging, we anticipate increased decision-making and deal velocity. On the other hand, our development pipeline is leasing and maintaining projected yields, but at a slower pace. This, in turn, lower development start projections from earlier in the year. On our development starts, as we stated before, pooled by market demand within our parks. Based on current demand levels, we are forecasting 2026 starts to 250 million. Longer term, the continued decline in the supply pipeline is promising. Starts remain historically low again this quarter. Couple this with the increasing difficulty we've been experiencing with obtaining zoning and permitting as demand increases, supply will be more challenged than historically to catch up. This limited availability in new modern facilities will place upward pressure on rents as demand stabilizes. And as demand improves, our goal is to capitalize earlier than our peers on development opportunities based on the combination of our team's experience, our balance sheet strength, existing tenant expansion needs, and the land and permits we have in hand. From an investment perspective, we're excited to continue to be growing our Las Vegas footprint. where we also added new land development sites in San Antonio and in the fast-growing, supply-constrained Northeast Dallas submarket. Finally, as an important part of our long-term strategy, we continue modernizing our portfolio with our upcoming Fresno market exit. Stacey will now speak to several topics, including our assumptions within our 2026 guidance.
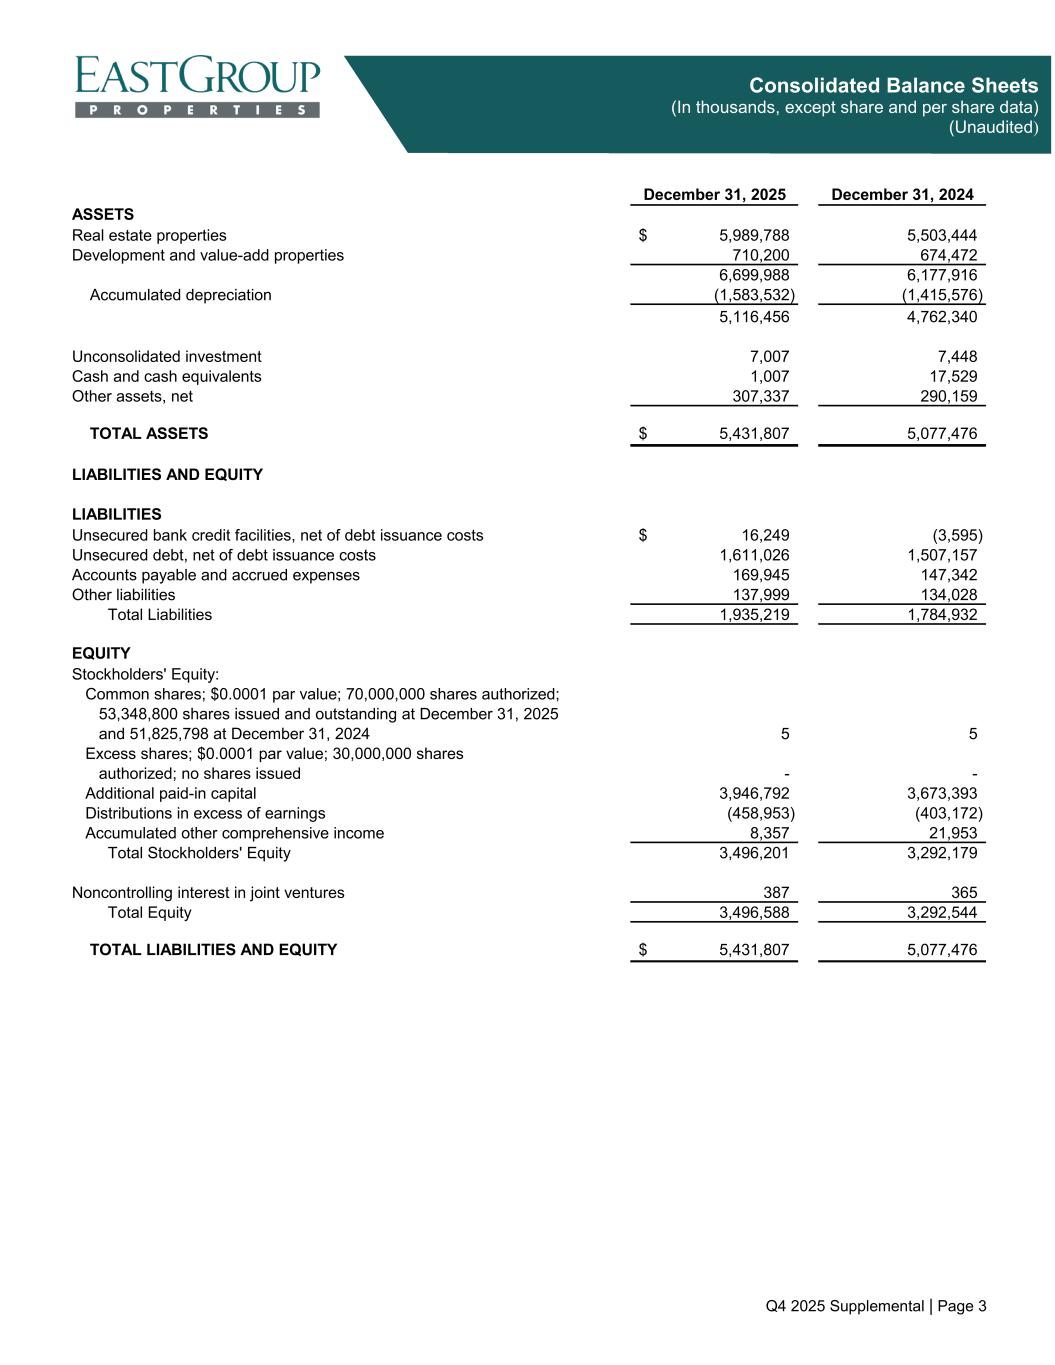
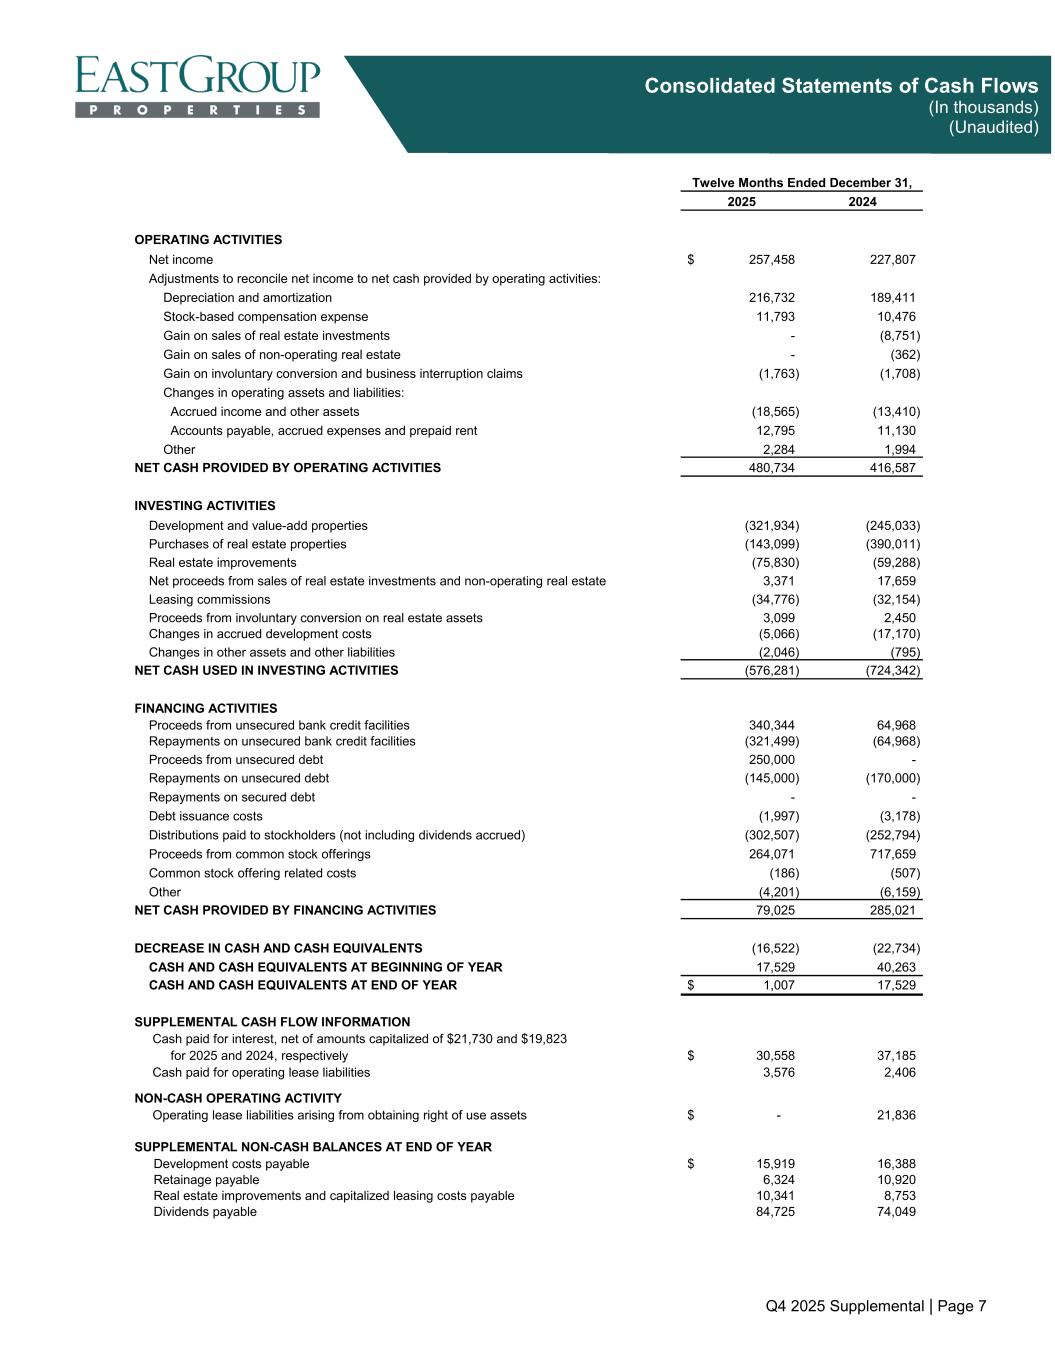
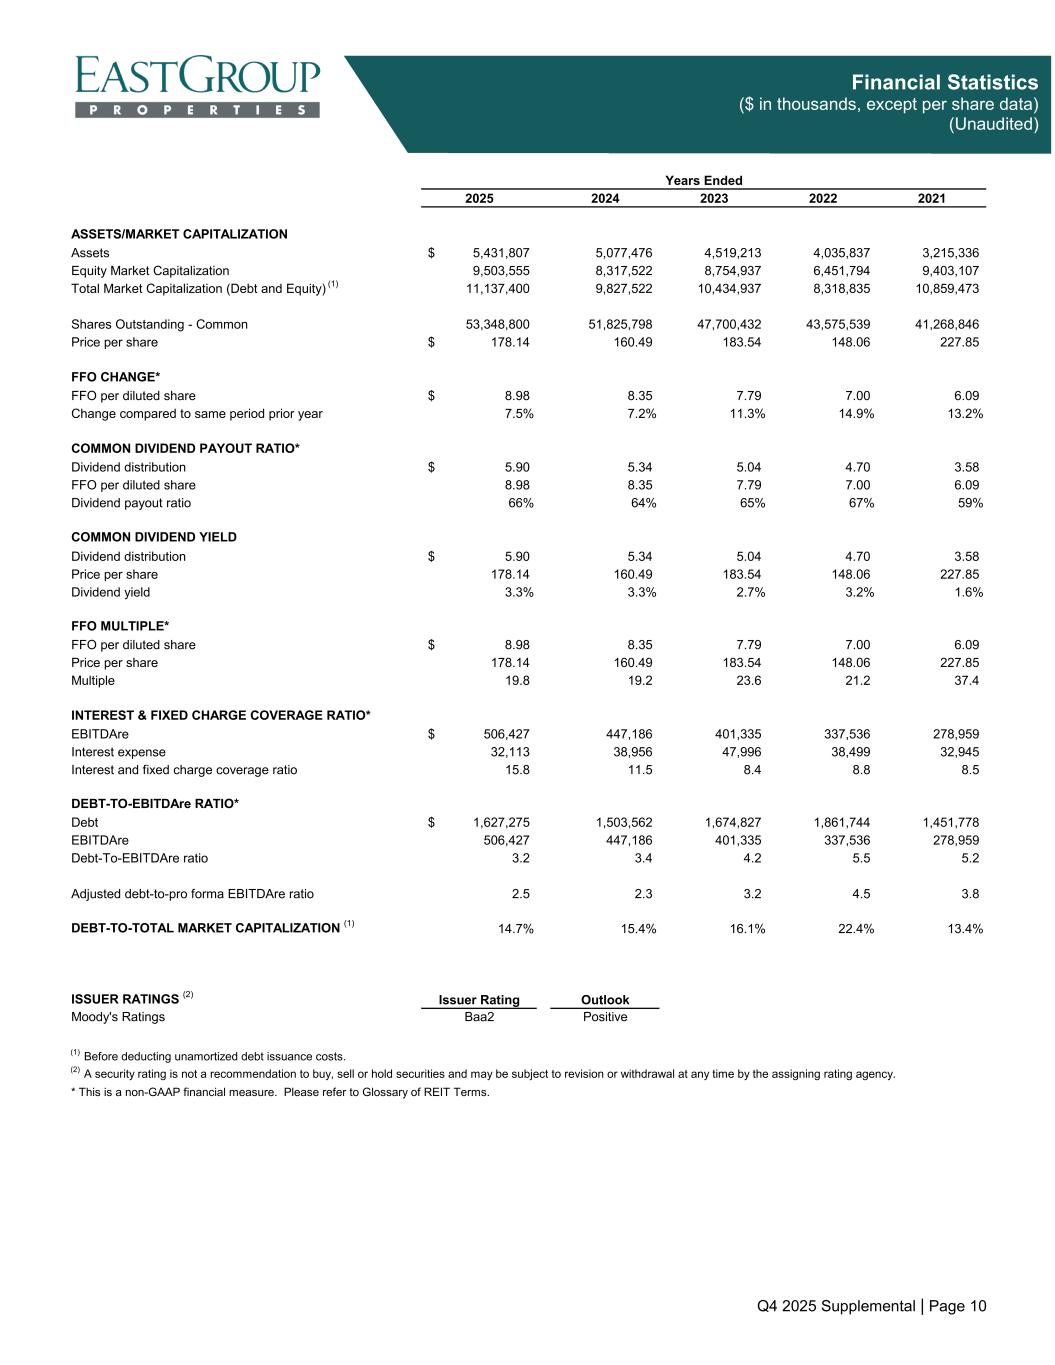
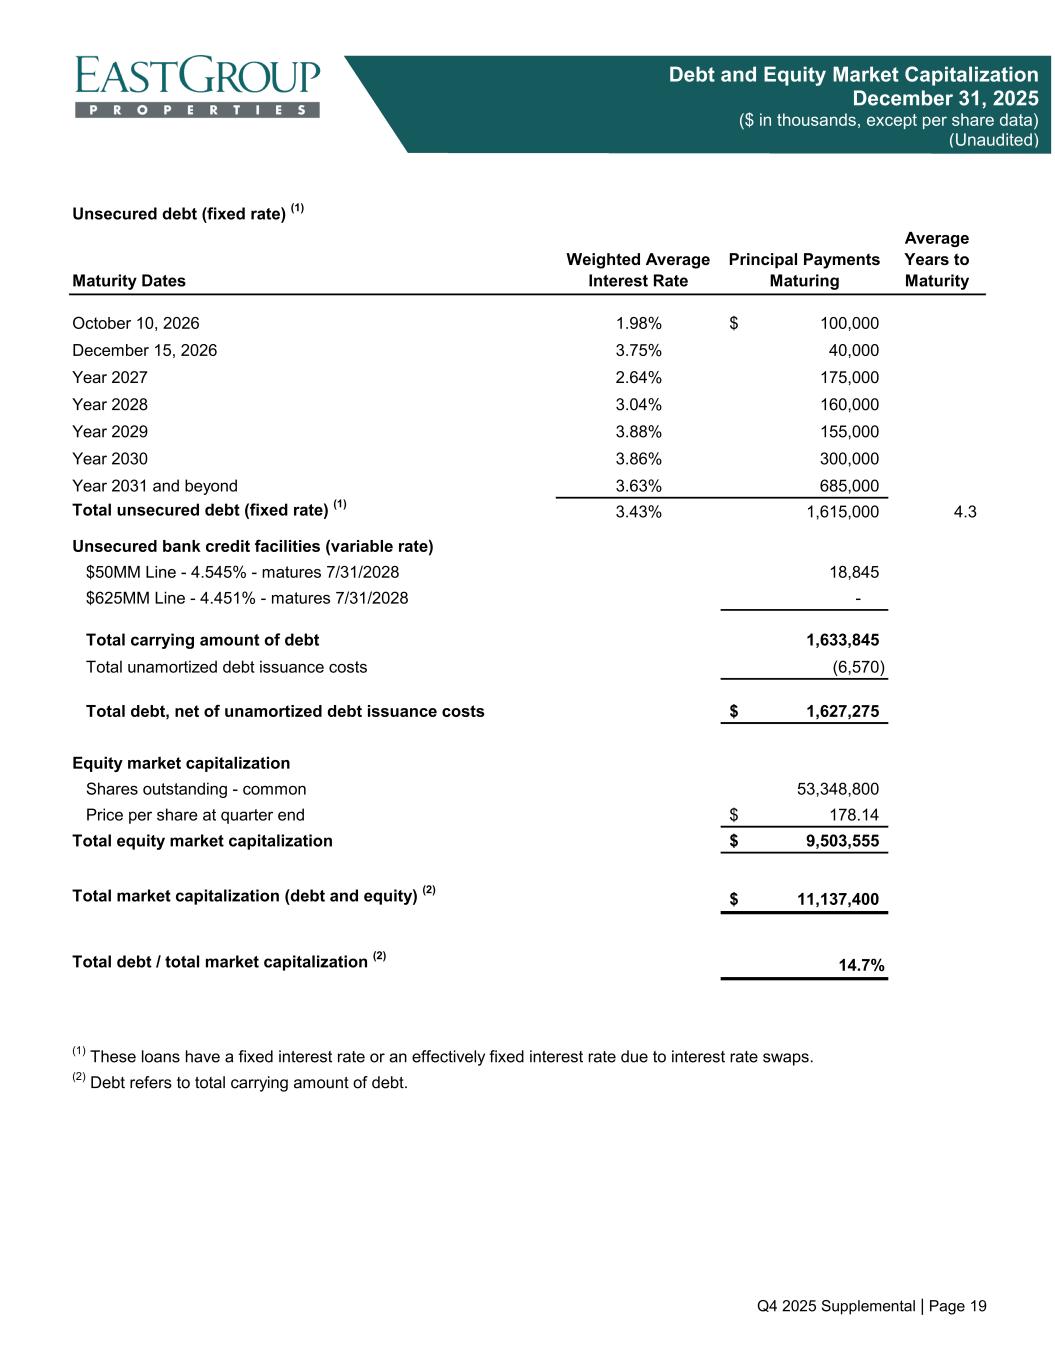
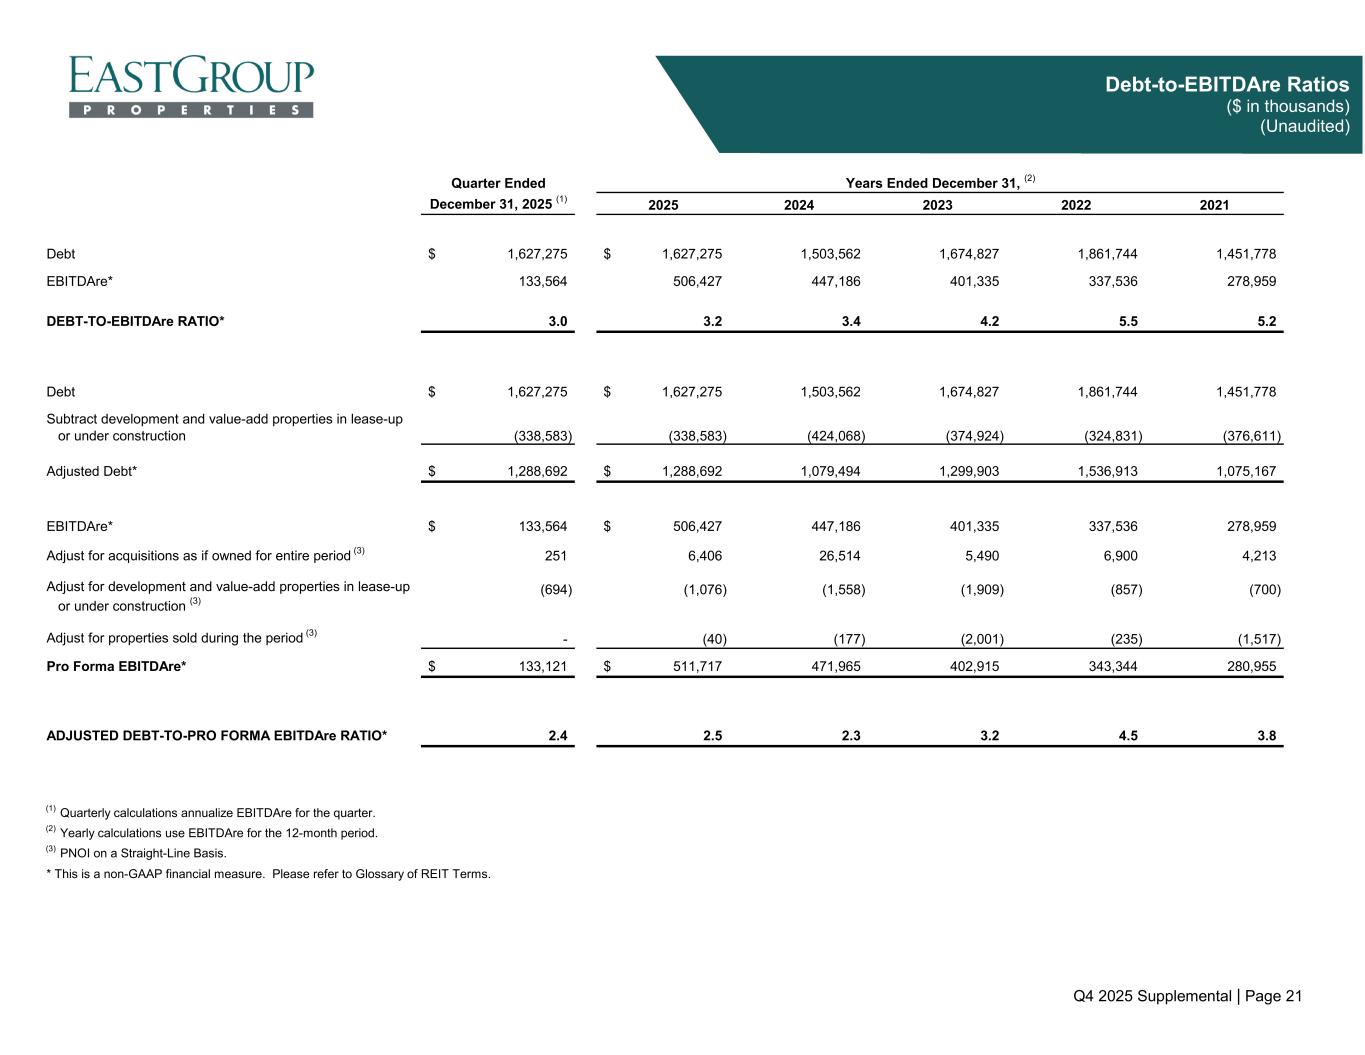
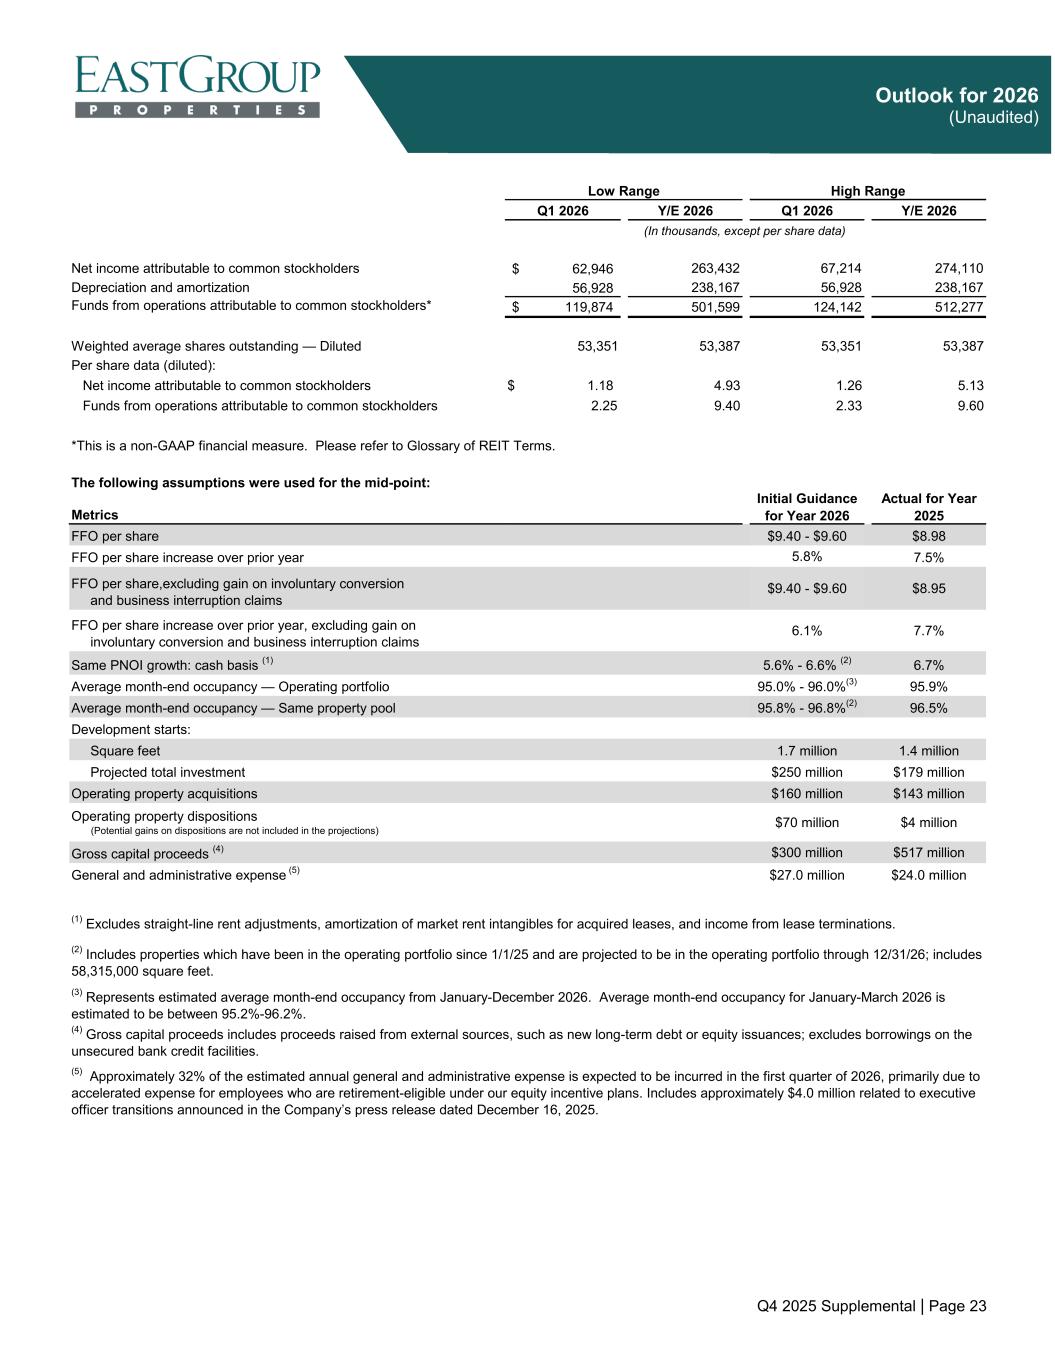
Thanks, Reid, and good morning. we are pleased to report strong results for the fourth quarter and year 2025. These results were achieved by our team through variable market conditions that improved during the last few months of the year. Our FFO results for both the quarter and year met the upper end of our guidance range at $234 per share for the fourth quarter and $898 per share for the year 2025, which represents 7.7% growth over prior year FFO per share, excluding gains on involuntary conversion. The outperformance in fourth quarter was primarily driven by property net operating income and continued strong performance by our 62 million square foot operating portfolio, which ended the year 97% leased and 96.5% occupied. We also achieved net interest expense savings that resulted from lower bank credit facility balances and a lower interest rate than originally projected on our new $250 million unsecured term loans that closed in November at 4.13%. We ended the year with $19 million drawn in our unsecured bank credit facility, leaving available capacity of over $650 million as of the end of the year. Our debt-to-total market capitalization was 14.7% at year end. Our fourth-quarter annualized debt-to-EBITDA ratio was three times, and our interest and fixed-charge coverage was over 15 times. Our strong and flexible balance sheet positions us well to pursue growth opportunities that align with our time-tested strategy. Looking forward to 2026, FFO is estimated to be in the range of 225 to 233 per share for the first quarter and 940 and 960 per share for the year. Those midpoints represent increases of 8% and 6.1% compared to the prior year periods, excluding gains on involuntary conversions. that result from insurance claims. We are projecting strong cash same property net operating income results for 2026 with a midpoint of 6.1% driven by rental rate increases on in place and budgeted leases and expected same property occupancy of 96.3%. The midpoint of our 2026 guidance assumes 250 million in new development starts and $160 million in operating property acquisitions, which includes an acquisition in Jacksonville that is currently under contract with money at risk. Our rent collections currently remain healthy and in line with historical averages, so our projections for 2026 uncollectible accounts include a typical run rate in the range of 30 to 35 basis points of revenue. Please note that projected G&A expenses for 2026 are $27 million, which includes an estimated $4 million, or $0.07 per share, in costs related to the executive team transitions that were announced in December. Also, as a reminder, approximately 32% of the annual G&A expenses are expected to be recognized in first quarter, primarily due to accelerated expense for employees who are retirement eligible under our equity incentive plan. We have $140 million in unsecured debt maturing during fourth quarter 2026. We plan to fund those debt repayments and new investments throughout the year with our bank credit facilities and new debt issuance of $300 million. While our guidance assumes debt issuance, we will remain flexible and monitor the equity market and may utilize both debt and equity as sources of capital. We're pleased with our strong performance in 2025, and as we look ahead through the year 2026, we are confident in our high-quality portfolio of well-located multi-tenant assets and in our team's ability to execute in this steadily improving environment. Now Marshall will make some final comments.
Thanks, Stacey. In closing, we're pleased with our execution for the quarter and year. Market demand is picking up momentum, and we're hopeful it's sustainable. Regardless of the environment, our goals are to drive FFO per share growth and raise portfolio quality. If we can do those, we'll continue creating NAV growth for our shareholders. Our executive team is structuring as a reflection of the growth we've achieved and even more so the opportunities we see within our markets. Stepping back from the near term, I like our positioning, as our portfolio is benefiting from several long-term positive secular trends such as population migration, near-shoring and on-shoring trends, evolving logistic chains, and historically lower shallow bay market vacancies. We also have a proven management team with a long-term public track record. Our portfolio quality in terms of buildings and markets improves each quarter. Our balance sheet is stronger than ever. And we're upgrading our diversity, both in our tenant base as well as our geography. We'll now would like to open up the call for any questions.
Operator
Thank you. Ladies and gentlemen, we will now begin the question and answer session. Should you have a question, please press the star followed by the one on your touchstone phone. You will hear a prompt that your hand has been raised. If you wish to decline from the polling process, please press star followed by the two. and if you are using the speakerphone, please lift the handset before pressing any keys. A reminder to please limit yourself to one question and you may re-queue with any additional questions. The first question comes from Craig Mailman at Citi. Please go ahead.
Hey, good morning, everybody, and congrats to Reed, Stacy, and Brent. I see Brent is already enjoying his promotion by not talking on the call.
Oh, Craig, give me a break.
I'm here. i wanted to uh just dive in a little bit more on the development leasing because that was a big uptick and i know marshall you had foreshadowed that um last quarter's call on the nareet just can you just walk through kind of what the uh a little bit more into what the prospect activity looks like and any trends you're pulling away from from either sectors that are are more active than others, and also just give us a little bit of a sense of, are these all organic growth to the portfolio, or are some of these existing tenants that could leave some holes in the existing portfolio as they move into new space?
It was mostly, you know, it was, I guess, interesting and a great adjective, but we had activity all during the year, and then in fourth quarter, maybe it was long enough beyond tariff day that people started finally making a decision and getting development leases signed. There weren't expansion. A couple were existing tenant relationships where, hey, we have you in Orlando and you need space in Tampa. And that was kind of a full building lease. The team was able to get signed there. In terms of kind of trends, what I would say is it felt like you finally break through the ice a little bit and we got more than half of our development leasing side for last year happened to be in fourth quarter. You know, the tricky part is I sure hope that's sustainable. We have good prospect activity. The other thing a little bit that helped us last quarter with such a high square footage is the, and I think it's with the construction pipeline being so low, we have probably six to eight conversations in varying stages, and they won't all happen, but where prospects could take, you know, a majority of all of a building, a couple of buildings, a pre-lease kind of build-a-suit opportunity. So that gave us a little bit of that confidence to raise development guidance this year, we think, as some of those happen. And it's a mix of expansions, you know, relocation from California is one of the prospects. It's kind of a mixed bag and simply new to the portfolio, things like that. So I'm glad that it's pretty broad-based. And when I was looking at just the markets where we could have these pre-leases, it is probably about six different states. So it's pretty spread out. It's not any one market, things like that. So I'm cautiously optimistic as we turned the page. We're really proud of the team, a good fourth quarter. We kind of finally got through and got things signed and we have good activity to date. It's just that conversion rate that will be key.
And I would add to Marshall's comments on some of the specific development leasing in the year. Our average lease size in the quarter actually jumped to a little over 60,000 square feet which was a nice uptick from previous quarters which obviously helps move the needle. And then geographically it was very dispersed. We saw great activity really from Florida all the way to California. So all of our development markets, we were fortunate to land some new deals in the quarter.
Operator
Welcome. The next question comes from Samir Kunal from Bank of America. Please go ahead.
Good morning, everybody. Marshall, I guess your comments are very encouraging to hear, especially from even listening to the last question on development leasing. I guess how is that translating into pricing or market rent growth? I guess, where do you see market rent growth going this year at the national level? And maybe talk about markets which are outperforming or even, you know, lagging at this point.
Hey, good morning, Samir. It feels like, you know, it's hard to speak for us maybe a little bit nationally. We're so focused on more of the smile states. But I would say rent growth, you know, we're pleased demand's picked up, you're right. I have not really seen that translate into rent growth just yet. I'm optimistic because construction pipeline is like a seven, eight-year low and that it's going to take a while to catch up, that there will be rent growth, but we're not seeing it just yet. We're still in all of our markets, maybe absent California, probably inflation plus a little bit. So rents have hung in there. Construction pricing has come down. So we've been able to maintain our yields a little north of seven on the developments and things like that. But, you know, look, there could be an inflection point. I keep calling for it, and eventually I'll be right on when rents pick up again because I think there's just not much supply out there. And as demand does stabilize, it won't take a lot of kind of positive and just stable demand for people to start pushing rents. But we're not, unfortunately, not seeing it quite just yet.
But, you know, at least we're trending in the right way as we ended the year.
Operator
Thank you. The next question comes from Blaine Heck from Wells Fargo.
Operator
Please go ahead.
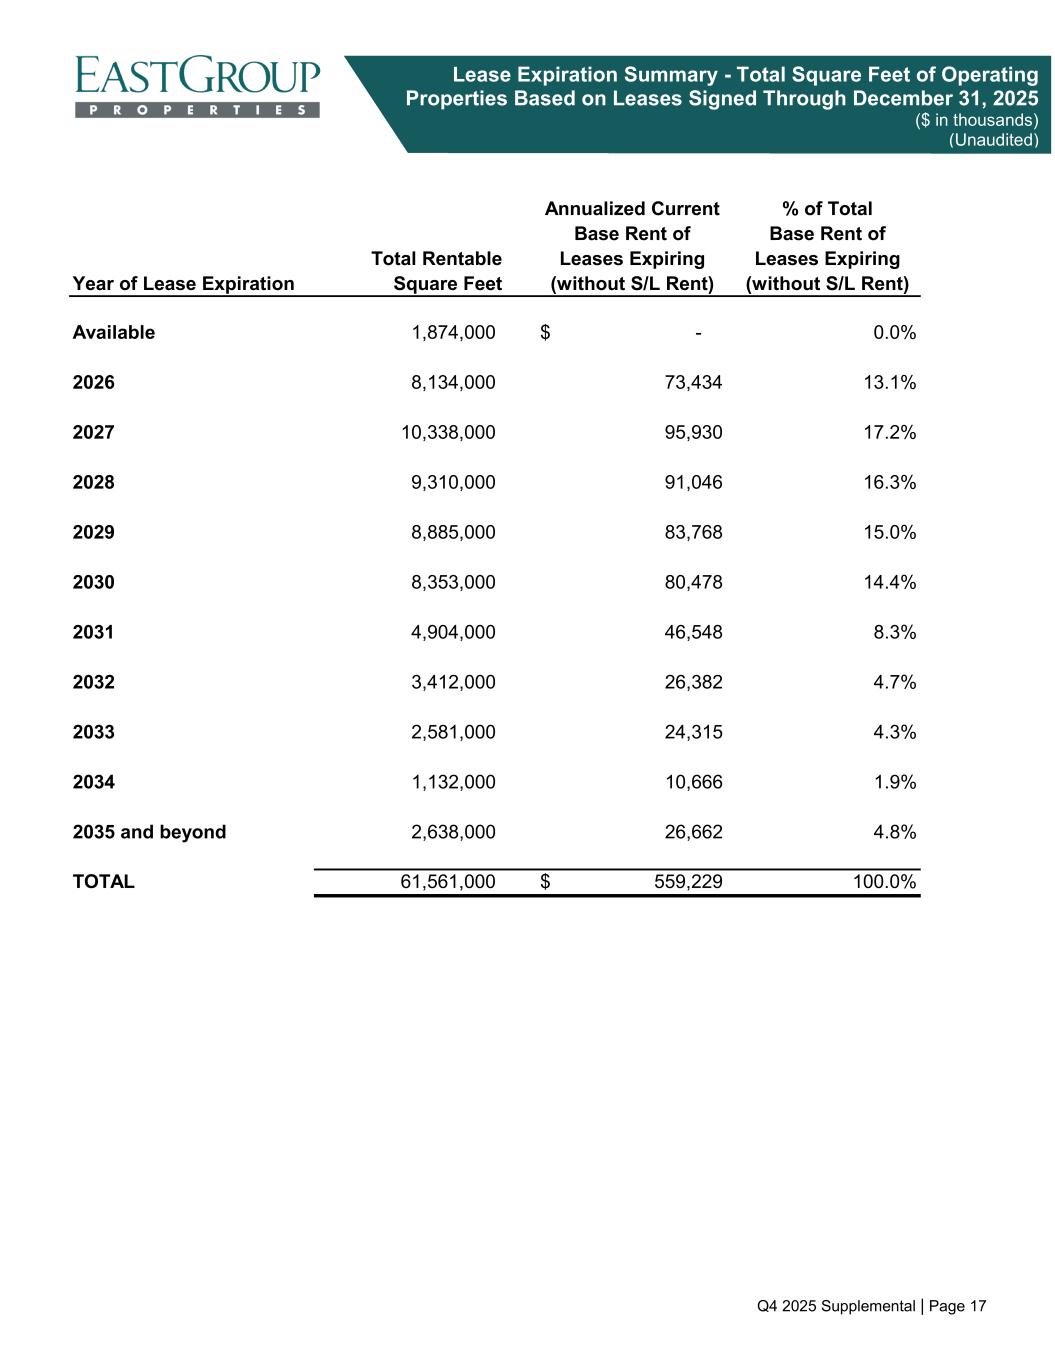
Great, thanks. Good morning. Just taking Samir's question a step further, I know you guys are typically hesitant to forecast rent spreads, but just looking at your expirations this year, the average rent is a bit lower than your forward year expirations at this time last year. I guess, does that give you any confidence that you can hold spreads somewhat steadier year over year? Is that lower expiring rent more of a function of the mix of markets and just lower rent markets rolling over this year?
Hey, Blaine, it's Marshall. You know, I felt you're right. I felt better, probably you're right, looking at what has expired. But it is more market by market and even sub-market by sub-market in some of our markets as to where. But, you know, look, it's definitely trending down, but still, you know, look, I'm happy we ended the year at 40%, although we were lower at the end of the year, net effective than when we started the year. I think it will keep drifting down. Hopefully, and we'll hang on to it. We're several years away from having negative rent growth. And I remind myself, look, we're in a cyclical business. It's always underbuilt and then overbuilt. And we're underbuilt. And as the market shifts, as we were talking the last question, I think you'll have that rent inflection and we'll relift our mark to market within our portfolio. So we should have good positive releasing spreads this year. I think there'll be probably more like the back half of the year than the first half of last year. And then it's just when does that market turn because there's not much vacancy. And even in the Shallow Bay because we have the older buildings, there's more functional obsolescence in Shallow Bay than there is Big Box because No one was building big box buildings 20 years ago.
Yeah, and Blaine, I would add, you know, speaking specific to some of the markets, I like our diversity. So as California has maybe slowed some, other markets like Houston, which is, you know, one of our larger markets, has actually picked up some of that steam. So our diversity definitely helps as we go into the future quarters.
Operator
This question comes from Alexander Boldfarb from Piper Sandler.
Operator
Please go ahead.
Hey, morning down there, and congrats all around in Reed. I'm assuming they told you all about the joys of endless nareeds, so welcome to Reedland. question for you guys on competitive supply uh you know industrials are always a big institutional demand area uh and hard to believe that you know if things are good to getting better that you know competitive supply is going to remain at a diminished level so what are you seeing for the appetite from lenders whether it's banks or private credit for development and from the institutional equity side, what do you see as their appetite for existing versus getting back into development?
Yeah. Hey, Alex, this is Brent. Good to chat with you. Yeah, competitive supply, as Marshall alluded to, we feel good about where that is. We spend a lot more time as a team talking about demand relative to supply. It's still tight. And when you look at multi-tenant, that vacancy rate It's about half of the overall or half of the bigger box space at about 4.5% on a national level. But, you know, the one analogy we've been kind of giving, if we could just have a little better uptick in signing and momentum, you know, we have a land bank and land inventory. We have literally plans with permits ready to go. We're obviously still actively developing, but we desire to do more. And we're poised to move very quickly. And you see we got it to a little bit of a higher number this year. But we could accelerate from that, and we're poised to do it. You know, our competitive set tends to be good regional developers. And, you know, there are equity guys, partners out there. You know, there's been risk-off. I think that will begin to unthaw if the market turns some. You'll certainly see that come back around. But there's going to be a lag time there for them to, you know, typically those type groups don't carry land inventory, so they may have to secure a site, which can be very time-consuming, get their equity partner together and get some of those ingredients together so much like we did coming out of the great financial crisis we were sort of first to market so to speak and really ramped up and got more of our portion of the activity and we kind of fancy that happening again if we could have a nice uptick we could lean into it faster and ahead of the competition maybe play a few innings of the game before the other team gets ready to play and so we've to be fair we've been saying that for about 24 months running now but the ingredients are there for that to happen and I'm confident it's going to happen it's a matter of when could this be the year we hope so we're poised if it is we'll lean into it and if it's you know kind of like it's been the last couple of years we'll you know paddle with it sideways if that's what it gives us but we feel good about where the competitive set is and our ability to lean into it if we're given that opportunity.
Operator
Thank you. The next question comes from Nick Fillman at Baird. Please go ahead.
Okay. Good morning. Maybe a question for the COO or president here. I'm continuing on the land bank here. The overall basis here is around $32 a buildable foot. I'm sure there's a little bit more permitting and costs. You might have to go into that number. But as you just look at these new starts and potential yields, assuming relatively flat, just red growth here, like what type of yields are we talking about on additional starts from here?
Yeah, it's Nick, it's Reed Dunbar. I would say going forward and into 2026, we would anticipate similar yields of what we've achieved in 25. And thanks for pointing out the land bank. A little over 1,000 acres is something that we are bullish on. And as Brent mentioned, that's not easy to come by. The permitting and entitlement periods now take longer and longer and more and more challenging. So the fact that we have the land that we do, the portfolio and the relationships that we have, we feel like we will be able to take advantage when that demand starts to pick up with the team in place. in the majority of our land, especially for second-phase developments, have permit in hand. So the team is geared up and ready to go, assuming the leasing continues to occur.
Operator
The next question comes from Brandon Lynch at Barclays. Please go ahead.
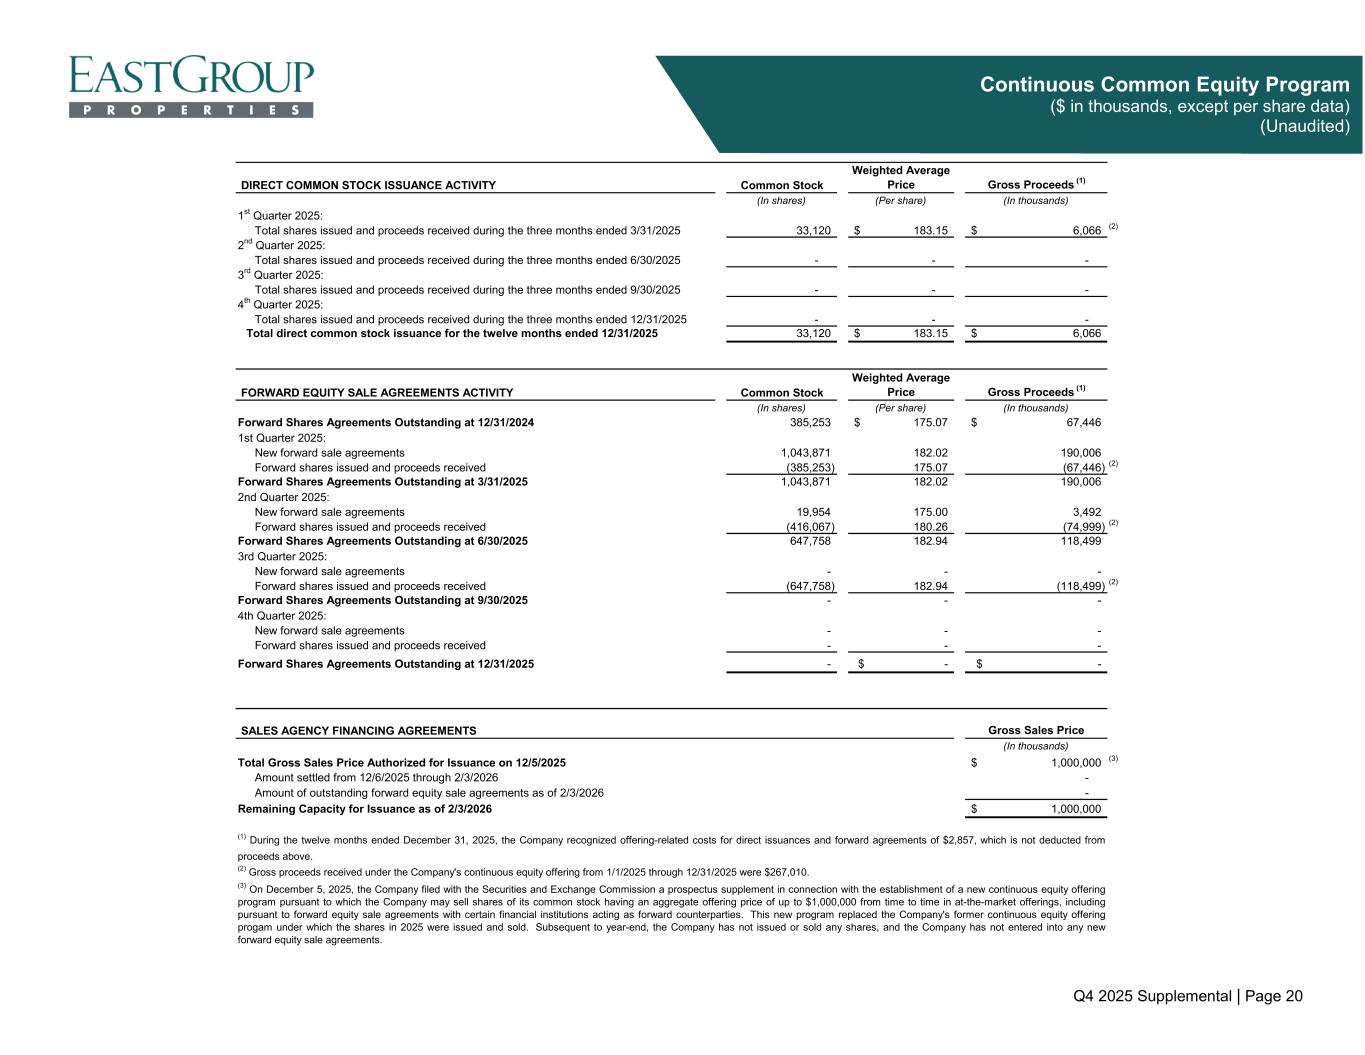
Great. Thanks for taking my question. Maybe one for Stacey, and congrats again on your new position as CFO. So you suggested that guidance assumes additional debt issuances, but maybe you would consider issuing equity. Can you talk about what would make you toggle between the two in terms of capital allocation when looking at the development pipeline and perhaps scaling that beyond what you've guided to and potentially additional acquisitions throughout the year?
Sure. First of all, thanks, Brendan. Appreciate that. Excited for the team. And, yes, as we enter the year, our guidance does assume $300 million in debt issuance. And we really are constantly monitoring the debt and equity markets, remaining flexible. And while we assume debt issuance, we're monitoring the cost of that debt versus cost of equity. Ideally, we're in a situation where we can toggle back and forth and have a balanced approach. But, you know, in guidance, we contemplate debt. We have plenty of room on the balance sheet. to fund the opportunities that come our way this year between development starts and acquisitions. So we could certainly issue debt or debt and equity beyond the $300 million. And we also have plenty of capacity on our bank credit facilities. I mean, at year end, we had less than $20 million drawn, so over $650 million available. So we can immediately fund those opportunities that we think make strategic sense for the company. and then we can either issue debt or equity beyond that. But right now, we're around a three times debt to EBITDA. So when we think about the strength of our balance sheet, we have a lot of dry powder. You know, a sub-five debt to EBITDA would be a long-term range that we would want to stay in. But even with the debt that we have contemplated, we're still in the low threes, as we think, through the end of the year. So plenty of capacity if we were to find additional opportunities. So it's really not that we have capital constraints. It's more of the opportunities that we find, and that's what the teams are working hard to find those opportunities that make sense. And with accretive acquisitions on day one, we can certainly enjoy using that dry powder to continue to grow earnings.
Operator
Great. Thanks, Brendan.
Operator
Thank you. The next question comes from Todd Thomas from KeyBank Capital Markets. please go ahead.
Hi, thanks. Good morning. Appreciate all the commentary around development leasing in the quarter and the prospect pipeline. Sounds encouraging. What's assumed in guidance in terms of development lease-up, both on assets already converted, you know, including Horizon West, perhaps, and then, you know, what about the 1Q and 2Q scheduled conversions? You know, how are you thinking about the lease-up and sort of what's included in the guidance?
Hey, Todd. Good morning. It's Marshall. For the year, we have around $0.07 of spec development leasing, kind of assumed in our budget. And that kind of mirrors our starts this year as well in that it's pretty back-end weighted. So we're low the first two quarters of the year, and then it picks up in third and fourth quarter. And so we've got some time to identify. We've got some leases signed, obviously, in fourth quarter, if we're getting those tenants in and the build-out finished and things like that. But at least those are signed and it's more construction. But in terms of landing new tenants, getting them in, really the impact will be in third and fourth quarter. And if I'm an optimist, that also gives us a chance where we could get ahead of this year's budget.
Okay. The seven cents is all new incremental leasing. or related to new incremental leasing or is some of that from the fourth quarter leasing that will come online late in the year?
It would be new spec. If you said how much speculative leasing do you have in this year's budget, it's $0.07 of the $9.50 and that's back half of the year.
Yep, got it. That's helpful.
Operator
Thank you. The next question comes from Rich Anderson from Kent or Fitzgerald. Please go ahead.
Speaker 9
Hey, thanks. good morning and congrats everybody um so marshall every brain has four lobes so i want to get to one or two of marshall lobes uh and and when you're thinking about uh you know guidance going forward last year at this time it was 880 to 890 you did 895 so you beat that by 10 cents you did you beat same store no i by 100 basis points ultimately versus the initial guidance And that year, last year, required hopscotching through Liberation Day, new politics, and so on. So when you think about the forward view today, I imagine you feel more confident than you did a year ago today. And what's the reality about setting guidance in your mind with perhaps a cleaner sort of runway? You know, is there an element of conservatism? Do you kind of put yourself in a position to hopefully have a beat and raise type of year? Like, how does – what's the reality factor around setting guidance today with, you know, hoping to expand upon it as the year progresses?
Hey, Rich. Good morning. It's Marshall. Yeah, I don't know that I have a frontal or a rear lobe, actually, which is just a last name, but I appreciate the creativity. You know, on our budgets, they bubble up kind of suite by suite from the field. So we'll look, rather than corporate budgeting and saying, hey, here's what you need to do that may or may not be realistic. So that's kind of always been our approach. They know what they can do. And then the regionals will challenge them on the budget to try to make sure it's not either. And you kind of get to know personalities. One day over a beer, I can tell you who's conservative, who's aggressive, and who's usually spot on. their budget and things like that. So I think when I'll compliment the team, we'll scrub the budget and usually push and it ends up a little higher than what bubbles up from the field, but they do a great job of finding ways to beat it. Once we set it, we do talk about what's our budget versus what's our goal, and we'll find ways to beat it. You know, in terms of a year ago, we felt, you know, here's where I guess one of the cautionary tale is we felt good. Last year, fourth quarter was one of our best quarters for leasing. First quarter was really good. It was really Liberation Day. It was kind of starting April where it felt like, I remember that first quarter call where people were saying, have you stress tested the lower end of your guidance and things like that. So for what it's worth, if we guess this year, I would say I think people are maybe a little more numb to headlines, but I'm expecting a year where we'll have some tumultuous headlines. And I just hope that doesn't throw long-term capital allocation decisions, meaning development leasing. But I'm expecting it to be, like last year, it was a good year, but it was choppy water for a lot of the time. And I would guess this year, hey, until we get closer to midterms or whatever. But look, at the end of the day, regardless, we got to go lease this space in this building. So I like how simple and straightforward we know what our task is to go get the vacancies especially within our development leasing done and that'll pull the ticket for the next building as well so i i hope we're being conservative and i'll let you be the first one to remind me that we were conservative then if you're right is is guidance versus goal like what's the typical spread there this is not a second question by the way but i mean it's not do you like yeah yeah yeah no there's no there's no increment they just you know look our comp in the field as said, if you can beat your goals, you know, there's a little more incentive. And that's where, but there's no, you know, six cents, five cents, anything. It's just, hey, this is what we've all signed on to. And so it's your job, one, to deliver it. And then two, if we can help you or find ways to get a little ahead of it, that's what benefits our shareholders. So how do we, you know, find that window really pending what the market gives? Sometimes it's leaning into development. Sometimes it's leaning into acquisitions or buying value add or being creative and figuring out how to make a lease work that looks like it's about debt or something like that.
Yeah, I would just add to that, Rich, you know, having been in the field, it gets, you know, I think our midpoint of guidance just a slight bit lower, you know, for 26 and 25. But if you asked us, do we think occupancy would be lower? Not necessarily, but when you get in that 96, week's 97 percent range and you're rolling budgets up it you know it becomes challenging to say I'm going to be 100 percent leased this year and everything's going to go and it could but then as you roll it up organically being 20 bips down in that sort of range is really you know just a deal going here or there one way the other so I hope as you said our trends have been to be a bit ahead of where we are and we feel like we could do that again but you've got to have a starting point somewhere, and obviously this is the jump out of the gate, and, you know, the field is trying to be reasonable with what they're seeing, and then we certainly hope to better it as we go through the year.
Speaker 9
Perfect. Thanks, everybody.
Operator
You're welcome. Thank you. That next question comes from Michael Griffin from Evercore ISI. Please go ahead.
Great, thanks. I wanted to circle back on supply and maybe, you know, dig a little deeper. You know, obviously it feels like maybe there are going to be some puts and takes at 26, but the outlook feels better, I guess, relative to 2025. But, you know, Marshall, if we do see this inflection point, is there a worry that supply could then follow, precipitously pick back up, and then we're just kind of in the same state we've been in over the past couple years of overbuilding? Or are there, you know, maybe more onerous, whether it's regulations, cost constraints, kind of governors that would put a, you know, meter on that, I guess, forward future shadow supply?
Good morning, Michael. I think, you know, and I don't mean to be, but a little bit yes and no, and that I think the no part of my answer, you're right, that getting permits and things, and we've, you know, I've usually attributed it to Amazon. Everybody wants the good or service or package delivered quickly, but no one wants the distribution building in your neighborhood. So we've seen zoning get materially harder and more time-consuming when we go through. And so that's what will, and as Brent mentioned earlier, the private developers typically aren't structured balance sheet-wise to carry land, carry a construction team, have a permit in hand. So long-term, yes, we're a cyclical business. It'll attract capital where people are making money, other people imitate and jump in. and everyone became an industrial developer last cycle and we overbuilt. So long-term, you're right, but I think it's going to be, I say longer-term, it's going to be measured in a few years before people can kind of gear back up, get the land, get through permitting. And I know how much we struggle finding good land sites. It will take a while for people to find the site and get through the process. And thankfully, it's something we purposely have, But we have the team, the land, the balance sheet, and the permits in hand, and that will give us, you know, several quarters, if not a couple years head start before the likeable guys start getting land and they get it permitted and then flip the land and all the things. So it will get overheated. That's just what we do, but we'll have a pretty long runway before we get to that. And along that way, that's when our mark-to-market should pick up. And when you'll see our development starts go from $180 million last year, which we scaled back, to hopefully that, you know, whatever the market takes is $400 million in starts or more.
Operator
Sure. You're welcome. You're welcome. Thank you. The next question comes from Mike Mueller at JPMorgan. Please go ahead.
With the expanded management structure, what aspects of your operations do you think you're going to be better at than before you added the extra depth? um all the things i delegated i guess would be my answer one i look i'm excited a good question i'm excited for the team and and maybe a little bit i'll go to the like if you're in a car i'll go to the rear view mirror and then the windshield we had not changed our structure and it's worked been a little over 20 years and we were 19 million square feet and just as the world evolved and it's gotten more complicated with corporate responsibility. The company's grown. We've picked square footage and property-wise a lot more analysts and things. And so our team was just, we've got a really strong team. I'll tie that into why we've usually found ways to beat our budget. So I'm excited for all three of them. I was probably, I'll put it on myself, part-time COO for the last few years. And Brent's got a great background. And just the more I got tied into zoom calls non-deal road shows conferences it's harder to just go sit in the sit in a suburban with the brokers and stare at a piece of land in austin texas and all the fun things that we that we do so i'm excited about that end uh excited for stacy who's you know been with us for as young as she is an awful long time and taking on more and more and then and then reed We've done so well in the central region. We said, okay, let's get Reed involved with, as you've seen us kind of work through our markets where, you know, like I'm excited. We're talking with one of your peers yesterday where we exited Santa Barbara. We're maybe a few weeks away from exiting Fresno. We've sold four of our five buildings in Jackson, and Reed took us into Nashville and John Coleman and team into Raleigh. We spend a lot of time talking about where do we want our capital allocation and researching where are those markets, we can create a lot of value with development, but then the other way we can create value for our shareholders is where do those rents go over time and where is population moving and land constraints and things like that. So just as we grow, it's gotten, which comes with growth, more complicated, and we said, okay, let's divide this up and it's just time to do it every 20 years we'll rethink our structure a little bit. So we've got a lot more operating efficiencies there.
Yeah. I would just jump in and add to that, like Marshall said, as we've grown as a company, everything we've done kind of, which is fun, we're very horizontal, it happens organically, and the addition of myself and Reed and kind of expanding role, I view it more as just trying to help, not change of strategy or anything, but help support our team in the field and be a little more communicative from corporate to the team in the field. And, look, when you're on the ground and development leasing and all the things you're doing, and our team does a great job of that. But Forest for Tree, also trying to help think strategically, think long-term, think runway. You know, where do we have more opportunity? You know, communicate capital access or limitations from corporate to the field. So just, you know, better with that, more efficiencies, more perhaps analytical review within our portfolio and looking at trends and those things. So just sort of an exciting time to take it the next step and put ourselves in a better position to keep doing what we do, but do it maybe a little better, more efficiently, and lean into it just as well as we can.
You know, and I'll apologize. I agree with Brett totally. I should have said it. I talked about the rearview mirror. The other reason that led us to this was that, look, we talk about this inflection point, and I think if, you know, pick whatever. If we were in a classroom, you can see it coming. You can see the low supply. You can see demand. You can see the delay in supply coming. One of the goals, as we talked about, is while we have the land we do and the balance sheet, we really want to step in and make hay while the sun shines when you're in a cyclical business. We're going to stay disciplined with our new investments, but we really wanted to have the right team in place and the right structure in place, we've grown a lot, and growth just for growth's sake is never a goal of ours, but we really think we're going to have a really good opportunity as the market stabilizes to really take advantage of our competition lagging behind us with our skill set, and we needed to restructure our team a little bit so that we could move more quickly on those opportunities.
Got it. Okay, thank you. You're welcome.
Operator
Thank you. The next question comes from Vikram Malhotra at LeZuho. Please go ahead.
Good morning. I just wanted to clarify sort of two things and maybe you can expand. I guess one, you've started new developments, you've talked about like an improving cycle and trying to take advantage of when things turn further. I'm hoping you can give maybe more granular anecdotes either by tenants or from your folks in the field on like what's actually turning kind of this new up cycle and then related to that just where your thoughts are on absolute rents in the Sun Belt you've had this fantastic run and from an occupancy cost standpoint I'm wondering is there a chance there's a sticker shock just from the absolute rent levels we've seen thanks maybe a couple of thoughts I'll try and become good morning that you know what makes me more excited and again what I would say on the development side It's one, the quantity of development leasing we got,
you know, I mentioned over half of our annual total was in fourth quarter. The sizes of those leases were larger, as Reed mentioned. So we're seeing tenants under 50,000 feet, but now we actually got some larger tenants and people being more comfortable with their capital allocation and kind of layering in on top of that. It's abnormal for us, or it's atypical, For us to have as many large tenants, 92% of our rents come from tenants under 200,000 square feet. For us to have six to eight to nine conversations going on with, we'll take a couple of your buildings, or can you build me a building, and things like that. And they're not all over 200,000 feet, but they're all certainly north of 100. and we won't get all of those and some will be put on hold and every other reason but just the quantity of those decisions and really the diverse tenant base and diverse geography you know if it was all happening in florida it might be one thing but it's really across all three of our regions and multiple markets and you kind of go okay it feels like the ice is stalling a little bit if we got this many finished and we've got this much more dialogue going from the field where they're, you know, when we talk to them, we say, hey, I got a call and someone wants 150,000 foot pre-lease. You know, there's a lot to work through. So that makes us feel a little better. And then we do look each quarter while we lose tenants, kind of going on the absolute rent, where we still have that embedded growth. If there's sticker shock, all of our tenants, even renewals, have a tenant rep broker. So that's usually where they'll get the sticker shock if it does come before they talk to us and we don't lose tenants over rent it's usually a consolidation or leaving the market or every once in a while a bankruptcy or something like that you know we can only charge market rents or maybe a little above market rents if we're doing a good job managing the park and things like that but thankfully you know the The rents are the rents in the market, and we're a really cheap alternative as people move to faster and faster service. I think if you don't have that last mile distribution hub, you may can cut costs, but you're going to cut your service so badly. If you're trained air conditioning or Home Depot or one of those, you can have a low cost structure, but your revenue is going to be falling even faster.
Yeah, and I would just add to that, Vikram, that, you know, as far as absolute rents, and certainly rents have had, you know, significant increase, you know, say even post-COVID, but really supply and demand, right? So, I mean, the demand, you know, the options are limited. So, you know, if you need the space, you've got to pay to get it. I think one important thing to note about this cycle of sorts is that the vacancy is much tighter than we've seen in some of the other cycles. If you go back to great financial crisis, you started seeing vacancies get into the 12%, 14%. Like I think our operating portfolio maybe got down to 88% or something. And certainly we've not seen anything near that level. But the point being is even when you look right now, I mentioned earlier in multi-tenant vacancy being 4%, 4.5%. Well, if you say things have been, quote, slow over the last few years and you're still running at a 4.5% vacancy, There's not, again, we're talking about not a huge pivot or tsunami that we need to kind of turn and get things to where you could push, even push on rents, because we don't have that wall of vacancy that got dumped into the market, and mainly because capital got pulled back, and so supply began to come down even when leasing was still strong. So we don't have that wall of vacancy to work your way through to get back to a good, stable market. Thankfully, we've kind of maintained a sideways, good, stable market. If we uptick, I think there's even room to push rents versus, you know, relative to sticker shock or where they are today. So time will tell. But as Marshall said, much more time spent in our shop talking about demand relative to rents.
Makes sense. and congrats everyone on the new roles, you know, Reed, Brent, Stay, Faye, look forward to working with all of you in your new roles.
Operator
Thank you. The next question comes from Eric Borden from BMO Capital Markets.
Hey, good morning everyone and congrats. I just wanted to circle back to the occupancy, you know, I appreciate your comments on the decline related to a couple leases in 26, but just curious, how much of the expected decline is in the first quarter is related to move outs versus development projects being added to the operating portfolio?
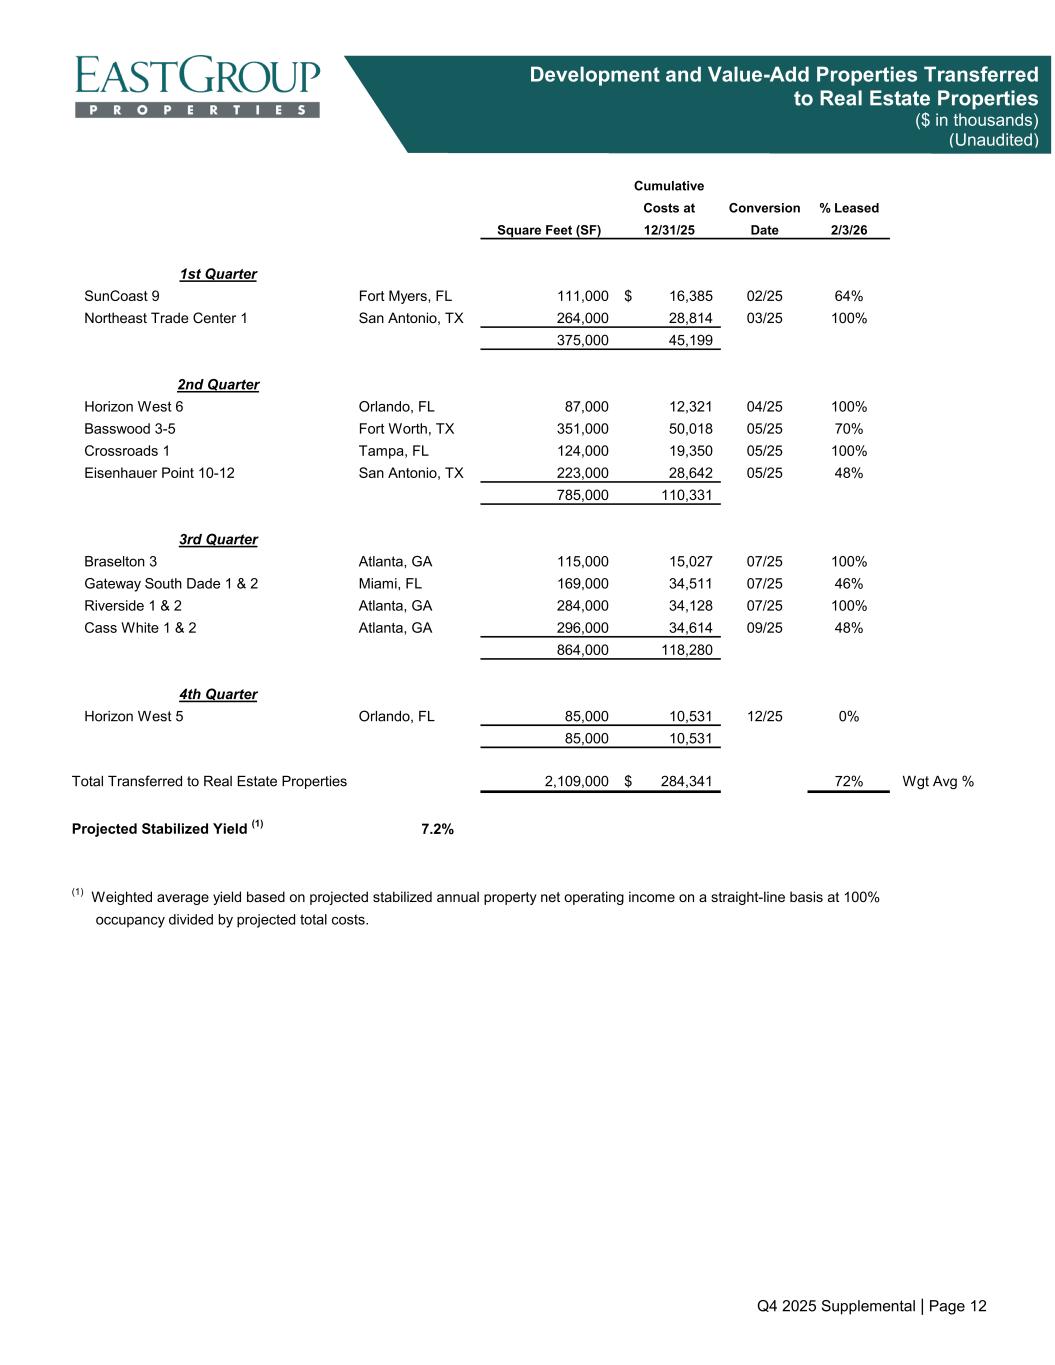
Really, in first quarter, there's not much of an impact from development transfers. We're seeing that more as we look throughout the second, third, and fourth quarters, and I think some of that, as Marshall alluded to earlier, is opportunity for us. We have some work to do, but that's where we could hopefully see an increase in our actual occupancy compared to projections as the year goes on. First quarter is pretty flat, really, from fourth to first quarter. So we start projecting that for later in the year. And again, that's the budget and not the goal. Just with the uncertainty in the environment, it's hard to know exactly the timing of when we'll see occupancy there. But that's definitely, as we look at occupancy for the year 26, where we do see a decline in projections from 25 to 26, it really is due to those development transfers. The core portfolio that's in place is not declining. It's the drag. We would be flat if not for those development transfers.
Eric, I would add, with the increasing development projections, to some extent that comes at the decline of same-store sales. So a lot of our leasing comes from our existing tenant base, which typically is consolidation or expansion. So as our development business grows, our same-store sales may decline. So we're taking at times half a step back to take a full step forward. But net-net, you know, FFO, we anticipate to increase, and, you know, we see that as a winning strategy.
Operator
Thank you. The next question comes from Omotayo Okusanya from Deutsche Bank. Please go ahead.
Yes. Good morning, everyone. Just a follow-up question around tariffs. Just kind of curious your thoughts at this point on, you know, the Supreme Court and how things may kind of turn out from that end. And even if the Supreme Court does kind of say, you know, current tariff policy is not constitutional or legal, kind of what happens next and how do you kind of think your tenant base kind of deals with all that in terms of, you know, either kind of pulling back on a wait-and-see basis or to just kind of keep taking up space because they need to? Just curious how you're thinking about all, like, that whole iteration around tariff policy.
Good morning, Tao. Good question. And I think thankfully, I guess, as we think of the tariffs, one, you know, certainly it's that noise level or headline impact, tweet impact on our tenants that you'd love to minimize that so that their decision making goes smoothly. So I hope there's not shocks to the system like that. The only other comment is tariffs hit us last year, and we really rippled through. It did impact us on, say, our Dominguez building a little bit. We're prospects. It's near the ports of L.A. and Long Beach in that South Bay area, Carson, California. But by and large, it also reminds us over the years where we've said markets like Houston and Jacksonville, where we've been in since the 90s, where we like metro area distribution. We want to be that last mile and a fast-growing, higher-income area because that customer base is a lot stickier. And if you're buying a good or service, I'll go with a good, you don't care if it came from China or Mexico. You just are buying the item online and you want it delivered to your home or business really quickly. So that noise is a good reminder for us why ports are so volatile and we're not trying to guess which port is going to gain. I'm not smart enough to guess which port is going to gain and lose market share that we're just pretty confident that Orlando and Atlanta and Dallas and Phoenix are going to have more people over the next five to 10 years. And we want to be in the middle of all that with the best, most convenient location. So we try to, again, I think we try to take as many ways as we can as a company to minimize or eliminate risk, whether it's how we develop in phases in a park or be near consumers or our balance sheet or all the things we can do. But we also say as we're reducing that risk, we don't want to reduce the return at all. So that's just kind of one more way we go about it. And we can't eliminate the headline risk and how people make decisions, but we're working on it.
We'd sure like to. That's it. Thank you very much.
Operator
You're welcome. Thank you. The next question comes from Jessica Zhang at Green Street.
Operator
Please go ahead.
Hi, good morning. Just building on that previous question, I'm just curious if you're seeing a pickup of, you know, on-shoring or near-shoring related leases in any of your markets recently.
Yeah. Hi, this is Reed, Jessica. Scott. Activity for nearshoring has definitely, at least from what we're hearing from the brokerage community and some of the prospects, has definitely picked up. Markets like Houston and Dallas are actually seeing an uptick in advanced manufacturing and users that need higher power requirements. So I'd say that is a driver and will be a tailwind for us going into the future. You know, a lot of our markets that we're in don't specifically cater to, you know, those larger users, but a lot of the ancillary uses we may benefit from going forward.
Operator
Great. Thank you. The next question comes from Ronald Camden from Morgan Stanley.
Operator
Please go ahead.
Hey, just to, I guess, a quick two-parter, but so first, obviously, the development leasing was encouraging. The guide sort of assumes, you know, I think starts of picking up, got some acquisitions. Just can you remind us what the spread is looking like today between sort of cap rates and IRRs on acquisitions versus development that you're starting? Just curious what that spread is. And then the quick follow-up is just the exit of Fresno, any other sort of markets where you're paring back to capital recycle? Thanks.
Hey, Ron. Good morning. It's Marshall. reversal. The markets were exiting, as we mentioned, this goes back a few years. Santa Barbara, excited about Fresno. It's a project Brent and I bought in the 90s. And so just modernizing and updating our portfolio. And hopefully we'll have that closed in a couple weeks or so. Jackson is another market where we had five buildings. We're down to one building. We'll continue to, it's leased, but work on an exit there. And then the other one we've said is, and you've seen us go into Raleigh and Nashville. We've talked about Salt Lake potentially. Again, Capital City has technology, university presence. And we may never get to Salt Lake, but I'd rather not surprise anyone. But New Orleans being another market where we could scale back a little bit there.
And so that's kind of how we're thinking on our markets. and then I'm going back.
The first part of your question was on development leasing and kind of how we're seeing it. But, yeah, we're encouraged where we're headed with it. I think it's going in our direction. And, look, I think on the development, I guess I'm remembering, we've been developing to call it a low 7, 7.1 to 7.3 is probably our average on a ground-up development. And, really, the acquisitions we've made have been more strategic than opportunistic, we've said. It's been the building around the corner and something in our sub-market. They're still in the low to mid-fives. So there's still a lot of demand for quality industrial shallow bay buildings. Cap rates have been pretty sticky. And kind of given that, we're probably on the high end, maybe 180 basis points better return, closer to 200 on a development today than a straight out acquisition. And that's why we really haven't bought a portfolio or anything. It's usually been one-off buildings here and there. And the bigger the portfolio, the lower the cap rate. It attracts more capital, and it gets priced like that. But it can certainly drift into the force in some of our better markets as well.
Yeah, I understand that, Rhonda, the development leasing, and as Marshall said. But what I did, I'd like to see is just some consistency. First quarter last year was good. Second and third was was challenging fourth ended well but trying to just stack good quarters behind good quarters would be nice and so hopefully we can get a little more quieter macro environment rates continue to come down the economy slightly uptick better again just kind of get that confidence in executing and moving a little faster would all work in our favor and so uh you know excited about fourth quarter we need to stack a couple of those together and again we back and waited our start so we're We're hoping for that, but we'll see, but we're in a good position if that happens. Thanks, Ron.
Operator
Thank you. We have no further questions. I will turn the call back over to Marshall Lowe for closing comments.
Thanks, everyone, for your time and interest in East Group. If we didn't get to your question or if you have anything to follow up, certainly feel free to reach out to us, and we look forward to seeing you probably here in a few weeks, most of you.
Operator
Bye-bye. Ladies and gentlemen, this concludes your conference call for today.