Operator
Hello, everyone, and thank you for joining the First Horizon fourth quarter 2025 earnings conference call. My name is Lucy, and I'll be coordinating your call today. During the presentation, you can register a question by pressing star followed by one on your telephone keypad. If you change your mind, please press star followed by two. It is now my pleasure to hand over to your host, Tyler Craft, Head of Investor Relations, to begin. Please go ahead.
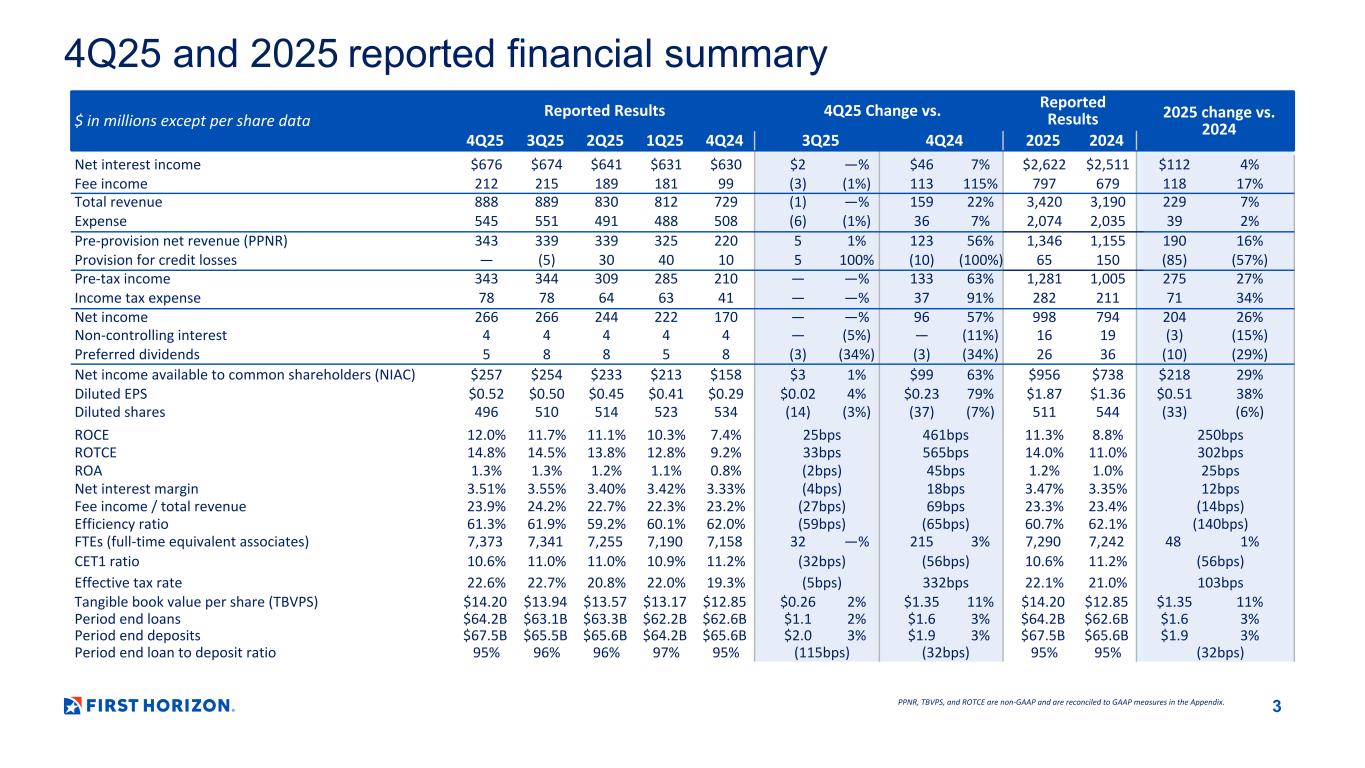
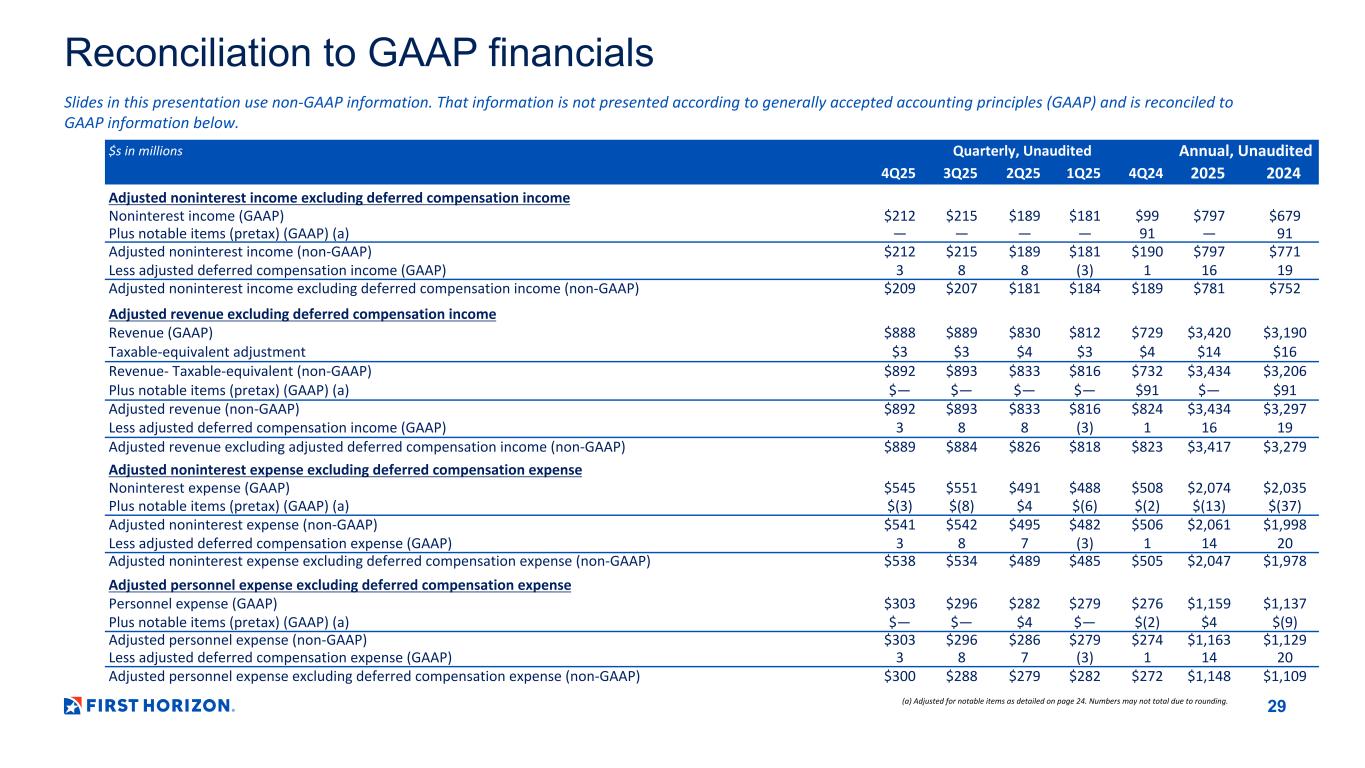
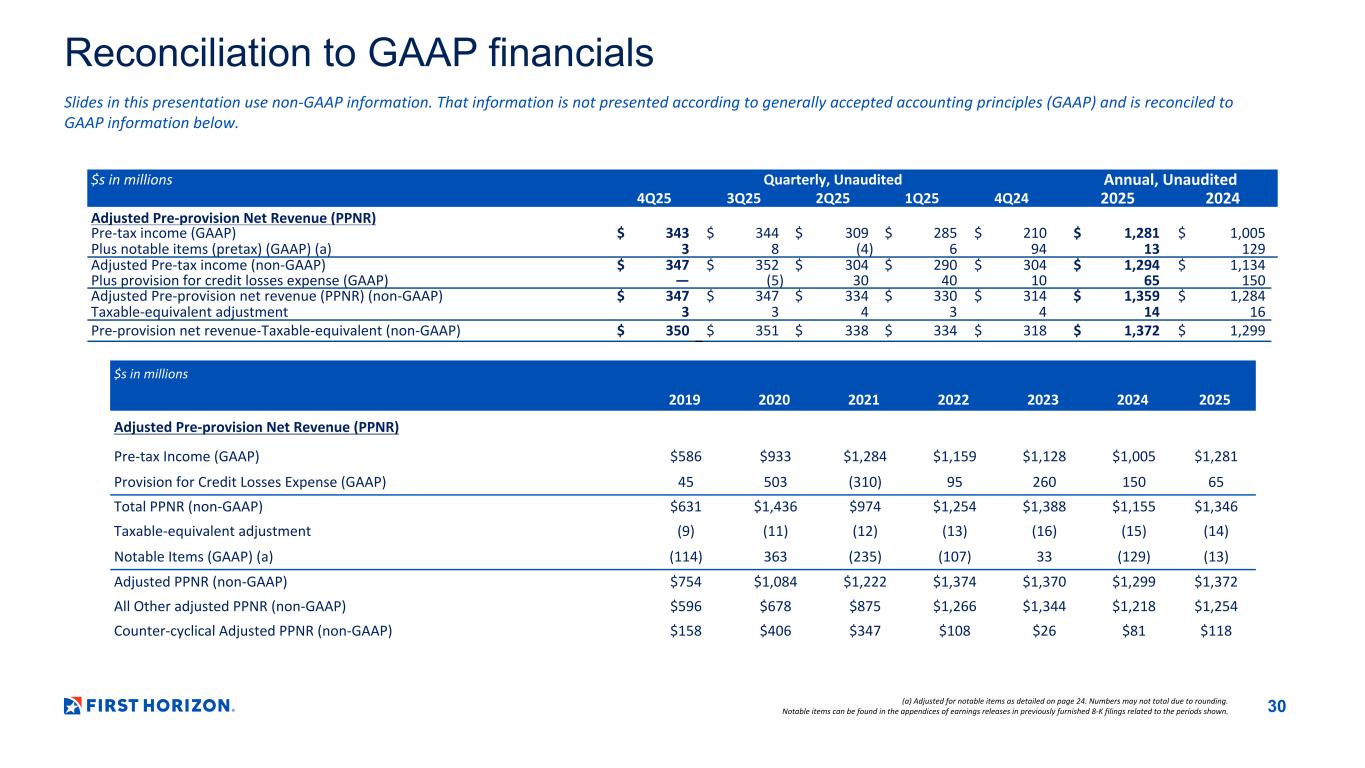
Thank you, Lucy. Welcome to our fourth quarter 2025 results conference call. Thank you for joining us. Today, our Chairman, President, and CEO, Brian Jordan, and Chief Financial Officer, Hope Dumb Chowke, will provide prepared remarks, after which we'll be happy to take your questions. We're also pleased to have our Chief Credit Officer, Thomas Hung, here to assist us with questions as well. Our remarks today will reference our earnings presentation, which is available on our website at ir.firsthorizons.com. As always, I need to remind you that we will make forward-looking statements that are subject to risks and uncertainty. Therefore, we ask you to review the factors that may cause our results to differ from our expectations on page two of our presentation and in our SEC filings. Additionally, please be aware that our comments will refer to adjusted results which exclude the impact of notable items and other non-GAAP measures. Therefore, it is important for you to review the GAAP information in our earnings release, page three of our presentation, and the non-GAAP reconciliations at the end of our presentation. And last but not least, our comments reflect our current views, and you should understand that we are not obligated to update them. And with that, I'll hand it over to Brian.
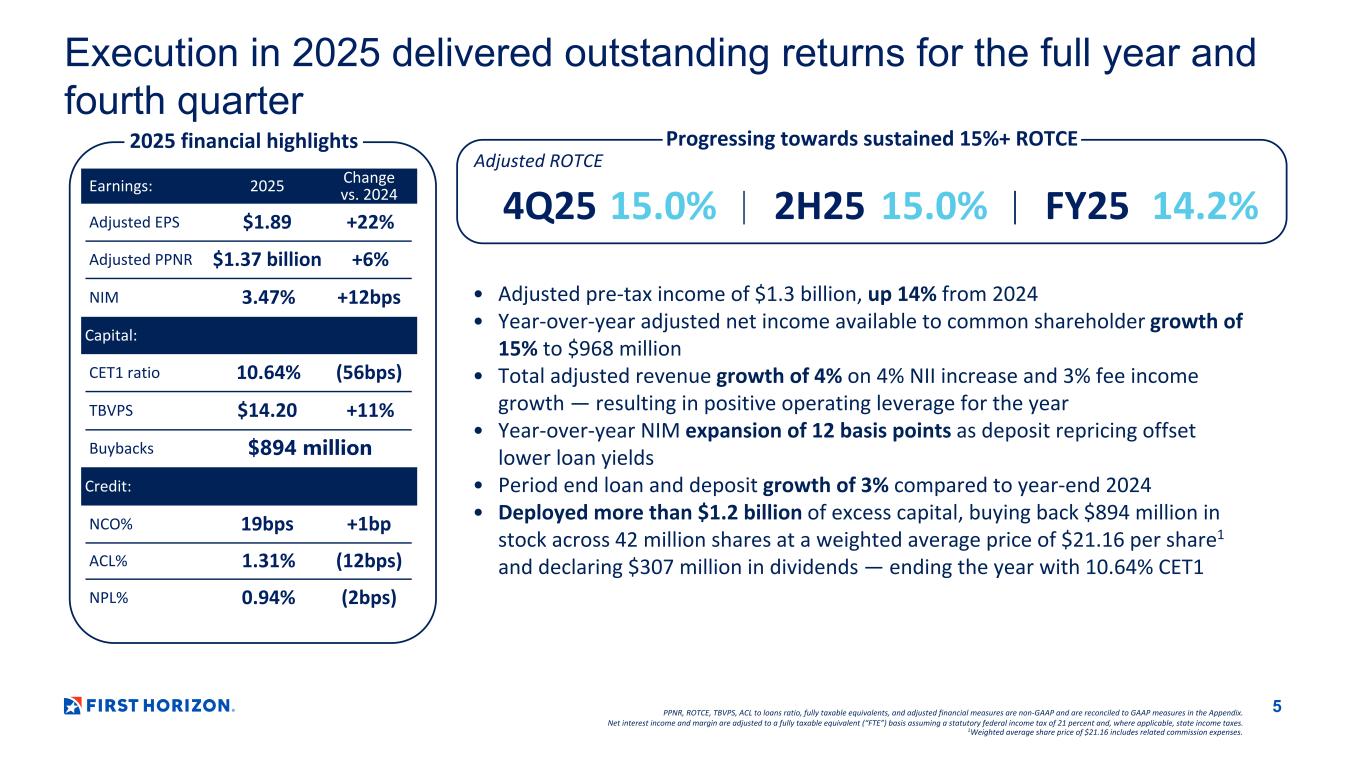
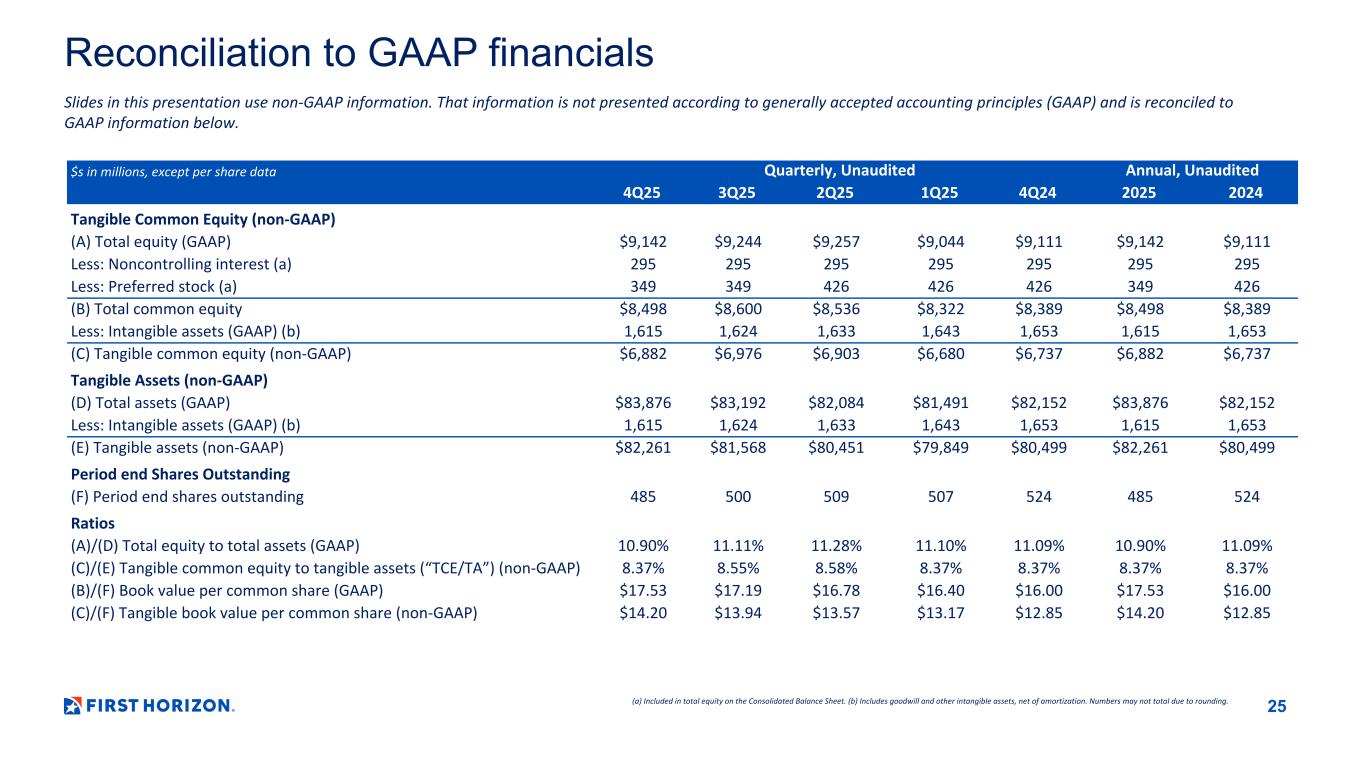
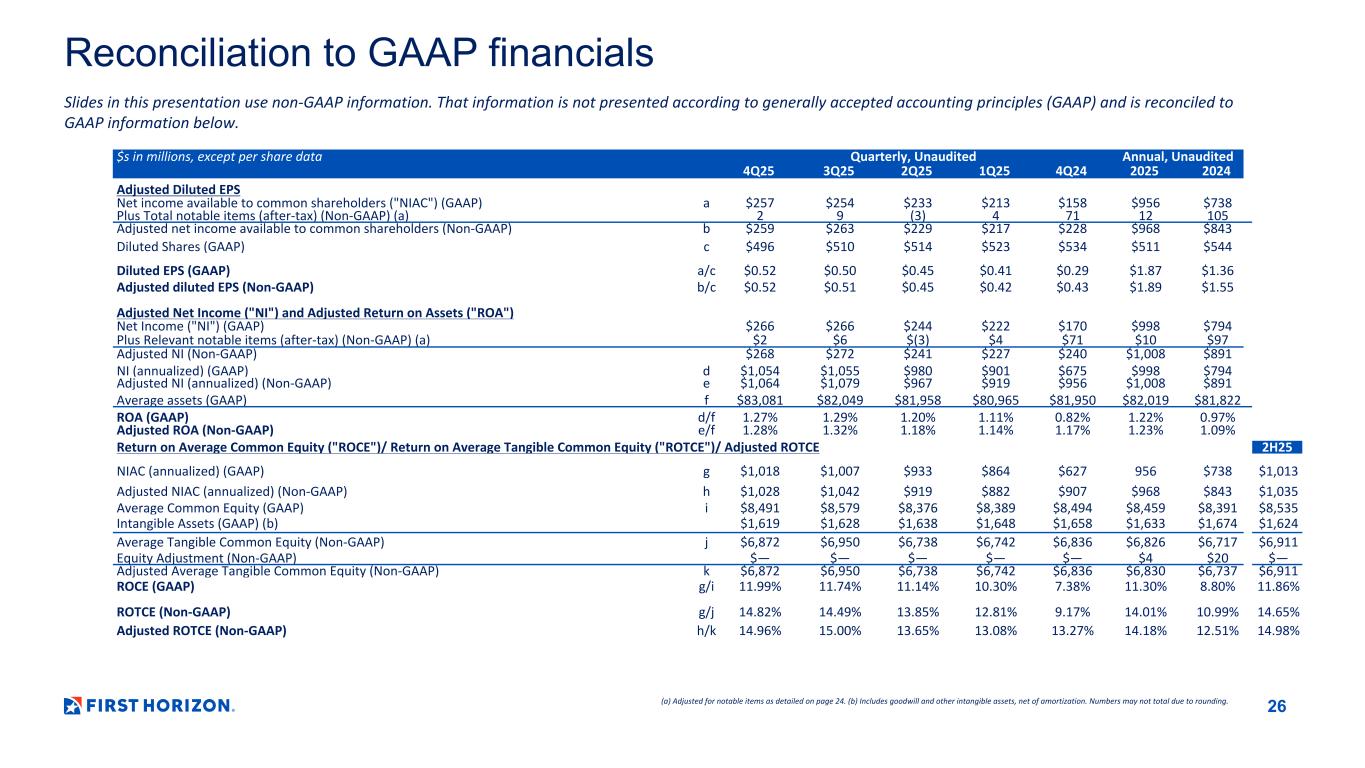
Thank you, Tyler. Good morning, everyone. Thank you for joining us. In 2025, we showed significant progress in delivering value for our clients, associates, and shareholders. We delivered increased pre-provision net revenue and return on tangible common equity, hitting 15% in the back half of 2025. Loan and deposit trends were solid, and we improved balance sheet profitability through a better loan mix and pricing, discipline control of deposit costs, and tighter integration of deposits within our client relationships. One example driving improved profitability is the year-over-year improvement of yields on market-based commercial real estate lending for new or 2025 originations by 34 basis points. In 2025, we also returned just under $900 million of capital in stock repurchases, and just over $300 million in dividends. With more clarity around economic conditions and regulatory trends, we believe we can continue to return additional capital to our shareholders while continuing to invest in growth opportunities. As you will see, and are optimistic about our ability to improve profitability and continue to grow earnings in 2026.
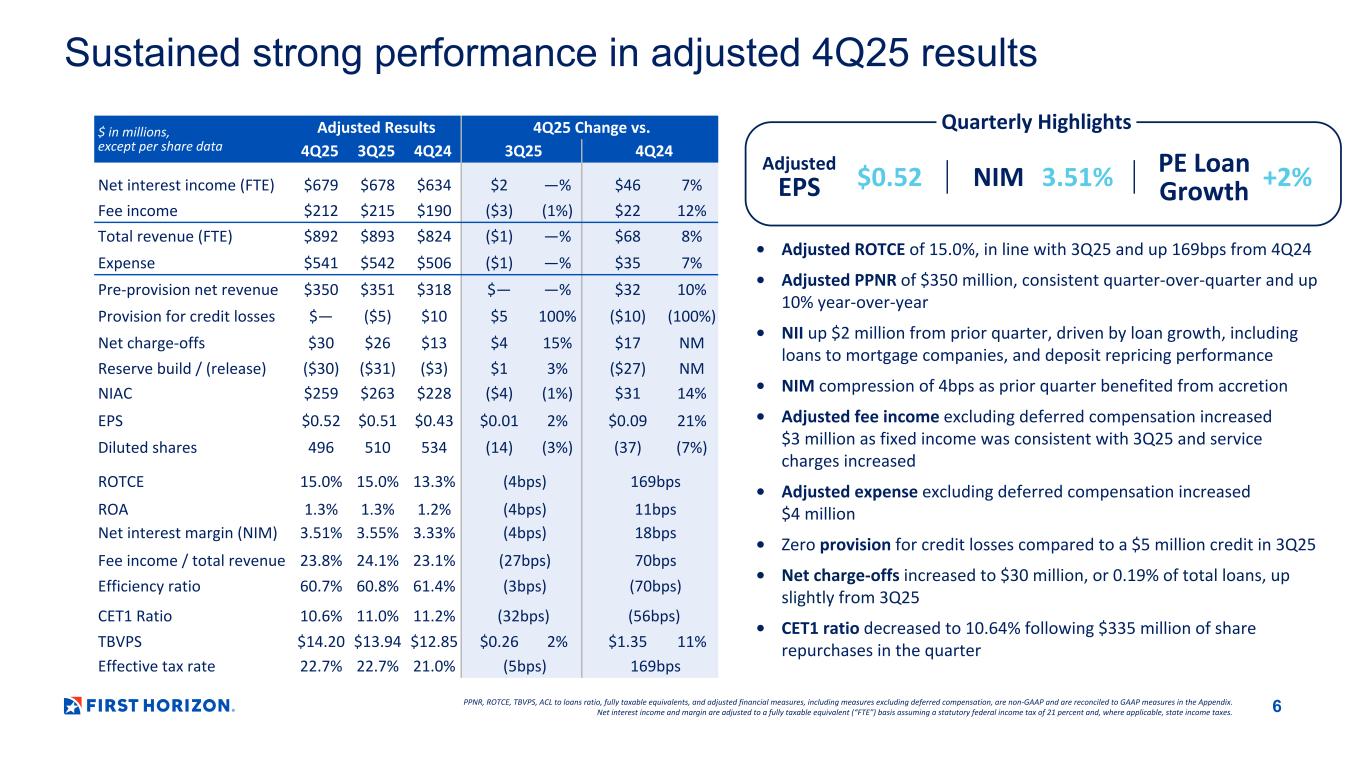
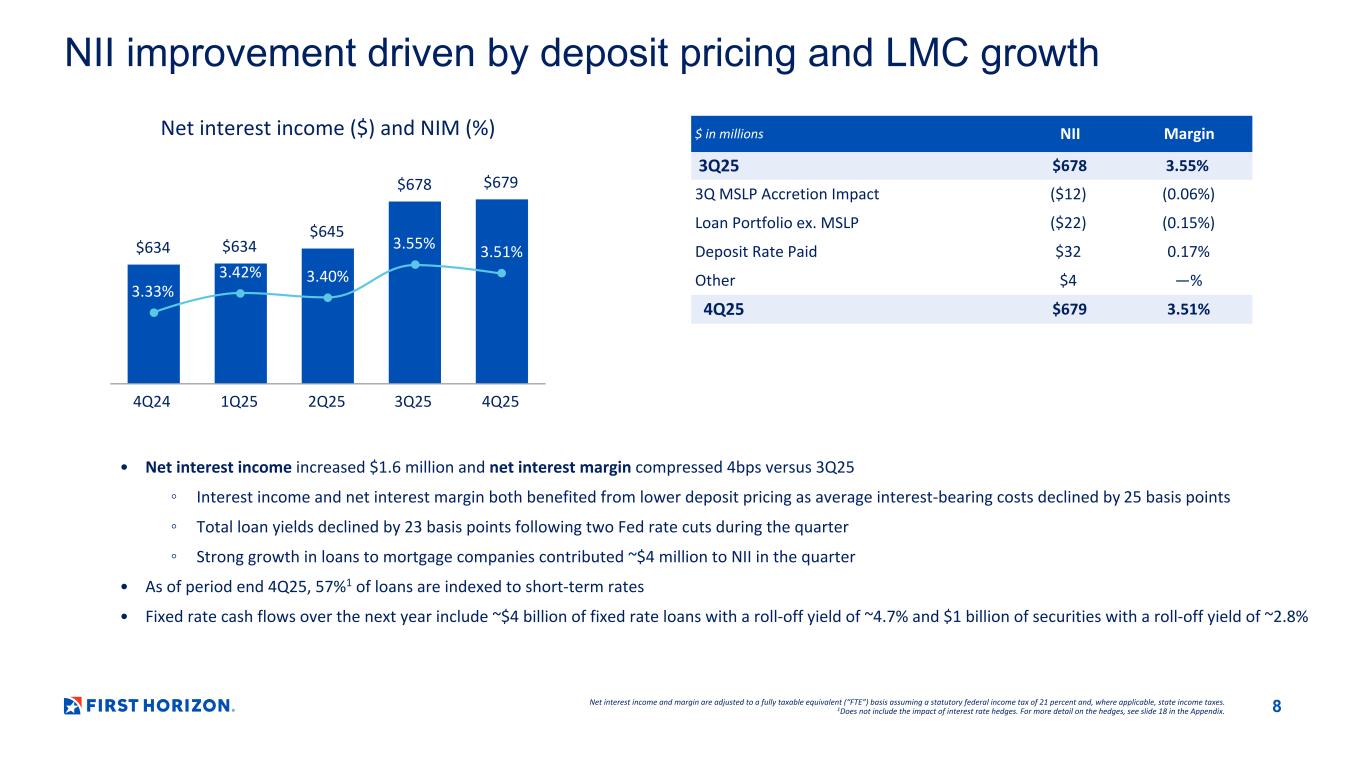
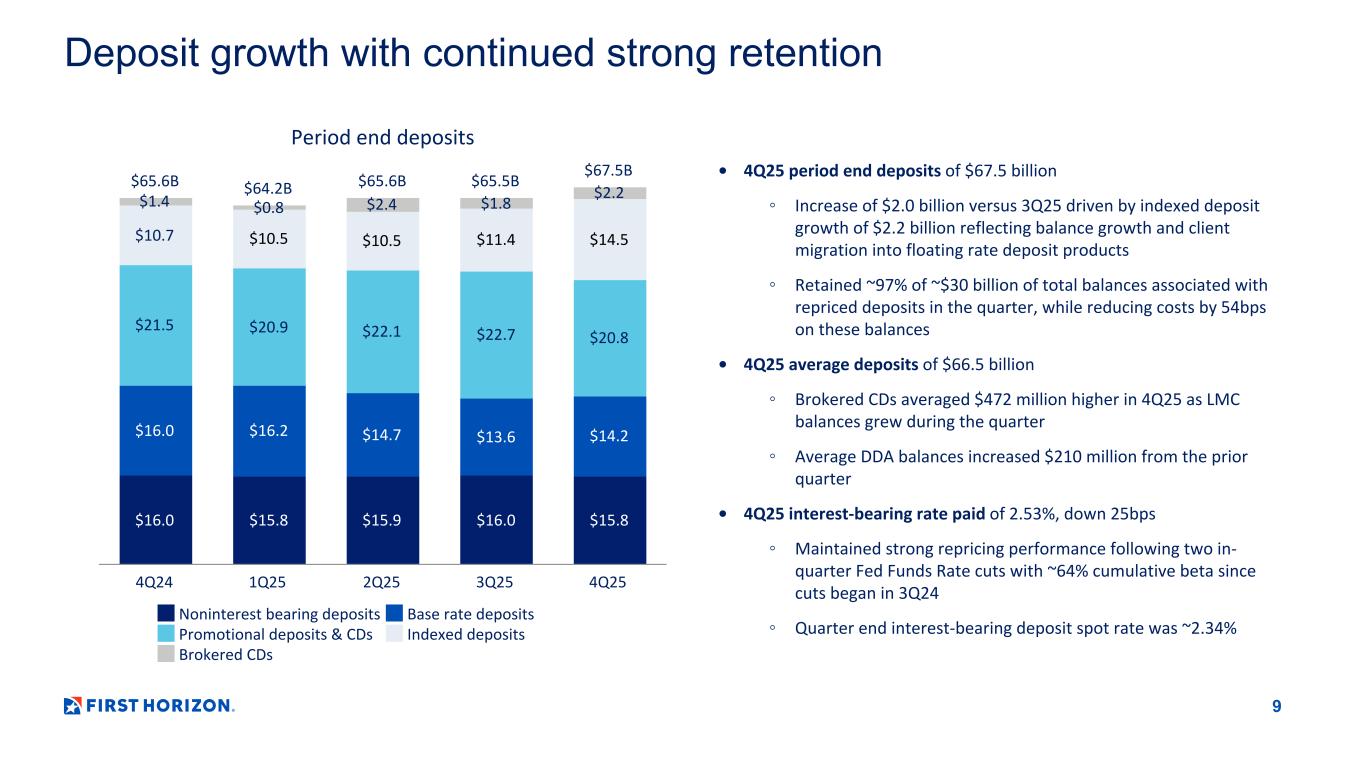
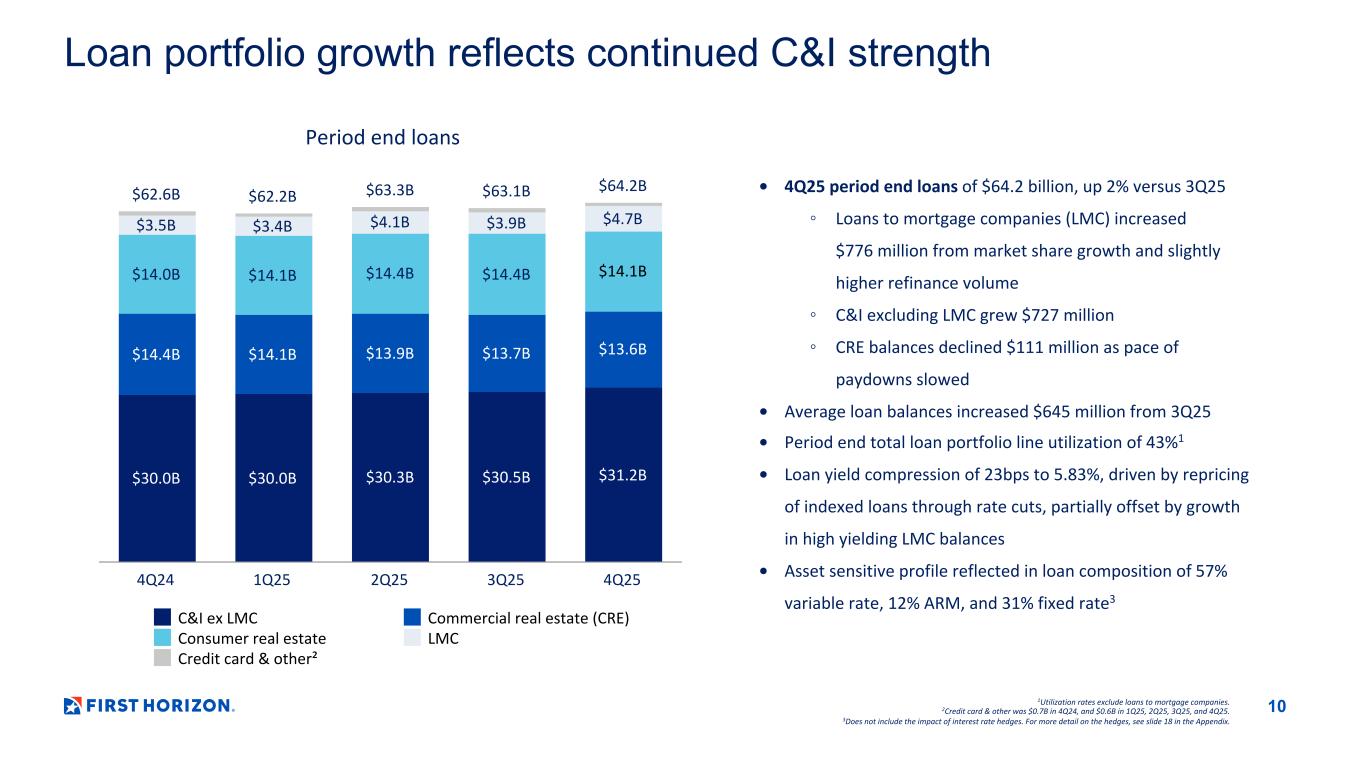
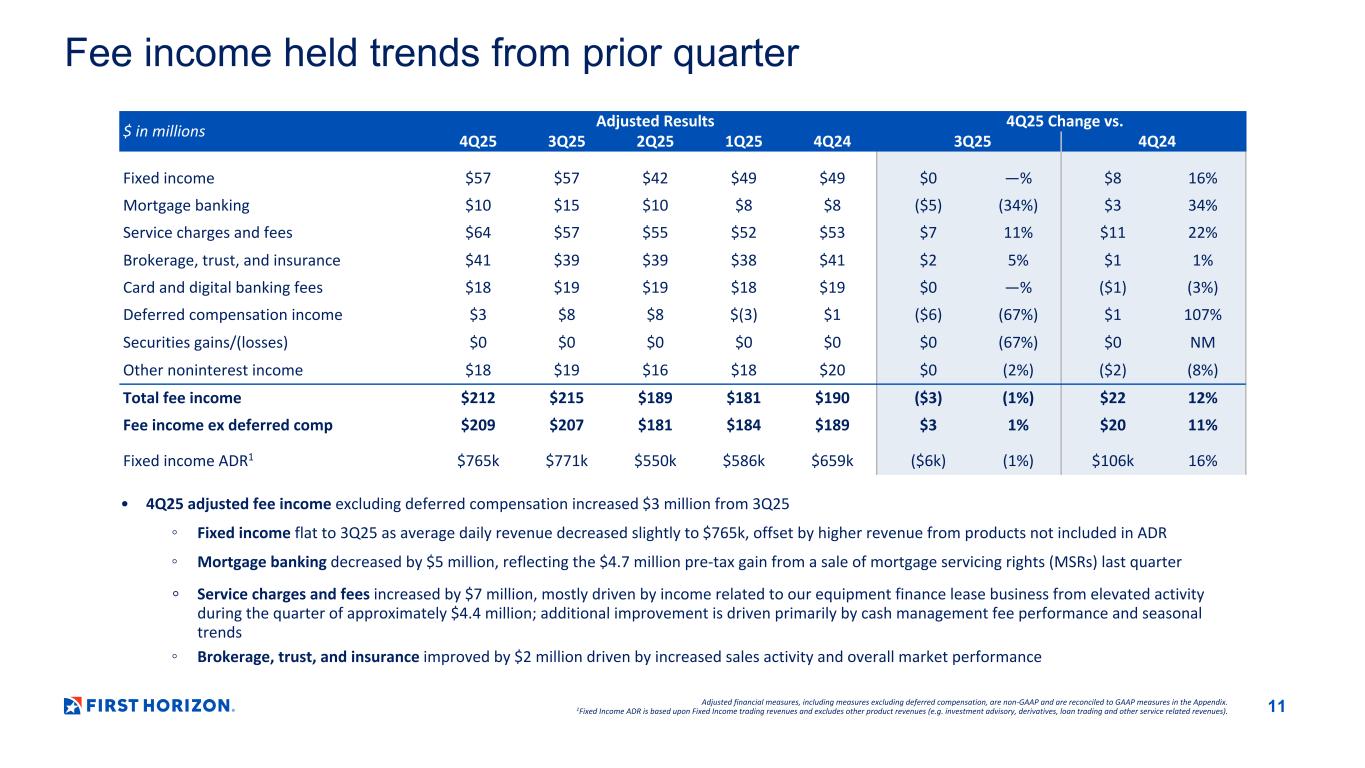
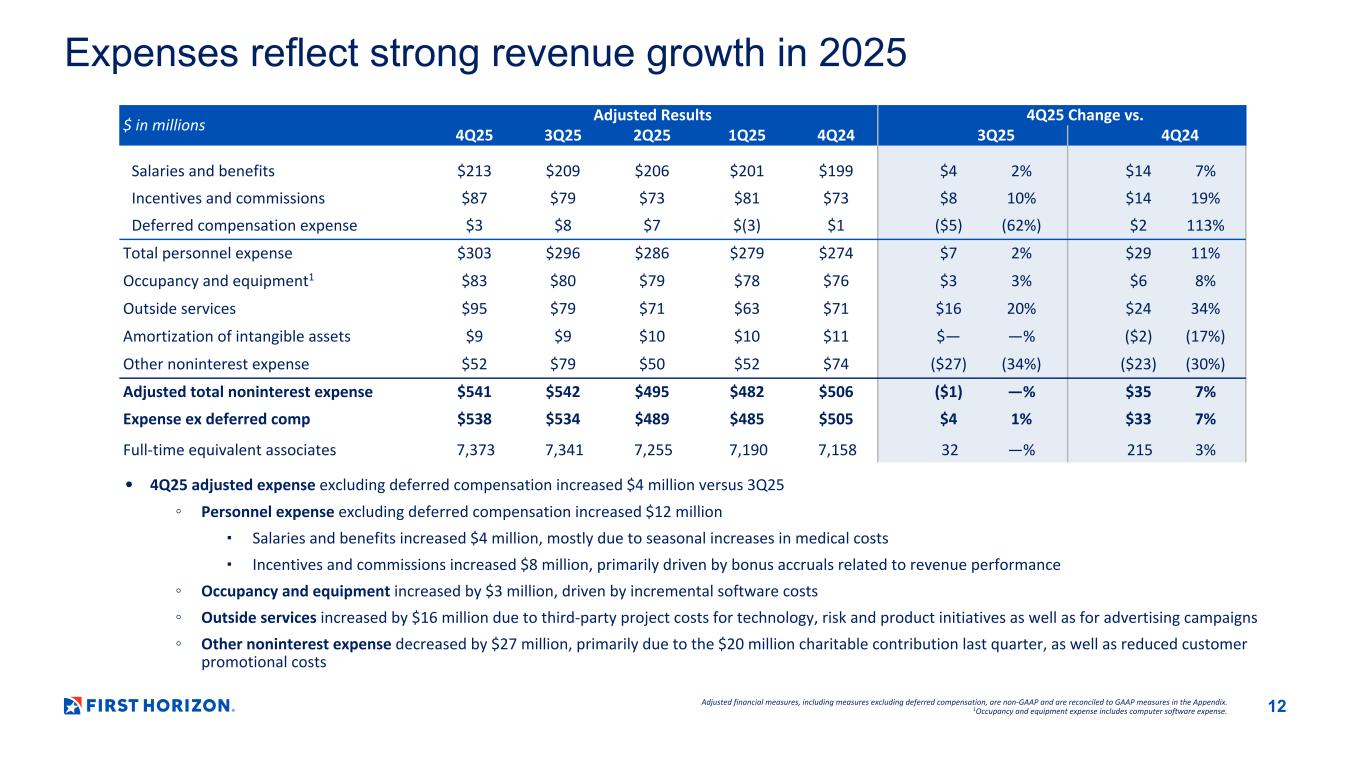
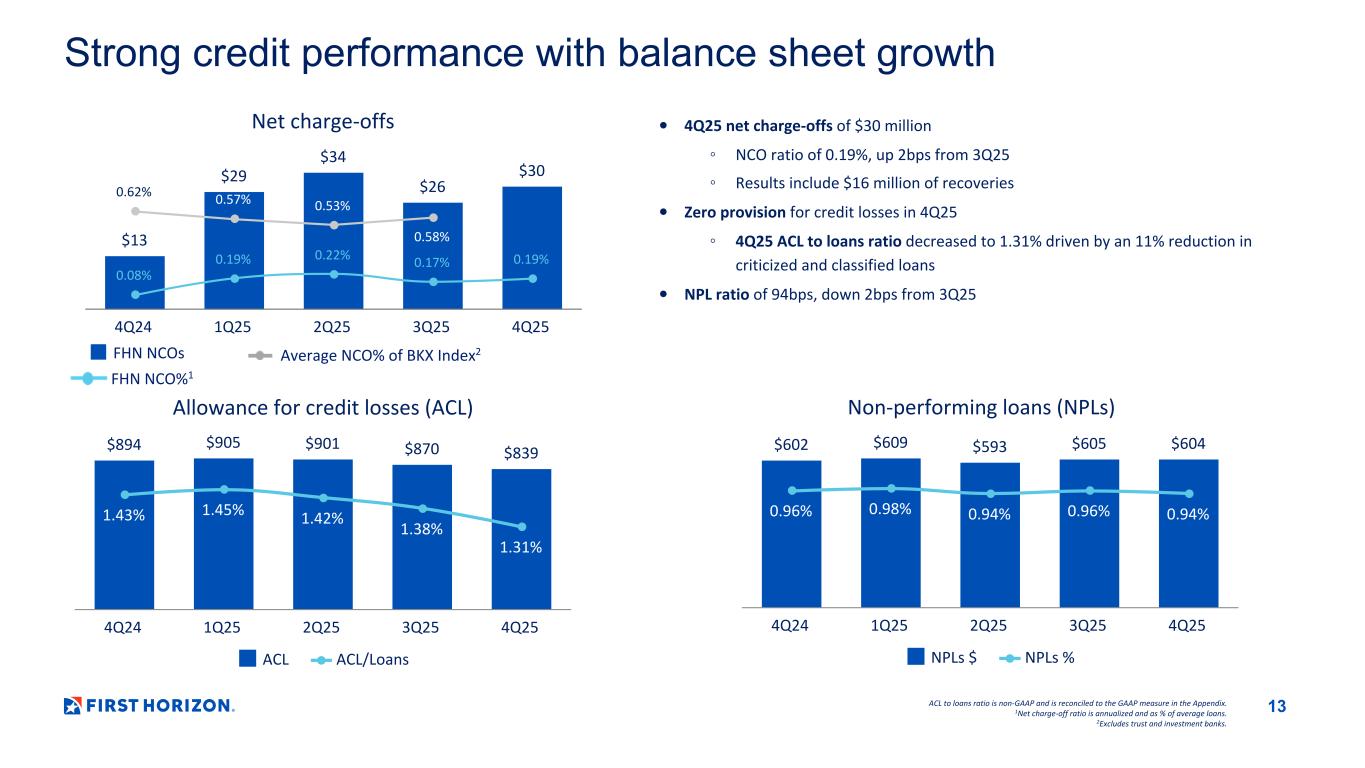
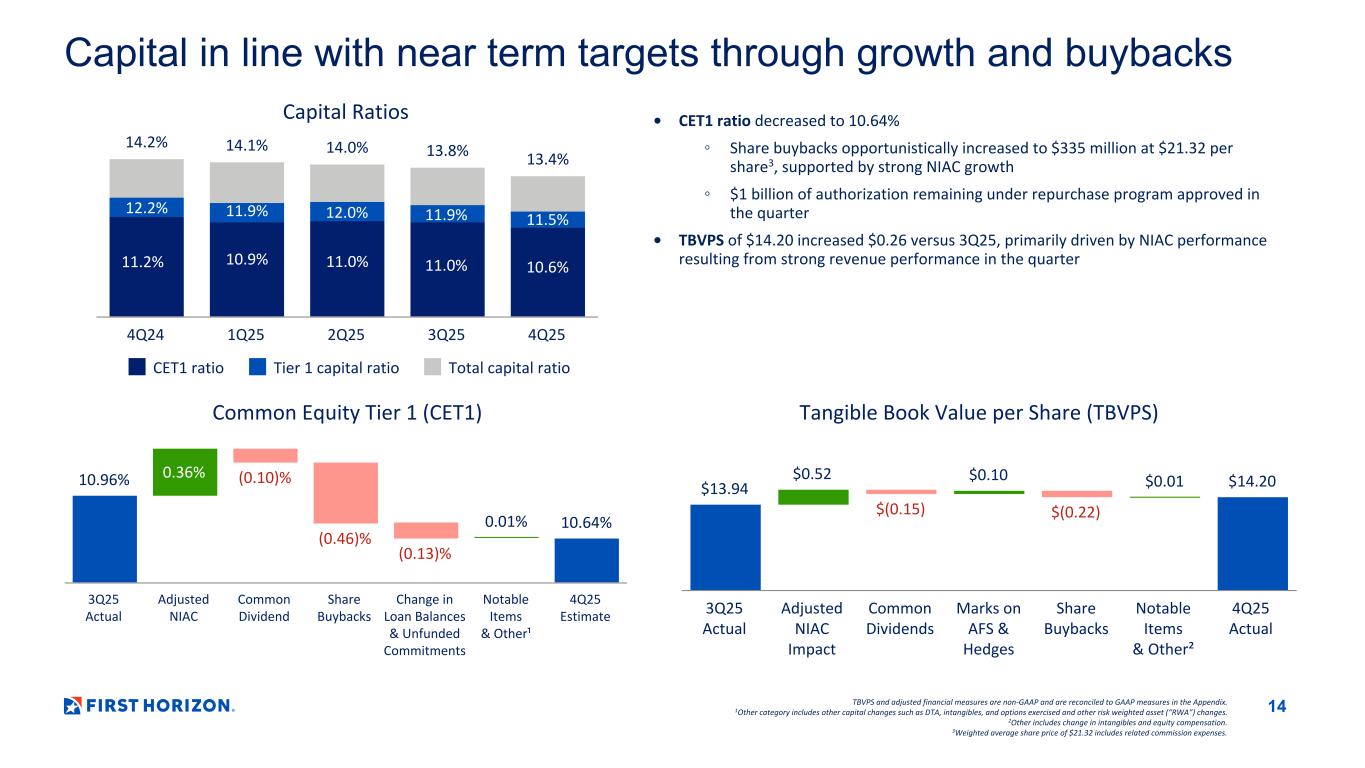
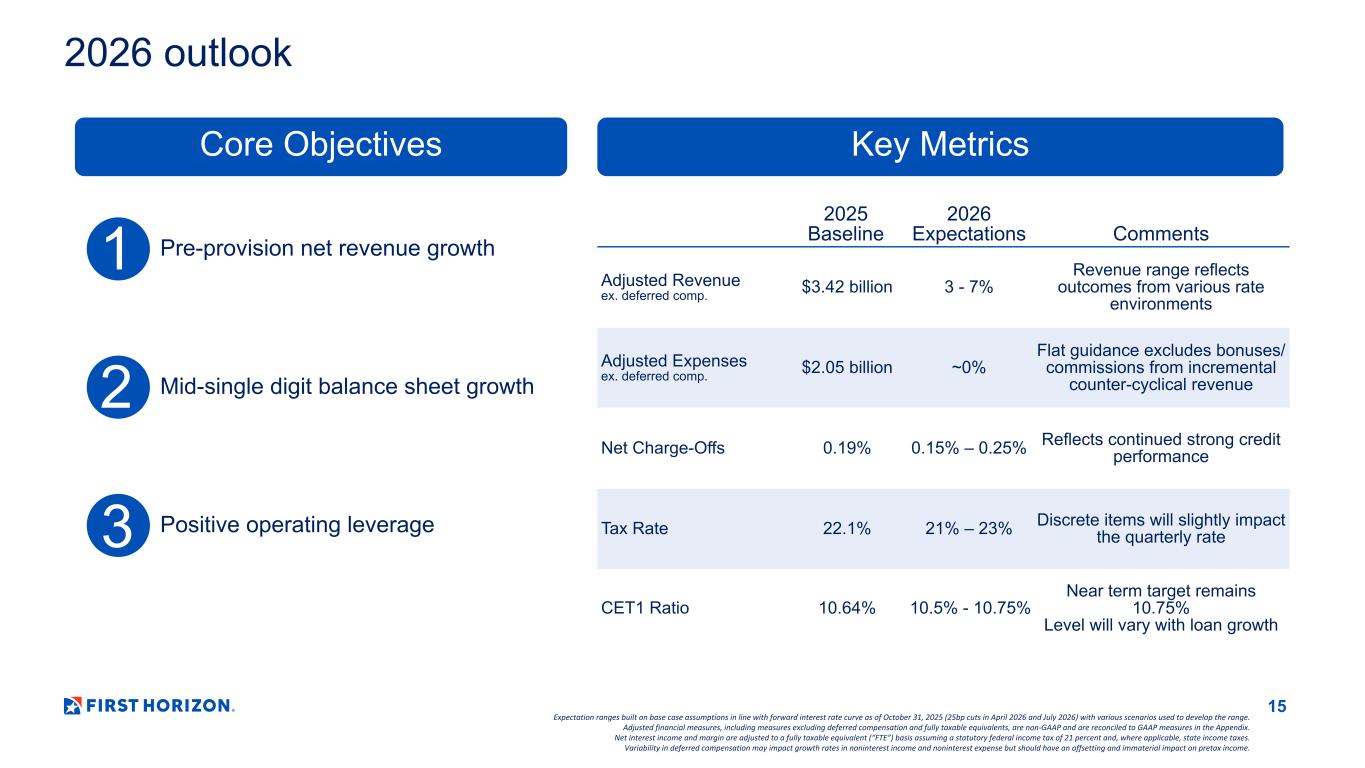
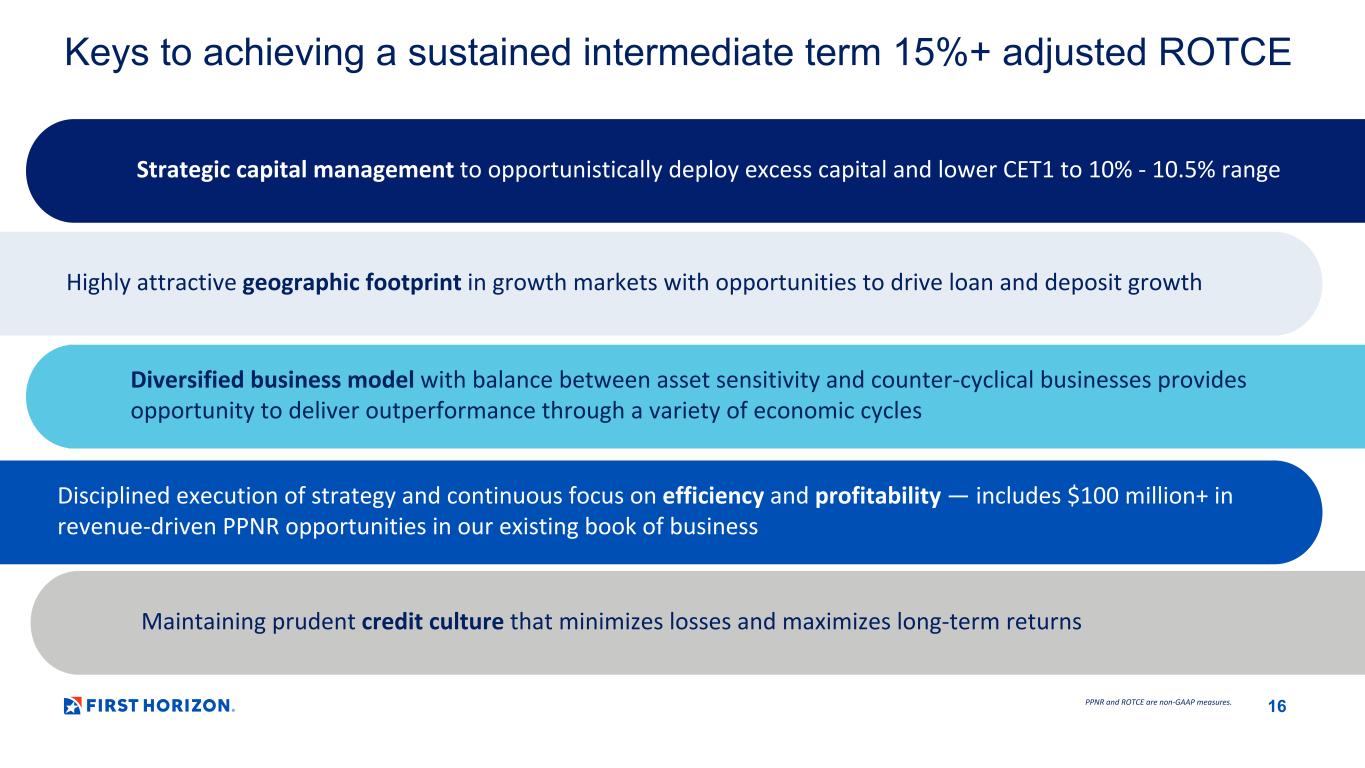
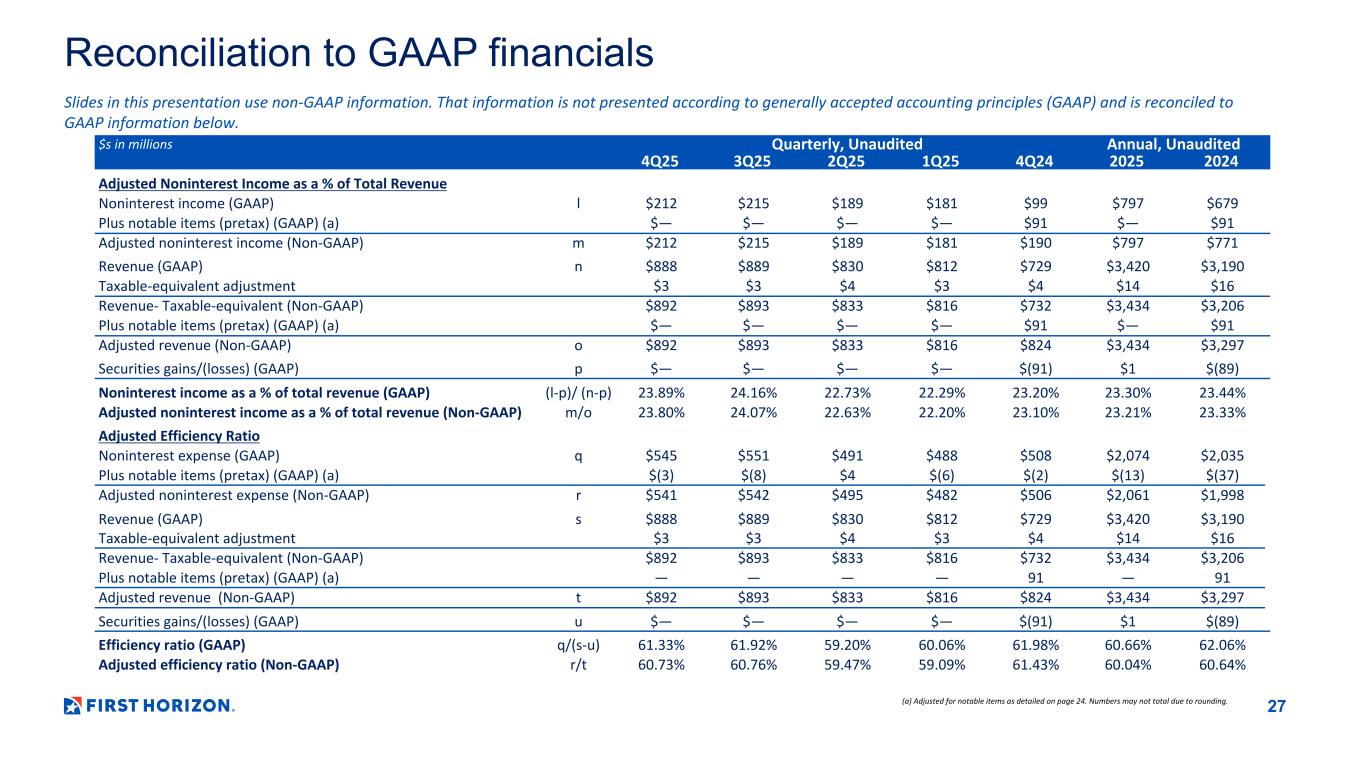
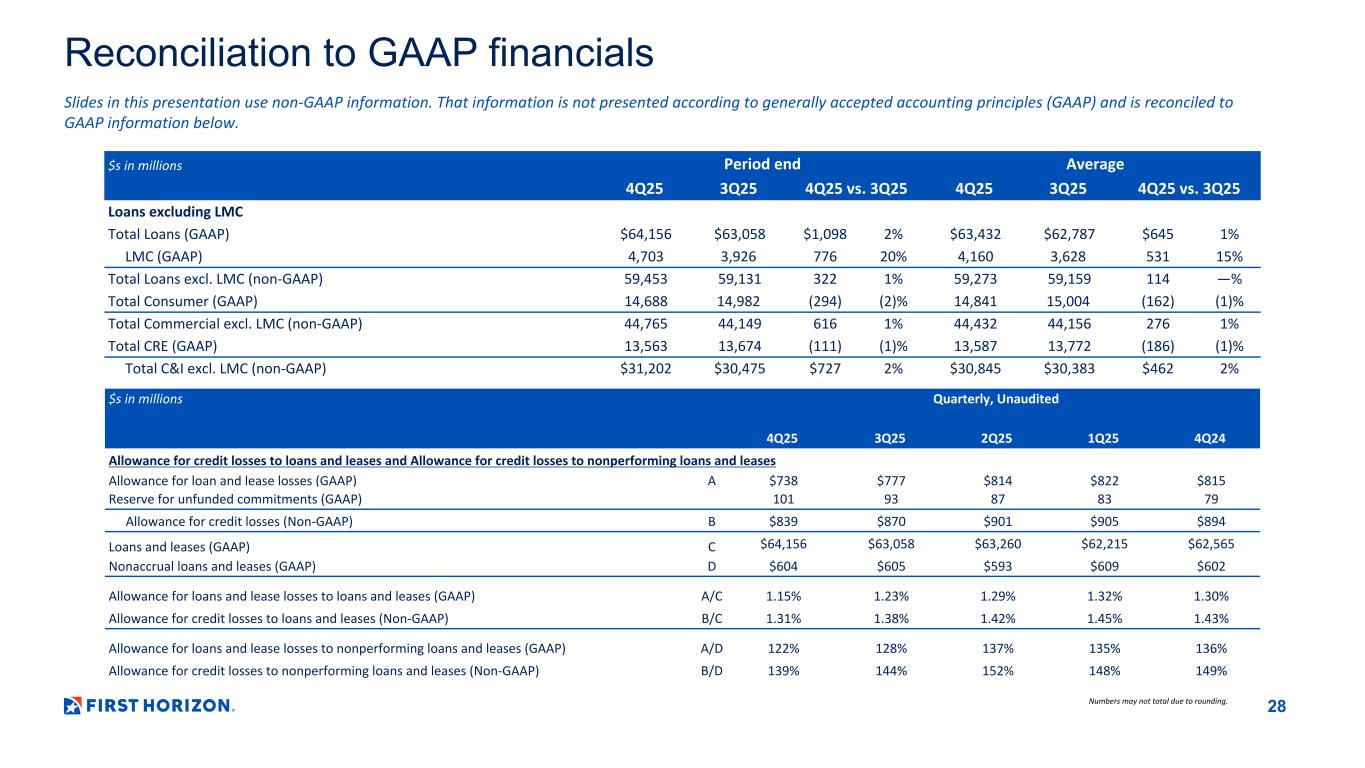
I'll now hand the call over to Hope to walk through the results of the report. ...fair of $0.52, net interest margin of 3.51 and 2% loan growth. Starting on slide 8, we walked through some of the drivers of our approximately $2 million of net interest income growth, as well as our net interest margin performance. Our margin compressed by four basis points, but excluding the impact of the Main Street Lending Program accretion discussed last quarter, NIM expanded by two basis points, even with our slightly asset-sensitive balance sheet. The largest benefit to both NII and margin was deposit pricing, as our average interest-bearing costs declined by 25 basis points. Additionally, strong growth in loans to mortgage companies added to NII. On slide 9, we covered details around our deposit performance in the quarter. Period end balances increased by $2 billion compared to prior quarter. The average rate paid on interest-bearing deposits decreased to 2.53%, coming down from the third quarter average of 2.78%. We have maintained a cumulative deposit data of 64% since rates started to fall in September. Our interest-bearing stock rate ended the quarter at 2.34%. On slide 10, we cover our quarterly loan growth. Period end loans increased $1.1 billion, or 2%, from the prior quarter. Our largest increase came from our loans to mortgage companies, which increased $776 million quarter over quarter. While fourth quarter is not traditionally a high watermark for this business, we saw a pickup in the refinance market, which resulted in approximately one-third of activity from refinances, up from approximately 25% in the recent quarters. We also saw excellent growth across our footprint in the rest of our C&I portfolio, with period end balances increasing by $727 million from prior quarter, as origination volume increased quarter over quarter. Within the Cree portfolio, the pace of paydown slowed as the decline of slight increase to commitments in our CRE portfolio during the quarter, providing momentum entering 2026. Commercial loan spreads remain consistent, generally mid-100s to upper 200 basis points. Turning to slide 11, we detail our fee income performance for the quarter, which increased $3 million from the prior quarter, excluding deferred compensation. The largest increase for fee income comes from our service charges and fee lines, which is largely driven by $4.4 million in income related to elevated activity in our equipment finance lease businesses. On slide 12, we cover adjusted expenses. That's excluding deferred compensation, increased $4 million from prior quarter. Personnel expenses, excluding deferred compensation increased by $12 million from last quarter, driven by $8 million in incentives and commissions, which primarily consisted of annual adjustments to bonuses impact by hitting the high end of our revenue targets for the year. Outside services increased by $16 million, which includes project costs for some technology and product initiatives and increased advertising expenses in the quarter. Our non-interest expense declined primarily related to the foundation contribution discussed last quarter, as well as normal fluctuations in customer promotion costs and marketing campaigns earlier in the year. Turning to credit on slide 13, net charge-offs increased by $4 million to $30 million. Our net charge-off ratio of 19 basis points is in line with our expectation and recent performance. We recorded no provision for credit losses in the fourth quarter, and our ACL to loan ratio declined to 1.31 on broad improvement across our commercial portfolio and payoff of non-pass credits. On slide 14, we ended the quarter with CET1 of 10.64% as buyback activity and strong loan growth, which included high loan-to-mortgage company growth, lowered our period-end CET1 levels. During the quarter, we bought back just under $335 million of common shares, bringing our full-year total to $894 million. We also announced a new repurchase program of $1.2 billion at the end of October, and we currently have just under $1 billion of authorization remaining. On slide 15, we walked through the objectives and metrics within our current 2026 outlook. We once again expect year-over-year PPNR growth with mid-single-digit balance sheet growth and positive operating leverage. Our total revenue expectations range from 3% to 7% growth year-over-year, which accounts for a variety of interest rate and business mix scenarios. As we have mentioned previously, our expense outlook remains slavish, with the exception of incremental incentive expenses associated with higher counter-cyclical revenue. Continue improvements to market conditions for our fixed income, consumer mortgage, and loans to mortgage company lines of businesses could drive higher revenues and associated personnel expenses. We expect to achieve this while still making key investments in our businesses, including technology, personnel additions, and new branches. Our net charge-off expectation of 15 to 25 basis points reflects our continued confidence in our underwriting standards and credit processes. We expect taxes to be between 21 to 23 percent, similar to 2025. Lastly, our near-term CET1 target remains at 10.75, with the level fluctuating approximately between 10.5 and 10.75 with loan growth throughout the year. We will continue to have conversations with our board about potential timing for lowering that target further in line with our intermediate-term expectations of 10% to 10.5%. I'll wrap up as we turn to slide 16. I am extremely pleased with the execution of our teams in the fourth quarter and throughout all of 2025. We once again operate at 15% adjusted Rosti this quarter, and our goal continues to be sustaining and exceeding this level. We are continually managing capital and credit to assure that we maximize returns for shareholders as displayed this quarter with capital deployed into both loan growth and share buybacks. Our teams are focused on execution and delivering on our profitability objectives, including the more than $100 million revenue-driven incremental PPMR that we have discussed in the past. We made early progress on this in 2025 and expect the impact to continue to grow in 2026 and 2027. With that, I will give it back to Brian.
Thank you, Hope. I'm proud of the progress we made in 2025 across many fronts. During the year, we distilled our strategic plan into a five-page framework to provide clarity for all of our associates It's about how we differentiate in the marketplace and create broad, deep, long-lasting client relationships. I believe this alignment will continue to help drive consistent execution across our organization, resulting in exceptional experiences and outcomes for our clients and our shareholders. As we look into 2026, our priorities are clear. Serve our clients well, grow profitable relationships, and deliver on our financial objectives. We will capitalize on growing client confidence about the economy with continued loan growth. We see positive signs for growth in our current pipelines, especially in our commercial lending areas. I'm confident that our diverse business model and robust footprint position us to meet our revenue growth targets through a variety of economic scenarios. As we stated in our 2026 outlook, we also remain focused on expense discipline and efficiency, while also continuing to invest in technology and tools that make our associates more effective and deliver greater value for our customers. We talked in 2025 about our $100 million-plus PPNR improvement opportunity. We made initial progress in 2025 by improving profitability of the balance sheet. We still see $100 million in additional opportunity and expect to make significant progress on that in 2026 and 2027. This profitability will be driven by deepening client relationships, treasury management and wealth management, leveraging our banker expertise to ensure clients have the right products for their needs, ensuring our pricing reflects the value we deliver to clients, and ensuring we maximize the value of our footprint with our talent and distribution. UserEyeson has a lot of momentum going into 2026, and I'm excited to see our associates capitalize on those opportunities ahead. Our team put forth a great deal of effort in 2025. Thank you to our associates for their work this past year, and to our clients and our shareholders for their continued confidence in our company. Lucy, with that, we can now open it up for questions.
Operator
Thank you. To ask a question, please press star followed by one on your telephone keypad now. If you change your mind, please press star followed by two. When preparing to ask your question, please ensure your device is unmuted locally. The first question comes from Casey Hare of Autonomous. Your line is now open. Please go ahead.
Good morning, everyone. I wanted to start on the revenue outlook, the three to seven. That's about 135 million of revenues. I know it's tricky, but if you could just take us through your base case and what are some of the big wild cards to think about so we can, you know, make our own assumptions on tightening up that revenue outlook.
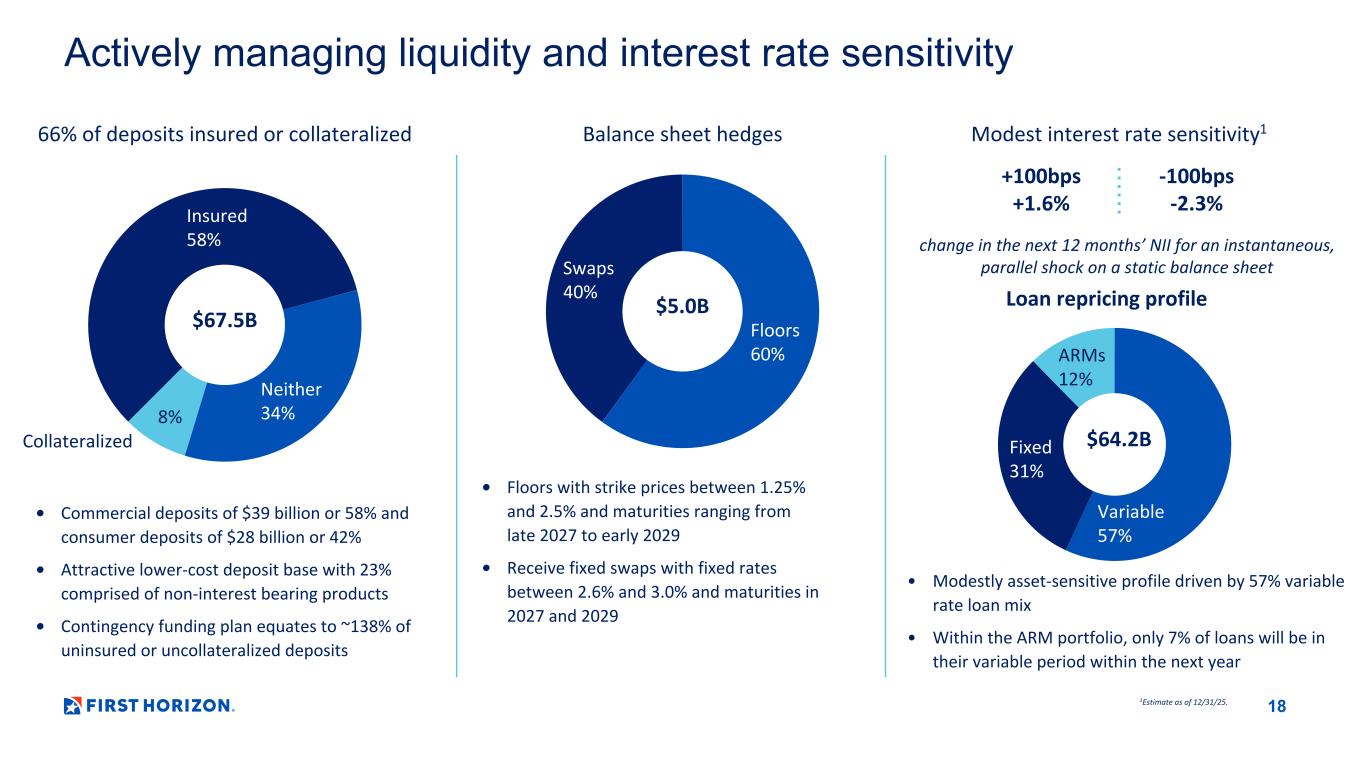
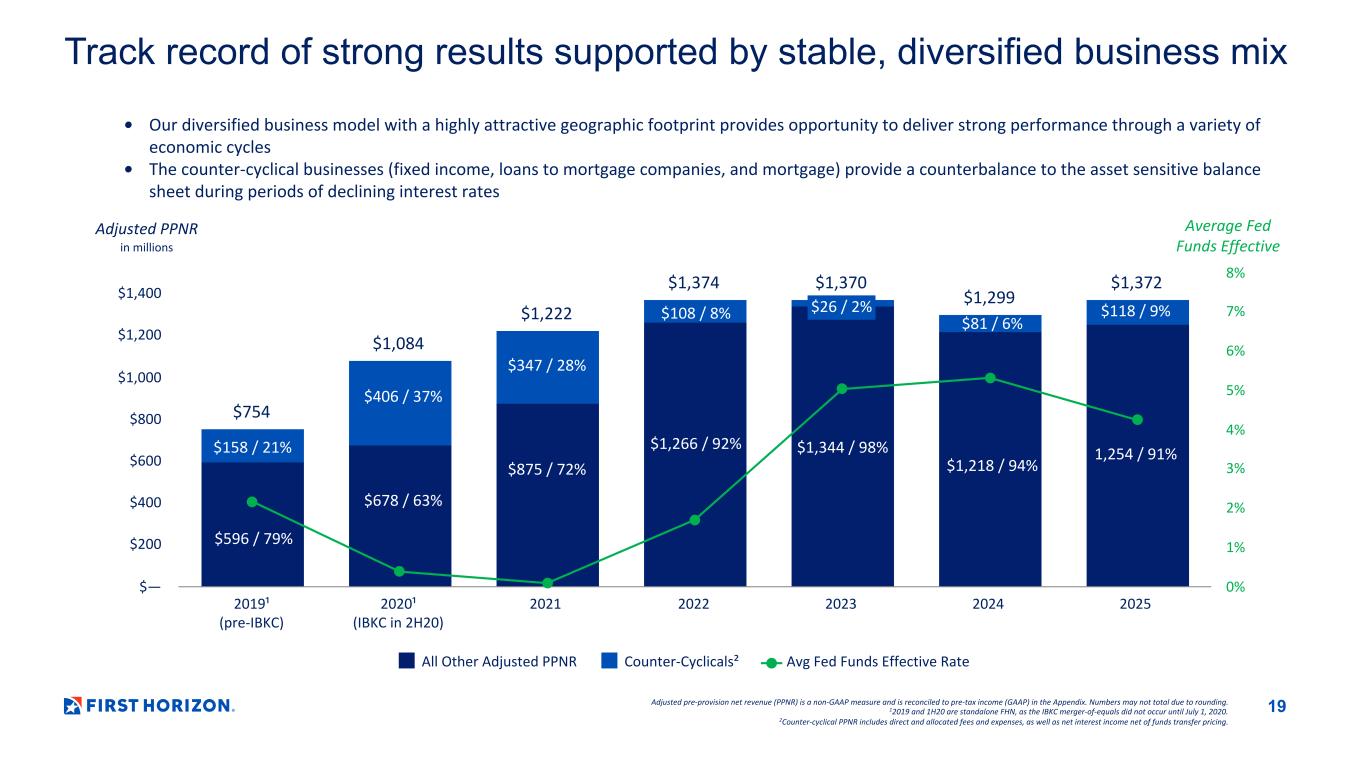
Happy New Year, Casey. Thank you for that question. You know, our base case, kind of middle of the range is the current forward curve. So as you think about looking, you know, at the low and high end range, you know, we've got to think about where rates go, how quickly we might see rate drop versus the current forward curve, and then also loan growth. And so, as we said, we have mid-single-digit loan growth in here. And so, if we were able to exceed that, you'd be at the higher range. And, of course, our counter-cyclicals. You know, the Wall Street Journal just reported this morning that December, you know, home buying was strong. I made a comment in my prepared remarks that we saw refinance pick up for the first time in multiple quarters.
So, as we start to see some of those counter-cyclicals pick up and we hit our loan growth targets or higher, we end up on the higher end of that range very good and then just on the expense front um i know you guys are kind of reiterating your your flat outlook for this year but i guess trying to understand what the you know obviously i don't think that would be sustainable going forward i guess what would what would the expense growth be had you not had these past years of of heavy uh you know tech investment and digital infrastructure investment, like I'm just trying to get a sense of what would be, you know, where does the expense growth normalize to going forward after this flat year in 26?
When Brian and I sit down and talk with our board about where we want to go in coming years, we always start with we want positive PPNR. And we really start with a base case of expenses being in line with inflation. You know, you have wage inflation, you have contract inflation. So we start with that. And then to your point, we did have some things that were.
Operator
Thank you. The next question comes from Ryan Nash of Goldman Sachs. Your line is now open. Please go ahead.
Hey, good morning, everyone. Good morning. Good morning. You know, I hope you mentioned embedded in your revenue growth expectations is mid-single-digit loan growth. Maybe just unpack that and talk about some of the key drivers across the products. How were you thinking about the inflection of commercial real estate? what's baked in for loans to mortgage companies and obviously any other areas of gross in the broader CNI area. Thank you.
I'll take those one at a time, Ryan, and Happy New Year. First, as we look to mortgage warehouse, we are expecting it to pick up. We had, you know, if you look at our trend page, you see it's the highest quarter we've had in five quarters. Seasonally, Q4 pays down, and we didn't see that. And with a pickup and refi, we think that we will, you know, our face case assumes that picks up in a similar consecutive fashion. When we get to the higher side of our guidance, obviously, you're looking at a double-digit mortgage warehouse growth in the lower end of our guidance would be flat or lower than this year. C&I, we have great momentum coming into the year. We talked on our last earnings call about being one of our highest quarters for new originations. Q4 had additional strong originations. So, we think C&I has hit that influence point. We're going to continue to see growth in 2026. Cree started to stabilize this quarter. We've seen good new production, but we do a lot of large construction Cree, so it takes time for that to fund up. We've always had that spring-loaded balance sheet, Ryan, so I do think it'll stay stabilized. How quickly we can grow is how quickly our customers can get their projects running, get the supplies they need, and really start to hit that stride in the Cree market that's been slowed down the last couple years.
Got it. You know, maybe as a follow-up, you know, given the expectation for mid-single-digit loan growth, I'm assuming you're expecting some decent deposit growth. Can you maybe just talk a little bit about deposit growth expectations, what you see as the key drivers, and in a better loan growth environment, do you think you could sustain this 64% data for the remainder of the rate-easing cycle?
Loan growth is always higher in our targets than our – our loan growth is always lower than our deposit growth. So, the target that we give to our businesses is, you know, for that not to be offset and create a higher loan-to-deposit ratio. With that, we have a lot of initiatives that we've done in the past 12 to 18 months, primarily our new treasury management system that – and additional products that we have delivered in the second half of the year that allows us to deepen relationships with existing clients and also go to market with clients that we maybe didn't have everything they needed for their business previously. We've seen great momentum in treasury management in the back half of the year. Also, we've mentioned before, we've hired a new head of consumer. We had, you see our advertising costs were slightly up and our cash payments and other non-interest expense have been up in the second half of the year. We're seeing great momentum with our new-to-bank offers sustaining and deepening relationships in that space. We're opening new branches this year, and I think there's a lot of upside opportunity in our consumer franchise. Your comments about deposit costs, you know, I would say the number one thing that concerns me there outside of competition, as we always talk about, is what happens with the Fed's balance sheet. You know, there's some congressional testimony about shrinking the Fed's balance sheet further, and so I really think it's a macroeconomic question as to what is the liquidity in the system in the coming year that drive deposit prices much more than competition right now where I'm sitting. Brian, I don't know what you'd add to that, but there's a lot of uncertainty right now.
Well, I think you hit the key point. We do have opportunity in treasury management penetration. We have a very strong, stable base there, and we're making very good for our customers to increase that penetration. I think the opportunities across our footprint to continue to expand within the context, We think that, you know, and I think we're well positioned. Thanks for all the color. Thank you.
Operator
The next question comes from John Pancari of Evercore. Your line is now open. Please go ahead.
I wanted to see if, you know, within your revenue guide, if you could possibly help us unpack it across how you think about manager's income trajectory versus the fee side. I mean, on the net interest income side, you know, you grew net interest income about 4% in 2025. Looks like it may be a somewhat slower pace in 26, just maybe given less margin upside. But I want to see if you could maybe help us frame it. Is it low single digit that's reasonable or mid-single for NII? And then as you look at fees, if you just give us a little bit more color on the ADR trends that you're seeing here and how that could play out in the cap market side and how that influences your fee growth expectation.
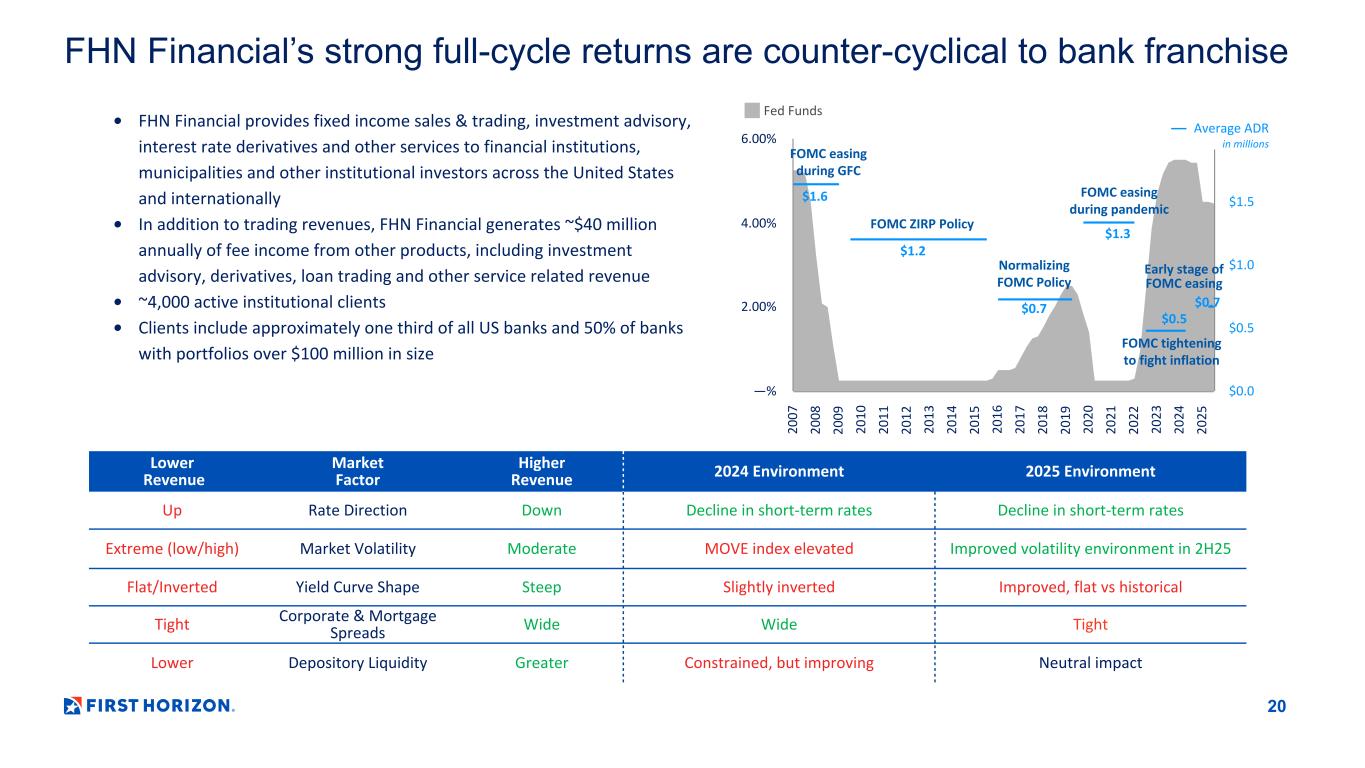
John, thanks for the question. On fee income, obviously the largest variable is, as I mentioned earlier, mortgage refinance where we don't put something on our balance sheet. We do do originations that we sell, so we get that gain on sale back up to what it was two, three years ago when we saw more normalized resale activity. FHN Financial had a very strong second half of the year. If you look at the deck and you look at the four-quarter ADR, we had mentioned that we thought 3Q may be an inflection point, and in the beginning of Q4, we were starting to see that come back down, and it's pretty flat quarter over quarter. So I think if you think about the income, think about the core line items growing consistently with this year, but the upside being both gain on sale for a mortgage in a refinance opportunity as well as FHN financial upside. On the NII, you know, as Brian mentioned earlier, and I did as well, Well, deposits are hard to predict exactly where we're going to land on deposit betas this year. I think that could have a big swing on that. And then the loan growth. We have had really low loan growth in our industry for two or three years now, and there is a pent-up demand out there. So I believe we can get certainty on rates. We can get certainty on the economic environment. We're going to see that pick up for our industry. What I can't handicap right now, John, is that earlier in the first half of the year or the second half of the year, And, you know, average balance matters for NII more than that quarter over quarter. But I feel really strongly that, you know, we are well within that range. You can run a set of scenarios, and we will be within that revenue guide regardless of what happens in the macroeconomic environment this year.
Hey, John, this is Brian. I'll add to Coach's comment. We're very intentional in not breaking apart the revenue projection and the net interesting kind of fee income simply because we have a very well-balanced business model and that we have the counter-cyclical businesses. So we have businesses that will pick up if rates move down significantly. We have businesses that will do very well if rates move up. And so looking at 2026 or 2027 and beyond, you know, we start with the premise of all models are wrong, some are useful. And so we look at it in the context of we feel good about the balance in our business and that if you push down here, this will pop up. But at the end of the day, revenue growth within the range is focused.
Got it. All right. Thanks, Brian. I appreciate that. And then separately, Brian, I guess if we could just go to M&A, just want to see if you can get some of your updated thoughts around potential whole bank M&A, a lot of attention, obviously, to your shift in your comments last quarter. You know, how are you thinking about the decision to potentially step in here and consider an acquisition, A, given the potential that the regulatory window could ultimately close, and does that influence you? and then the backdrop of deals accelerating, but most importantly, what it means for you in terms of if something compelling financially or strategically comes up.
Yeah. Thanks, John. One, I don't worry about the regulatory window first and foremost. I think you're likely to see the regulatory window open. Your regulatory infrastructure is in place now, and they have multi-year appointments. When it comes to thinking about our awareness, I think we have the ability to integrate now, but our priority is on the things that we've described, penetrating our customer base, delivering on this strategic document that we have laid out for our organization, driving the incremental $100 million of potential PPNR growth. And in that context, if we have the opportunity to be small, we would 90 days ago roughly, that's not a priority.
Operator
The next question comes from Bernard von Gizicchi from Deutsche Bank. Your line is now open. Please go ahead.
So you have a 15% plus sustainable ROTC target over the near term. You hit the 15% mark the past two quarters. Are we at that sustainable 15% now and moving to the plus part of that, or is there a time frame like the end of the year you feel like you can declare you hit the 15% in a sustainable manner?
Yeah, I would add that, you know, the accounting around are two, but 25 in terms of – and so I think we are at a sustainable level. It may fluctuate up a little bit or down a little bit, but at the end of the day, I think what we've delivered and improved profitability is sustainable. And as we have and manage our capital levels in line with peers is an opportunity.
Thank you for that. Maybe just on credit, so I know in the release, you noted the 11% sequential reduction in criticized and classified during the quarter, you know, the resulting zero provision and the $30 million reserve release. You know, how are you thinking about your reserve build from here, just given expectations on the path of criticized and classified, the expected 15 to 25 basis points of net charge-offs, as well as just expectations for mid-single-digit long growth for the year?
Yeah. Hey, good morning, Bernard. This is Tom. I'm happy to address that question for you. Overall, we've had a very strong momentum throughout all of 2025 in terms of working through our non-pass work. As you noted, in the fourth quarter alone, we had over $700 million of non-pass resolutions, and in there is a good mix of both payoffs and upgrades. On the whole year, that number added up to $2.2 billion. And so with the strong momentum we've had in those non-pass resolutions, that's why we have been able to have the other reserve releases we've had in the last couple of quarters. In terms of looking ahead, you know, a lot of other factors will impact what ultimately our reserves are, including broader economic outlook, the amount of loan growth we have, and also the mix of the businesses. You know, what I'm happy about is the momentum that we have in terms of how we've continued to be able to work down our non-passbook while maintaining very strong net charge-off performance in terms of forward outlook on reserves. You know, like I said, there's a number of factors that could change that, so it's harder to say.
Bernard, this is Brian. I'll add to Tom. In a CECL model, it implies a tremendous amount more art involved in it and the assumptions that are made about the economic scenarios and from it. And you look at our reserve levels today, we have something in the nature of six to seven years of reserves set aside at the current run rate. So we believe that we're conservatively positioned. We try to take a balanced view of the economy and we don't look at it as all up or all down. But I think given the improvement that we've seen in C&C and the trends in the balance sheet or the reserve levels that we have and that our credit trends is co-highlighted in our outlook for 2026 are likely to be in this same area that we've seen over the last year or so.
Great. Thanks for the color and thanks for taking my questions.
Operator
This question is from Jared Shaw of Barclays Capital. Your line is now open. Please go ahead.
Hey, good morning. Maybe circling back on the capital discussion, you know, when we look at that billion dollars or so of additional buyback authorization, what's the appetite for utilizing that over the course of 26 with the backdrop of growth? Should we expect that you stay active, you know, sort of at similar levels and see the capital ratios just continue to move lower?
Yeah, Jared, this is a topic we work with our board on. So I don't want to get in front of that, but they have given us a $100,000, and we, as we've said in the past, we need to talk about, we look at then having set off 10% to 10.5%, and while we're bringing those capital, it's a long way of saying, one, we want to deploy our capital. If we don't have those opportunities, we've highlighted a couple of different ways. We've returned $1.2 billion in capital in 2025, and we'll look for opportunities to be opportunistic, but we will participate in buybacks.
Okay, thanks. And then maybe just shifting over to the loan growth side, you know, C&I loans, as you pointed out, had a really good quarter, but utilization rates have been pretty much flat over the last year. But how are you, you know, from your conversations with customers, what's sort of the appetite for bringing that utilization rate up over time, and is there any expectation in your guidance that utilization rates move higher, or could that just be, you know, potential upside if you see increased optimism from existing lines?
Yeah, I'll start, and then Tom can help me. I think customers are generally still pretty optimistic. We see it in our pipeline. The momentum in the economy appears to be very, very good today. I think, you know, as in certain people will take stock, but I think people are generally biased for taking the C&A. I think the other dynamic and loan growth opportunities, you know, in 24 and 25, we did a fair amount of work rebalancing. I mentioned improving the mix and profitability of the balance sheet, and we got out of a number of things of that nature.
So I think our variable, you know, the drivers behind the event, negative reasons, are optimistic and also go up in our periods of uncertainty. And so that's why I'm really more focused on the drivers. And then also add those just overall, you know, what we're doing.
Operator
The next question comes from David Chiaverini of Jefferies. Your line is now open. Please go ahead.
Hi. Thanks for taking the question. I wanted to ask about the then interest margin outlook. Last quarter, you had guided to the high 330s, low 340s. Clearly, you outperformed that. It sounds like pricing trends are good on both sides of the balance sheet. How would you frame the outlook from here?
I would say our outlook is still similar in that 340 range. There's a lot of timing and art on getting it exactly right in a quarter or in an outlook. Specifically, this quarter, we had in my preparation, we were able to work those down. I think we exceeded our expectations when we were on this call last quarter. So I don't see 350 as the go forward. I really think we're in the mid-340s, kind of, you know, some variation quarter.
Thanks for that. And then on the $100 million of incremental PPNR, you've been talking about that for a few quarters now. I'm curious as to how much of that has been achieved thus far, and then perhaps the split between 2026 and 2027 of achieving that $100 million.
Yeah, we have been talking about it since roughly the middle of the year, and we talked about it in the context of $100 million plus. And we've said the last couple of quarters that we continue to make progress. And we look at the opportunities across the business. It is creation of Treasury and Wealth that I mentioned earlier in the call, ensuring that we introduce fraud. It will build on 27, so if you look at it mathematically, there's going to be more in 27 than there will be in 26. But we think we've made significant progress, and things like that, see some in 2027. I would tell you, as it relates to 2026, we have it bill bedded in that outlook.
I'll add to what Brian said, and, you know, repeat, you know, our goal is sustainable momentum. And you're going to see that build quarter after quarter. You're not all going to suddenly see a spike. And so, as you continue to see our earnings momentum, you continue to see our revenue growth really in line or outpacing our loan growth, you can attribute that to continuing to deepening these relationships. But it will build quarter after quarter, and as Brian said, 27 will build on 26.
Operator
The next question comes from Peter Winter of DAA Davidson. The line is now open. Please go ahead.
Thanks. Good morning. The outlook for expenses is, you know, flattish for 26, and it does imply expenses will be down quite a bit from the fourth quarter level. Just what are some of the levers for lower expenses versus for a Q? And what do you think is a good starting point for the first quarter expense?
We have elevating less commissions quarter over quarter. That is, you know, another strong quarter. But also at year ends, there's, you know, a series of true ups that every company does. And so I would look at that run rate and say, what is it consistently going to be in Q1? Marketing and advertising is seasonal, and so it does tend to be slightly down in Q1 and then higher in Q3 and Q4 that completed in the back half of this year, and that is part of what we're using now that that run rate is starting to come back in line to reinvest in branches and hiring.
Got it. And then if I can ask, I realize it's still early, but are you starting to see any disruption in your markets from the recent M&A deals, Any opportunities to hire bankers or bring in new customers? Are those conversations starting?
It is. I can tell. But we have seen opportunities, too. And so we do believe that we need to continue to bring talented bankers, and it will continue to be safe.
Operator
The next question comes from Michael Rose of Raymond James. Your line is now open. Please go ahead.
Hey, good morning, guys. Thanks for taking my questions. Just two quick ones for you. Just talk to me about the commercial real estate expectations, you know, obviously down Q on Q, down year over year. You've got to have, in theory, a couple more rate cuts, you know, pay down activity, you know, probably still pretty healthy. Do you expect that business to inflect this year? And is that an area of potential growth as we move later into the year? or does the headwinds from payoffs, paydowns from lower rates just kind of persist through the year?
Yeah, hey, good morning, Michael. This is Tom Hong here. I think we can reasonably expect to see an inflection in our Cree business this year. As Paul alluded to, what we do in Cree does skew a lot towards construction, and hence we have more of a spring-loaded balance sheet there. Given the lower amount of construction in the last couple of years, That's why we have seen a decline in balances in that business. However, that has started to pick up. You know, I mentioned pipeline momentum in the C&I business. I should also mention there's good pipeline activity in our Cree business as well. If I look at our Cree pipeline compared to even last quarter, it's up pretty meaningfully. And you mentioned, especially with the rate decreases that have been happening and there's expectations for further rate cuts, that really affects construction starts. And with more construction starts, that's why we're starting to see a very healthy build in our Cree pipeline. The final thing I'll point to here is in our opening remarks, one of the things we did mention as well is this quarter, for the first time in about two years, we had a net increase in our total Cree commitments. So I think that's a good early indicator of where we expect free balances to go.
Very helpful. Appreciate the color. And then maybe just one last one for me. I know you guys have a small credit card book. There's obviously been some interest rate cap discussion out there. Just wanted to see if that might have any impact for you guys. Again, I know it's small.
Yeah, it is a small book. And if you applied the cap across our outstanding today, it'd be, you know, roughly a million dollars.
Great. Thanks for taking my questions.
Operator
The next question comes from John Afstrom of RBC. Your line is now open. Please go ahead.
Hey, thanks. Good morning. Most of my questions have been asked and answered, but just hope a follow-up on Peter's question on the first quarter. anything else you would flag in the first quarter in terms of the balance sheet and P&L just so we can set up the year properly, the slope of the year?
John, that's a really general, large question. I think we've hit the highlights. You know, I'm really proud of where Q4 ended up, and it gives us tremendous momentum and excitement with our bankers and our clients going into Q1. I think, you know, when you look at mortgage warehouse especially, this tends to be a quarter where we always see our loans decline, and then we kind of dig out of it in January, February, and then March starts to stabilize in that business. We've continued to see strong momentum there in January. I do think that will be an upside for us. We won't have the normal quarter over quarter volatility we have. Fee income is really too hard on ADR to say where the quarter's going to come in, as well as refinance. As you know, rates may be heading down, and that could pick up. But, John, I think we expect another strong quarter to look similar to this one across the board. On the expense side, you know, we are adding bankers. So, you can see in the deck, we've added over 100 FTEs since mid-year. Most of that is in client-facing, client-supporting technology positions that enhance to enhance the franchise and our ability to deliver revenue growth. I think, as I've said before, marketing and advertising really fluctuates quarter to quarter. Q1, it comes down and then builds back up. If you look at our last two years of Q4, Q1 expenses, John, pulling out that one-time commission, I think you're going to see it look very similar in normal seasonality.
Okay. Very helpful. Mortgage Company was another follow-up I had, so thank you on that. And then, you know, Thomas, Hope, Brian, I don't know, just one of the other questions is on the provision, and I guess we kind of danced around it before, but you've had two really good quarters. You're talking about positive trends in credit and mid-single-digit growth. But how do you want us to think about the provision from here, given the strong numbers over the last couple of quarters?
Yeah. I would start with, I think, the most important measure of our overall credit performance is really in our net charge-off numbers, and I'm proud of how consistently strong we've been in that. Provision has a little more noise in it just because of the number of factors that go into it. Most notably, as we're calculating our reserves, obviously, economic outlook as far as – and loan growth can go into that number as well. So, if provision is higher in future quarters than we've had in the last two quarters, you know, that can certainly actually very much be a positive, as it can be driven by the amount of loan growth that we're expecting and the momentum that we're seeing. And so just given kind of the number of factors, like going with the provision number, I think overall I'm personally more focused on net charge off as the best reflection of our credit quality.
Don, I made this comment last quarter, and I'll reiterate it to follow up with Tom. I do believe with all the facts we know today, we're done in that building phase. We spent two-plus years constantly increasing our provision, increasing our coverage, not knowing what was going to happen, whether it was the Cree wave. There was just so many uncertainties. There's just as many uncertainties today, but I don't think we'll have to build. I think we're at the right reserve level. So you can really think about it more normalized as to would we have a release quarter, but it should trend with loan growth, which it has not been the last two years.
Yep. That's what I'm looking for. Thank you very much. I appreciate it.
Operator
Thank you. The next question comes from Chris McGrady from KBW. Your line is now open. Please go ahead.
This is for Chris McGrady.
I know in your term you said you want to stay close to the 10.75 CT1 and you mentioned earlier on Jared's question that you believe longer term you can operate your balance sheet the 10 to 10.5 CC1 range. But I guess what do you and the board need to see maybe from a market or regulatory, you know, perspective to get comfortable dropping down to that range?
Yeah, two levers. And the first is most important, and that is just sort of the economic data play out. You know, if you were sitting here in the spring of 2025, everybody had concerns about how we've now seen nine months of evidence. and through a number of different means, it's had very little or minimal negative impact at this point. And so as we look at the economy, we get more and more comfortable with the ability to bring those levels down. The second is there is a regulatory backdrop around capital and excess capital. And clearly, we pay attention to, you've heard some discussion and calls earlier. So the combination of those things, I think, over time, gives us as a board more and more confidence that we can manage our capital levels down. Our approach has been to take it in fairly small steps, take it from 11 to 10, 7, 5, and then we can talk about 10 1⁄2, and then we can talk about 10 1⁄4. And so I think it's an evolving conversation. We'll do it in a measured and thoughtful way, but it's principally the economic drivers that we're doing.
Great. Thank you. And then just another follow-up on the C&I loan growth, and sorry if I missed this earlier. So outside of the mortgage warehouse growth, and I know there was another 700 million of C&I growth excluding the mortgage warehouse. Can you just talk about where that source of growth came from and going forward, how we should think about C&I growth and where it's coming from outside of Moorage Warehouse.
Yeah, happy to address that one. CNI was obviously the largest number, but outside of that, across our CNI platform, I think what I'm very encouraged by is it came from actually a very diverse mix across all of our businesses. You know, our regional footprint had very strong productions across all of our regions. In our specialty lines, I guess I'll single out equipment finances as it was one business that had outside growth relative to some of the other businesses, but I think the most important takeaway here is it was pretty broad-based, and we saw it across most of our businesses and regions.
Operator
Next question comes from Christopher Maranak of Janey Montgomery Scott. Your line is now open. Please go ahead.
Hey, thanks. I wanted to follow up on the regulatory disclosures last quarter on the NDFI loans. I think about 60% was related to mortgage warehouse, and obviously 40% is the rest. And I'm curious if the mortgage warehouse hope grows and gets to the upper end of the growth range this year, does that mean that the lower percentage on other NDFI loans would occur, or would you still be seeing growth in some of those other business and other lines outside of mortgage?
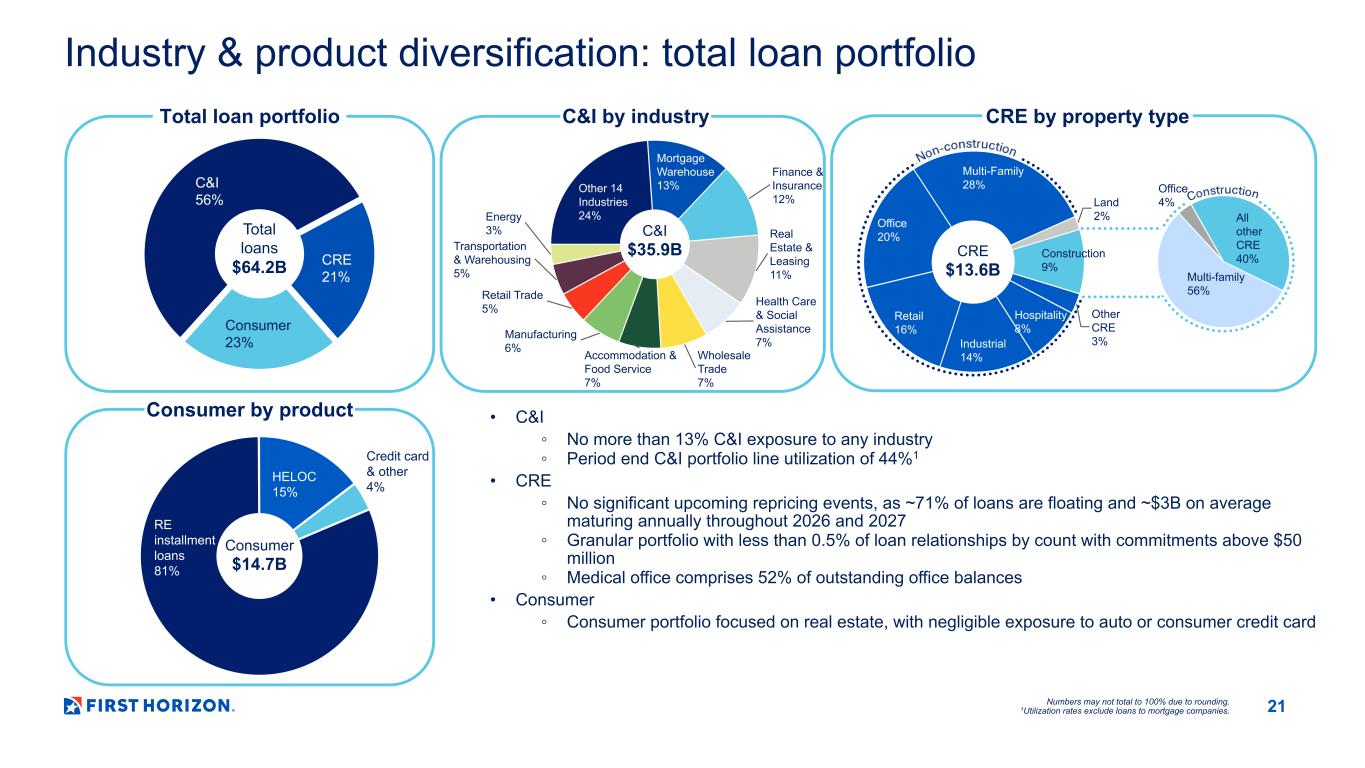
Sure. I'm happy to address that. But I'll break that into a few parts. First off with the growth that we've had in Mortgage Warehouse, it actually accounts for a larger percentage. It's more closer to two-thirds of our NDFI exposure is in Mortgage Warehouse. And from a safety and soundness perspective, I remain very, very confident in the way we have expertly managed that business for a lot of years now. Most notably, in that business, we take physical possession of the notes, so you can imagine the amount of paper coming in and out of our mortgage warehouse group each and every day. In terms of other NDFI, given the noise that's been in the market, you know, we certainly continue to look at that very closely, but I would point to, once again, the years of experience we have in that sector, consistently strong performance, and I think there's some differentiation for us as well in terms of, you know, we have a full-time team of field examiners at seven full-time staff with nearly 20 years of average experience and through that team who are on the road probably 50 weeks a year we do our own field examinations of generally one to three per customer every year we do supplement that with some third parties as well and and in addition to that you know once again given kind of a recent noise we have also completed a recently a comprehensive review of the non-mortgage warehouse NBFI book. We segmented all of that into seven different segments, which have varying different risk profiles, and we've done deep dive analysis into each of those segments with unique scorecards we developed based on the unique risk of each sector. So we continue to look at it very closely, you know, and we continue to originate in those segments as well. You know, we do it in a prudent manner, as we always have, and I think the results have been pretty good.
Following on Tom's comments about mortgage warehouse, I really do want to reiterate what he said. I said it's that November with Tammy Lacoste, you're the head of that business at a conference. We do mortgage warehouse, and it looks exactly like a mortgage loan. We pick the closing attorney. We take physical ownership of the actual loan document. It sits in the same vault as the mortgages that are on our balance sheet. So, for us, when we do NDFI, we have that underlying collateral with us, and we get to sit at the table with a lawyer that we choose at the closing. So, there always can be fraud, but we do do it differently than some of our other peers. I want to point to that when you think about NDFI exposure. For us, if we had an issue with a borrower, we have the notes. We can sell them into the secondary market and get our money back, which is not traditionally how the NDFI is thought about.
To your mechanical part of your question, if the NDFI number goes up, then it's likely to be driven by faster growth in the mortgage warehouse lending business than any of the other NDFI lending business.
Brian, Tom, and Hope, thank you for that. That's all excellent color. And I know the data is now a quarter stale, but it seemed that you had no losses in that business and that the problems in terms of just non-accruals were very small. So I suspect that's still the case today.
Yeah, that's absolutely the case in our mortgage warehouse book. I mean, I think to be expected, in our non-mortgage warehouse NDSI book, you know, there are slightly higher levels of classified assets in NBLs, and there's some charge-off in that business that I wouldn't call any of it a big outlier relative to our overall book.
Great. Thank you again for the detail here. Thanks, Chris.
Operator
The next question comes from Janet Lee of TD Cohen. Your line is now open. Please go ahead.
Good morning. Just to clarify on your expense guidance, with a flattish expense guidance, does that still hold if you achieve the higher end of your revenue guide of 3% to 7%? So if you achieve 7%, is it still flat?
Janet, yes, it does. What I'll say is if we achieve the higher end of the range with more counter-cyclical commission businesses than we had this year, that's what brings it up above the 0%.
Got it. Thank you. And just a quick follow-up. If I look at your fourth quarter loan growth results, period at 7% annualized, looks like a lot of the narrative around CNI, potential mortgage warehouse, and CRE inflection, those all sound positive. and it feels like there's a level of conservatism baked into your net single-digit loan growth. Is this a fair assessment or am I missing anything?
We are traditionally a very disciplined lender. So if you look back at how First Horizon has lensed for the last five or 10 years, we tend to be pure average-ish. And so when we think about what we think the outlook is for the market, we're not trying to overperform. We want to make sure that we get great clients that we can work with, that they have the right underwriting standards, They're going, you know, the way we keep our net charge off so low through a cycle is through the disciplined lending. And so, absolutely, we could do more. Brian's great quote that he always uses is, it's easy to lend money, it's harder to get it back. And so, I think, you know, as I sit here today, I don't see an economy that's going to be above mid-single-digit loan growth unless there's some stimulus put in the system.
There's some mixed things going on in the loan growth percentages. We're not likely to grow our consumer mortgage portfolio at a very – we just expect that most of what we will originate goes into the secondary market. But to your point, we feel very, very good about the businesses that you enumerated, and we think we have great opportunities to grow there.
Operator
The next question comes from Anthony Ellion of JPMorgan. Your line is now open. Please go ahead.
Hi, everyone. On fixed income, I'm curious why ADR and fixed income revenue didn't grow in 4Q. It seems like the tailwinds were all there, including a lower rate outlook, volatility was moderate, and the yield curve remained steep.
Anthony, we saw a significant slowdown in that business as it related to the government shutdown. And so we mentioned on our call last quarter that early October was starting out really slow. So it was really kind of a tail of two quarters where the first half of the quarter was pretty low. ADRs in the back half came up. So it averaged to a good number, but there was a lot of volatility and really low ADR during the government shutdown.
And the last half of December tends to be very slow as well.
Thank you. And then one more on expenses. So could you put a finer point on the degree to which any incremental commissions from the fixed income business could impact the expense outlook? I only ask because I remember last year, your expense outlook, quarter after quarter, included increases in commissions, which helped give us more visibility into where total expense could come in for the year. Thank you.
As we think about the counter-cyclicals, the rule of thumb is assume 60% commission as revenue increases year over year.
I look at the commission-based nature of expense growth in 2026. If we get commission-based expense growth in 2026, it will be a high-class problem. That is profitable business for us. It is brought in a deepening relationship. And so while we don't anticipate that that's going to drive the expense number, if we get that and we end up with a higher than flattish or flat expenses, that will be a high-class problem.
Operator
Our final question today comes from Timo Brazila from Wells Fargo. Your line is now open. Please go ahead.
Brian, I just want to make sure I heard your last statement correctly. So is it implying the flattish expenses imply flattish counter-cyclical revenues in 26, and to the extent that you get growth there, then you'll get growth in the expenses?
Well, back to my earlier point about all models are wrong, some are useful. We have to make assumptions about what our counter-cyclical business is and our commission-oriented businesses. So that includes our wealth management business, that includes our fixed income business, that includes incentives we play around, mortgage, warehouse lending. So we've got a series of assumptions in there. I wouldn't overread that we don't expect that that balance will change, but we have incentive program lending and our commercial real estate lending. And as we look at the course of the year, we think all of it balances out, given our expectations to come from, that it will largely be in a flat area.
Got it. And then just following up on the loans to mortgage companies, just wondering what portion of the growth is coming from new client acquisition, if any, or has that ramp that you've been focused on over the course of the past year or so, has that largely concluded and that business is now more or less stable, or is there still some level of benefit coming from new client acquisition there?
Yeah, I'm happy to address that one. I don't have the exact split with me, but I can say that we continue to pick up on new customers at a pretty good clip. As you may recall, there was some disruption to that industry earlier this year and also last year in terms of a few major players either exiting the space by decision or being acquired. And as a result, there became a good number of strong customers that were potentially looking for new homes. And so our team has the solution and the expertise we have in the space of picking up new clients. But we certainly also upsize with existing clients as mortgage volumes are picked up. And so the increase you're seeing is really a combination of mix of the two.
And we get a larger share of originations as a result of all.
Thank you. we have no further questions at this time so I'd like to hand back to Brian for closing remarks thank you Lucy thank you all for joining us joining us this morning we appreciate your time and your interest please feel free to reach out if you have any further questions if there's anything that we can do help fill in the blank hope you all have a great day this concludes today's call thank you all for joining you may now disconnect your line