Operator
Good morning, and welcome to the First Sun Capital Bancorp second quarter 2026 earnings conference call. At this time, all participants are in listen-only mode. Later, we will conduct a question and answer session. If you would like to ask a question during this time, simply press star followed by the number one on your telephone keypad. If you would like to withdraw your question, press star one again. Also, as a reminder, this call may be recorded. I'd now like to turn the call over to Ed Jax, the First Suns Director of Industrial Relations and Business Development. Ed, you may begin.
Ed Jax
Head of Investor Relations
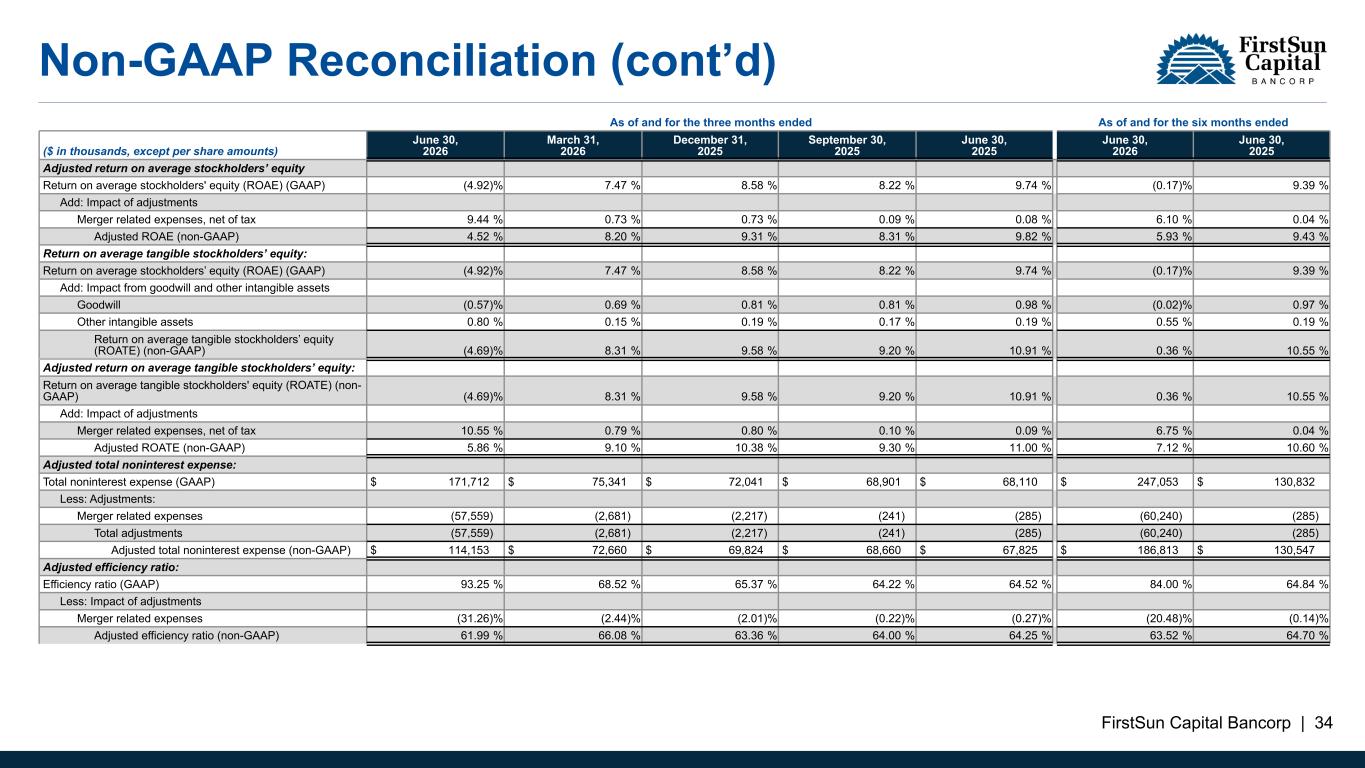
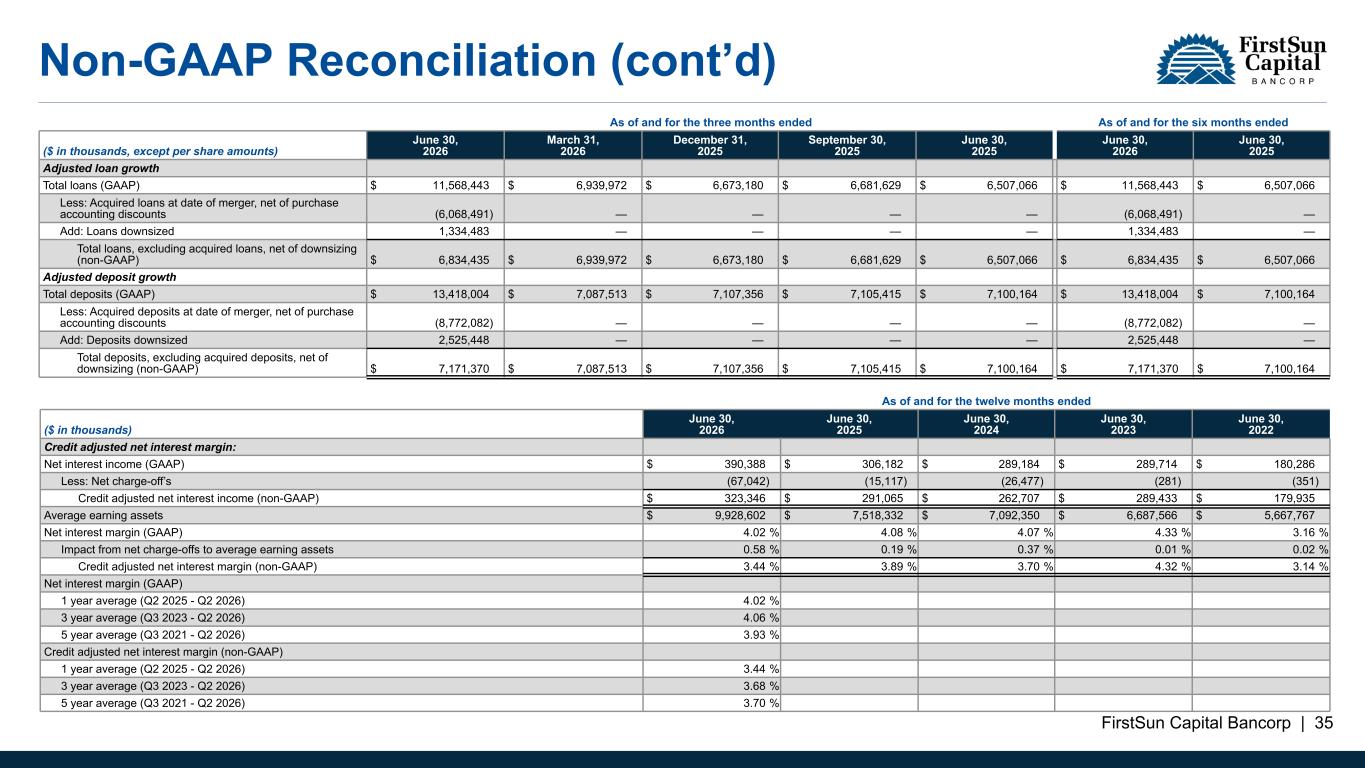
Thank you, and good morning. I'm joined today by Neil Arnold, our Chief Executive Officer and President, Rob Kaffera, our Chief Financial Officer, and Jennifer Norse, our Chief Credit Officer. We will start the call with some brief remarks to highlight commentary around our second quarter results before moving into questions. Our comments will reference the earnings release and earnings presentation, which you will find on our website under the Investor Relations section. During this call, we will comment on our financial performance using both GAAP metrics and non-GAAP financial measures. Important information about these non-GAAP financial measures, including reconciliations to comparable GAAP measures, is included in the appendix to our earnings presentation and in our earnings release. During this call, we will also make remarks about future expectations, plans, and prospects for the company that constitute forward-looking statements for the purposes of the safe harbor provisions under the Private Securities Litigation Reform Act of 1995. Actual results may differ materially from those indicated by these forward-looking statements as a result of various important factors. Please refer to our earnings presentation, as well as our annual report on Form 10-K and our other SEC filings for a further discussion of the company's risk factors and other important information regarding our forward-looking statements. We undertake no obligation to publicly revise or update any forward-looking statement, except as required by law. I will now turn the call over to Neil Arnold.
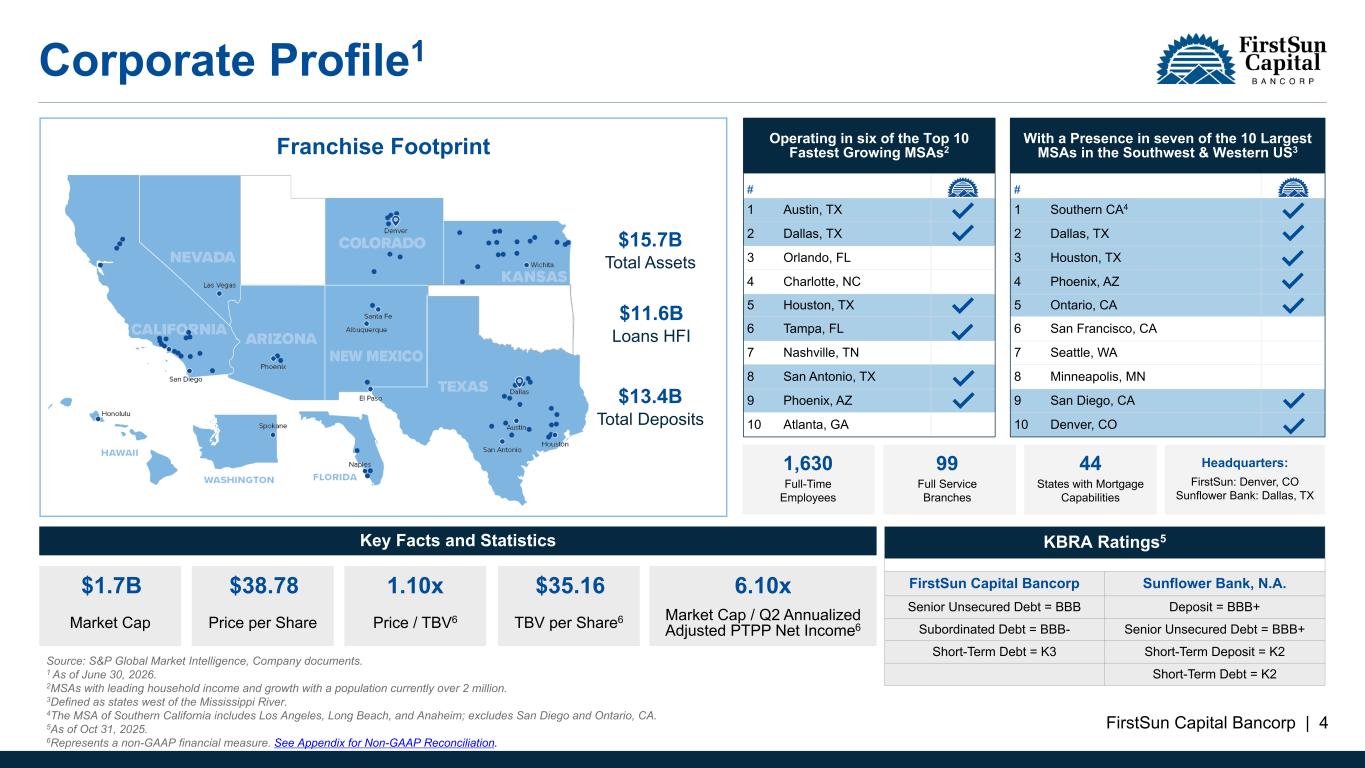
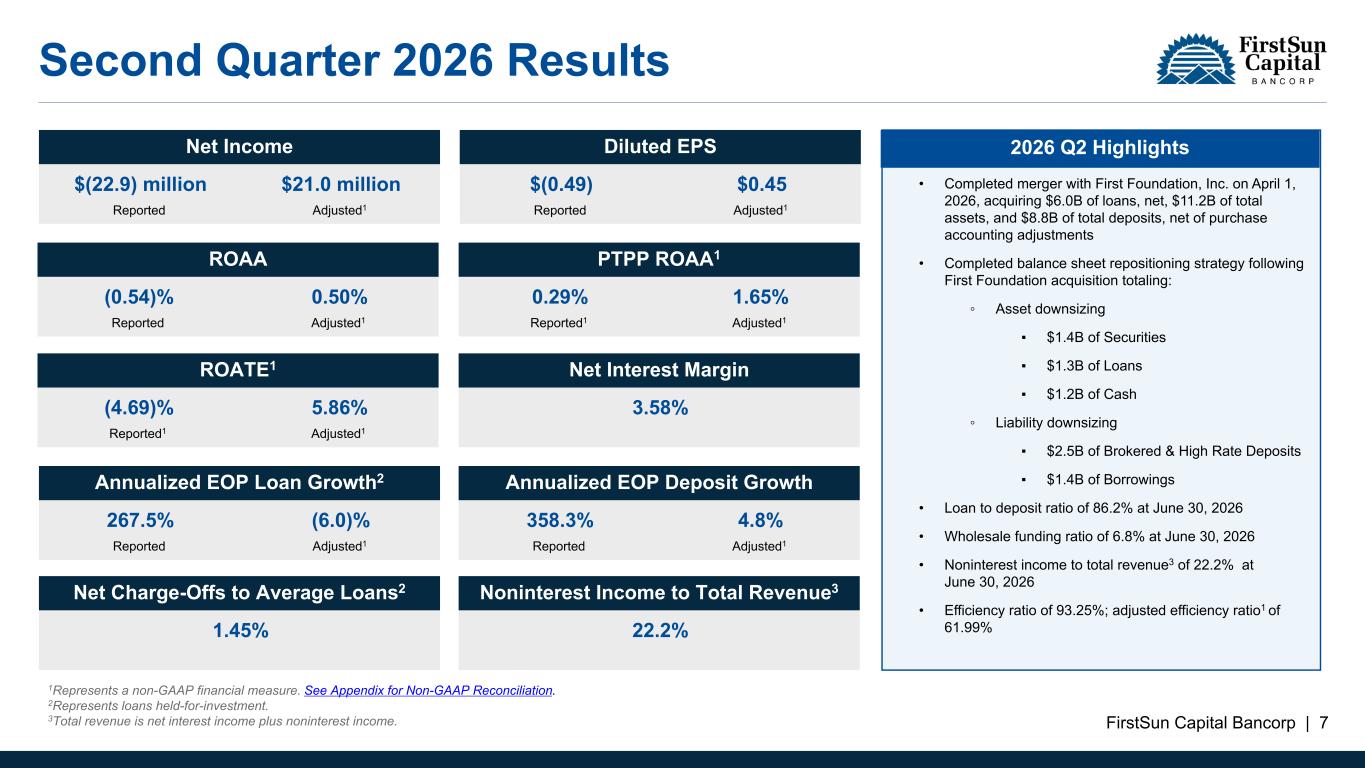
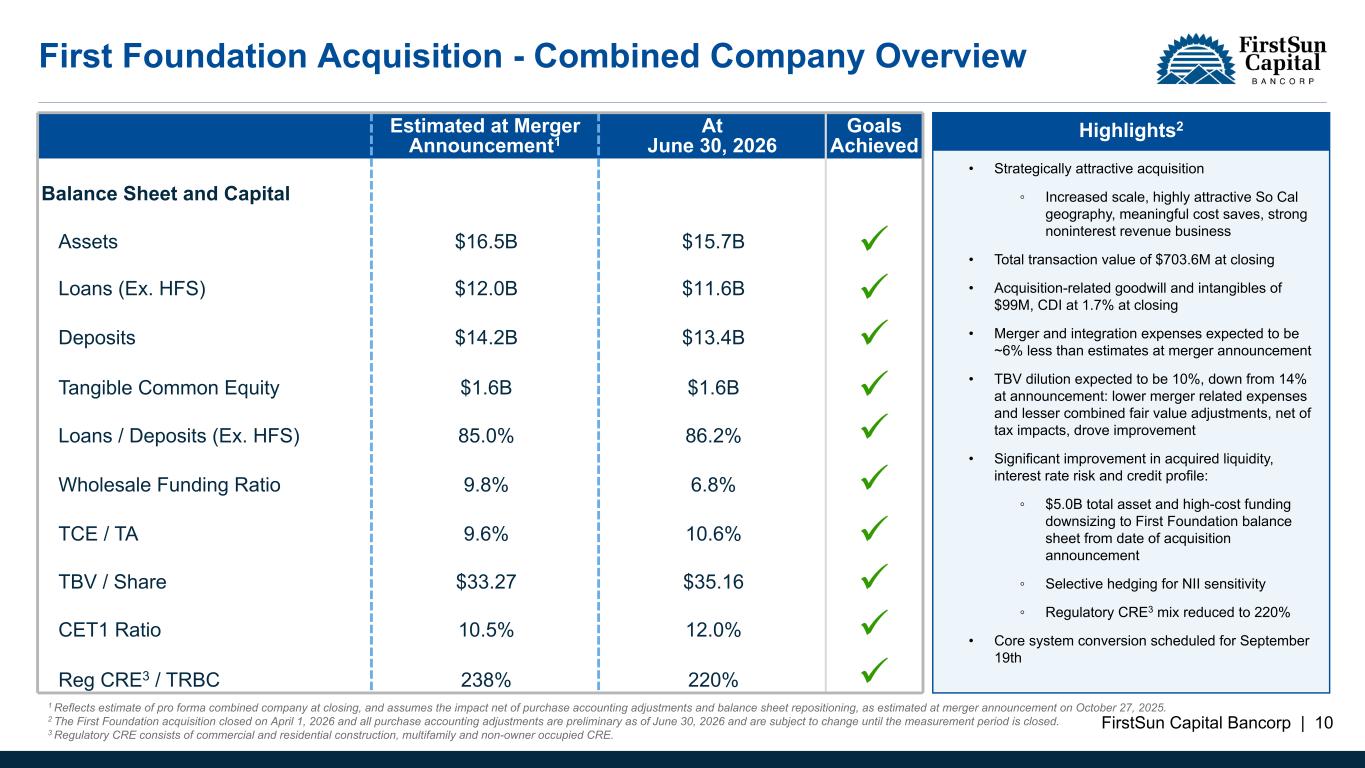
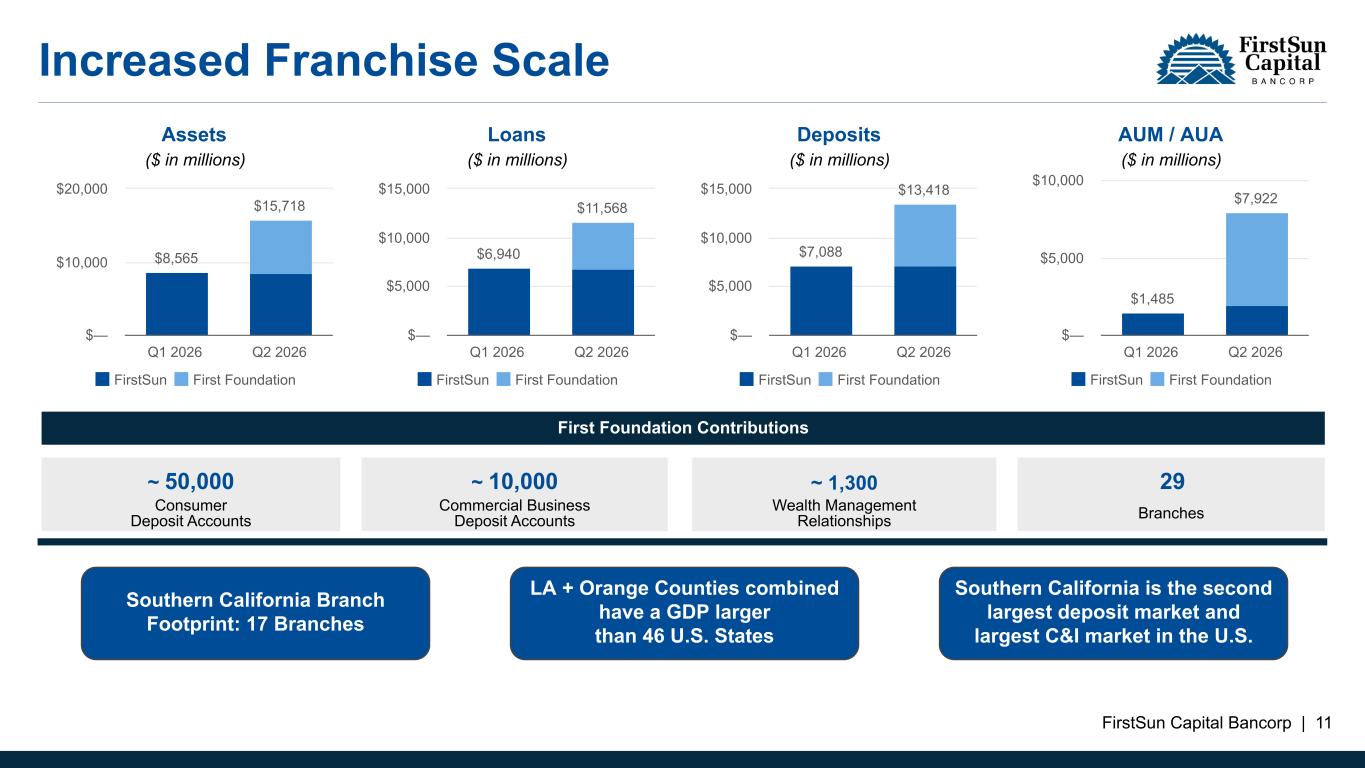
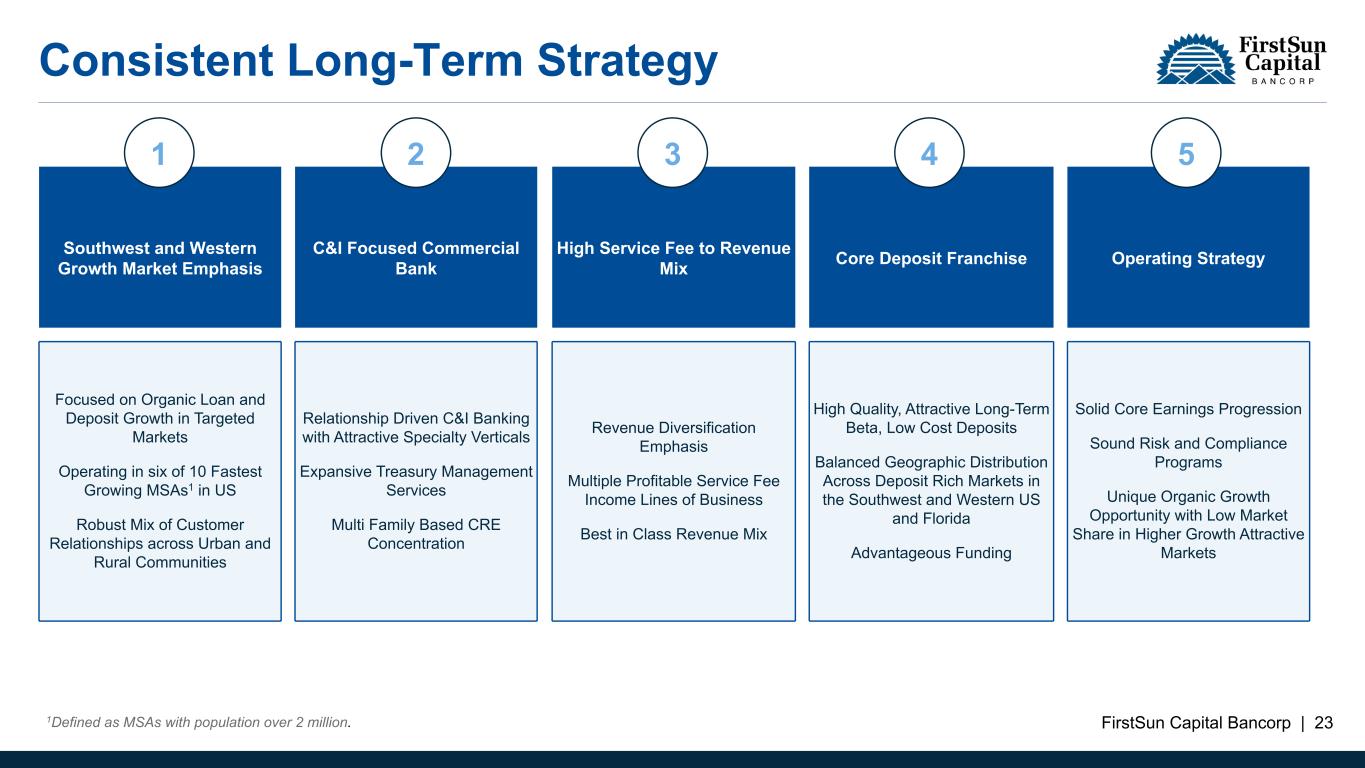
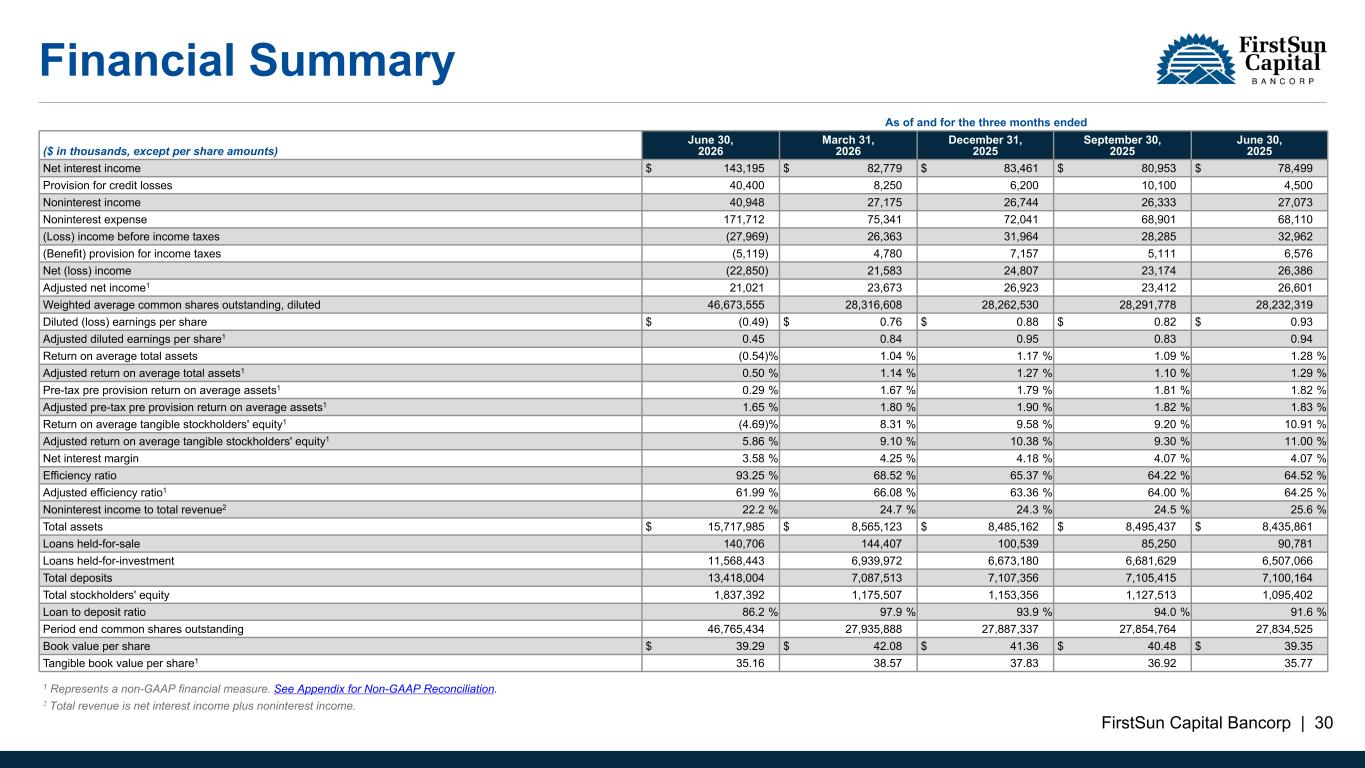
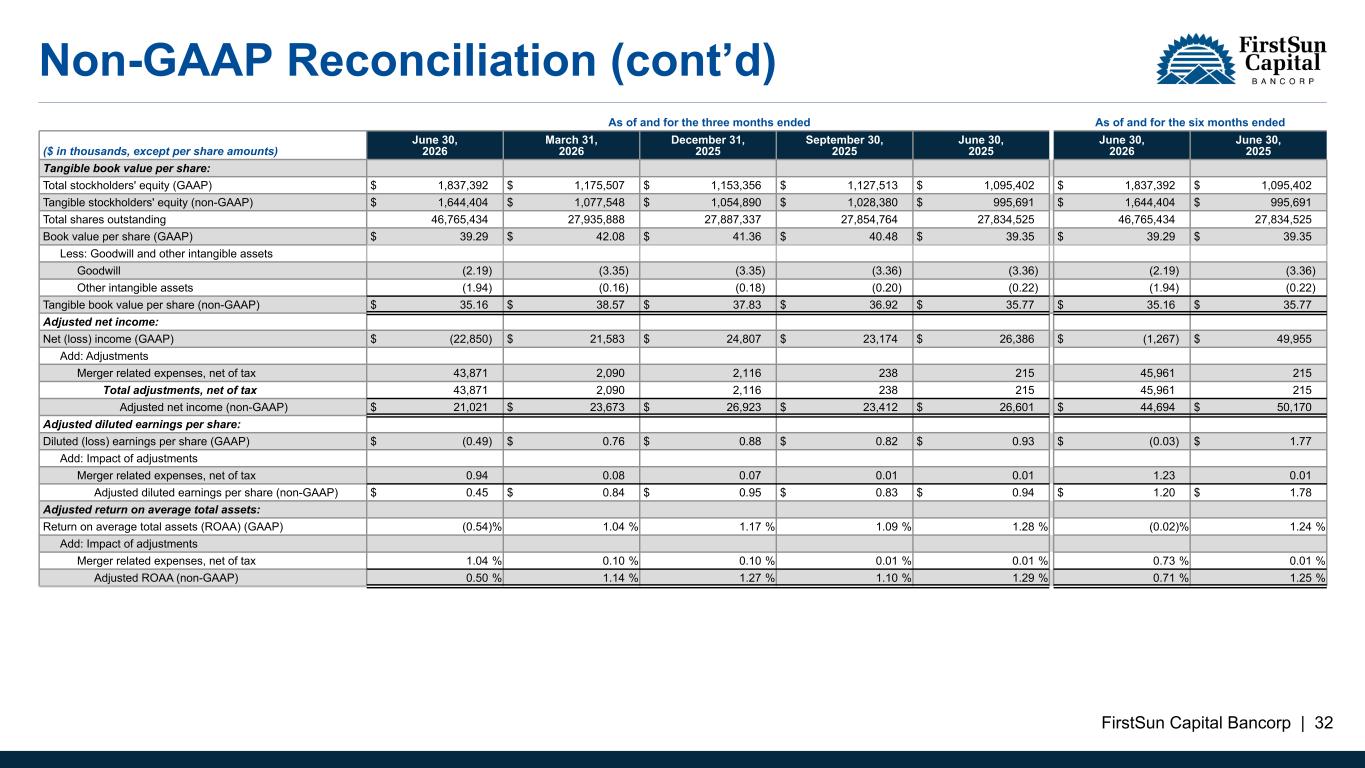
Thanks, Ed, and good morning, and thank you for joining us. The second quarter marks an important milestone for First Sun as we completed our acquisition of First Foundation on April 1st and continued the hard work of integrating their businesses. We believe the expanded footprint in the Southern California markets and their premier wealth management platform have added significantly and strengthens our franchise and positions us for future success. The middle market business opportunity in Southern Cal aligns well with our C&I playbook, and I would argue that Southern California is the best core deposit market in the United States, as some of you have heard me say. I believe that coupled with adding our Southwest Florida markets to our existing deposit markets across Texas, Kansas, New Mexico, Colorado, and Arizona, well position us to drive future growth. We're very excited about all the growth opportunities in front of us with this acquisition. Our second quarter financial results were certainly mixed. Bottom line, we reported a net loss of $23 million, which included $44 million in after-tax merger-related expenses and included the $30 million in after-tax credit loss provisioning. Earlier this month, we provided a credit update on two larger loan charge-offs totaling $26 million after-tax. This significantly contributed to our larger loan loss provisioning in the quarter. While the bottom line performance this quarter was below our expectations, we did see significant progress in several areas. Starting with the balance sheet repositioning, which we've emphasized throughout as a key strategic step in our integration plan for the first foundation business. I'm very pleased to tell you that we've completed all of the downsizing that was part of our plan in the second quarter. Our teams executed the plan with discipline and efficiency. The repositioning strategy that we executed upon was a very important strategic step in the risk profile of the balance sheet we acquired. We believe we have a strong balance sheet with less concentration risk, less liquidity risk, less interest rate sensitivity, and a stronger capital profile as a result of these repositioning actions. On the deposit side, we saw adjusted annualized growth of approximately 5%, which excludes the impact of the acquired First Foundation deposits net of the downsizing. Notably, deposit growth in Southern California drove the adjusted annualized growth rate that we mentioned. Our service fee revenue performance in the second quarter was strong as well, representing 22% of revenues this quarter, further evidencing our diversified business model. We also saw significant progress in the cost-save realization in the second quarter following the closing of our acquisition. As Rob noted in last quarter's call, we believe we'll overachieve the level of cost-saves that we deliver in conjunction with fully integrating and converting the first foundation business. We're also pleased to note that the level of tangible book value dilution related to the acquisition is less than our original estimate we announced last October, with the overall level coming in at only approximately 10%. Our capital position is strong. Yesterday, we also announced a share repurchase program totaling up to $150 million, with repurchases targeted over the next four quarters and starting here in the third quarter. We see this as an integral component to driving shareholder value and realizing the impact of this transaction. On the asset quality side, we saw an elevated level of losses in the second quarter with two notable larger losses. The first relates to a situation involving what we believe to be a fraudulent misrepresentation by a borrower in the materials distribution business. And the second one, which is unrelated to the first, relates to a technology company that experienced deterioration in financial performance in the second quarter. The charge-offs on these two loans totaled approximately $35 million pre-tax and, as I said, materially drove the increase in our credit loss provisioning and charge-offs in the second quarter. While these losses were disappointing, they were driven by borrower-specific situations rather than, in our belief, an indication in broad-based significant loss content across our portfolio. Further, while the dollar amount of non-performing loans at June 30th increased from the end of the first quarter, we haven't seen a large increase in the number of C&I loans in non-performing status. So again, we don't believe it's an indicator of any broad-based deterioration in our C&I loan relationships across our portfolio. Our underwriting processes are thorough and include stress testing. Our loan grading considers the effect of P&I amortization, even if a loan is on interest only. currently and our reoccurring portfolio review activities emphasize identifying potential risks early. We maintain strong borrower engagement and we work to take timely action to preserve the asset quality of the overall organization. As we've said before, we don't take larger risks within our portfolio. We have no loans even approaching any of our legal lending limits. Again, we are disappointed in loan losses that we experienced in the past quarter. However, we believe that loan losses and provision at this level is isolated. As I look forward to the third quarter and beyond, I believe we're making significant progress in our franchise buildup. The acquisition has enabled us to enhance our presence in attractive, high-growth markets and increases our scale across many of our core businesses. Our expanded branch network strengthens our ability to serve clients locally while enhancing our deposit gathering capabilities and overall relationship density. We believe we have enhanced our long-term growth profile and improved our revenue diversification and further strengthened the durability of this franchise. Our near-term focus is on completing our remaining integration work, including the core system conversion, which is scheduled for this core in the late September. And as many of you know, acquisitions involve a fair amount of work beyond just computer conversions. And finally, I want to thank all our teammates for their tremendous commitment and hard work through all this integration work. Their dedication to serving our clients and our communities while executing on a large transaction like this has been exceptional. I'm very proud of everything they continue to help us accomplish. With that, I'll pass the call over to Rob to review our results in more detail.
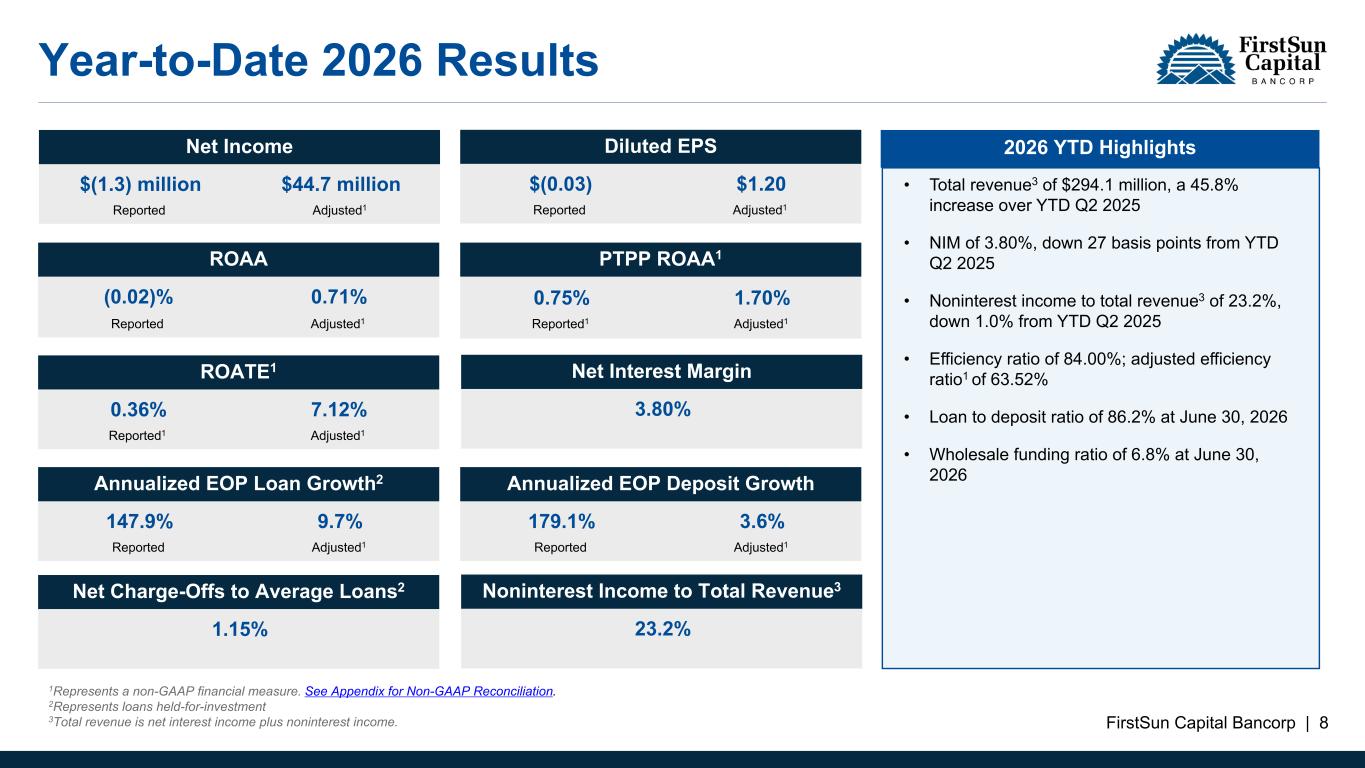
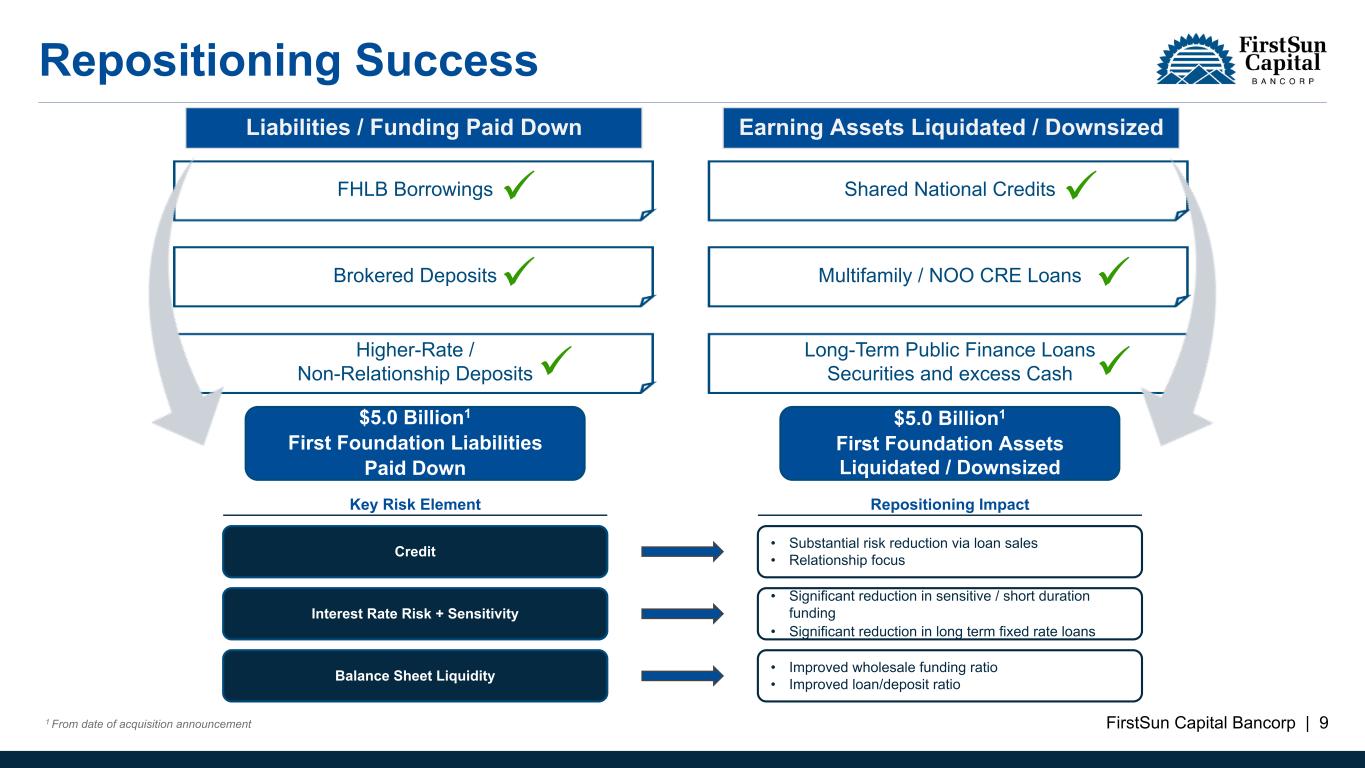
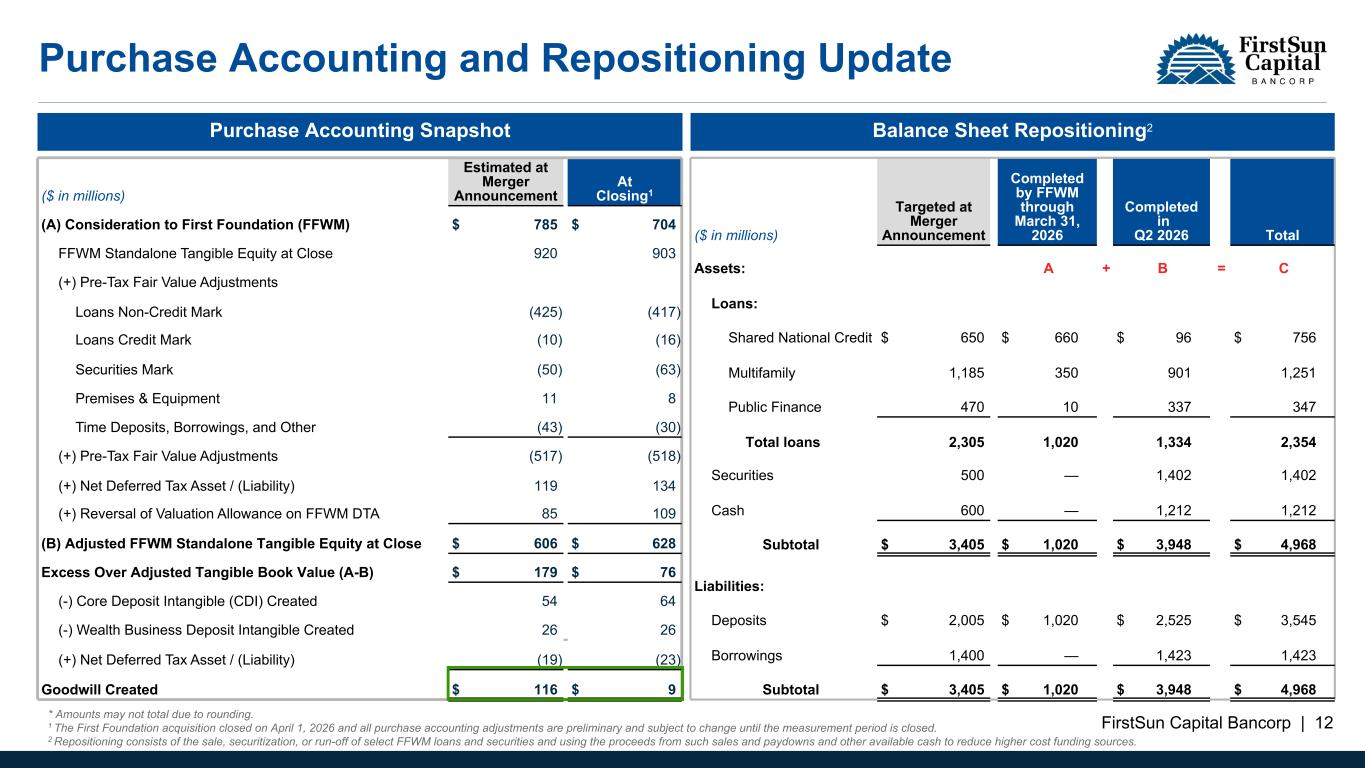
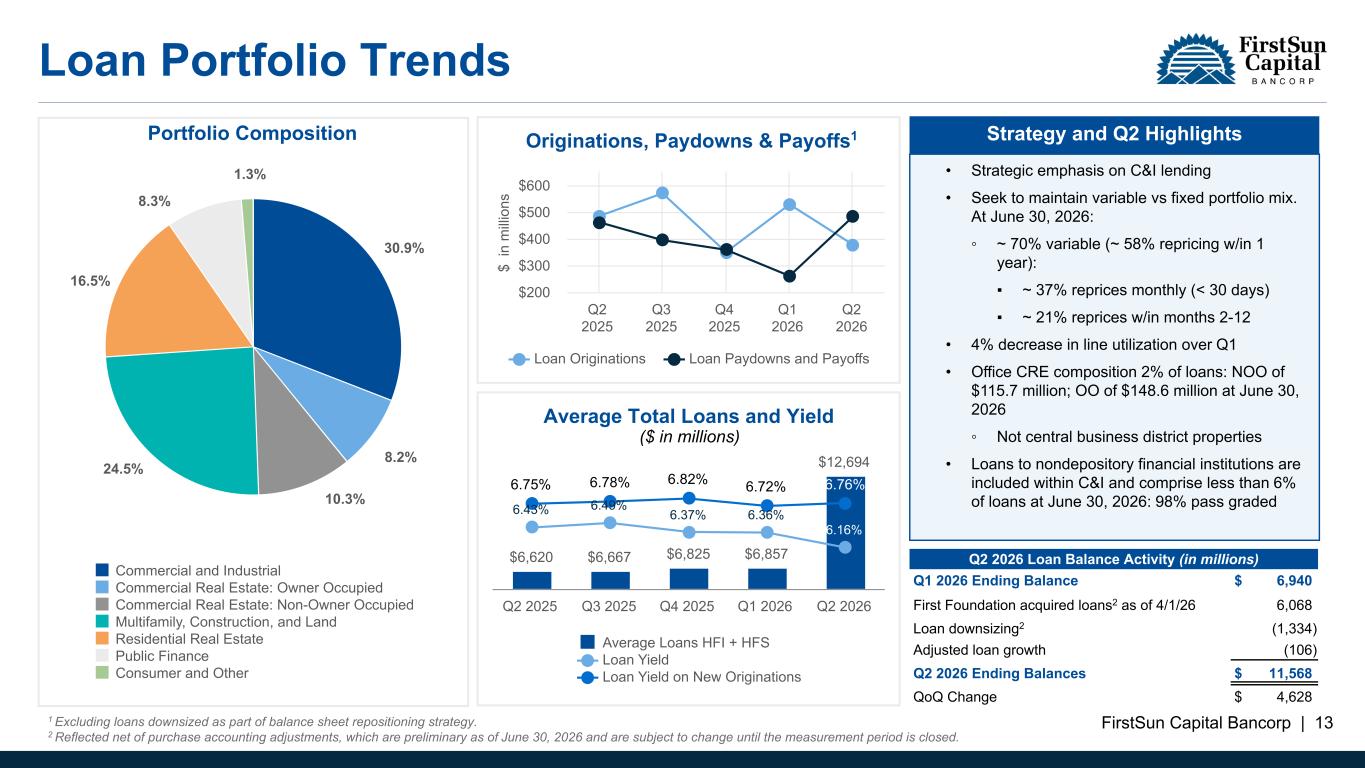
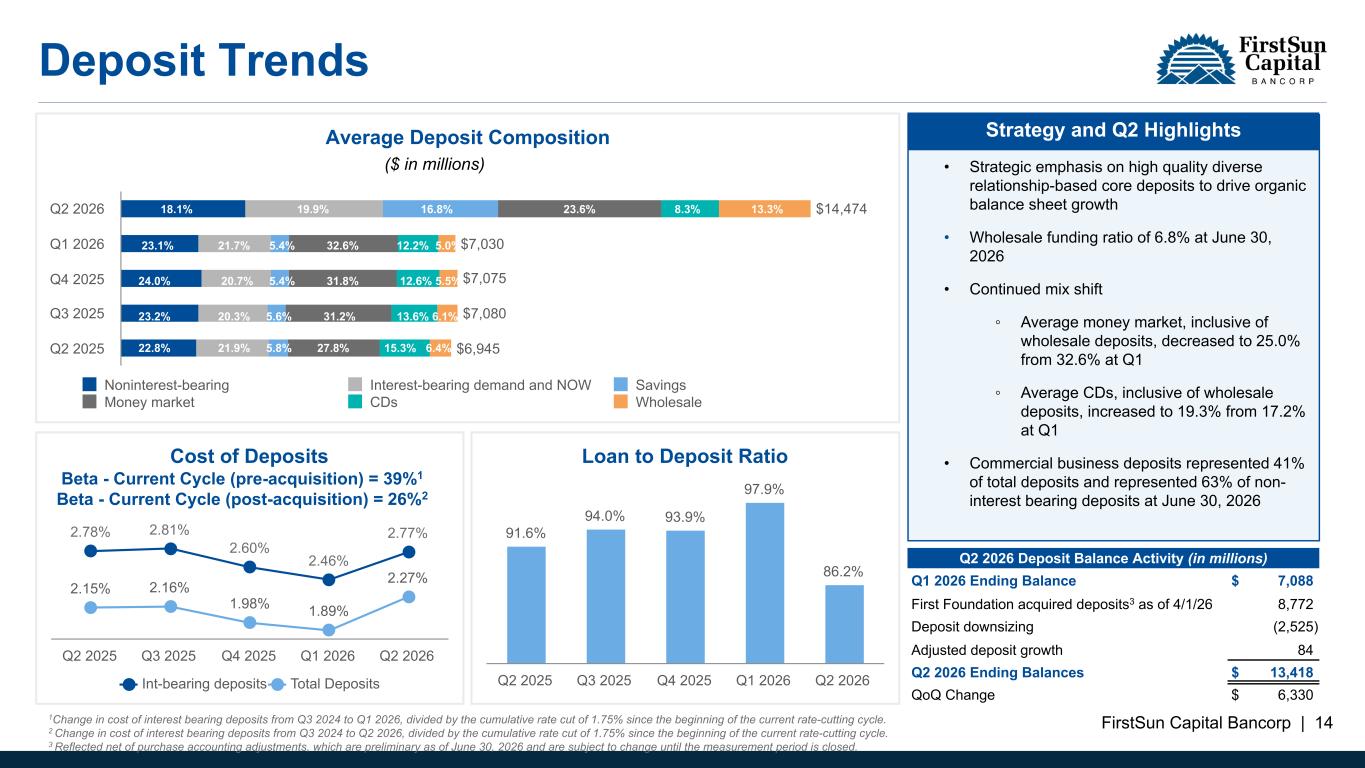
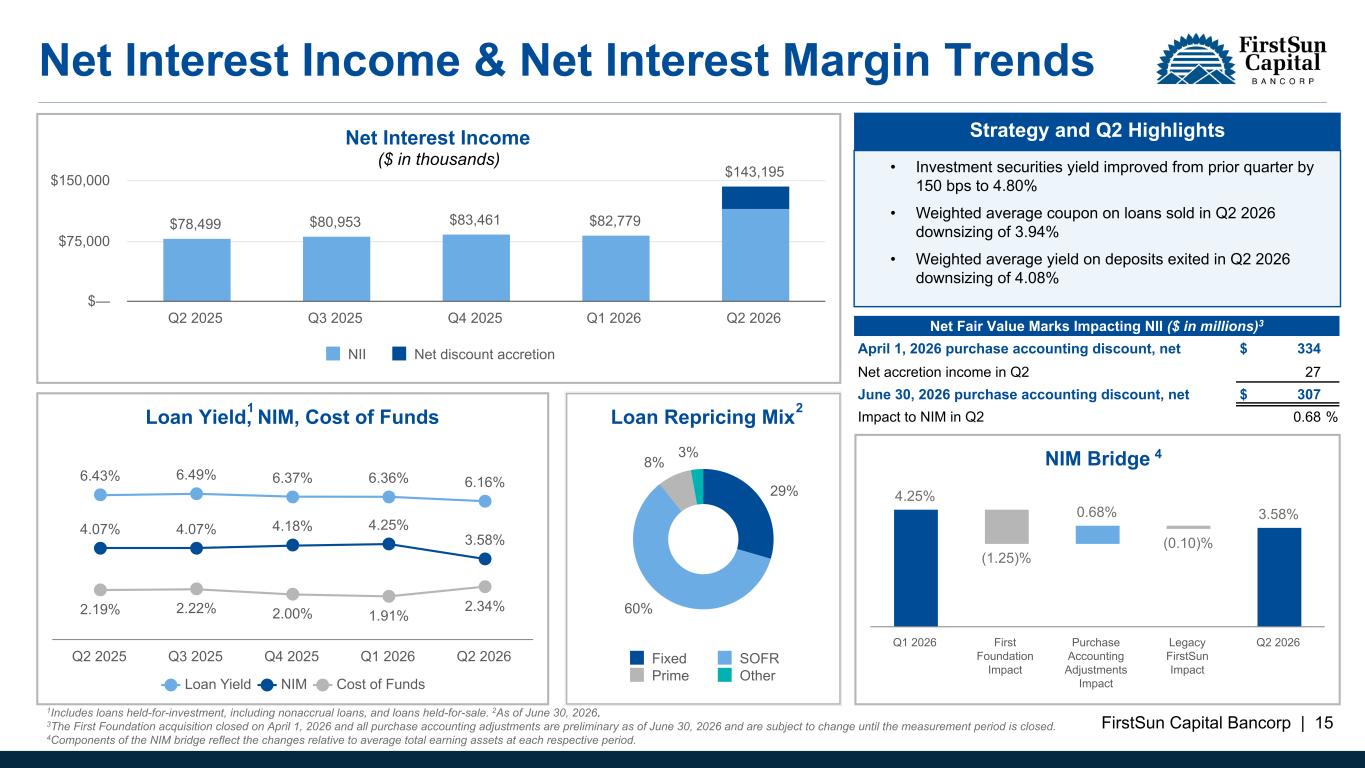
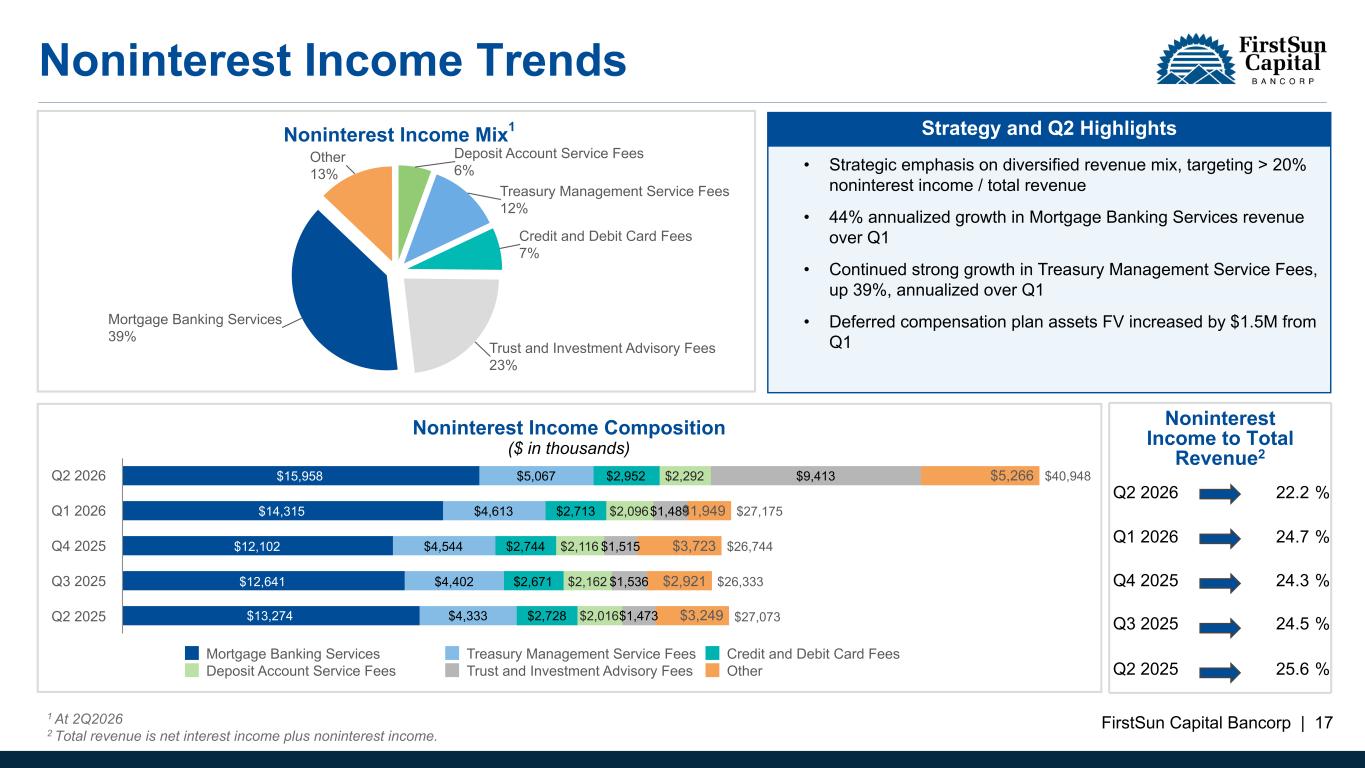
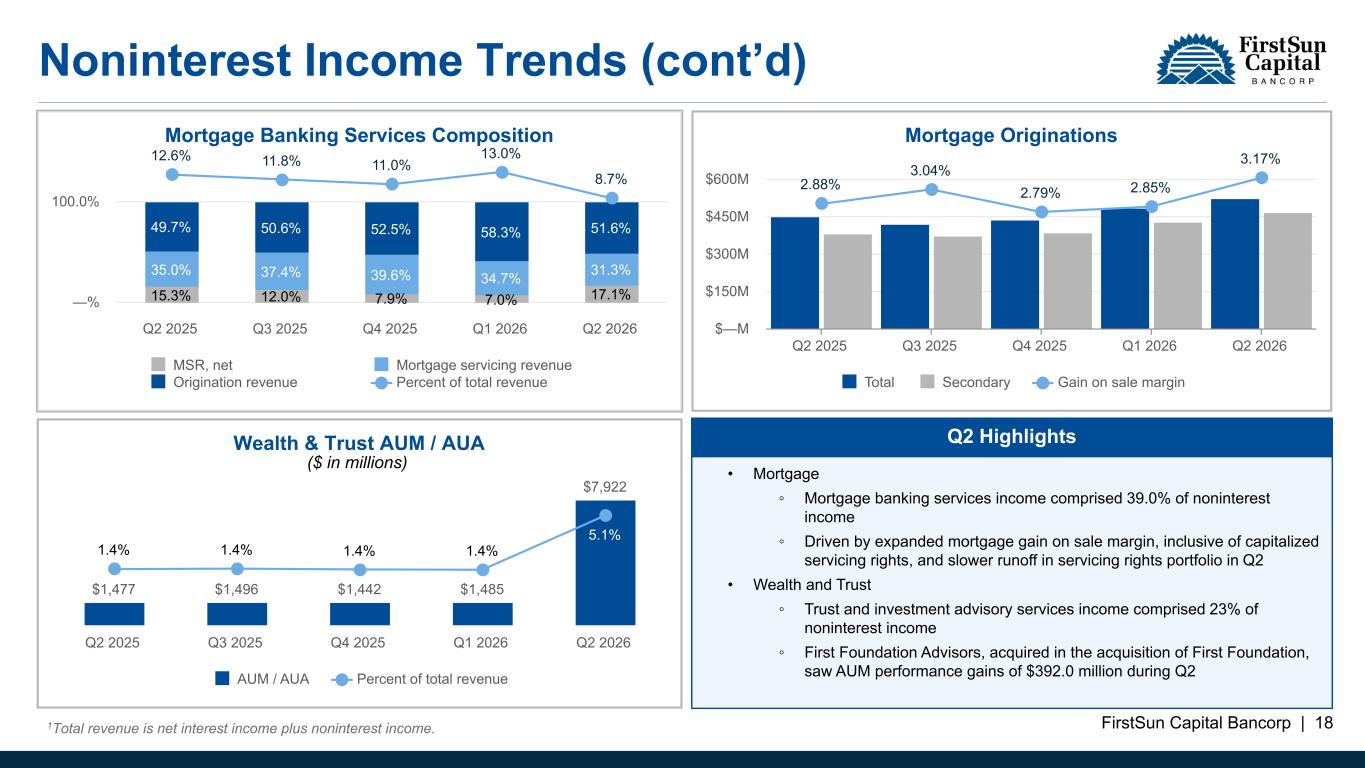
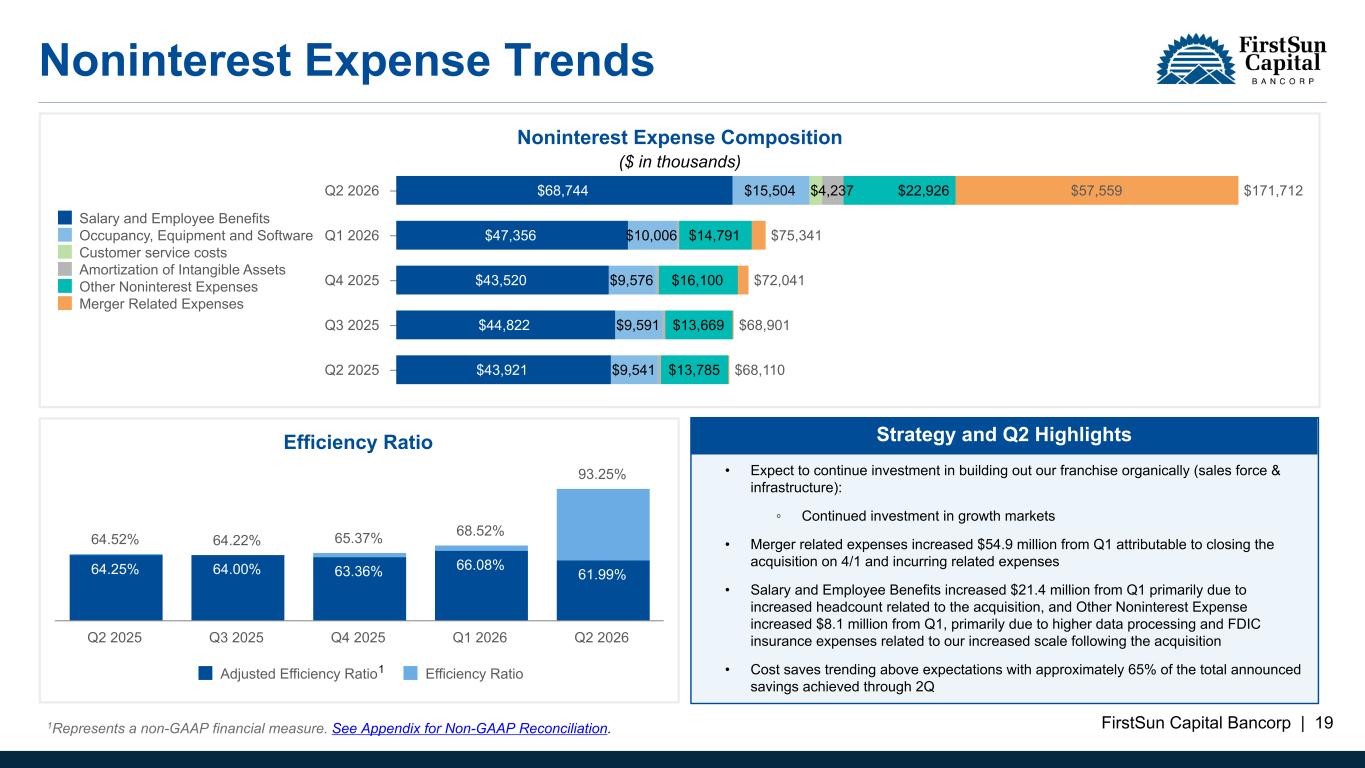
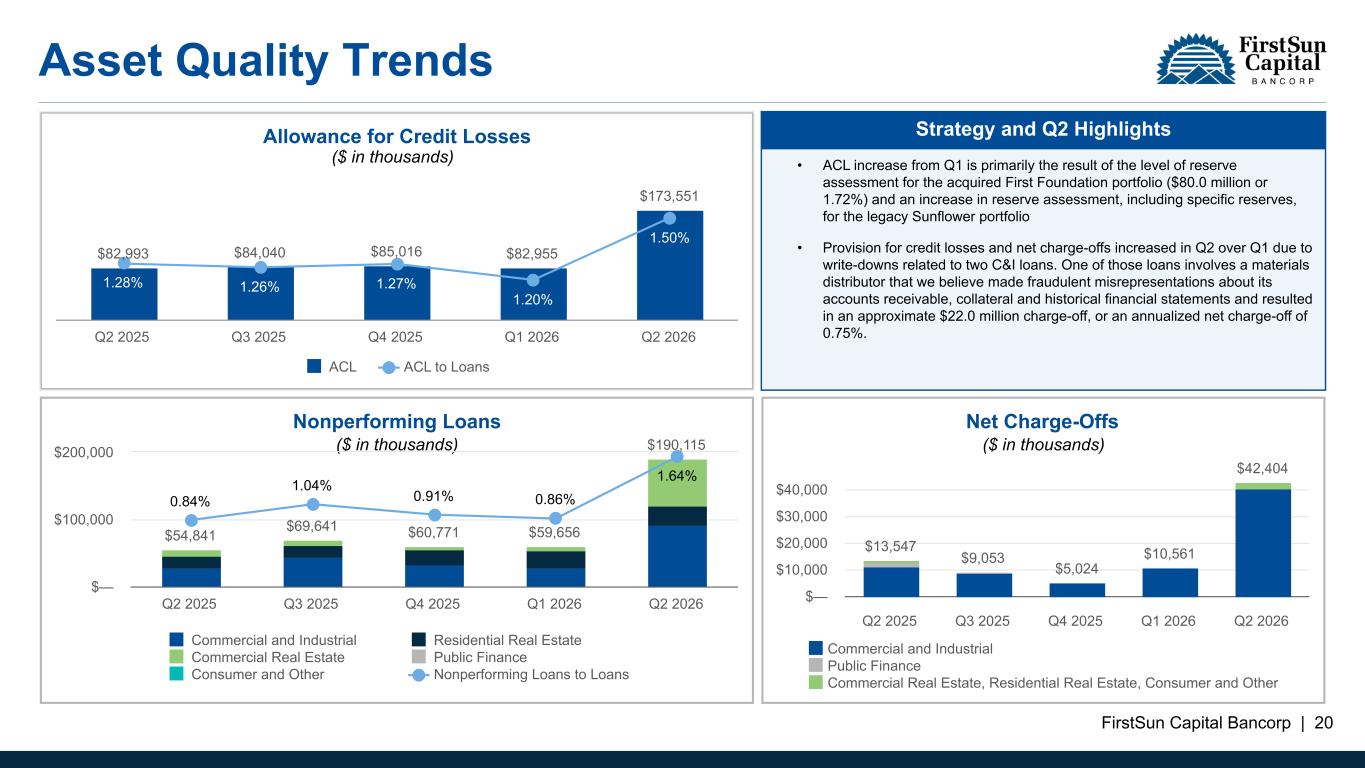
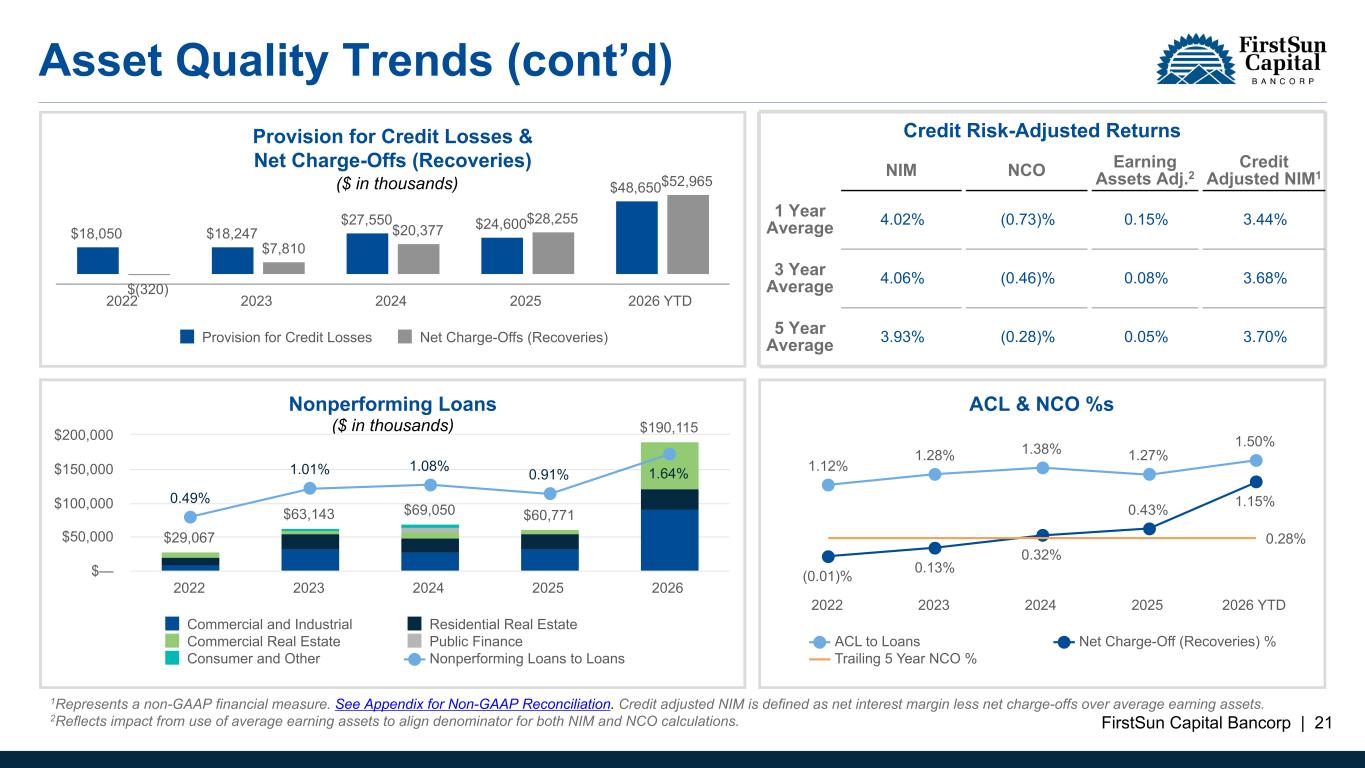
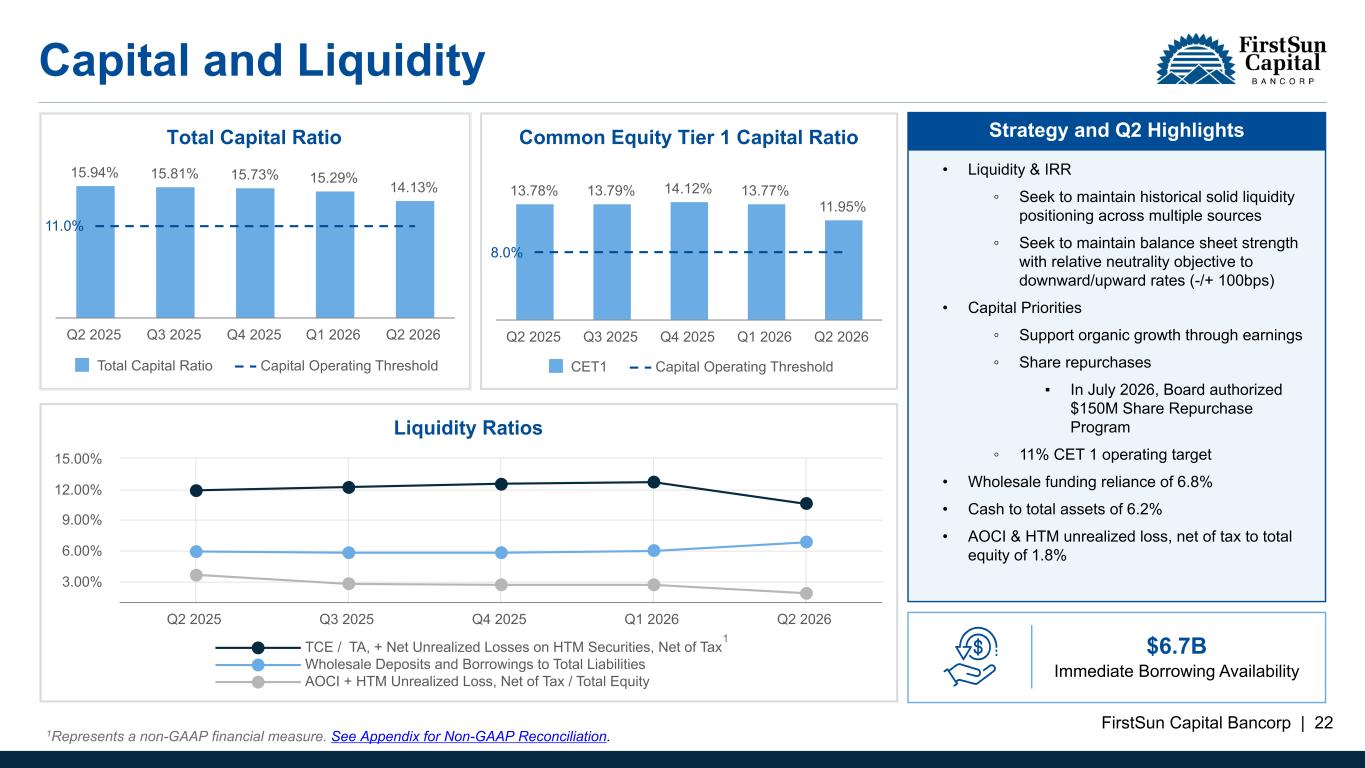
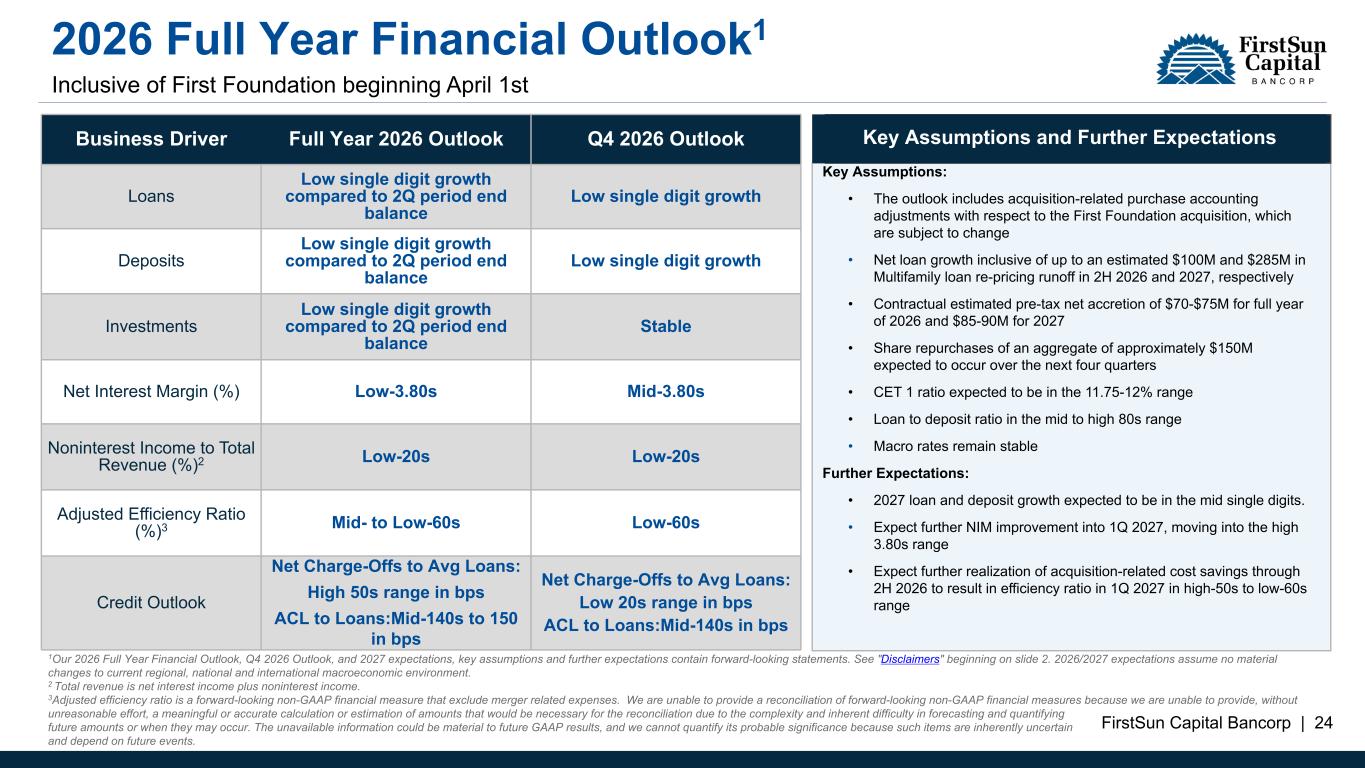
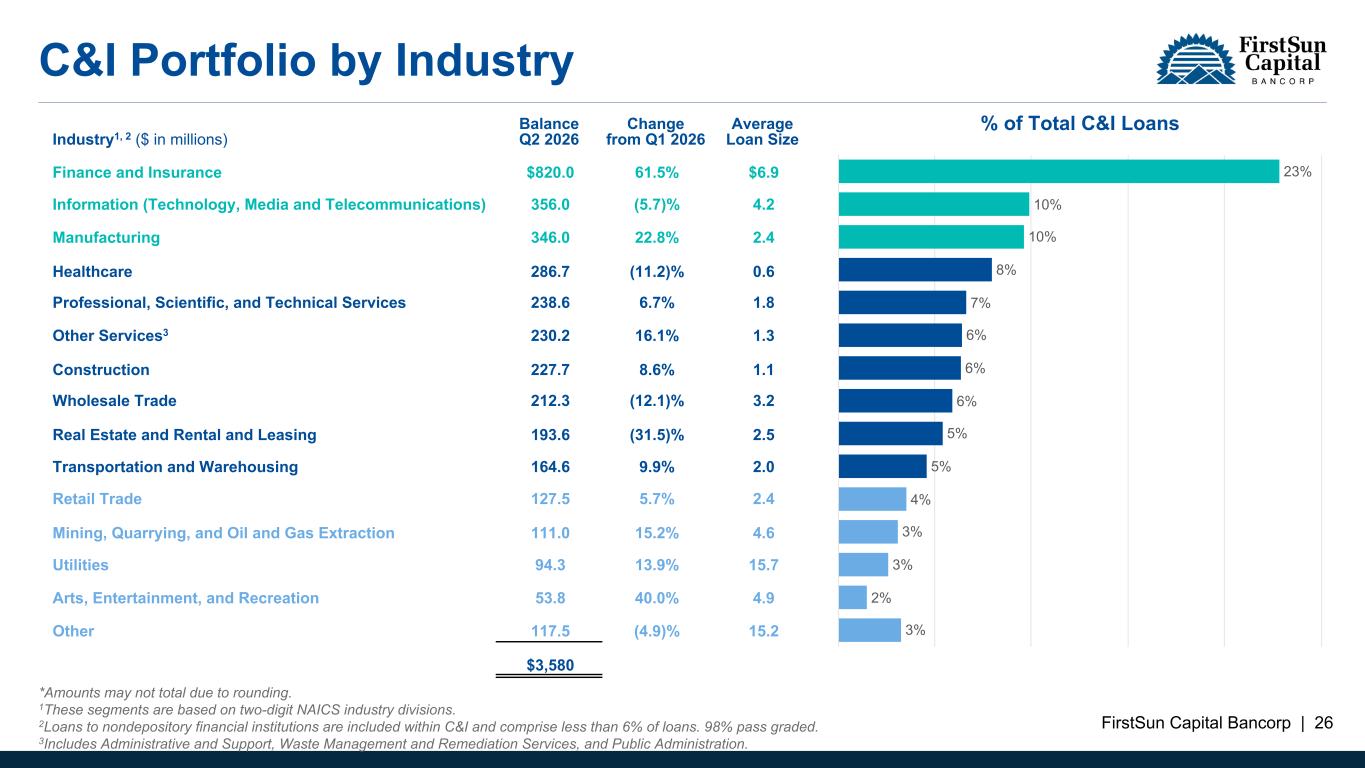
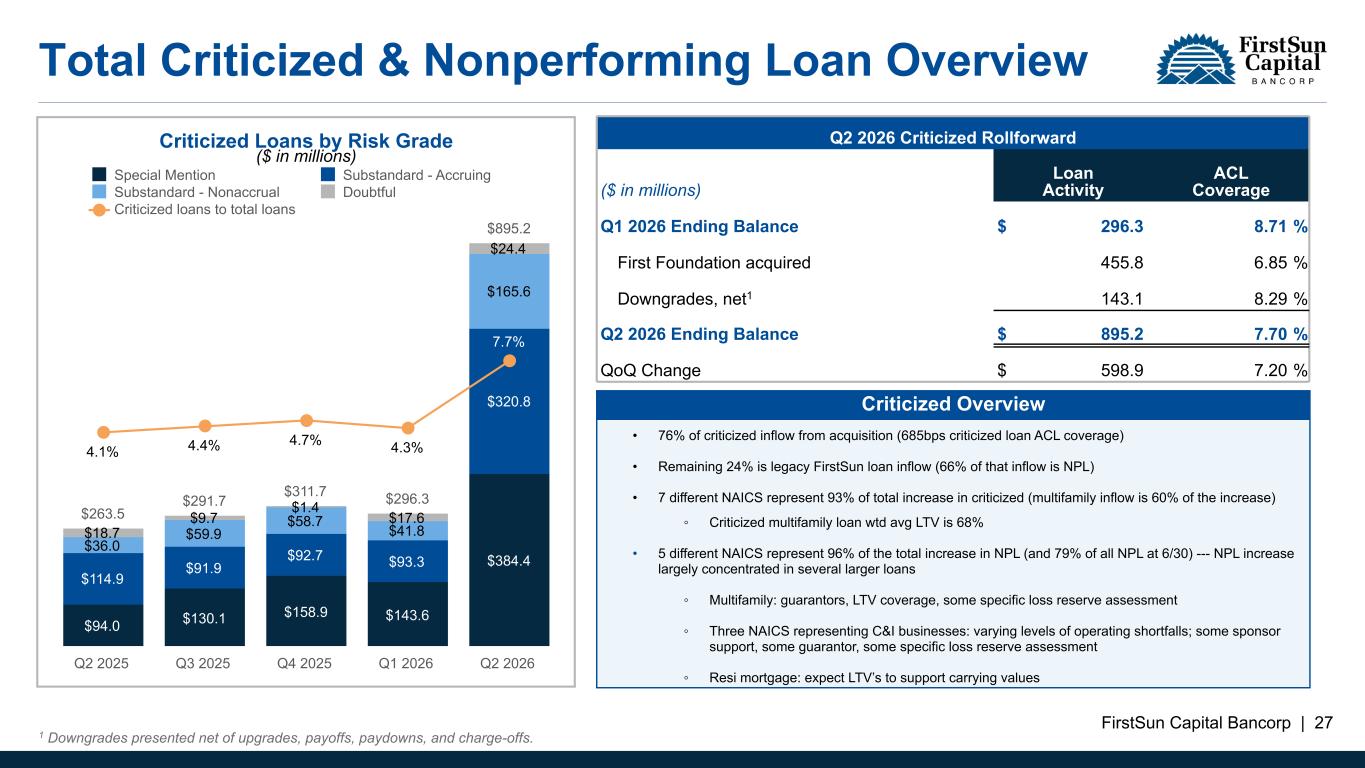
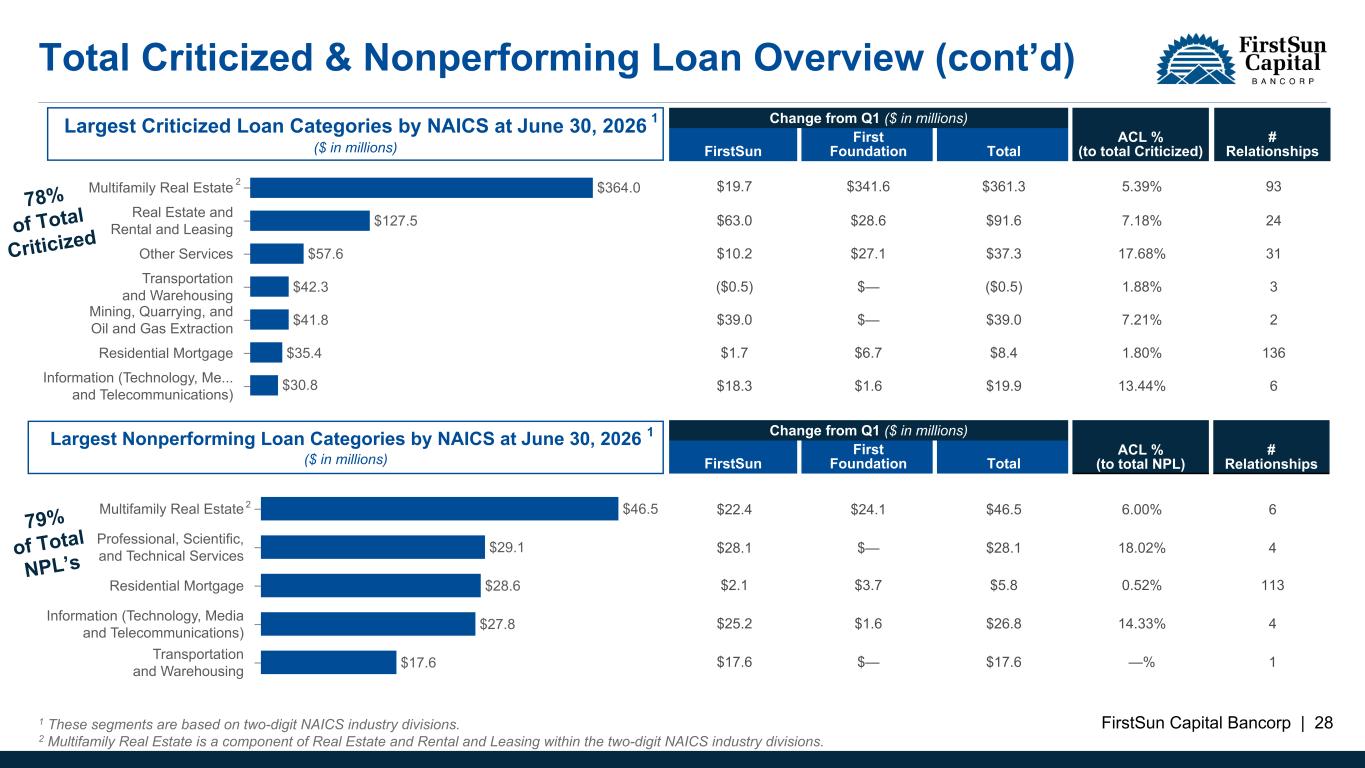
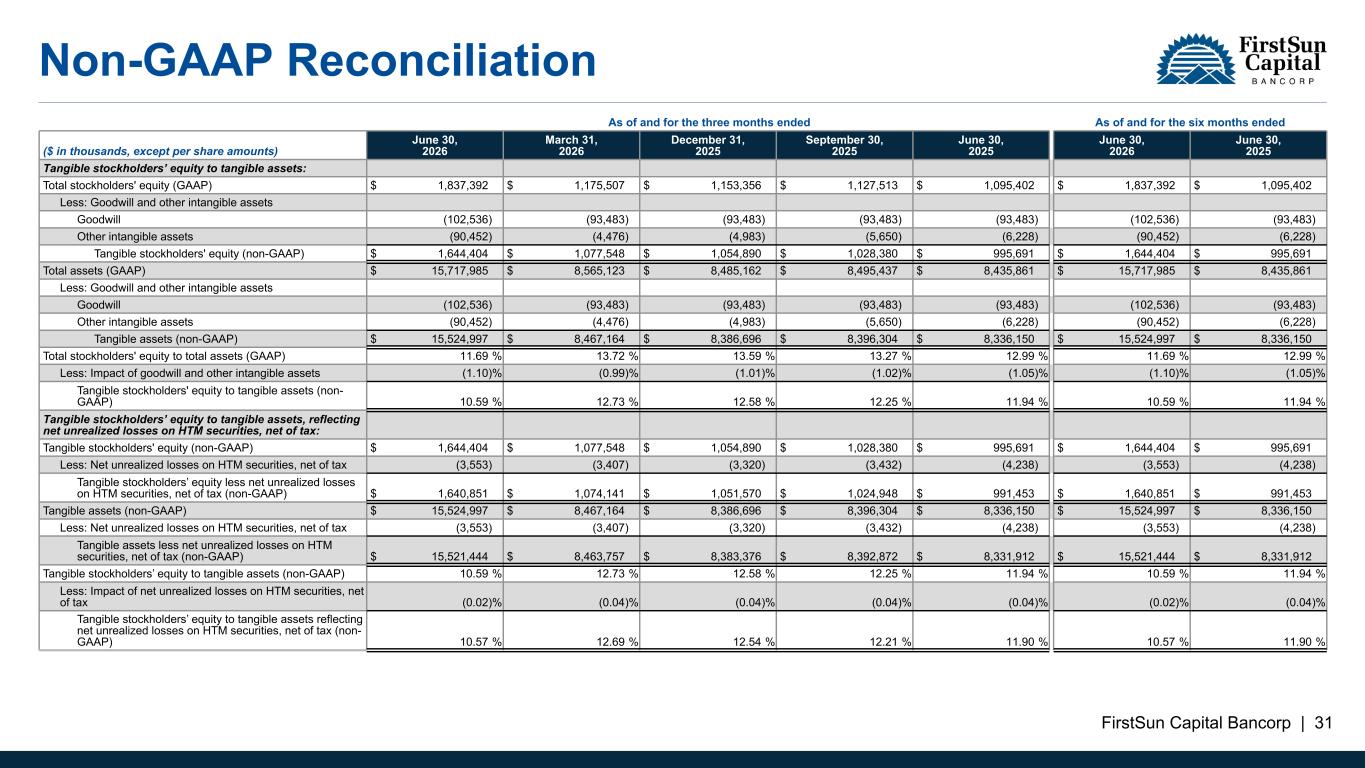
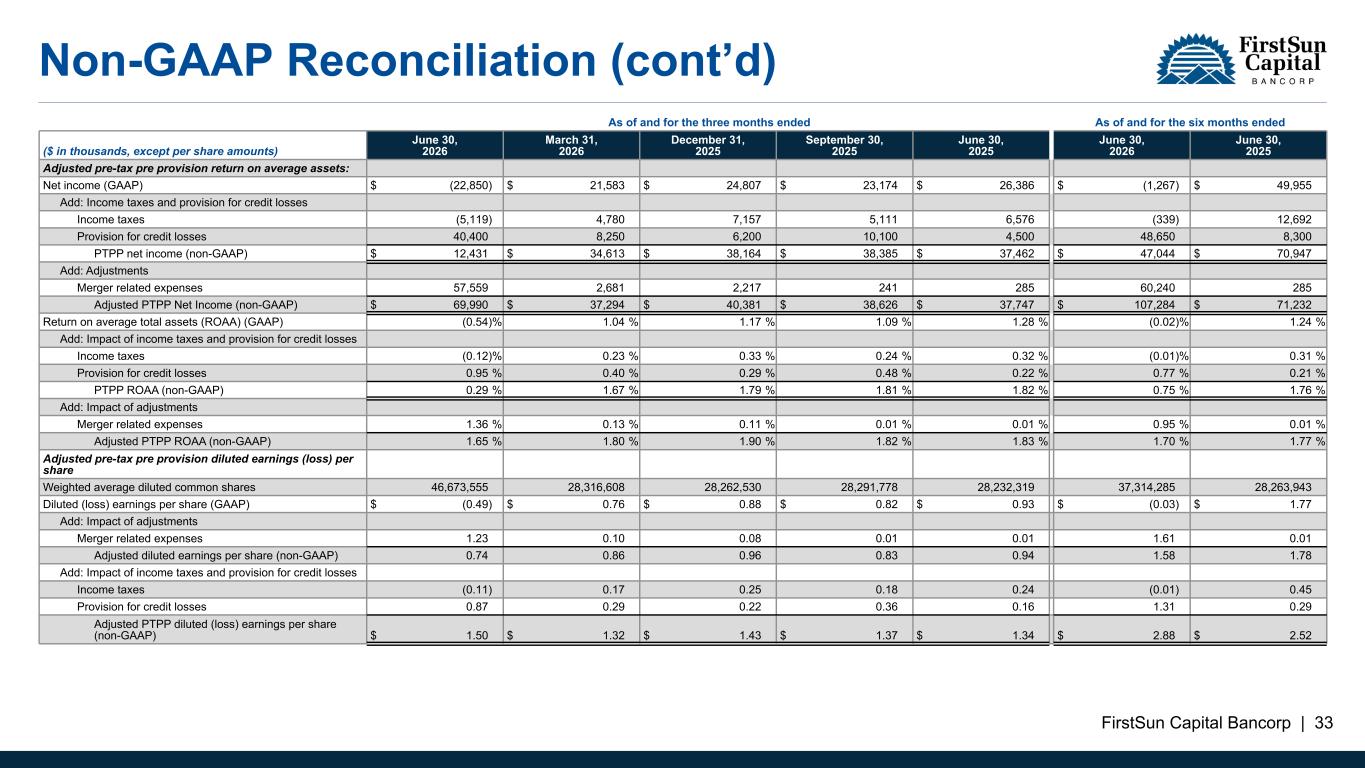
Thank you, Neil. I'll start off by underscoring the appreciation Neil just mentioned for all the hard work across all of our teams as we continue to progress with all the business integration efforts. The collaboration and teamwork from everybody has been very inspiring. There's a lot of activity this quarter with the merger closing and all the related significant merger activities as well as developments on the credit side. We've added information into the earnings presentation we filed, and I'll break out some data to try to provide clarity on these matters as well as our underlying core operations. On the strategic side, I'm very pleased to say that all the balance sheet repositioning associated with the acquisition that we targeted for the second quarter was indeed completed. This was certainly one of our highest strategic priorities immediately following the closing of the acquisition, and we can now shift our focus to leveraging our business model across our expanded geography. In terms of particulars on the downsizing during the second quarter, on the asset side, we successfully reduced acquired assets by approximately $3.9 billion, including $1.4 billion in the acquired securities portfolio and $1.3 billion in the acquired loan portfolio. And in the loan portfolio, that included approximately $901 million of multifamily loans and approximately $337 million of municipal loans and almost $100 million in SNCC loans. On the liability side, we improved our funding profile with an approximate $3.9 billion total reduction in acquired funding, including $2.2 billion in broker deposits, approximately $330 million in higher-cost non-relationship deposits, and $1.4 billion in FHLB borrowings. Our wholesale funding ratio was at 6.8% at the end of the quarter. So we accomplished what we set out to do on that side, a wholesale funding ratio in line with our historical legacy F-Sun levels. Through these repositioning actions, we believe we have meaningfully strengthened our balance sheet by improving our funding mix, reducing wholesale funding dependency, lowering loan concentration risk, enhancing capital and liquidity flexibility, and lessening our interest rate sensitivity, which we believe will position the company with a stronger foundation to support future profitable growth. Aside from the acquired deposits net a downsizing, in terms of core deposits, we saw approximately 5% adjusted annualized balance growth in the second quarter. And again, this is excluding the acquired balances net of downsizing. From a deposit mixed perspective, at the end of the quarter, we see non-interest bearing balances at 18.1% of the total, down from 23.1% at the end of the first quarter. And we see combined savings and money market balances at 40.4% of the total, up from 38% at the end of the first quarter. And balanced growth in our Los Angeles and Orange County markets led the deposit performance during the quarter. I will note that the non-interest bearing deposit balance mix reduction was in large part due to our strategic exiting of acquired higher rate deposits that had an interest cost to it, but it's called customer service expense, which is part of non-interest expenses as opposed to being an interest expense. These are deposits that are classified as non-interest bearing. These for higher rate deposits when you look at the economic cost, but there's a subtlety here in terms of where this cost resides in the actual P&L. On the loan side, at the end of the second quarter, excluding the impact of acquired loans and net of downsizing, we saw core loan balances decline 6% on an annualized basis. New loan fundings in the second quarter totaled $377 million, down 29% from first quarter new loan fundings level, and line utilization decreased by 4%. While new loan volume in Q2 was more muted, we did see stronger new loan volume in the first quarter, and our core loan balance growth through the first six months of this year, excluding the impact of first foundation acquired loans and net of downsizing, was 9.7%. Coupons on second quarter new loan originations were at 6.76 percent, very similar to the first quarter level, which was at 6.72 percent. I'll note that these average coupon levels for the new loan originations in both quarters is above the effective coupon being accreted on the acquired first foundation loans. Shifting over to the P&L side, as Neil mentioned, second quarter results were mixed. Bottom line results reflected a net loss of $23 million, or $0.49 per diluted share, with merger-related costs representing $0.94 per share. Our adjusted pre-tax pre-provision net income, or PPNR, which excludes merger-related expenses, was $70 million, or $1.50 per share. That compares to $37.3 million or $1.32 per share in the first quarter. So we're pleased with the growth and core business per share results. Net interest margin was 3.58% in the second quarter, which is a decline from the 4.25% in the first quarter, with the decline significantly influenced by the acquired loan portfolio and higher funding costs. Several moving pieces on the margin side this quarter. I'll start with the timing across all the repositioning actions. All of the loan downsizing via sales occurred in the month of June, so net interest margin for the first two months of the quarter saw compression from the lower stated coupons to these acquired loans. The weighted average stated coupon for the loans sold in June was 3.94%, and to be clear, there was no accretion for purchase accounting marks on these sold loans as they were all held for sale. Similarly, while we reduced high cost deposit balances as a result of the $2.5 billion combined reduction in deposits associated with our repositioning activities, the timing was also spread throughout the quarter. Progress in total cost of deposits during the quarter was impactful as the deposit costs for the month of June were 20 basis points lower than the month of April. Further, when we look at what combined deposit costs would have been for the first quarter of this year, assuming First Foundation was part of our company at that time, then we see a reduction in cost of deposits of 35 basis points, comparing June deposit costs to the first quarter deposit costs. We are quite pleased with bringing down our deposit funding costs in a meaningful fashion like this. Given the timing of all the repositioning activities throughout the quarter, progress in net interest margin is also pretty impactful as it improved 29 basis points comparing June versus April, with June net interest margin at 376 basis points. I know some folks have a specific interest in the component related to the accretion of the purchase accounting fair value marks. To be clear, the fair value marks are the largest component of the TBD dilution in the deal. And the accretion in net interest income is the mechanism to get the loan values back to contractual car. You will find the net impact from fair value market accretion in net interest income in the earnings debt that we filed with the SEC. On the service fee revenue side, we saw growth of 50.7% compared to the first quarter, and it was primarily related to the impact of the acquisition. We experienced organic growth in mortgage revenues and treasury management revenues, while the growth in trust and investment advisory revenue was acquisition-related. Mortgage revenues and wealth revenues on a combined basis account for 62.3% of total service fee revenues in the second quarter. Adjusted non-interest expenses in the second quarter, which exclude merger-related expenses, were up 57% compared to the first quarter, And again, we're primarily related to the impact of the acquisition. As Neil indicated, we are already realizing some significant cost savings following the acquisition closing with an annualized run rate equivalent realized in Q2 of approximately 65 percent of our original total cost save target of 68 million estimated at the announcement date for the acquisition. We are pleased with our progress on cost saves as we are ahead of schedule on phasing so far through the end of the second quarter. On the asset quality side, provision expense for the second quarter was $40.4 million and charge-offs were $42.4 million or 145 basis points. Provisioning and charge-offs were significantly impacted by the two credit events we disclosed in the 8K filing from earlier this month. On the provisioning side, the magnitude of those two credits represented 86% of second quarter's loan loss provision and 82% of our total Q2 charge-offs. The situation involving what we believe to be fraudulent misrepresentations by a borrower in the materials distribution business alone represents 75 basis points of the total 145 basis points in annualized charge-off ratio for the second quarter. Aside from the provisioning for these two larger loan losses we've noted, the remaining $5 million in net loan loss provisioning primarily related to net downgrades. Our level of criticized loans and the non-performing component of criticized loans both increased at the end of the second quarter in comparison to the end of the first quarter. Criticized loans represent 7.7% of total loans compared to 4.3% at 331. And non-performing loans represent 164 basis points of total loans compared to 86 basis points at 331. In terms of activity through the end of the second quarter, I'll note the following. Approximately 76% of the increase in criticized loans relates to the acquired First Foundation loan portfolio. As a reminder, in conjunction with purchase accounting, the entire First Foundation loan portfolio was fair valued at the acquisition date, including in terms of the level of loan loss reserve. The level of loan loss reserve on the entire acquired loan portfolio was assessed at 172 basis points, and the level on just the criticized component was 685 basis points. Considering 76% of the increase in criticized loans relates to the acquired loans, that leaves 24% of the increase relating to legacy Sunflower loans or $143 million in balances. Approximately $94 million of that $143 million relates to non-performing loans, and I'll break that down further in a moment. We've provided some industry breakdowns in the earnings deck on pages 27 and 28 that we filed to highlight the largest drivers of the increase in both criticized loans and the non-performing component of criticized loans. Seven different NAICS categories represent 93% of the total increase in criticized loan balances from 331, with the multifamily component alone representing 60% of that increase. We regraded the entire acquired loan portfolio, and our grades consider the impact of principal and interest amortization, even if a loan is currently in interest-only mode. We believe we've taken a fairly conservative view on loan grades on the acquired book here. The multifamily component of criticized loans at 630 alone represents 3.1% of total loans, or approximately 40% of the criticized total. In general, we believe the LTVs on the multifamily loans support our carrying values, with the weighted loan-to-value for all multifamily-criticized loans being at 68%. On the non-performing side, NPLs increased to 1.64% of total loans, an increase from the 0.86% last quarter. Five different NAICS categories represent 96% of the total increase in non-performing loans at 630, And these same five NAICS categories represented 79% of total NPLs. Looking at these five different NAICS categories for NPLs, the multifamily component is represented by six different relationships. And on a combined basis, this group has a 600 basis point ACL reserve at June 30. We have guarantees in place on approximately 94% of all of our multifamily-criticized loans, so between LTV coverage and guarantees, we believe we have strong support for carrying values, primarily driven by one non-performing loan, supported by a property that has experienced a decline in value, which has thereby necessitated a specific reserve. Three of the five NAICS categories capture C&I businesses in either the information technology space, the transportation space, or across certain professional and technical fields. The total number of relationships represented for each of these three NAICS categories is small, and it's only nine in total. While these C&I companies are all experiencing varying levels of operating shortfalls, several of the larger exposures are supported by private equity sponsors with meaningful equity investments, and we believe those sponsors have the ability to continue to support the borrowers. We also have one NPL that's fully guaranteed by a well-capitalized and profitable corporate entity. In terms of meaningful dollars across these three NPL NAICS, we also have the remaining balance of the technology company that we realized in an approximate $12.9 million charge-off in the second quarter. And again, that loan was charged down to our view of realizable value. So in general, we believe there's stronger sponsor support in many of these cases across these three NAICS categories as companies work through their operating challenges. The other NAICS category in this NPL bucket is the Resi Mortgage Component. And in general, we believe the LTVs here support our carrying values. I'll summarize the level of NPL increase this quarter as being largely concentrated in several larger credits as opposed to represented by widespread stress across many borrowers across the loan portfolio. Additionally, we believe we have adequately reserved for potential loan losses through our loss assessments on the Legacy Sunflower Portfolio, wherein we realized a 15 basis point increase in the level of reserve compared to 331 and via the loss assessments completed in conjunction with the purchase accounting work on the acquired loan portfolio. wherein we did increase the level of reserve by 49 basis points above the level in the legacy first foundation balance sheet at 331. In total, the level of ACL at 630 was at 150 basis points, and that's up from 120 basis points at 331. On the capital side, TBD per share was $35.16, cents down almost nine percent from 331 as we noted in in the earnings presentation yet dilution from the acquisition was at approximately 10 percent down from the estimated 14 percent at announcement the lesser level of tbd dilution from the acquisition is attributable to a lesser overall level of estimated total merger related expenses and a better overall level of net fair value impacts compared to original estimates, with the net fair value impacted primarily by better performance on the loan downsizing and higher values on resulting tax assets, including the acquired NMLs. Our capital ratios, while down from the higher levels at 331, remain quite strong. The CET1 at 11.95%, total risk-based capital at 14.13%, and Tier 1 leverage at 9.47%. Our capital priorities are focused on supporting organic growth, looking forward, as well as supporting share buyback activities. To that end, and as Neil noted earlier, just yesterday we announced a share repurchase program totaling up to $150 million, with repurchases targeted over the next four quarters starting in August. Our capital priorities are currently based on our company-wide risk assessments and risk aptitudes and are calibrated in our plans with maintaining an 11% minimum targeted operating level for CET1. Next, I'd like to make some comments on our full year 2026 financial outlook, including the fourth quarter. You should also refer to page 24 in the earnings presentation deck for important key assumptions. On the balance sheet side, for loans, we expect low single-digit balance growth compared to Q2 period end through the end of the year, and then we expect mid-single digit growth as we look to next year. While we expect healthy new loan origination levels, we also expect to continue to remix the acquired First Foundation loan portfolio. This means we will have additional balance runoff pressure. In terms of the acquired multifamily loan portfolio and near-term scheduled repricing, we expect up to an estimated $100 million in balance runoff in the second half of this year and up to an estimated $285 million in balance runoff in 2027. Our focus in the multifamily book will be on keeping true relationships rather than where it's simply a credit-only situation. To us, credit-only is not a value relationship, and this is where we want to continue to refocus the portfolio. But again, in total, as we look to next year, we expect mid-single-digit balance growth. In terms of deposits, given our continued focus on remix of the acquired balances and scheduled maturities of broker deposits, We also expect low single-digit balance growth through the end of the year compared to Q2 period end, and then expect mid-single-digit growth as we look to next year. We have approximately $300 million in brokered maturities coming during the second half of this year with a weighted rate of 4.77% today on those $300 million in brokered maturities. And we have another approximate $340 million in brokered maturities coming in 2027 with a weighted rate of 4.83% on those brokered maturities. So we believe we will see some repricing benefit ahead in the brokered deposits. In terms of wholesale funding ratio percentage, as I noted earlier, at the end of Q2, our ratio was relatively in line with our historical legacy F-Sun percentage levels, and that's our expectation. On the NIMS side, as I noted earlier, the timing of all the repositioning in Q2 had a significant impact on margin, as we saw margin increase 29 basis points from the month of April to the month of June. with the month of June finishing at 376 basis points. Our focus is on continuing to improve our cost of funds, as we believe it will be the primary driver of our margin improvement over the second half of this year. We expect to see margin increasing slightly in the third quarter from our June margin level, with a further increase into the mid-380s in the fourth quarter. We expect to see this margin trend continuing into the first quarter of 2027, where we expect to be in the high 380s range. In terms of revenue mix for both the full year and the fourth quarter of 26, we expect our level of non-interest income to total revenue to be in the low 20s. In terms of adjusted efficiency ratio, which excludes merger-related expenses, we expect to operate in the mid to low 60s range in the second half of 26, with the fourth quarter expected to be in the low 60s. We expect additional cost savings to be realized in the fourth quarter following our core system conversion scheduled for the end of September, which we expect to result in an efficiency ratio in the first quarter of 27 in the high 50s to low 60s range. In terms of net charge-offs to average loans, as we noted in our 8K filing earlier this month, we expect the charge-off level for the full year to be in the high 50s range in basis points. Looking at the math, that translates to an expectation of an annualized charge-off level of mid-teens for the second half this year to get to that full year level in the high 50s range. Further, we expect the ACL to loans to be in the mid-140s to 150 basis point range for the full year. We believe we'll return to a more normalized level of charge-offs to average loans looking forward into 2027, which we'd expect to be in line with the projected 4Q26 level. We are pleased with the significant progress that we've made on integrating the First Foundation business so far, and we believe the combined earnings profile will further emerge in Q3 and then further again in Q4 following the late September core system conversion as our NIM and efficiency ratios stabilize in the normalized range we expect to operate in. We believe this earnings profile is taking the shape of what you have been accustomed to from Legacy First Son. I will now turn the call back to the moderator to open the line for questions.
Operator
We will now begin the question and answer session. If you would like to ask a question, please press star 1 to raise your hand. To withdraw your question, press star 1 again. We ask that you pick up your handset when asking the question to allow for optimum sound quality. If you are muted locally, please remember to unmute your device. Please stand by while we compile the Q&A roster. Your first question comes from the line of Matt Olney with Stevens. Matt, your line is open. Please go ahead.
Hey, thanks. Good morning. I appreciate you taking my question. You mentioned that much of the downsizing strategy occurred towards the end of the quarter in 2Q. Any more color on the average earning asset outlook for third quarter as it compares to, I think that 2Q number was closer to $16 billion? Any color there?
Yeah, I'd say on that, that we, you know, in terms of our guidance on low single digit growth from a period end perspective, I guide you to the same on an average basis. On the lower end of low single-digit growth, if you're looking at average versus the third quarter, average versus a Q2 month end, and through the end of the year. So low single-digit growth on both a period end and an average basis compared to the period end of Q2 is your range.
Okay, appreciate that, Rob. And then as far as the margin improvement, the back half of the year relative to what that June margin was that you disclosed, I think you mentioned much of that would be on lower cost of funds. Any more color on this? Is it just going to be working down the broker deposit balance and replacing that with core, or do you plan to just replace the higher cost brokered with some more current broker deposits? it's just any color on that, on that strategy.
Yeah, absolutely. And yes, you're right. Given the timing on the downsizing, you know, the margin picture for each of the three months in the second quarter was dramatically different, you know, where we landed at 376 in the month of june so you know as as i referenced you know we do see um you know looking out to certainly the fourth quarter on the margin side you know we do see that margin picking up um and um you know i you know as i mentioned you know mid 380s for the fourth quarter cost of funds is is where we see um outsized potential for continuing to improve that certainly bringing down um those brokered rates where you know which are at the 480 level um it is going to be a meaningful impact and certainly some remix if you will with you know call it normal core deposits versus brokered i think the overall level of wholesale um you know in terms of wholesale funding ratio as i mentioned. Where we landed at 6.8% is pretty in line with our historic F-Sun levels. I'd expect that to come down just a little bit, which is a little bit more of that remix, which is going to favorably impact that margin, as you were kind of highlighting in your question, Matt.
Okay. Thanks for color. I'll step back.
Operator
Your next question comes from the line of Michael Rose with Raymond James. Michael your line is open please go ahead.
Hey good morning guys thanks for taking my questions. I just wanted to go back to credit. I appreciate all the color that you walked through Rob. I guess the the bigger question is you know when I look at slide 28 you know you did see kind of four first son or legacy first son criticized loans increase about 50 percent on balance basis and I certainly understand that you explained some of those a good portion of that is NPLs but when I look at slide 28 you know almost every category except for one was up sequentially I guess the real question is you know how should investors you know feel comfort that you have kind of the underwriting process under control you know we have seen some larger charge-offs here over the past couple years and many others haven't seen similar types of events you know have you guys done or started the process of a third-party credit review just just trying to get a better appreciation of you know how investors can be comfortable that you have the portfolio under control that losses will normalize because they have been elevated now for you know past couple of years relative to peers so I know there's a lot in there but just just looking for some some color yeah Michael this Neil appreciate the question certainly understand it you know we we don't like losing money any better than anyone else the you know a couple things i'd say um we we're more of a cni lender than a lot of peers so
i think we've often said ours is going to be lumpy um and the reality is we have no loans anywhere close to our legal lending limit and we take concentration seriously so I'd say if you look at by category we don't have large dollar exposures to any of people's worry points we've not changed any of our underwriting approach we've always been pretty thoughtful about it You know, things do happen in this size credit space, but I would say we constantly go back and look by industry, and we look at them side by side to try to compare what's going on. You know, once a quarter, we do some deep dives in those categories. It's just, you know, the uncomfortableness is that it's hard to forecast when an operator tips over. Now, is that indicative of a bad process? No, I think it's an indicative as our portfolio has matured. We don't see it coming in one geography. We don't see it happening in one industry. You know, it's not we did something wrong in a, you know, whether it's SAS or data centers or NDFI, you know, you look at all those categories, we don't come away going, gee, we shouldn't have done that. it's it's really um you know borrower driven um we've tried to get on top of it and and look at it and we constantly challenge ourselves to say is there something we're missing so you know honestly we've we've looked hard at this multiple times um and you know i think we're trying to be as clear on our exposure in areas so that people can look at it. It's not something we run from. We are a big lender, and that's the piece of the puzzle that we've been at it. Like I said, I can't say, hey, we stepped in it here. We, in general, take smaller size positions than banks of our similar size. We see that constantly. But I think we also have – we've looked top down at concentrations and never came away going, gee, we don't want to lend anymore to that segment.
I don't know, Jennifer. yeah and i would just underscore um one item there thank you for the question michael um that neil emphasized earlier and that is the nature of our business it is different than a lot of those you know in our size category um so of course we're always looking at our credit performance and everything there as neil described you know we also look at excuse me you know, what we reference is credit adjusted NIM, which, you know, we believe actually adjusts out for difference in mix between, you know, CRE and CNI to give another economic measure. So, you know, credit adjusted NIM is something else we look at from a performance standpoint that I would also emphasize is something that we, you know, look at from a relativity standpoint. I know our credit adjusted NIM is above. So our charge off has been above, but our credit adjusted NIM is also above those peer levels.
Yeah, so this is Jennifer. I agree with obviously what everyone said. We've taken deep dives in to look at these in terms of process.
You know, the other just of note that Rob mentioned earlier is it's a limited number of makes and a limited number of loans within those so um yeah that would be my point and obviously in conjunction with the diligence that we both did in the merger we did have a third party go through our portfolio you know as did the first foundation okay i appreciate all the uh all the color and the discussion um rob maybe just one clarification going back to the customer service expense i just want to make sure I understand it.
So I think what happened here is, you know, you ran off those deposits, which resulted in kind of a lower or smaller balance sheet, lower reported NII, but also lower operating costs. So I think those two kind of net out. Is that kind of the way to understand it?
That's exactly right, Michael. And, you know, we ultimately don't know where some of our, if you will, negotiations are going to go with some of these larger, higher rate depositors. There's certainly First Foundation had some larger, higher rates in this NIV category that had economic costs, just like we see coming through interest expense, but it's down to customer service and very high rate. And we presented where we would come out on rate. And, you know, some of those just, you know, aren't going to work out. And so we saw hundreds of millions, and that was, you know, part of our high-rate runoff. And those are rates above, you know, above overnight Fed. I mean, they're high rates. So, you know, it's a good trade, but you're right. There was – we took on more shrink in the second quarter. You know, essentially, you know, I characterize it a little bit as we fast forwarded some of the activity that, you know, we're going to continue to tackle throughout the remainder of 26 in the second quarter. I mean, obviously, we tackled a lot with all the downsizing, but we were tackling, you know, those conversations as well. And so that's ultimately, you know, as you kind of link back up to, you know, where our growth expectations on the balance sheet are through the remainder of the year as well. But, yes, on the deposit side, that geography can get a little overlooked at times by folks in terms of for some of these banks. But, you know, we've never had this customer service aspect buried in our NIV. But, you know, we did acquire some of that and we've taken a good chunk out of it already.
Okay, very helpful. And then just the last follow-up is, you know, in light of that, and maybe back to Matt's question, how should we think about NII growth in the back half of the year? And then just based on the earlier cost savings, is the $5 plus EPS target for next year still in play?
Yeah, I mean, I think, you know, on the margin side, you know, as I mentioned earlier, You know, we expect to be for in the fourth quarter, you know, back to be, you know, in the mid 380s on margin, you know, with with with our projection on the asset side, low single digit. You know, that's going to get you to fairly stable on an absolute dollar amount in NII. It'll be up, you know, slightly in Q4 over Q2. um but again those are if you will the the math behind those those two pieces um just in terms of our nii expectation there and i don't think we've changed our guidance yeah and in terms of uh you know looking forward at 27 um you know i i think with you know with with with the balance sheet growth that we referenced with the net interest margin you know that we referenced and i think as you as you look at you know our expectations on credit um and efficiency ratio um you know i actually think um you know combined with with with expectations on the share buyback side um you know i i think we're north of a of a flat five uh but yeah we're very optimistic of of looking, you know, into 2027 and performance there.
Yeah, I would just say, Michael, you know, certainly the second quarter was plenty busy, you know, with the hard work of this integration. Obviously this quarter we have the computer conversion, so we've got, you know, whole teams working on that. we also recognize we're not done on the cleanup of First Foundation and now the credit piece of the story. So I promise, you know, the reality is we know we had work to do when we bought First Foundation and we're not shy about rolling up sleeves and quickly tackling it. That's what you can expect us to do. And, you know, I think we're still, there's nothing we've discovered that makes us believe that the profile of the underlying franchise is completing the playbook that we've strategically set out to build across the Southwest. We now have a meaningful presence in Southern Cal. We obviously added a piece in Southwest Florida. But to us, driving core deposits, you know, some banks get distracted away from that. That's our everyday job. We think the fee income story here is a strong one and getting better. And so I have often said I love the the flexibility that this balance sheet and franchise gives us to not only grow organically but to navigate whatever interest rate or or economic profile i think we're in good shape recognizing we still have work to do all right thanks i'll step back appreciate all the call absolutely we have reached the end of the q a session i will now turn the call back to neil arnold for closing remarks we thank you all for joining us this morning as always we appreciate your interest in continuing to uh to follow us so thank you this concludes today's call Thank you for attending.
Operator
You may now disconnect.