Operator
Thank you for standing by. My name is JL and I will be your conference operator today. At this time I would like to welcome everyone to the Herc Holdings Inc. fourth quarter and full year 2025 earnings call and webcast. All lines have been placed on mute to prevent any background noise. After the speaker's remarks, there will be a question and answer session. If you would like to ask a question during this time, simply press star followed by the number one on your telephone keypad. If you would like to withdraw your question, simply press star one again. I would now like to turn the conference over to Leslie Hunsucker, Head of Investor Relations. You may begin.
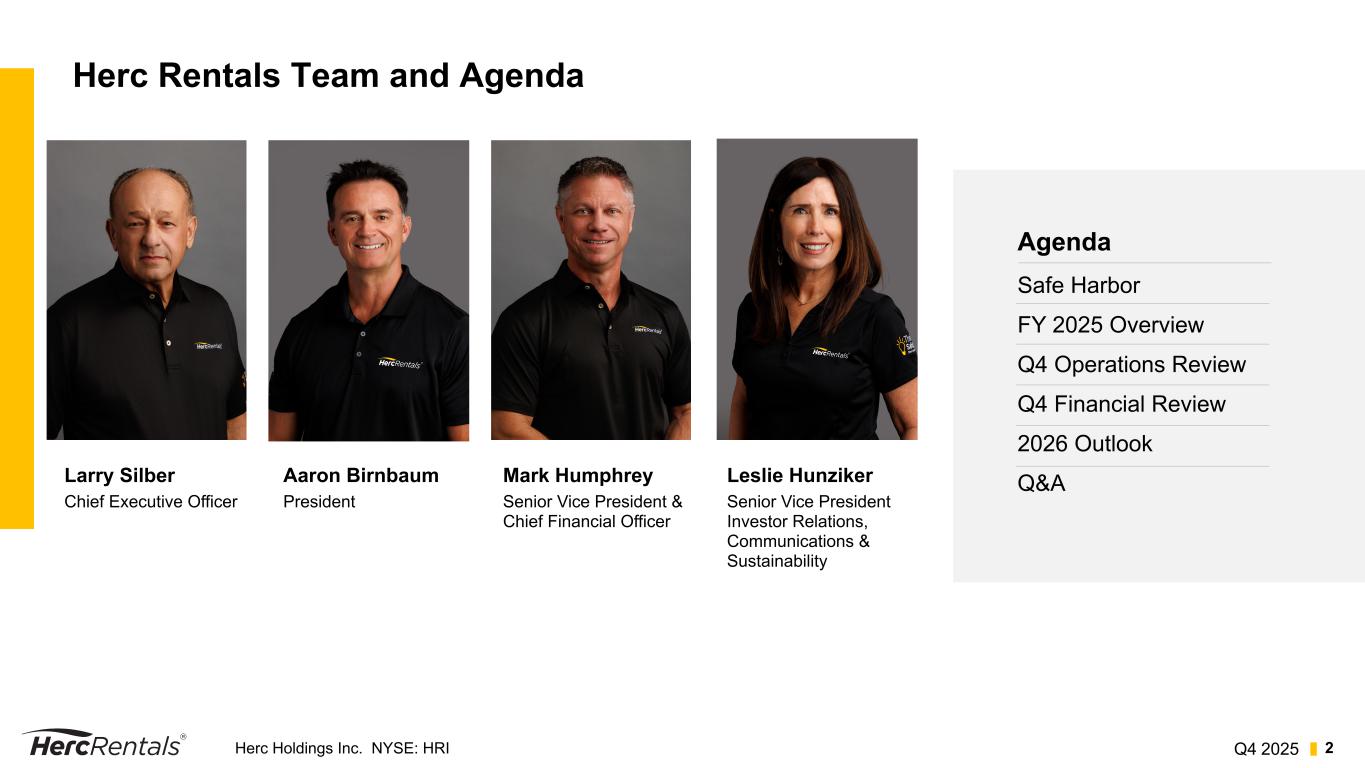
Thank you, Operator, and good morning, everyone. Today we're reviewing our fourth quarter and full year 2025 results with comments on operations and our financials, including our view of the industry and our strategic outlook. The prepared remarks will be followed by an open Q&A. Let me remind you that today's call will include forward-looking statements. These statements are based on the environment as we see it today and are subject to risks and uncertainties that could cause actual results to differ materially from our expectations and projections. These risks and uncertainties include, but are not limited to, the factors identified in the press release and our annual report on Form 10-K, as well as other filings with the SEC. Today, we are reporting financial results on a GAAP basis. This includes H&E results for June through December of 2025. In addition, we'll be discussing non-GAAP information that we believe is useful in evaluating the company's operating performance. Reconciliations for these non-GAAP measures to the closest GAAP equivalent can be found in the conference call materials. Finally, please mark your calendars to join our first quarter management meetings at the Barclays 43rd Annual Industrial Select Conference and Citi's Global Industrial Tech and Mobility Conference in Miami tomorrow and Thursday. Then we'll be back in Miami on March 3rd for the JPMorgan Leverage Finance Conference. And last, we'll be attending the JPMorgan Industrials Conference in Washington, D.C. on March 17th. This morning I'm joined by Larry Silberg, Chief Executive Officer, Aaron Birnbaum, President, and Mark Humphrey, Senior Vice President and Chief Financial Officer. I'll now turn the call over to Larry.
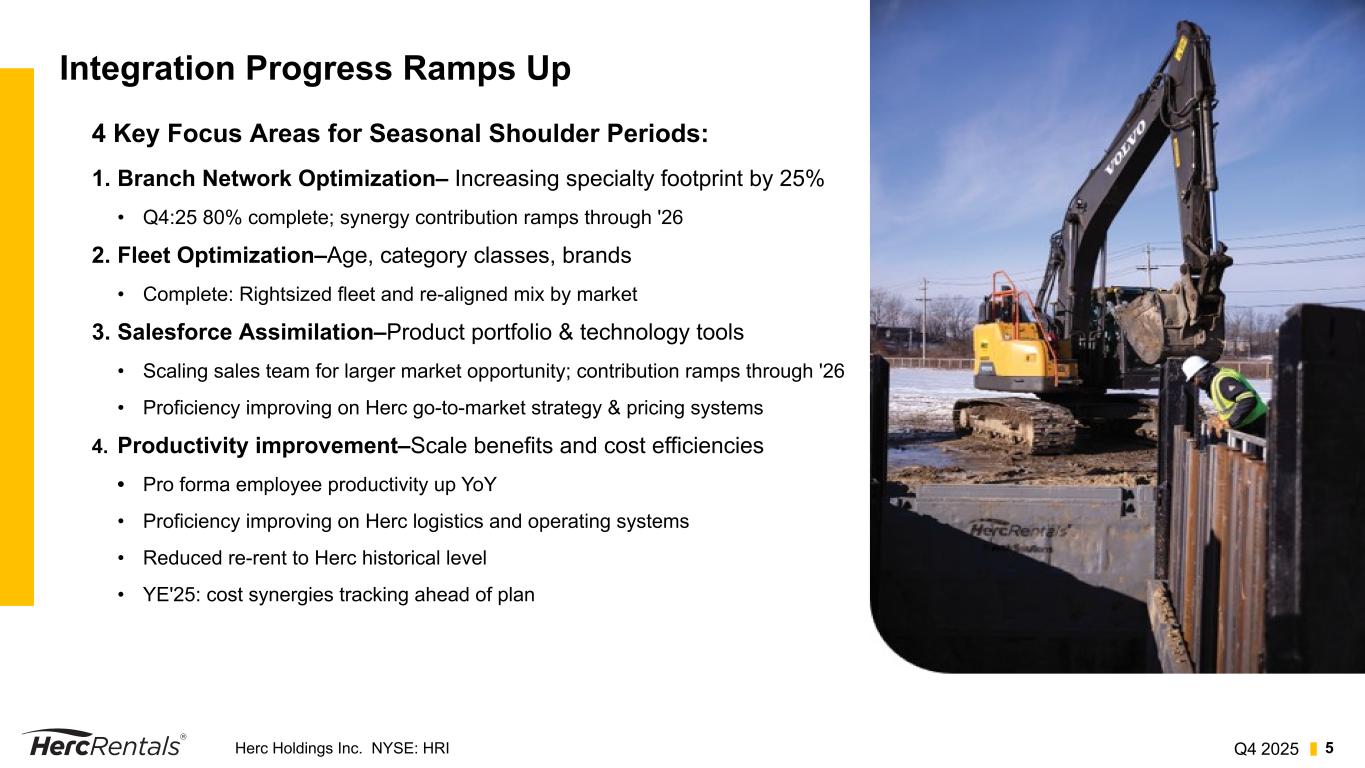
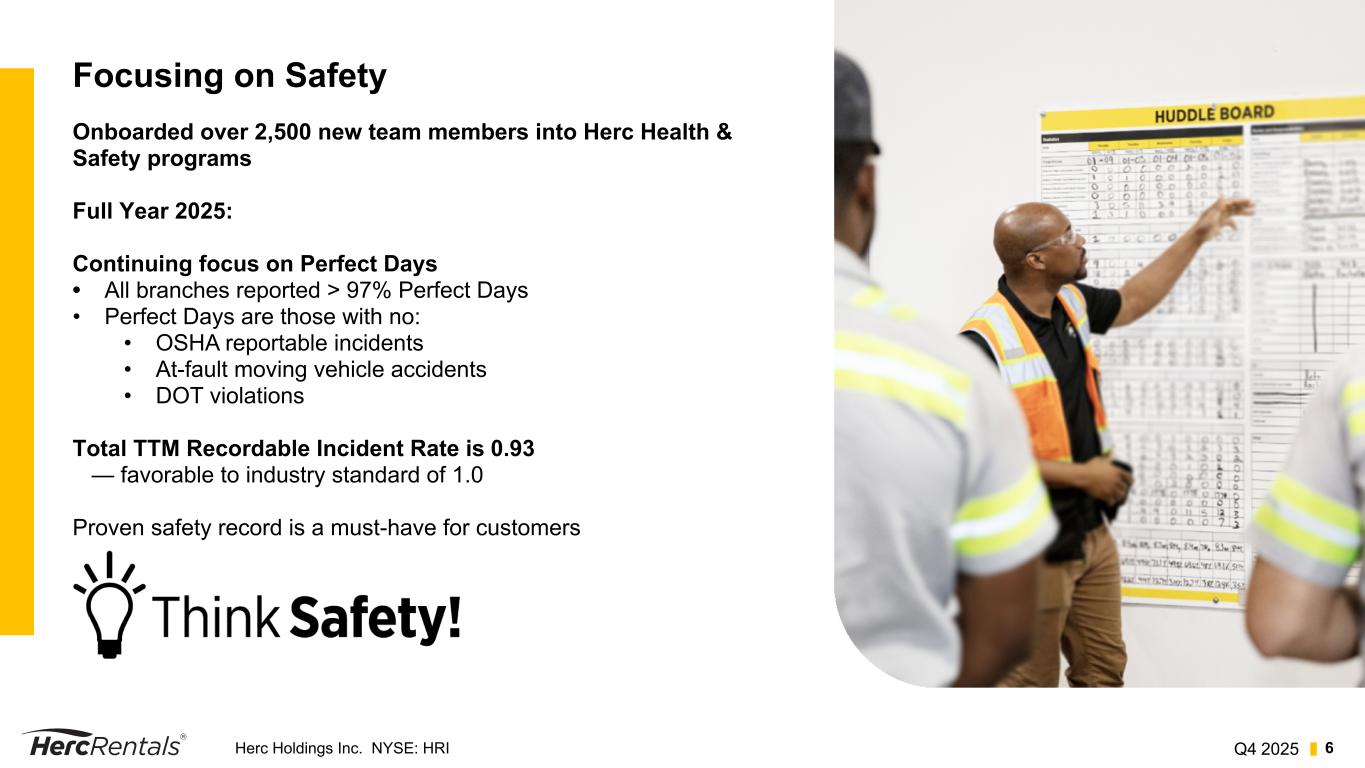
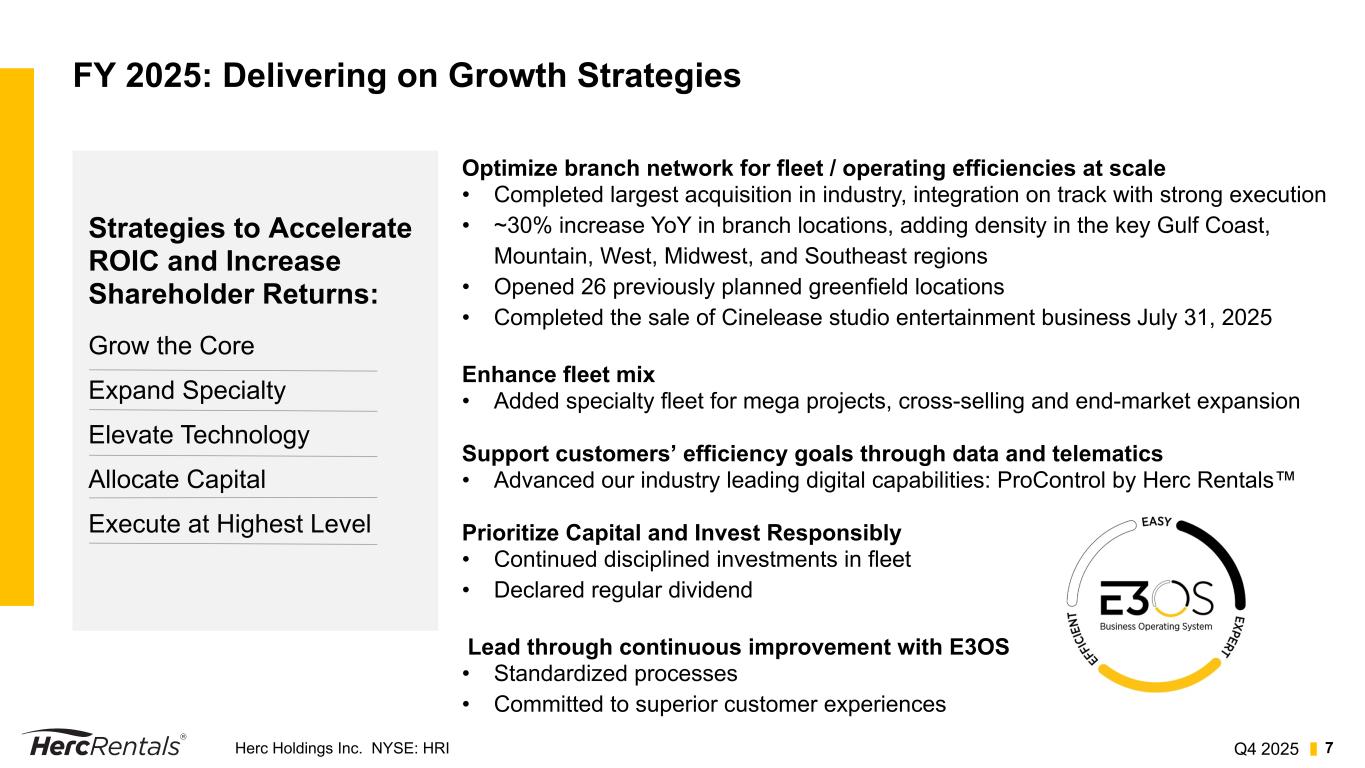
Thank you, Leslie, and good morning everyone. 2025 was a truly transformational year for our company. In June, we completed the largest acquisition in our industry's history, a milestone that expands our scale, strengthens our capabilities, and accelerates our long-term growth strategy. From day one, our focus has been on thoughtful integration, moving with urgency where it matters while remaining disciplined in preserving the strengths of both organizations. I'm extremely pleased with how well the collective Team Herc has executed against our integration priorities in the eight months since closing. Employees across the company stepped up with extraordinary effort and commitment. Successfully integrating a transaction of this size while continuing to serve customers at the highest levels requires focus, collaboration, and execution, and our teams have delivered. The integration action taken in the fourth quarter further bolstered the critical work done in the third quarter where we expanded our field operating structure to ten US regions adding key leadership roles to ensuring operating continuity and scalability completed a comprehensive sales territory optimization exercise to restructure coverage and transition the acquired branches under her technology stack in record time as you can see on slide five, during the fourth and first quarter seasonal shoulder periods, we've continued our focus on four key priorities to complete the integration of the acquired assets. This work positions us to ramp into peak season from a new, stronger foundation, allowing us to execute more effectively and drive accelerated growth in the back half of the year. First, the branch network optimization. One of our core integration priorities is expanding specialty solutions capabilities across a combined network to support the cross-selling opportunities created by the acquisition. We've made great progress selectively consolidating general rental equipment within facilities in the same market to open up space for standalone specialty branches, while in other general rental locations, we're adding specialty fleet to expand branch capabilities. Through For these actions, we'll increase the number of stand-alone or co-located specialty branches by approximately 25%. As of the fourth quarter, we've completed 80% of the planned branch optimization, which will be finished next month. Integrating the fleet was another critical milestone following the acquisition. Right out of the gate, we began a comprehensive restructuring of the combined assets, addressing size, age, category classes, and brands to ensure alignment with customer demand and market opportunities. By year end, the fleet was realigned with the right equipment in the right locations. This positions us well as we move through 2026 with a stronger product portfolio and enhanced flexibility while setting us up to be able to improve time utilization as we scale our sales force and as demand evolves seasonally across regions and end markets. Along that vein, Salesforce assimilation is showing good progress. Integrating the sales organization has been a major focus since the transaction closed. We've been scaling the sales team to align with larger market opportunity while investing in training, leadership support, and deeper adoption of our CRM systems, sales models, and our broader fleet offerings. We're now seeing improvement in proficiency across the go-to-market strategy and pricing systems, which is beginning to translate into more consistent execution, better customer engagement, and early cross-selling success. Productivity improvement and cost efficiencies across the entire organization are the fourth area of focus. By operating from unified systems and aligning to standardized processes, we're already recognizing meaningful results. On a pro forma basis, employee productivity increased year over year in 2025. New team members across the organization are becoming more adept on our logistics and operating systems, resulting in more consistent execution. And we're leveraging HIRT's broader fleet offering to capture synergies by reducing external sourcing and bringing re-rent activity back in line with our historical levels. As a result of these actions and the progress we've made in eliminating redundant costs, optimizing procurement, and streamlining corporate functions, cost synergies are now tracking ahead of plan. On slide six, equally important to our integration success is our unwavering commitment to safety across the combined organization. Safety is at the core of everything we do, and as an immediate priority, we onboarded 2,500 new HIRC team members into our health and safety program in the second half of last year. Our major internal safety program focuses on perfect days, and we strive for 100% perfect days throughout the organization. In 2025, on a branch-by-branch measurement, all of our operations achieved over 97% of days as perfect. Also notable, our total recordable incident rate remains better than the industry benchmark of 1.0, reflecting our high standards and commitment to safety of our people and our customers. As we continue to work through the integration of H&E, we are following the same playbook that has served us well over time, positioning the business to perform across the cycle and generate sustainable long-term growth. while there's still work to do the progress we've made to date gives us confidence that the combined company is on track to deliver the operational and financial benefits of a large-scale acquisition while accelerating our strategic growth plan which is summarized on slide seven over the course of the last year we made meaningful progress expanding our footprint through the acquisition and strategic greenfield openings adding scale and gaining share in key geographies. We also continued to direct a greater portion of our gross capital investment toward higher return specialty fleet, supporting revenue synergies and advancing our goal of increasing specialty as a percentage of our total fleet. At the same time, we strengthened our digital capabilities to maintain our market leadership in innovation and support of our customers' productivity. Our digital revenue grew by more than 50% last year, with HercRentals.com giving our customers an easy way to reserve gear 24-7. Our acquired customer base has full access to ProControl and is already using it to order equipment, manage fleet, and handle account activities. And when it comes to telematics, today approximately 80% of eligible gear is equipped, providing utilization and performance metrics to help reduce downtime and drive job site efficiency all visible within our pro control system further our e3os business operating system continues maturing helping to drive greater consistency and efficiency across the organization for our customers throughout all of this capital discipline remains a management imperative we are investing responsibly prioritizing returns and strengthening the foundation of the business while integrating a transformational acquisition and sharpening our strategic focus now i'll turn the call over to mark we'll take you through the recent financial performance and 2026 guidance and then aaron will talk about macro trends and operating initiatives supporting our growth plans for this year mark thanks larry and good morning everyone i'm starting on slide nine with a summary of our key financial metrics.
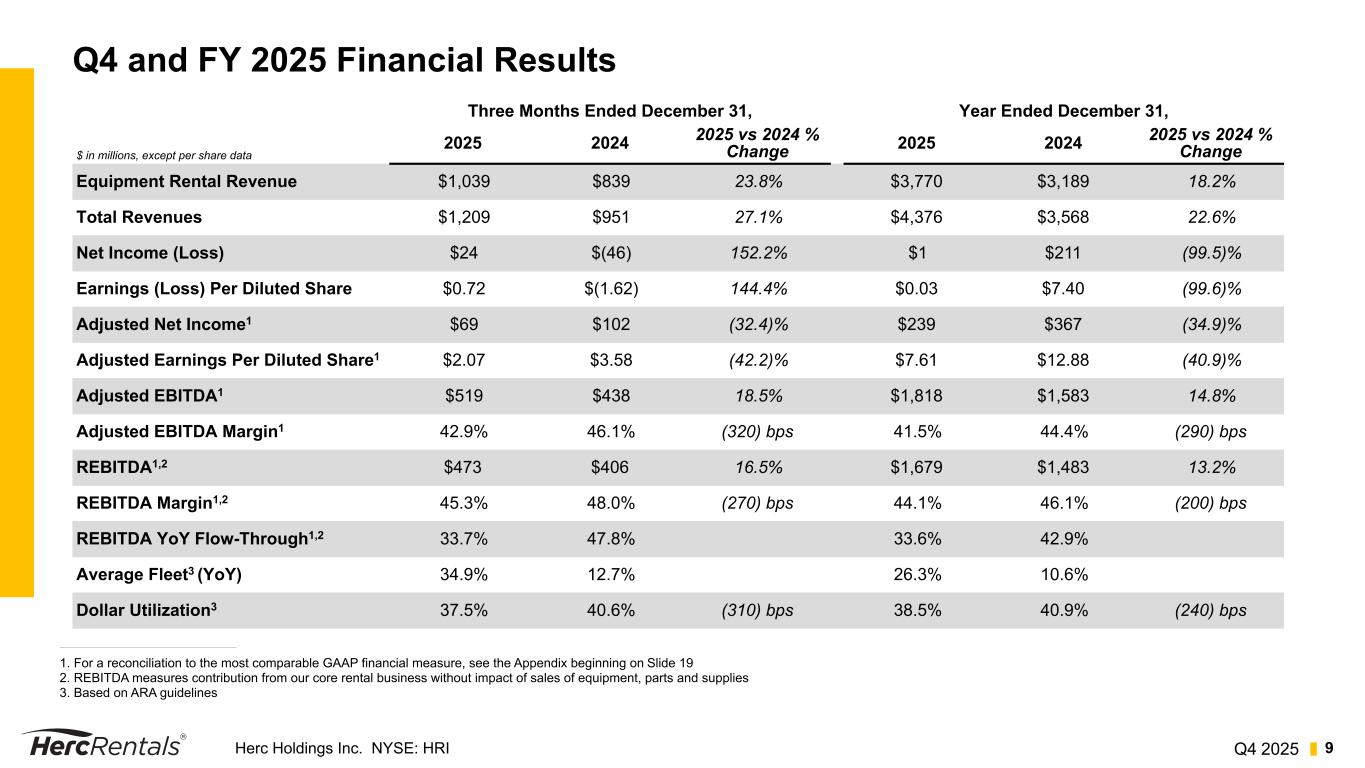
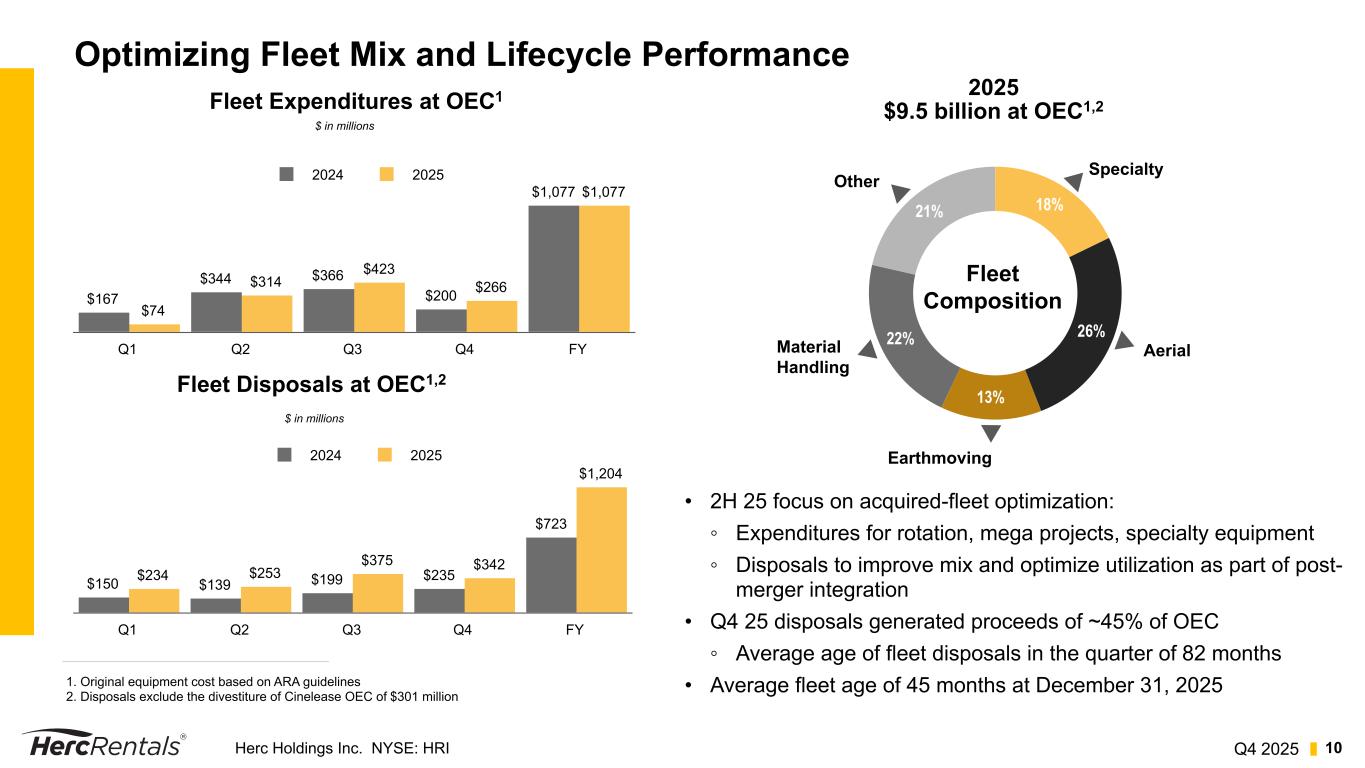
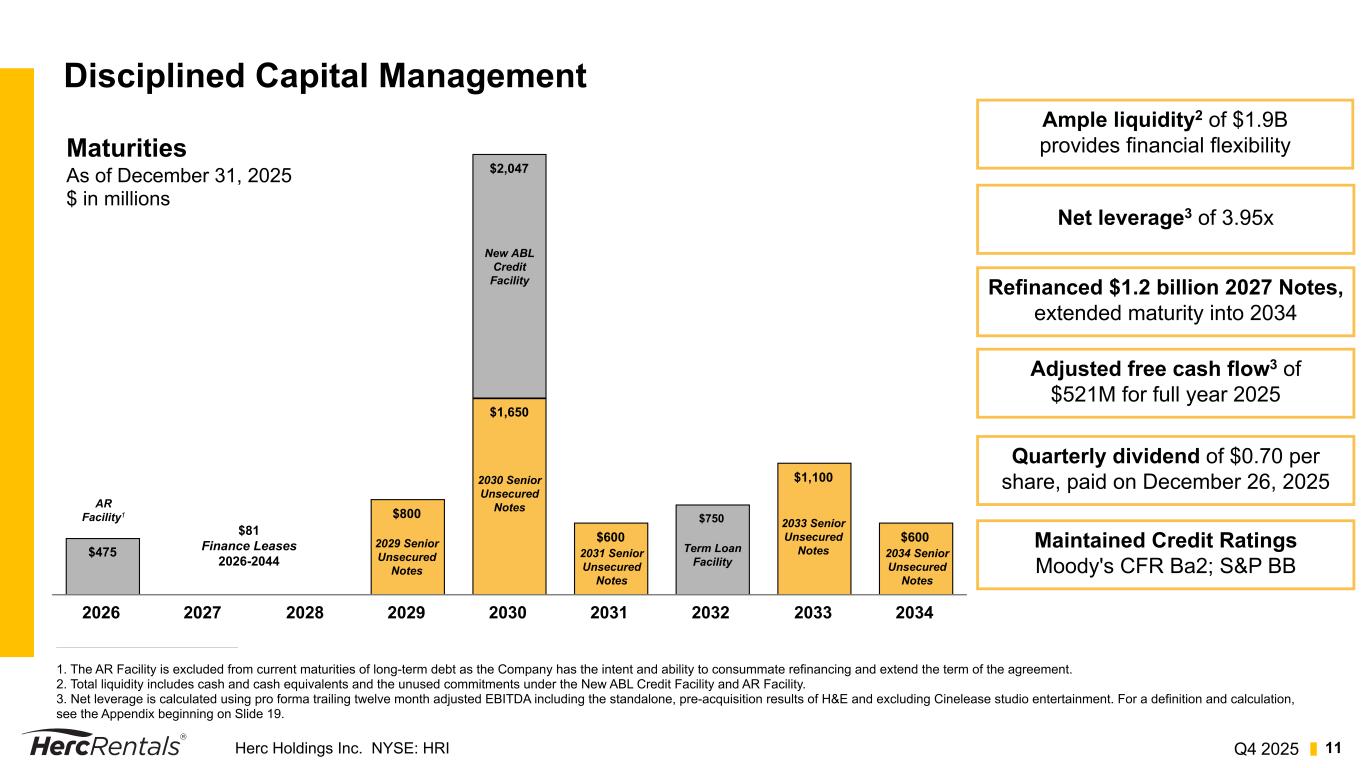
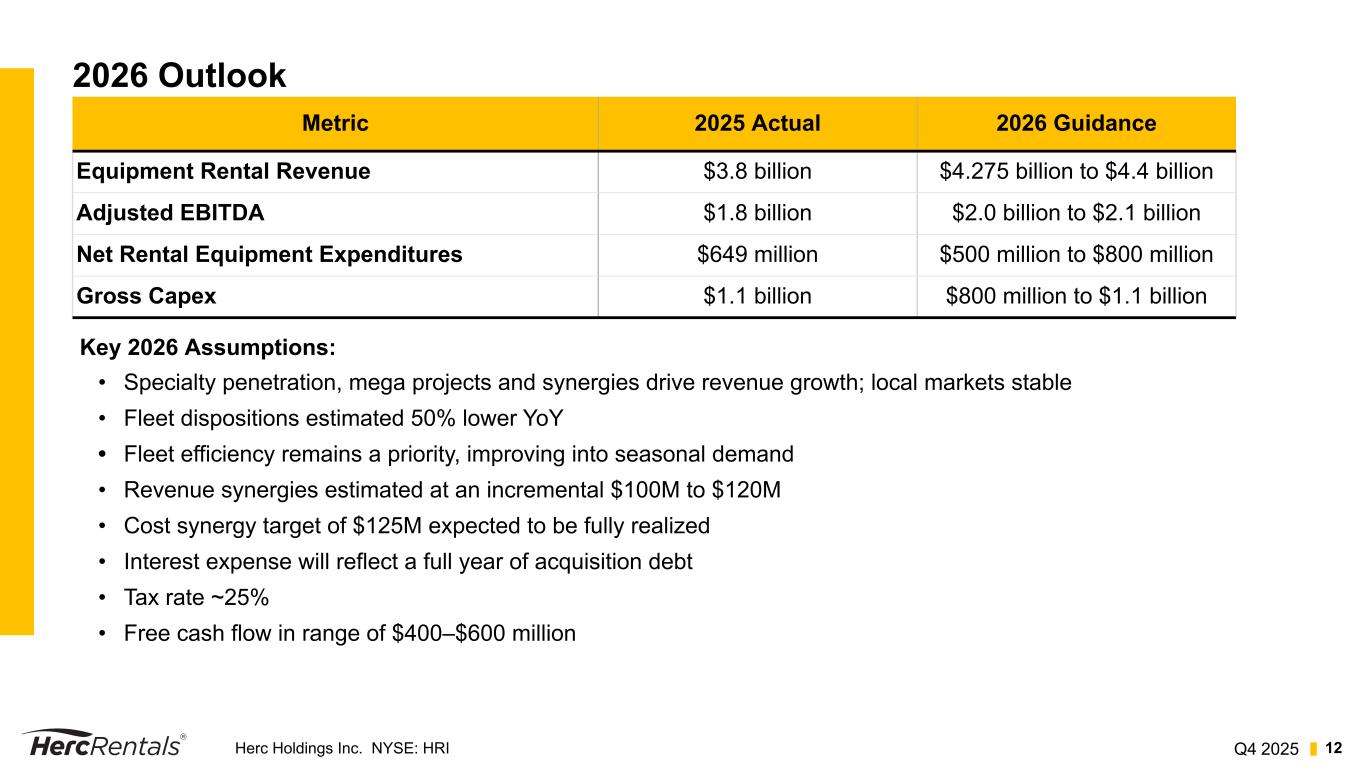
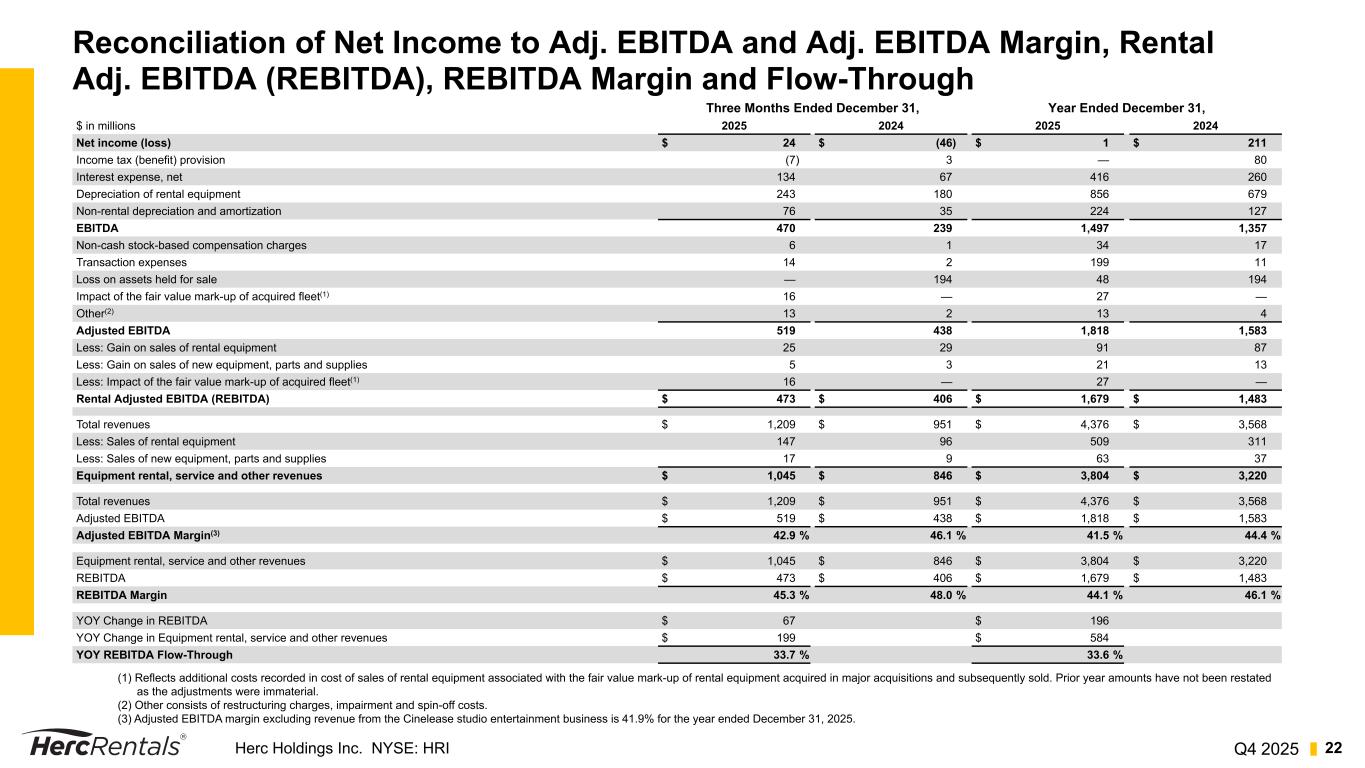
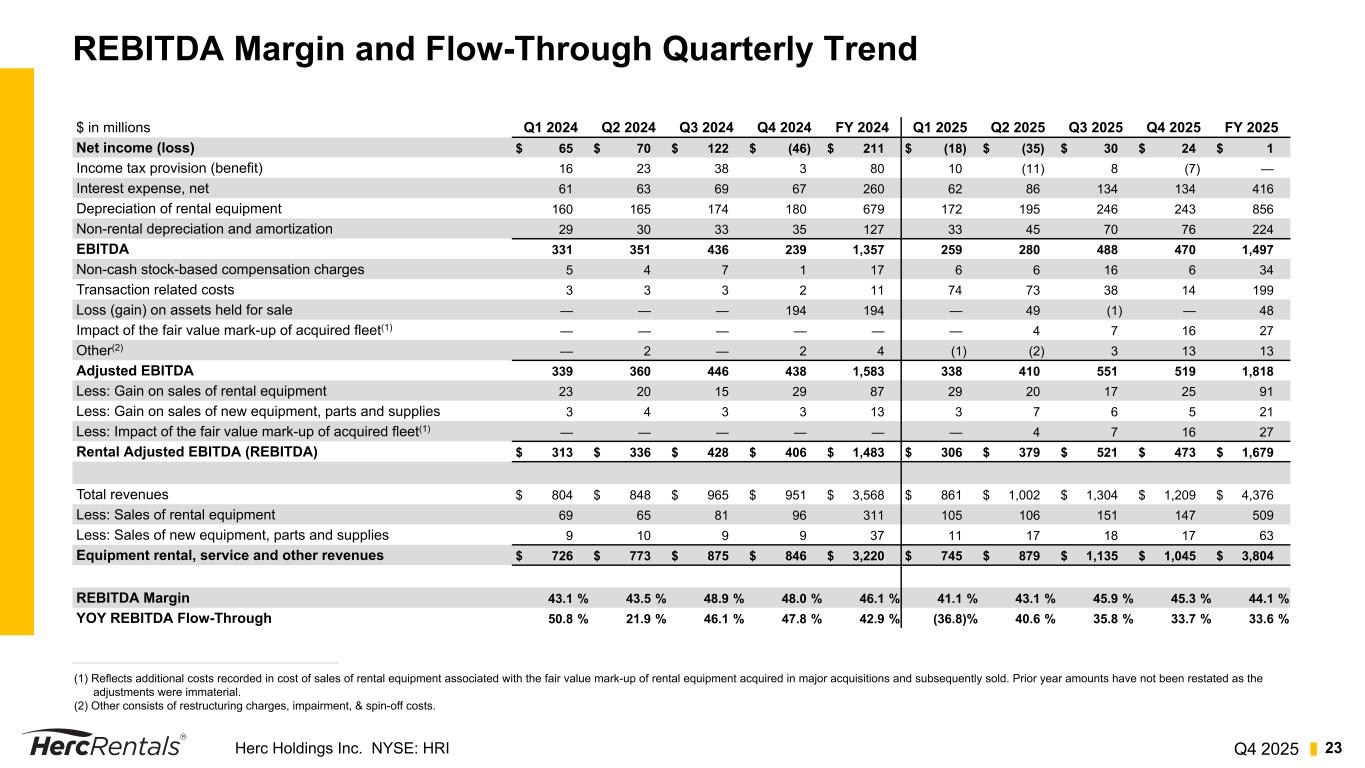
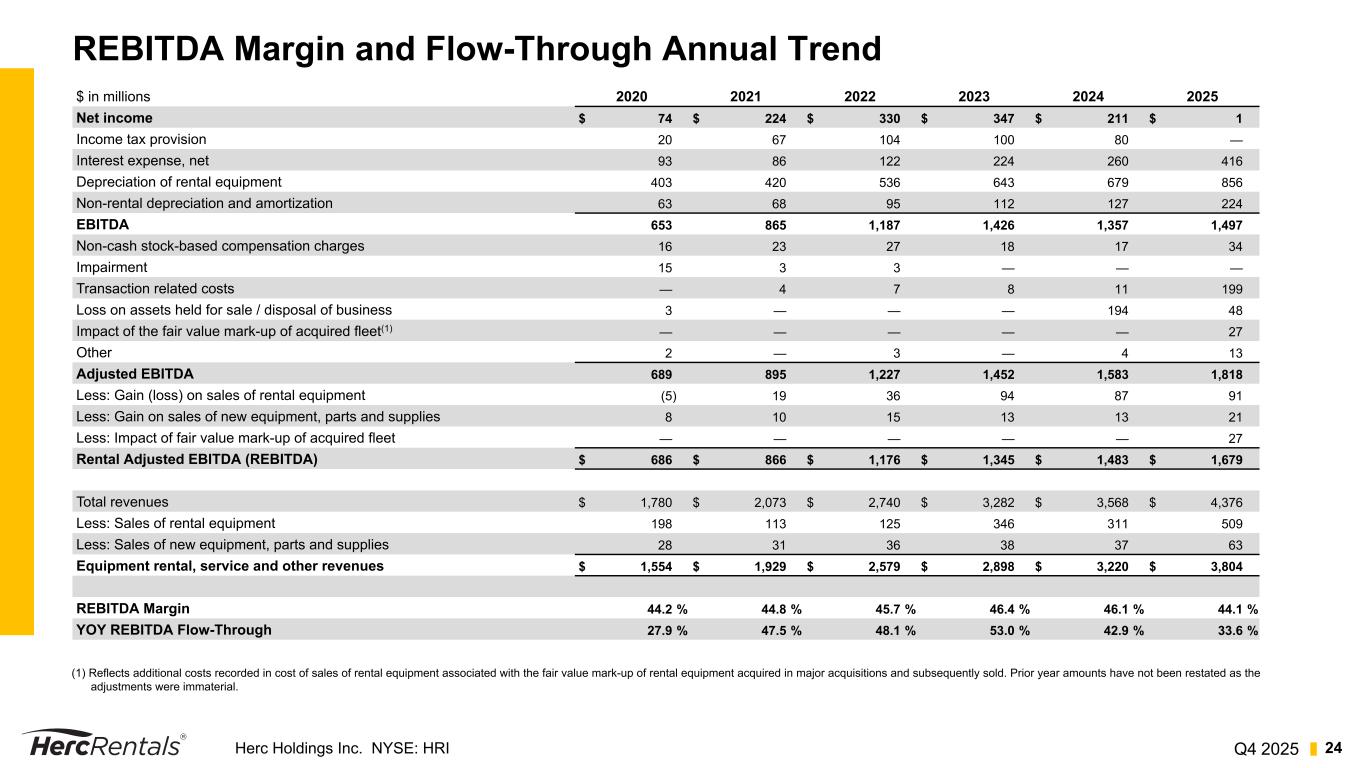
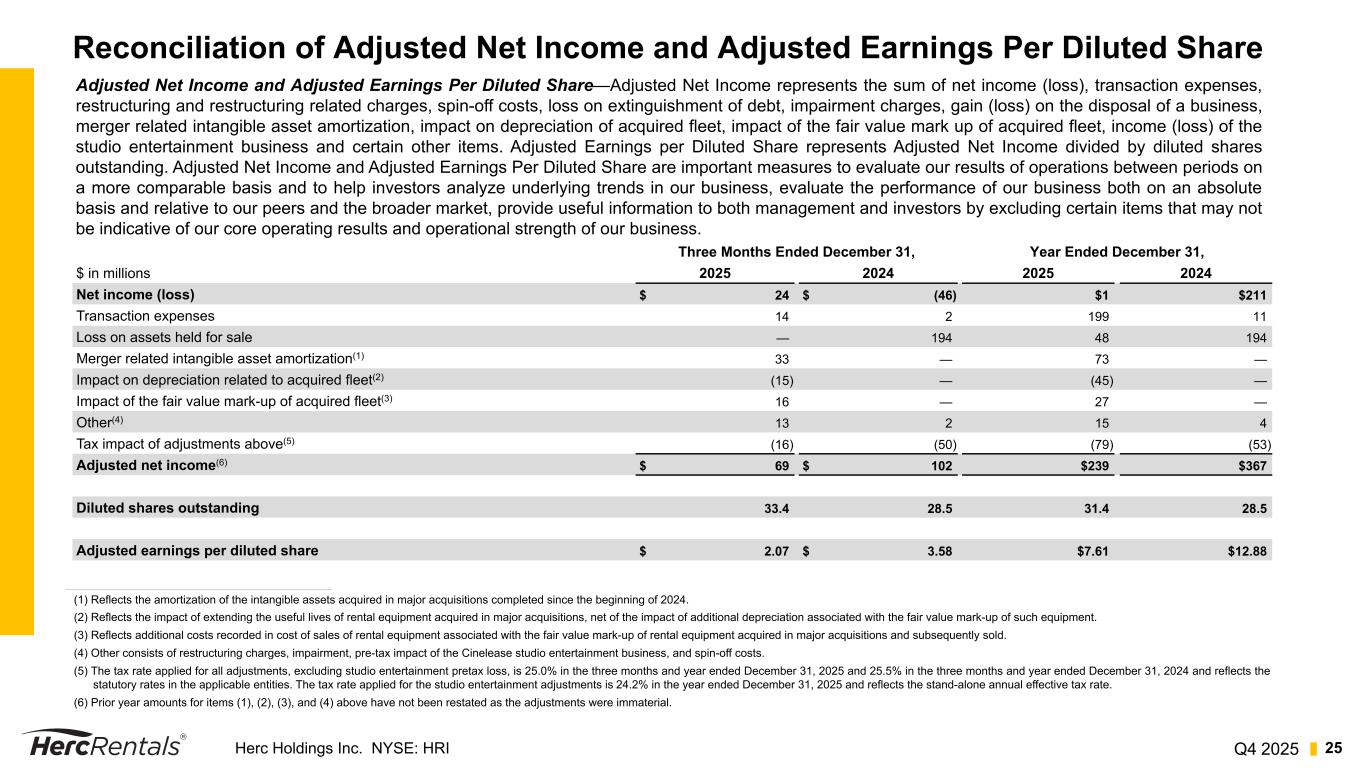
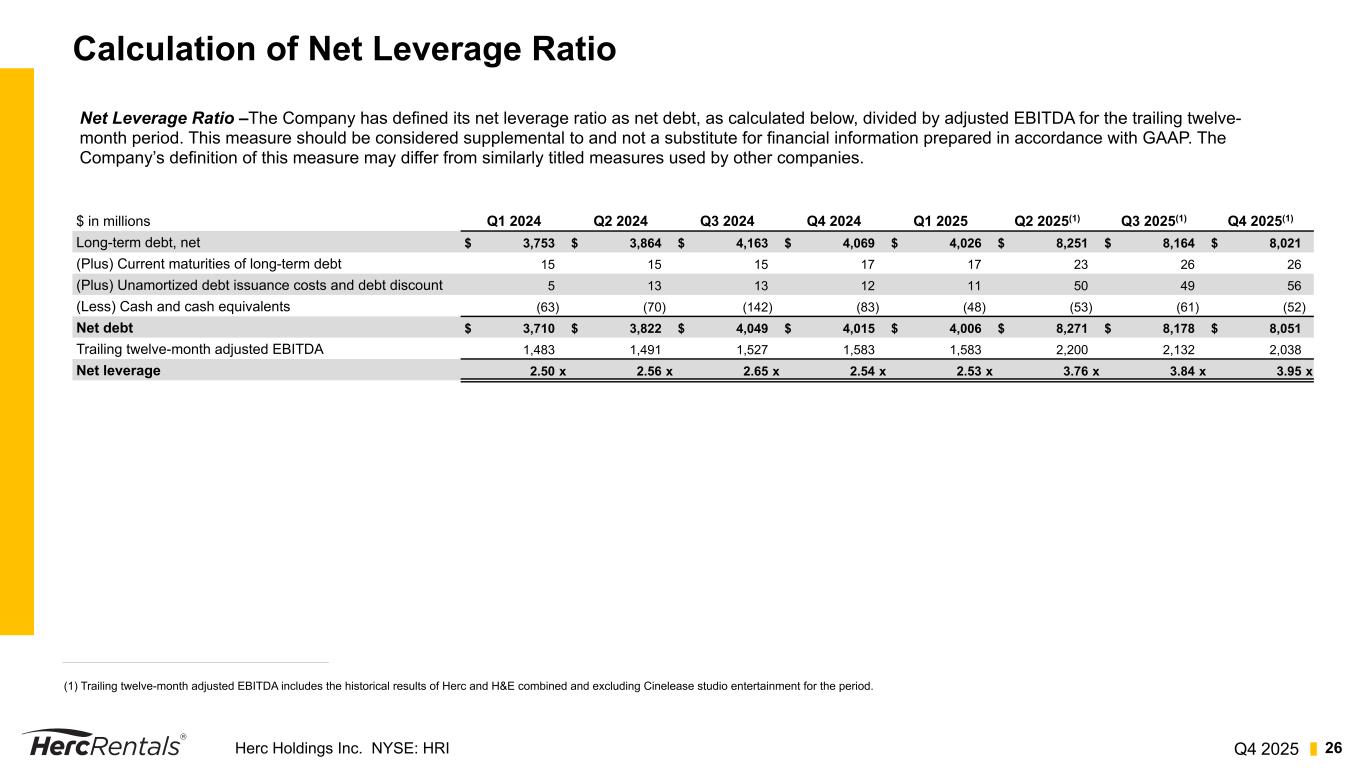
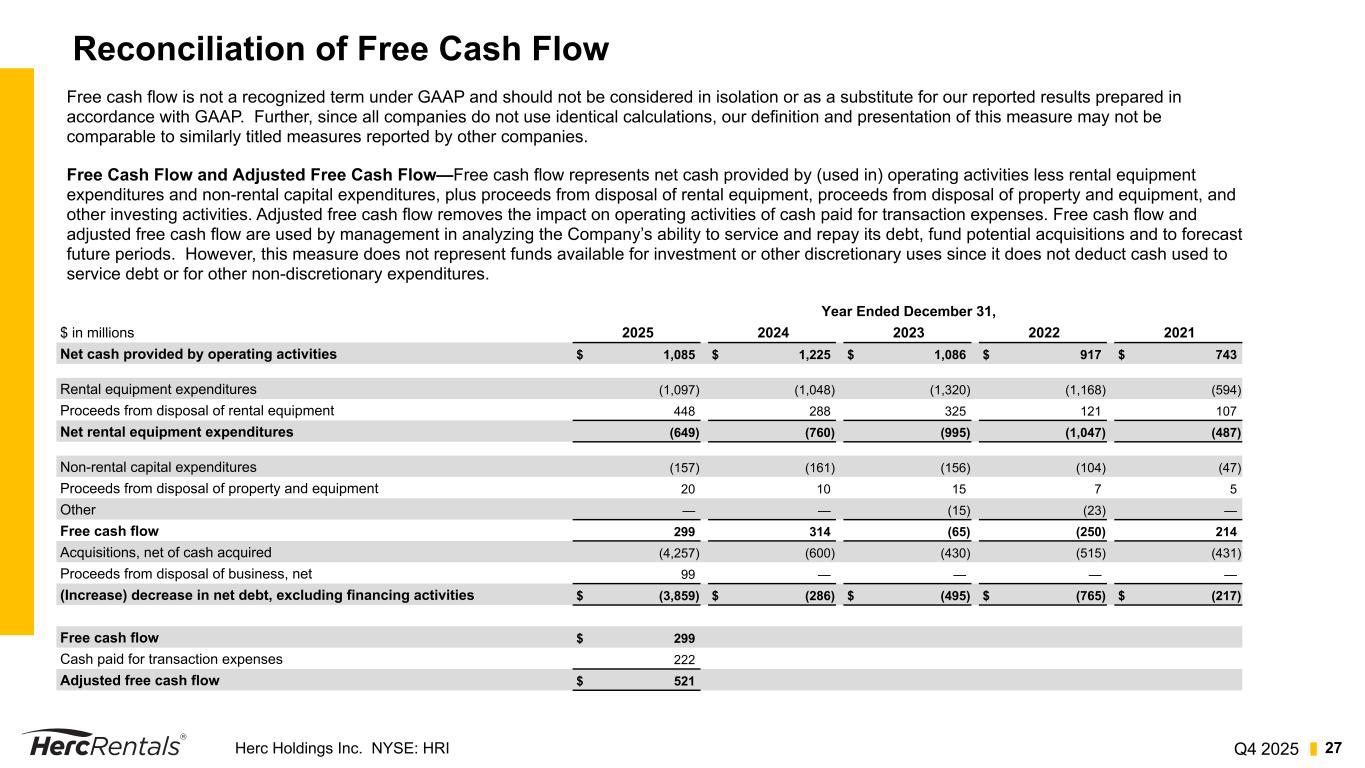
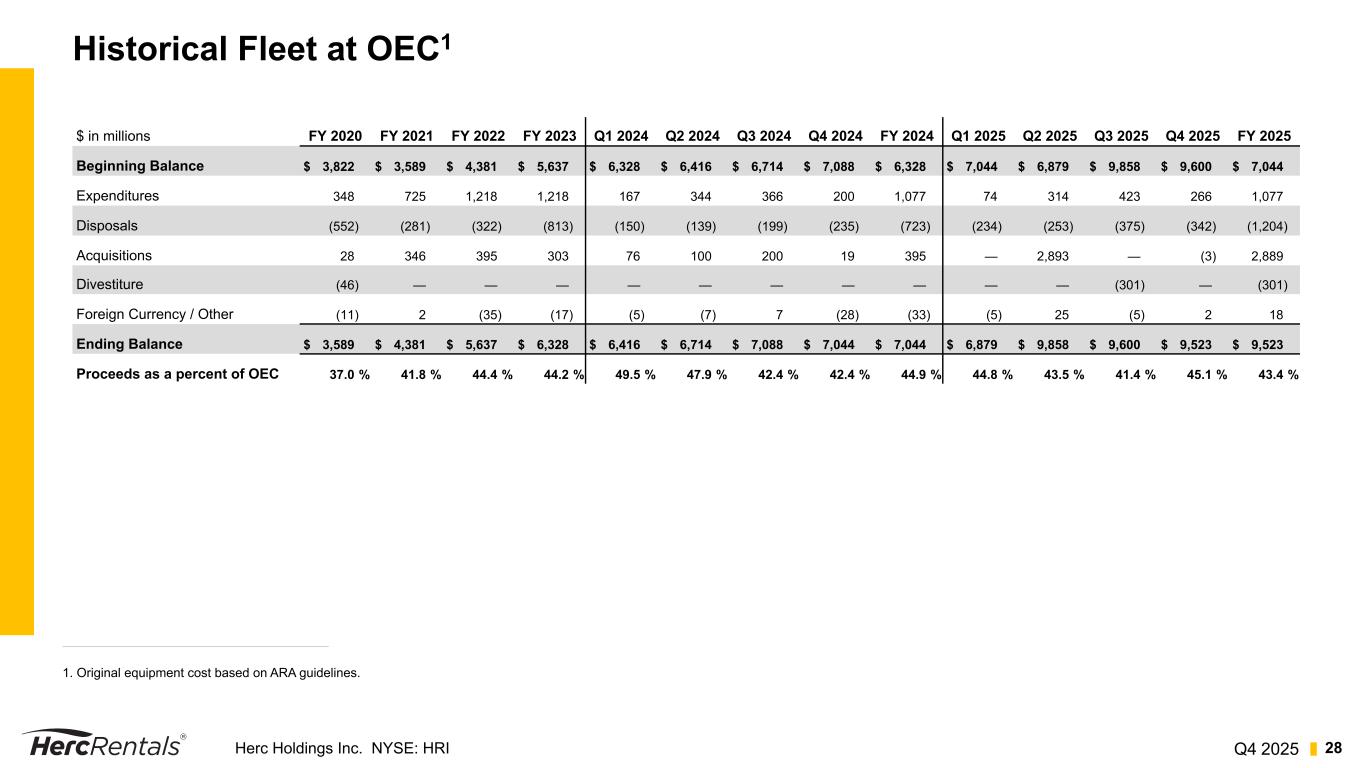
For the fourth quarter on a gap basis, equipment rental revenue was up approximately 24% year-over-year, driven by the acquisition of H&E, strong contributions for mega projects, and sales of specialty solutions. Adjusted EBITDA increased 19% compared with last year's fourth quarter, benefiting from the higher equipment rental revenue, as well as 53% more used equipment sales. The increase in used equipment sales, which have a lower margin than the rental business, impacted the adjusted EBITDA margin. Also affecting margin was lower fixed cost absorption as a result of the ongoing moderation and demand in certain local markets where H&E was overweighted, as well as acquisition-related redundant costs preceding the full impact of cost synergies. EBITDA, which excludes used equipment sales, was up 17% during the fourth quarter. Rebidot margin was 45%, impacted year over year by the lower margin acquired business. Margin improvement will come from equipment rental revenue growth, a shift over time to a higher margin product mix, and a return to selling used fleet through the more profitable retail and wholesale channels, as well as delivery of the full cost synergies and improved variable cost management from the increased scale. Our net income in the fourth quarter included $14 million of transaction costs, primarily related to the H&E acquisition. On an adjusted basis, net income was $69 million, or $2.07 per share. For the full year, our results were reasonably aligned to our early expectations. In any large-scale acquisition, integrating the acquired operations and acclimating new team members is a phased-in ongoing effort. It takes time to get a clear read on the pace and effectiveness of change. But after six months, we have better clarity and I like where we sit. Using a baseball analogy, in addition to many singles and doubles the teams delivered in a short period of time, there have been some home runs in key areas like cost management, systems transfer, and fleet optimization. Let me take a minute to walk you through how our fleet optimization plan has evolved and what that means moving into 2026. If you turn to slide 10, in just six months, we rebalanced our combined fleet by market to drive capital efficiency and set the stage for improving fleet productivity. At the same time, we made initial targeted investments in specialty equipment to unlock revenue synergies, ensuring we're not just leaner, but also more capable and better aligned with high-value opportunities. In the second half of 2025, fleet expenditures were roughly 22 percent higher than the second half of 2024 and fleet disposals at OEC were 65 percent higher. Overall, for the full year, 2025 expenditures were flat year-over-year, while full-year disposals increased 67 percent, reflecting the acquisition fleet realignment. Of the $342 million of disposals in the fourth quarter, realized proceeds were 44 percent of OEC, up from 41 percent in Q3 2025, as more equipment was sold through the higher return wholesale and retail outlets in the last quarter of the year compared with the third quarter. With the enormous amount of work done last year to optimize the fleet, including significant investments in Synergy Fleet, this year we shift our focus from right sizing fleet to extending the average age of the younger acquired fleet and improving utilization. We expect to be able to address the growing demand in national and regional accounts and specialty solutions while meeting our 2026 revenue synergy goals with increased capital efficiency. On that topic, let me quickly run through capital management on slide 11. Here you can see that we generated $521 million of free cash flow net of the transaction costs for the year-end of December 31, 2025. Our current pro forma leverage ratio is 3.95 times, which is in line with our expectation as H&E's 2024 quarters roll out of the trailing 12 months calculation. We still expect to return to the top of our target range of two to three times by year end 2027 as revenue and cost synergies drive higher EBITDA flow through. On slide 12, you can see our initial 2026 guidance. Our plan is to invest roughly $950 million of gross capex at the midpoint of that guide. That, combined with a significantly lower level of dispositions this year, would bring net capex to approximately $650 million at the midpoint, relatively flat with last year. Our fleet plan is aligned to generate rental revenue growth of 13 to 17 percent this year. As you would assume, given the significance of the H&E acquisition in June 2025, the rate of growth slows on a gap basis from 1Q to 2Q, as the second quarter has one month of the H&E acquisition in its base. On a pro forma basis, quarterly revenue and fleet metrics improve sequentially from negative to positive growth from first half to second half, driven by higher fleet efficiency and utilization as we work through the seasonal shoulder period and build into the peak season. After we cross over the acquisition anniversary, results in the third and fourth quarters will be measured against comparable periods in the prior year. While our business sustained front-loaded revenue dis synergies in 2025 versus the original plan, our goal for generating roughly $390 million of gross revenue synergies through 2028 hasn't changed. Capturing the revenue synergies will happen over time as fleet investments take hold, the new specialty branches mature, annual contracts renew at higher values, and the local market recovery supports increased customer demand and improving spot rates. For 2026, we're forecasting incremental revenue synergies of approximately $100 to $120 million. Cost synergies are running ahead of expectations, and we expect to recognize the total of $125 million of cost synergies in 2026, supporting EBITDA margin improvement across the rental revenue guide. We estimate adjusted EBITDA will be between $2.0 and $2.1 billion, representing profitable growth ranging from 10% to 16% as cost synergies are delivered and fleet productivity improves throughout the year, and the higher return specialty revenue gains momentum in the back half. This is partially offset by the lower sales of used fleet year over year. And finally, we're guiding to another year of free cash flow in the range of $400 to $600 million. With that, I'll turn the call over to Aaron, who is going to walk through the macro and operational drivers behind our outlook.
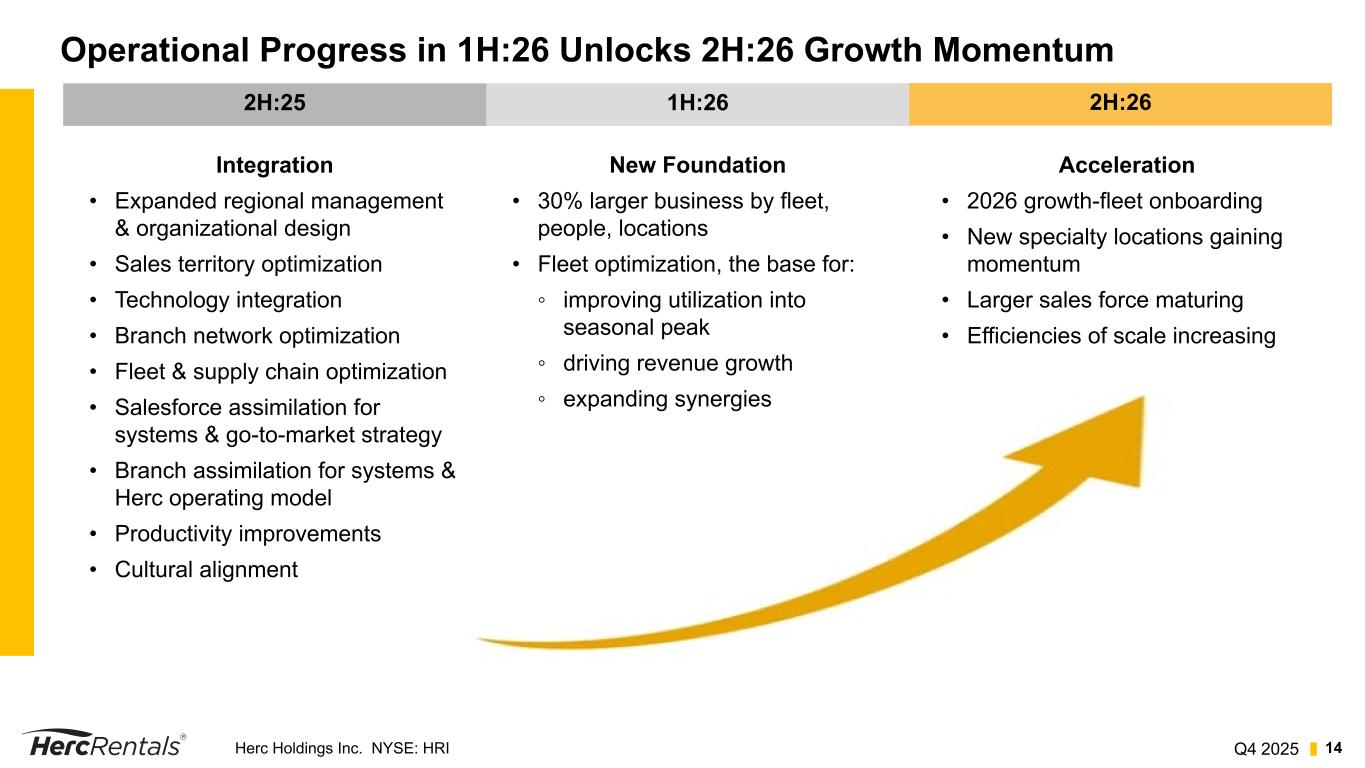
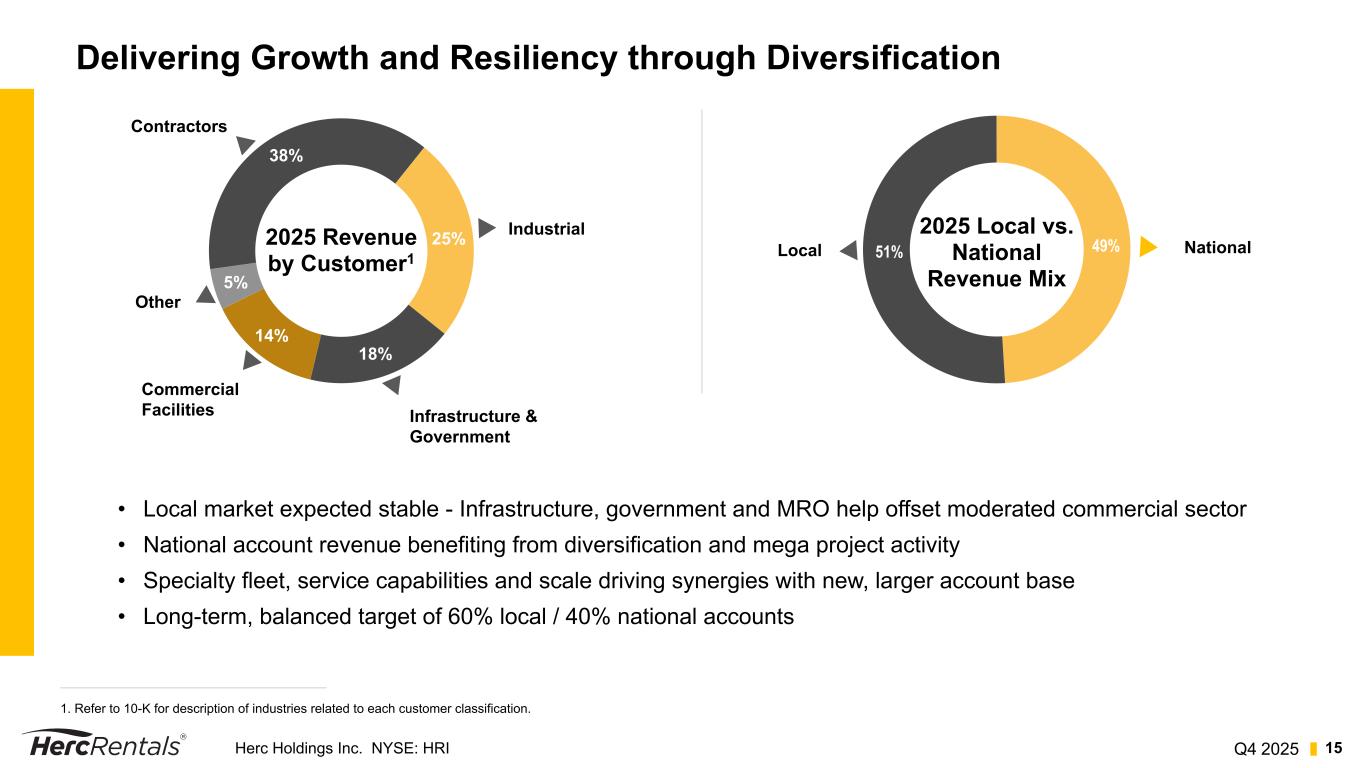
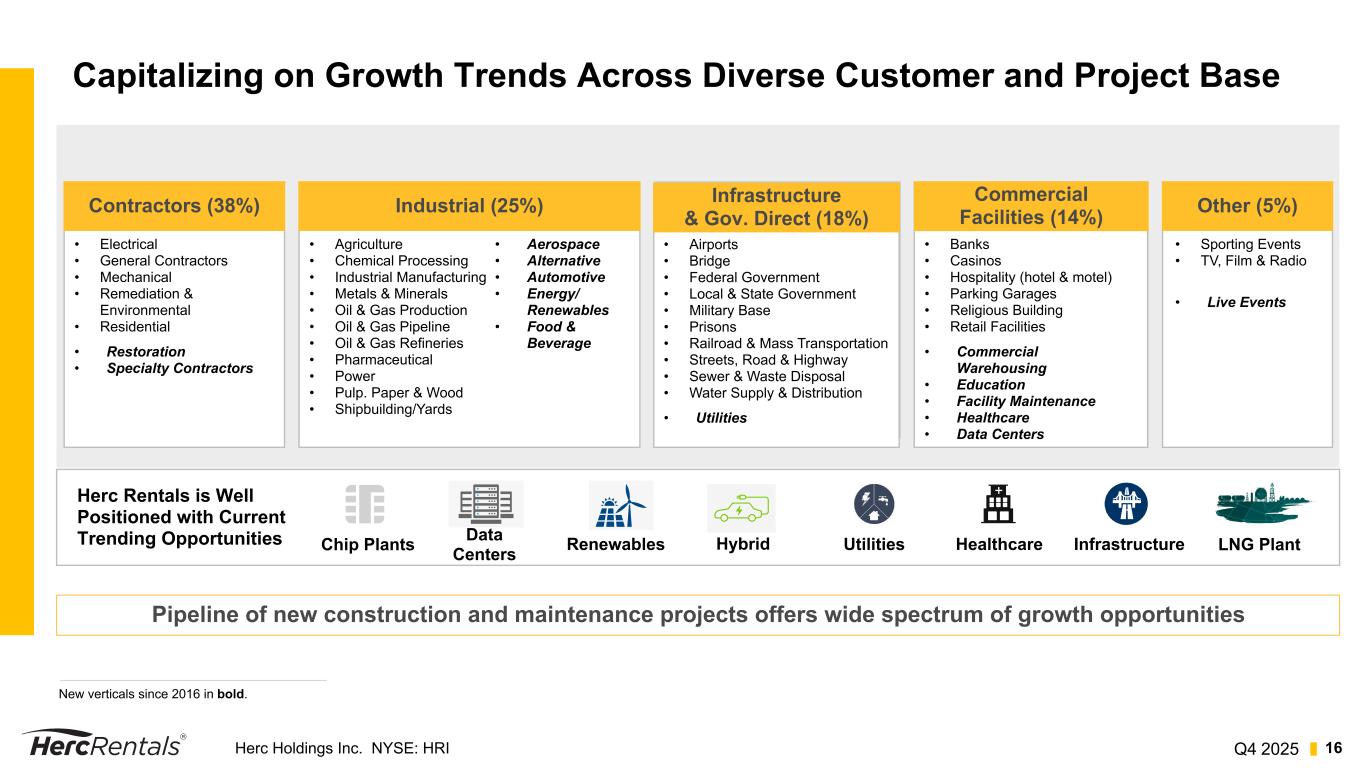
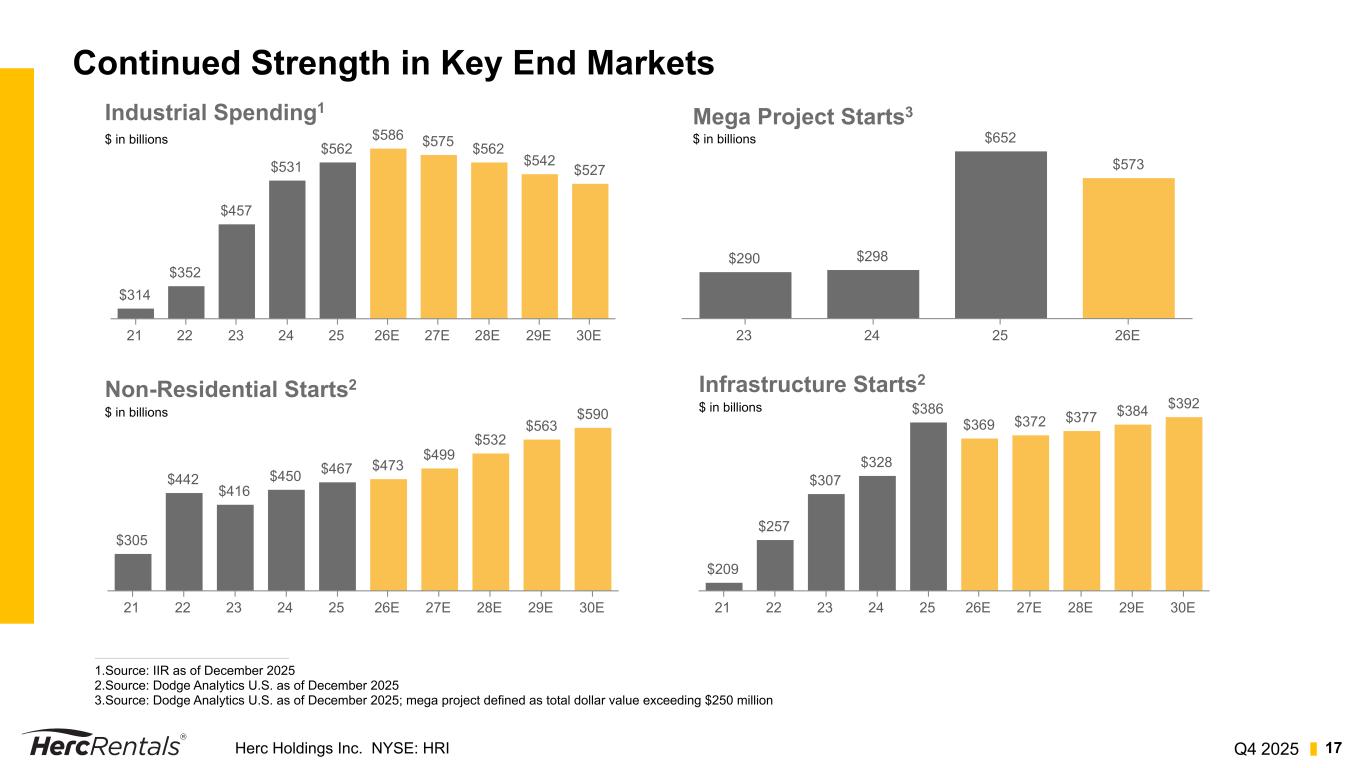
Thanks, Mark, and good morning, everyone. We entered 2026 as one team, one company, and one of the leading equipment rental businesses in North America. The hard work of bringing our companies together is largely behind us. The work ahead is about fully realizing the value of our integrated team, capturing synergies, optimizing our new, stronger foundation, and translating scale and capability into consistent performance and results. Turning to slide 14, this year, our priorities are clear. first we plan to complete the integration by the end of the first quarter the execution on the branch network optimization plan has been best in class so i'm confident all the 50 plus additional specialty locations will be staffed pleaded and open for business as we move into the peak season we're starting to see stronger contributions from the new sales professionals and will continue supporting their efforts so they're on a good trajectory as demand picks up At the same time, scaling our sales force for our larger company is a priority to ensure we've got the resources we need to execute our plan, and execution remains the top focus. We have a defined go-to-market strategy that all of our sales professionals have been trained on. We measure progress against that weekly. As you know, what gets measured drives performance. We're tracking data on revenue synergies, customer recovery programs, and cost synergies around maintenance and transportation, among other things. In addition to weekly meetings at the regional and district level, Mark and I have been on the road getting in front of the teams for synergy report outs and helping to prioritize solutions for any pain points. The engagement level in the field is really strong, which gives me confidence in the next phase of value creation. Last year, we invested over $100 million of capital specifically to capture the early revenue synergies from this transaction, with a significant portion directed toward expanding our specialty fleet. That investment is now being put to work across a larger customer base and provides a full-year run rate benefit as we move through 2026 and into 2027. As we deploy specialty fleet into our larger specialty location network and continue to expand the sales force's offerings, we expect to drive incremental revenue synergies. Our specialty lines generated double-digit rental revenue growth in December, so we're seeing the progress, and it's clear that the product training, team selling approach, and shift to solution selling are starting to pay off. We believe we are well-positioned as we move from integration into the acceleration phase. the fundamentals of the combined company are stronger the team is executing with increasing focus and urgency and our markets are stable turning to slide 15 the resiliency of our business model remains supportive as mega project activity continues to be robust and the shift from equipment ownership to rental offers plenty of opportunity for specialties penetration In the local market, we expect 2026 will be relatively neutral to 2025, with government, infrastructure, MRO, and institutional construction demand offsetting the still moderate commercial sector. On the national account side, funding for new, large-scale projects is still robust. Mega project activity in 2025 was centered around manufacturing, LNG, renewables, and data center growth. We are winning our targeted 10 to 15 percent share of these project opportunities, with even more new mega projects on deck and current projects still ramping up. In 2025, local accounts represented 51 percent of rental revenue, compared with 49 percent for national accounts. As a combined company, we'll continue to target a 60 percent local and 40 percent national revenue split long term, knowing that this diversification provides for growth and resiliency. The scale we've gained through the acquisition bolsters our ability to respond to near-term trends in local markets while also leveraging efficiencies to prepare for the start of a cyclical recovery. But it's important to remember that a pickup in local demand typically lags interest rate reductions. With that in mind, for 2026, we're being thoughtful and disciplined in our planning, balancing our short-term responsiveness with long-term readiness. Turning to slide 16, in a disproportionate demand environment like the one we're operating in today, diversification is an important strategy for fostering sustainable growth and navigating economic cycles. As Herc has diversified into new in-markets, geographies, and products and services over the last nine years, we have reduced our reliance on a single industry or customer. We've become more resilient to downturns and more adaptable to emerging opportunities like the mega project developments, technology advancements that support customer productivity, and the sector shift from ownership to rental. We believe we are well positioned to manage dynamic markets, and the acquired scale further bolsters our capacity and therefore our opportunities. Sticking with the topic of resiliency, let's turn to slide 17, where you can see that despite the uncertain sentiment in the general market around interest rates, industrial spending and non-resident construction starts still show plenty of opportunity built on a foundation of megaproject development and infrastructure investments. Taking a look at the updated industrial spending forecast at the top left, strong capital and maintenance spending is projected through the end of the decade with a 4% increase in 2026. Dodge's forecast for non-residential construction starts in 2026 is estimated at 473 billion dollars, a 1% increase year-over-year with 5% to 7% growth continuing in successive years. Additionally, the mega project chart in the upper right quadrant gives you a snapshot of the total dollar value in U.S. construction project starts over the last three years and an early projection for 2026 that reflects another 573 billion dollars of investment. I expect that number to grow as more projects get assigned a start date as there is a trillion dollar pipeline that is working through the planning stages. As a result, we estimate we're only in the early to middle innings of this multi-year opportunity. Finally, there's another 369 billion dollars in infrastructure projects estimated for 2026 after a record year in 2025. That's now slightly year-over-year because of some very large project starts last year, as well as some volatility around funding. But infrastructure construction activity is expected to remain steady at strong levels through the end of the decade. Of course, there are some overlap in projects among these four data sets, but no matter how you look at it, for companies with the safety record, scale, product breadth, technologies and capabilities to service customers at the local regional and national account level the opportunities for growth remain significant in closing i want to thank our team for their extraordinary efforts during this transition our customers and shareholders for their continued trust and support we are confident that the steps we are taking today will enable us to deliver sustainable long-term value as we move forward together with that operator we'll take our first question.
Operator
Thank you. The floor is now open for questions. If you have dialed in and would like to ask a question, please press star 1 on your telephone keypad to raise your hand and join the queue. If you would like to withdraw your question, simply press star 1 again. If you are called upon to ask a question and are listening via loudspeaker on your device, please pick up your handset and ensure that your phone is not on mute when asking a question. And finally, we do ask for today's session that you please limit yourself to one question and one follow-up. Your first call Your first question comes from the line of Mick Dabry of Baird. Your line is open.
Hey, good morning, everyone. Good morning. Thank you for taking a question. My first question is a bit of a clarification on the guidance. So we've got $235 million, I believe, in additional EBITDA relative to 2025. is there a way to maybe give us a little bit of a bridge here in terms of how this additional 235 is being generated how much of this is from incremental savings that you have from synergies integrating the businesses maybe obviously there's a little bit of a carryover from H&E for five months of the year that that business wasn't in your P&L in 2025 and i'm sure there's some other moving pieces there too yeah so so a few things mig so if you
think about um you know my prepared remarks i said that we expect the cost synergies to be in in their entirety for 2026 so um you know that's a cost synergy increase uh or ebitda increase of about 125 million then you you sort of take the other piece of that which is the revenue synergies which I said was going to be in the in the neighborhood of 100 to 120 million and that would then have an EBITDA flow through in the 60 to 70 percent range so you're sort of talking about incremental EBITDA of 60 to 70 million from a revenue synergy perspective so those are the two big bridge components between the two years and then obviously if you're looking at this on a gap basis you're going to have five months of of EBITDA contribution from a comp perspective as you work your way into June of 2026 as well and and would you be able to help me with uh that last component in terms of what's incremental for those five months the evita um well i mean i think if you're talking about it from a a gap perspective right you're you're you're going to have an increase of um something more like EBITDA would go from about 1.8 to a midpoint of, you know, between 2 and 2.1. So, the incremental without getting two-pointed, I think you just have sort of the run rate coming out of 4Q is going to be negative, as I said, on a pro forma basis, and then it's going to work its way sequentially and year-over-year improvement as you work your way through the year.
Operator
Your next question comes from the line of Ken Newman of QBank Capital Markets. Your line is open.
Hey, good morning, guys. Thanks for taking the question. Good morning, Ken. Mark, I just wanted to touch on how we should think about the cadence of dollar utilization as we move through the year um yeah the first quarter in particular it helped maybe just some help just given some of that color you gave on this this pro forma uh performance i mean should we assume something more than normal seasonality quarter to quarter from 4q to 1q and then maybe at the midpoint of that guide would you expect all you to be could it could it get over 40 percent in the second half of this year all right uh let me pull that apart a little bit I think and I'll answer this from a pro forma perspective and so from a pro
forma perspective basis you would anticipate negative pro forma 1q year over year from a dollar you perspective and then the rate of that decline improves as you work your way out of the shoulder period can and then you would look for improvement sequentially and year over year as we work our ourselves through the peak season and back half 2-H in totality. So, you know, with that, you know, our top-end performance from a dollar-view perspective in 2025 was 40 points in the third quarter.
Based on what I just said the anticipation is you would be above that 40 um seasonally um in uh in the back half yep okay and then um maybe i know you're expecting the the fleet disposals should be lower versus last year um i i guess maybe the question here is help us think about what fleet sales could look like this year or maybe if there's a way to help us think about what the midpoint kind of implies for total oec aging the year at the midpoint so let's stick with the
disposal side of it um i think that we've got um you know line of sight to you know give or take 700 million dollars of disposals um so you know pretty significant decrease year over year um with the intent of sort of aging the fleet out to something that looks more like a historical average age for Herc rentals. And with that, I think you'll see, you know, mid-40s from a disposal to proceeds to OEC, which would probably run you into the 30s, give or take, from a margin perspective on that used equipment. activity can thank you your next question comes from the line of kyle menges of city group your line is open thanks guys um maybe we could start and just i'd love to hear a little bit more color on the revenue center synergies that 100 to 120 million you're targeting for 2026 and what's
embedded in there and just your visibility to achieving that as well yeah kyle this is aaron well there's several areas in there um i'll take you back in time a little bit we've got a broader breadth of fleet that we're pushing into the acquired branches. That's part of the revenue synergy. If you recall, we had roughly 6,000 more CAD classes that we're pushing into that network so that our sales teams can go generate revenues off of those. And then, of course, we've got our specialty businesses. And as you heard in the remarks, we're opening up 50 new especially locations um those will be up and running um 80 of them are done now the rest of them will be up and running over the next month and that grows our network especially locations by 25 so those are two big components um we need the uh there's a pricing component in there too we've uh our own you know prior our own pricing tool that we use for a sales force and we've assimilated that into our new sales team. And that's going to help kind of move the needle on that over time. We're not expecting that to be like a 2026 big move, but over time, over three years of our Synergy run, that's where we're going to get that. So those are the big components that are in the revenue Synergy go-get for us.
That's helpful. Thanks, Aaron. And then just on the mega projects, it'd be helpful to hear what you're seeing as far as competitiveness to get on these projects and how you are winning. And then you talked about getting that 10 to 15 percent share that you've targeted. I'm curious if there could be some upside to that as you're integrating H&E.
Yeah, right now, as we said, 10 to 15 percent share on the mega projects are right at that midpoint. Our goal is to kind of move that to the upper end. The activity on the mega project landscape is very robust. So you asked about competitiveness. You know, it really comes down, these are mission critical jobs that the contractors are operating in, and they need to have a trusted supplier to make sure that these mission critical pieces are functioning the way they're supposed to. We measure our position kind of the primary or secondary player not just measuring how many pieces we have on the landscape overall on the mega um projects but um the competitiveness has really been very stable i would say uh when i mentioned the word mission critical what i'm talking is about the ability to execute you know the safety protocols they need the technology that's required for the project there's a big specialty component that goes in to these projects you have to have the capabilities and solution selling to you know to provide the right solutions and provide it in a mean an economic fashion that the customer can realize to the benefit of the project so it's a it's a complex landscape but it's not more competitive and we feel like we're in a really good position And then the expanded network of our H&E locations really allows us to scale that even further to our customers. And we've seen benefits from the new scale all through the back half of 2025. And it really makes us even more competitive as a player solution provider as we roll into 26.
Operator
Your next question comes from the line of Neil Tyler of Rothschild & Co. Redburn. Your line is open.
Good morning, guys. I just wanted to actually, first of all, follow up on that question and maybe ask you, Aaron, to talk a little bit about the sort of softer factors that you need to put into place to realize those synergies in terms of training around extended CAT classes, the specialty business, and how you're confident that the employees can appropriately push those into customers. customers in order to, you know, the new specialty locations to reach maturity, for example. And then the second question, I wonder if you could talk a little bit, Mark, about the assumptions aside from the synergy component of rate, you know, the other assumptions or expectations around rate progress this year, and also anything within the sales mix. You know, I'm thinking in my mind about a sales bridge within the mix that might contribute to the 26 on 25 moves.
Okay, Neil, I'll take the first part. To lean in on the software side of achieving those synergies, it's a few components. One is expanding our footprint, you know, 50 new locations certainly helps kind of get it into markets where we might not have been as dense that HD helped us. So that's a big piece of it. And leaning into providing the capital to deploy in those new 50-plus markets, as well as our existing specialty network that we already have. We started that last year, as I said, to get kind of the early beginnings of the synergy story. And we'll do that again as we roll through 2026. I think what is interesting and I want to kind of underscore is that we have a very large sales team now. We don't need our new sales professionals to be experts at specialty. We need them to know how to ask the right questions of their customers, and then they can bring in one of our subject matter experts in specially to help kind of solution sell that. And that's really what we're teaching our new team to do. Of course, we're taking them through product knowledge awareness and bringing them into our locations to show them the different offerings they have now. And then, of course, we also highlight the compensation piece of this and how they can kind of yield up on their compensation by selling in to the specialty business. So we have grown our specialty team by these 50-plus locations, but we've also already expanded our SMEs that are out there and our specialty sales reps that are out there to help get this all done. we've seen some early early success with some of the general rental fleet that we introduced right because this is some of the stuff that H&E didn't have in their portfolio and and a lot of those new salespeople they really were able to grab that pretty quickly and put that on rent the specialty piece is just another element of this and it is that part of the softer side so it takes a lot of for thought and planning but we don't need our new salespeople to be
experts that's the key thing they can lean into the operational excellence and our sales teams on the specialist side to get that done and then Neil in terms of sort of forming a bridge if you will from a revenue guidance perspective I think if you're sitting at the top of the guide you would think about that as sort of rev synergies on target, continued mega growth, pricing slightly positive year over year, and local market stable, meaning sort of low single-digit growth. I think as you walk off at the top of that guide down, the biggest swing factors in that would be market demand and price.
Operator
Your next question comes from the line of Tammy Zakaria of JPMorgan. Your line is open.
Hey, good morning. Thank you so much. I wanted to ask a follow-up question on specialty. I think you increased the footprint by 25%. That's very impressive. I wanted to understand what's the go-to-market strategy for specialty with existing general rental customers. Can you offer some examples of success stories where you saw quantifiable uptake in total rental volume from a particular customer once they began taking specialty from you but were not taking in the past? Any quantification would be helpful unless it's too early to comment on this.
Oh, no. So, as I mentioned, if you just take a look at the past six months of 2025, we already had roughly 150 specialty locations in our network, in Herc. And so, we quickly connected with the sales team on the HG side to identify opportunities. And with, you know, it's human nature. Sometimes there's early adopters that kind of lean into it and are excited that there's a new opportunity to go rent something they couldn't rent before. So there was a lot of opportunities in Q3, Q4 that came in for our power generation business that's under our pro solutions umbrella, as well as our pump business. The trench opportunities are starting to escalate now. That's a little bit of a different sales cycle, but we had a lot of those happen in the third and fourth quarter, which really helped us kind of absorb some of that capital that we deployed early on because we knew that that was going to be something we wanted to get the wheels turned on fast. So as we roll into 2026, now we go from 150 roughly specialty locations to 200 and a bigger sales force and some more fleets being deployed, a larger specialty subject matter expert team, we really like where we are positioned here at the beginning of 26. And I think the specialty story for Herc Reynolds is going to be a solid one as we progress through the year and these other 50 locations kind of get up and running as we get into the second half of the year.
Understood. That's helpful to know. And a question on the CapEx guide, can you give some color on how to think about growth versus net CapEx as the year progresses, the four quarters versus the four quarters last year?
Yeah, Tammy, this is Mark. So I think really you've got two components here, right? You sort of have 700 million, give or take, fleet that will be disposed of, needs to be rotated out, will be rotated out. And then on the flip side of that, if you're just sort of running this down the middle, you've got about a billion dollars, give or take, of gross CapEx spend. I don't necessarily view it as maintenance versus growth, because there's probably makeshift, there will be makeshift in the disposed items as we bring it back on board. So, really, we're thinking about sort of being more capital efficient with the next billion dollars of fleet that we're bringing in sort of across the general landscape as well as the specialty landscape as we work our way through, you know, Q2 and Q3, which will hold about 65, 70 percent of those fleet ads as we walk through these.
Operator
Your next question comes from the line of Jerry Reddick of Wells Fargo. Your line is open.
Kevin
Analyst — Wells Fargo
Good morning guys. This is Kevin on for Jerry Ravage. I just had a question on general rental. We're seeing really strong demand for earth moving equipment, but aerials are lagging. Are you seeing that disconnect? And is that a function of large projects and data centers being less aerials intensive?
No, I would say the earth moving, there's two categories in earth moving. One is kind of excavators and one's compact earth. And then, you know, aerial, those are all You know, as you go through the winter period, you know, it's pretty much what we thought it would be. Of course, we did a lot of kind of fleet optimization in the back half of the year. But one area you do see it is in the used equipment market where the excavator earth moving product kind of had bottomed out and the values are starting to go north a bit again from the trough. Whereas Ariel has, you know, hasn't really maybe troughed out or I should say hasn't turned back up. It's kind of been bouncing along this trough period. So what's interesting is, you know, right after the business came back, after the pandemic, you know, the excavators were the ones that went down the hardest in the used equipment market. So I think you're just seeing a natural kind of balancing of fleet and demand in the used equipment market. But on the rental market, it's all, you know, pretty much where we think it should be for this time of year. and when your question about you know big projects you know the simple part of that typically takes very very large equipment some of it not equipment that we carry in our earth moving fleet but the aerial demand in a mega project is pretty large got it understood and then on 4q dollar utilization down quarter over quarter how do we think about the moving pieces rate mix time utilization and And how do we think about that into 1Q?
Well, I think, you know, I would say reasonably speaking, you know, the back half collectively sort of met our expectations from a dollar yield perspective. I don't think that the sort of fall off from three to four was anything that we didn't necessarily anticipate. I think as you take that into Q1 and you're looking at that on a year-on-year basis, I do believe that from a pro forma perspective, your dollar utilization will be down Q1 to Q1 and then build and the rate of decline improves as you work your way out of the shoulder period. And you guys, the other piece of that, the other piece of that just is, you know, 4Q 2024 had a hurricane in it, which was worth about three points of growth to us. And obviously that mix of gear to sort of service, you know, an emergency, a hurricane need is very specialty intensive, which also drives dollar utilization.
Operator
Your next question comes from the line of Rob Wertheimer of Milius Research. Your line is open.
My question is around mega project profitability, and you touched on this earlier, obviously, in the discussion around competitiveness, but you're winning an outsized market share versus your traditional market share. Capabilities, as you touched on, are different for large projects. You add more value. Are margins higher or lower there?
Because it looks like from industry results that margins aren't higher. um as the mix goes up in mega projects and margins don't go up thanks uh rob typically when you get started on a mega project it depends what's going in first right is it a bunch of specialty equipment or is a bunch of general rental equipment if it's a bunch of if it starts with general rental equipment um yes you're as we've said before you know you're getting the benefit of volume but you're you know the rental rate is a little bit more competitive and so you want a project that It allows you to get specialty equipment in at the midpoint all the way through the rest of the project. And then it becomes a very typical margin business for us. That's been our history in the past, and it currently is as well. Now if you start the project with a lot of specialty equipment, your margin can move up pretty quickly, depending at what point you inflect and get some general rental equipment. And these projects, for us at least, they've started these two different ways, right? Sometimes our specialty solutions is kind of our entry point, and sometimes our location, our relationship, and our general rental scale is our entry point. But one thing's for sure is that all projects typically use a big chunk of general rental and a big chunk of specialty dispends what comes first. But the margin always ends up, you know, if you're talking about a three-year project, always ends up like the rest of our business. Perfect.
Okay, thank you. And then just on the kind of sequential from 3Q to 4Q move, fleet growth is still ahead of rental revenue growth by about the same amount. You used that phrase shoulder period where you have kind of lower seasonality, I guess, in 1Q especially a couple times.
Is there anything with a mix that was kind of hurting you as you move into 4Q and 1Q or are you just sort of saying when you get more volume back overall, you'll be able to sort of see the effects of the management you've done? no that's a good question there's certainly an element of of time utilization um in that ultimate uh dollar you right um you know stabilizing that acquired fleet as we worked our way through the back half of the year the fleet actions that we took i think rob as you think about 2026 you will have improving fleet efficiency as you work your way through the year and the intent would be that your REV growth would outpace your fleet growth as you get into the seasonal component of 2026.
Operator
Your last question comes from the line of Sharif El Sabahi of Bank of America. Your line is open. Hi, good morning.
I just wanted to put a bit of a finer point on outlook. You've outlined about $230 million of EBITDA expansion. Within that, there's about $190 million of synergies contributing to that. And you've mentioned positive pricing, stable local markets, a bit of growth in mega projects. If you think about the lapping of H&E and Q1, and it seems to account for the remainder of that $40 million expansion. So can you help me kind of reconcile some of that commentary on markets with the EBITDA guidance?
Well, I mean, I think if you're looking at it from a pro forma perspective, Sharif, you will be down Q1 year over year, right? We're sort of walking into the year. if you want to adjust the hurricane out of 4Q2026, you're walking into the year down minus six. And so, the sort of forecast is you're going to be down Q1 and then begin to come out of that as you exit the shoulder period of Q2 and then ramping into sort of growth in the back half of the year, which sort of coincides with all of the incremental synergy fleet, et cetera, rolling into these optimized branches as you work your way through and out of the second quarter. Thank you.
Operator
With no further questions, that concludes our Q&A session. I'd like to now pass it back over to Leslie for closing remarks.
Thank you for joining us on the call today. We look forward to updating you on our progress in the quarters to come. Of course, if you have any further questions, please don't hesitate to reach out to us. Have a great day.
Operator
This concludes today's conference call. You may now disconnect.