Operator
you for standing by. My name is Rebecca and I'll be your conference operator today. At this time, I would like to welcome everyone to the first internet Bancorp earnings conference call for the first quarter 2026. All lines have been placed on mute to prevent any background noise. After the speaker's remarks, there will be a question and answer session. If you would like to ask a question during this time simply press star followed by the number one on your telephone keypad if you would like to withdraw your question press star one again thank you please note this event is being recorded it is now my pleasure to turn the call over to julia farah from icr you may begin your conference thank you operator hello everyone and thank you for joining us to discuss first Internet Bank Corp's first quarter 2026 financial results.
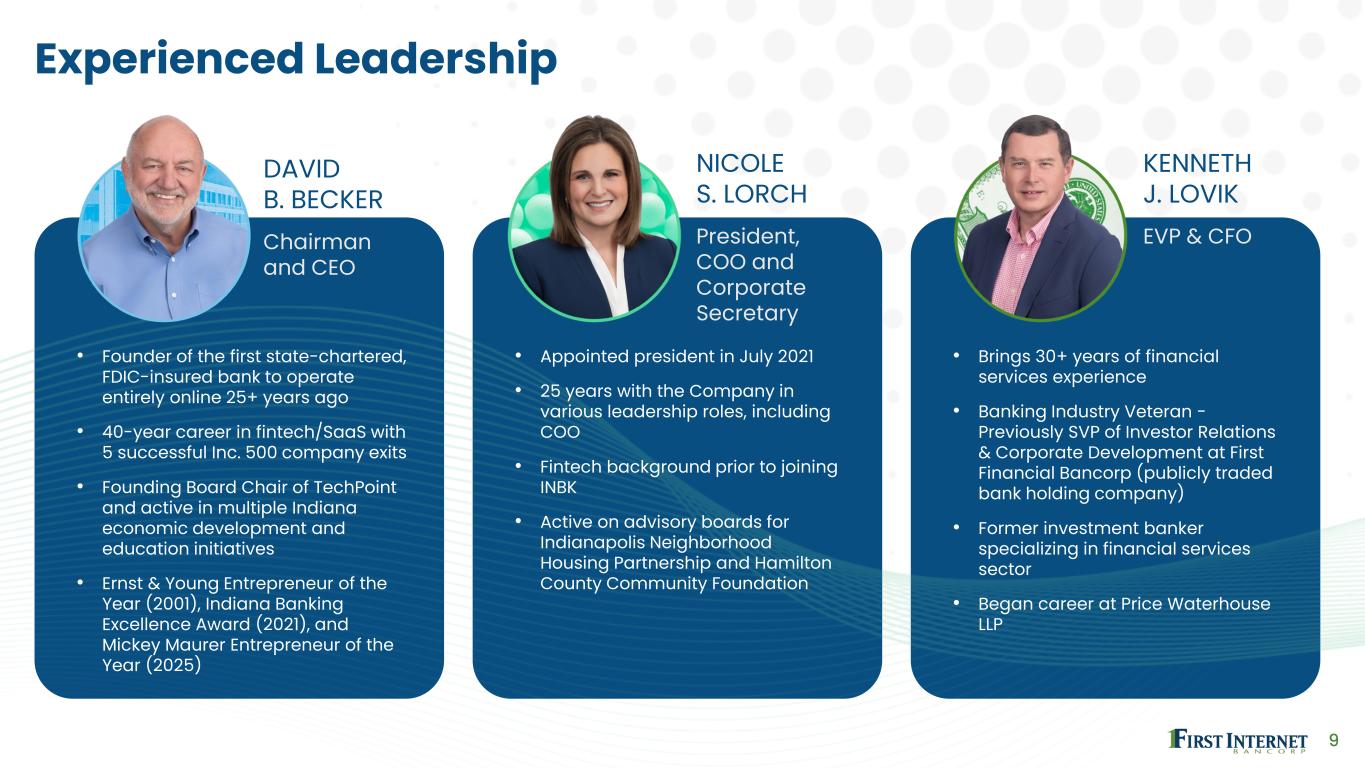
The company issued its earnings press release earlier this afternoon, and it is available on the company's website at www.firstinternetbankcorps.com. In addition, the company has included a slide presentation that you can refer to during the call. You can also access these slides on the website. Joining us from the management team today are Chairman and CEO David Becker, President and COO Nicole Lorch, and Executive Vice President and CFO Ken Lobbett. David and Nicole will provide an overview and Ken will discuss the financial results and then will open up the call for your questions. Before we begin, I'd like to remind you that this conference call contains forward-looking statements with respect to the future performance and financial conditions of First Internet Bancorp that involved risk and uncertainties. Various factors could cause actual results to be materially different from any future results expressed or implied by such forward-looking statements. These factors are discussed in the company's SEC filings, which are available on the company's website. The company disclaims any obligation to update any forward-looking statements made during the call. Additionally, management may refer to non-GAAP measures, which are intended to supplement but not substitute for the most directly comparable gap measures. The press release available on the website contains the financial and other quantitative information to be discussed today, as well as the reconciliation of the gap to non-gap measures. At this time, I'd like to turn the call over to David.
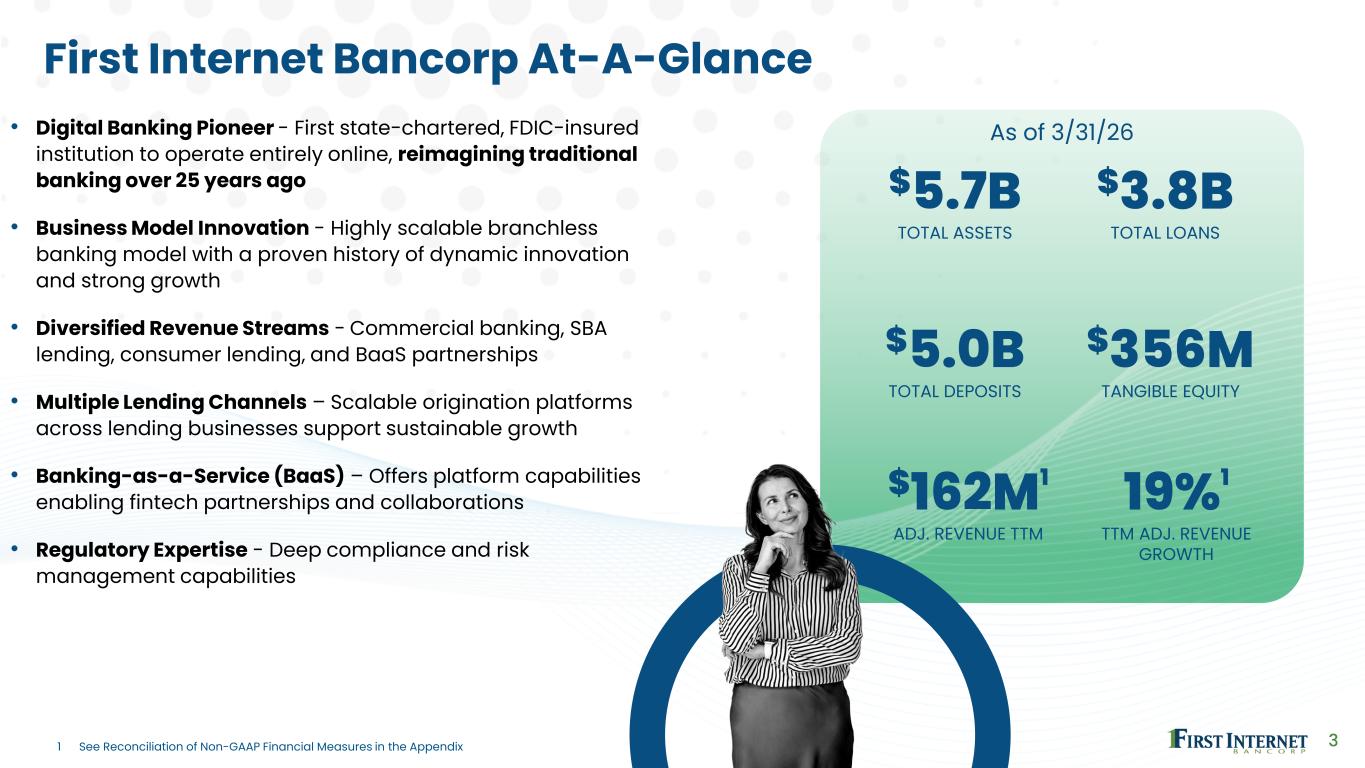
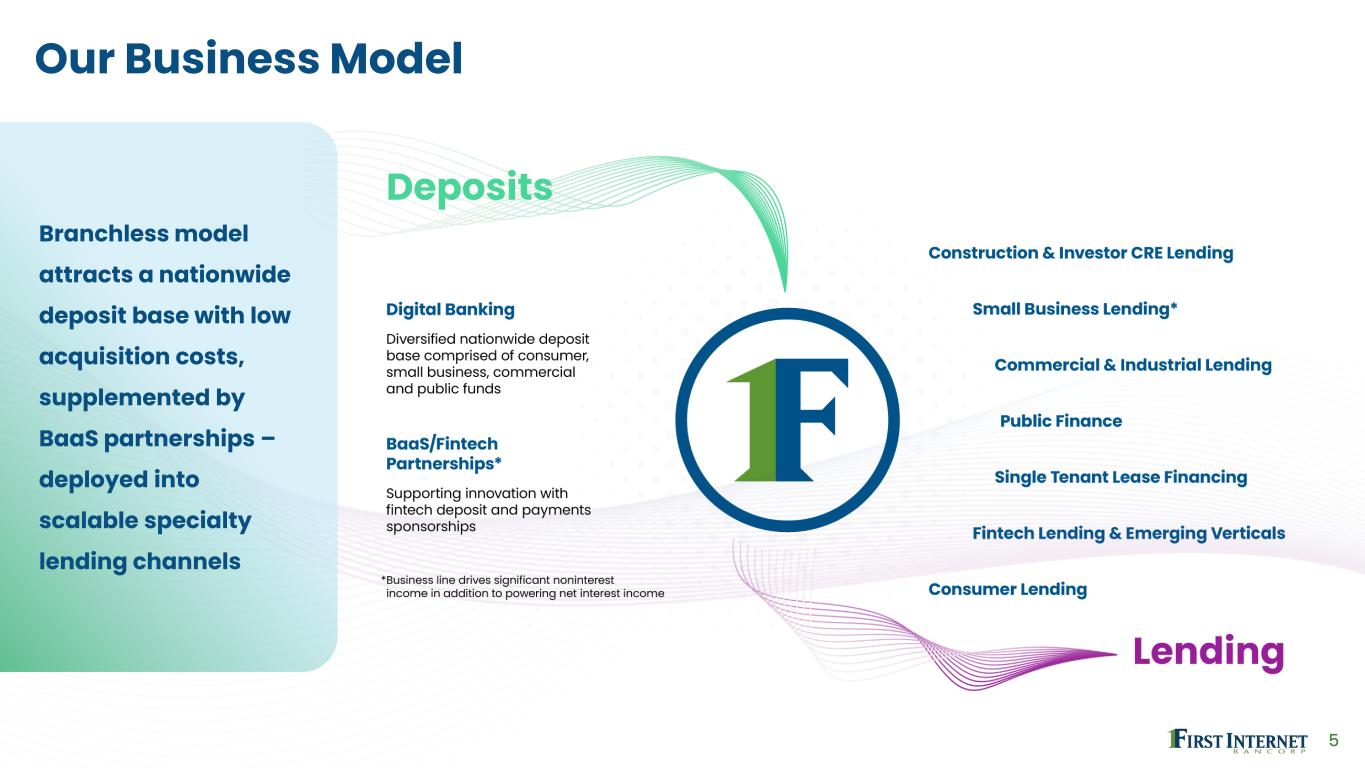
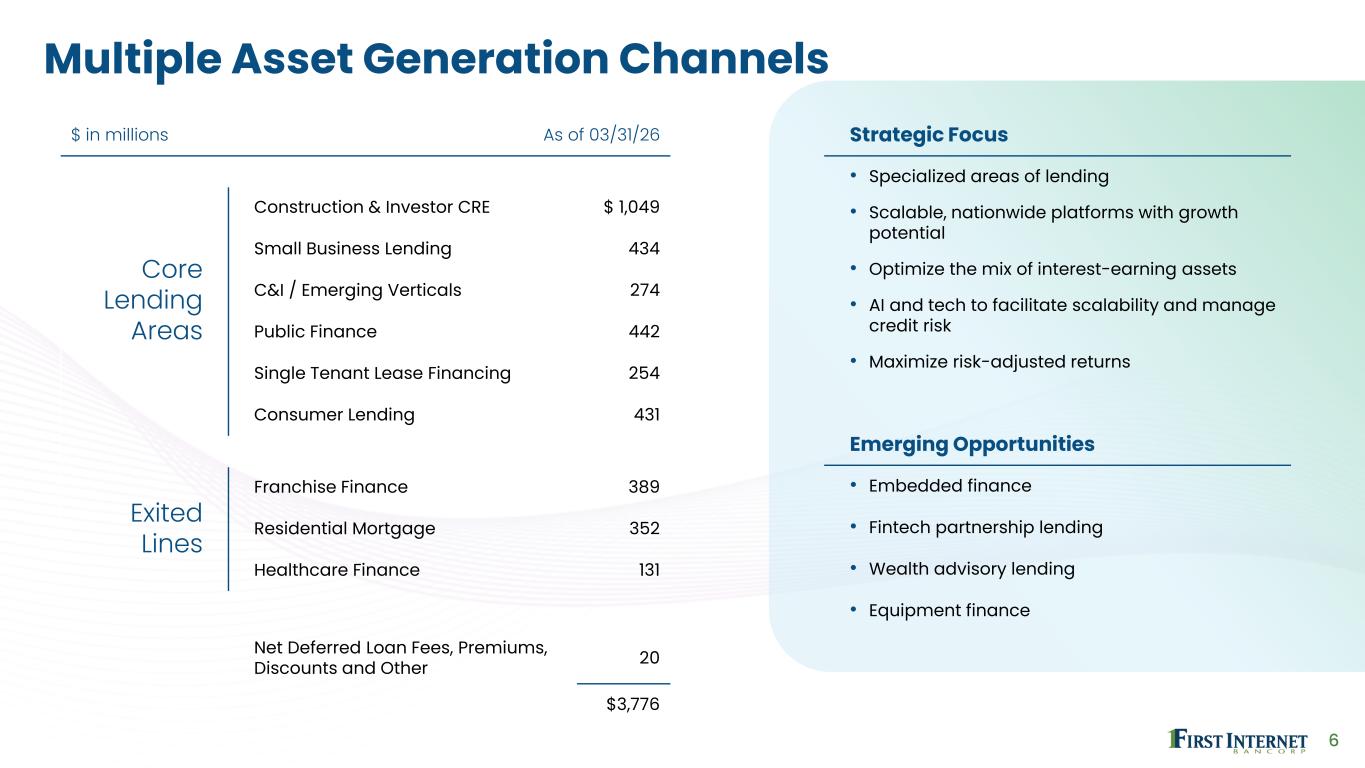
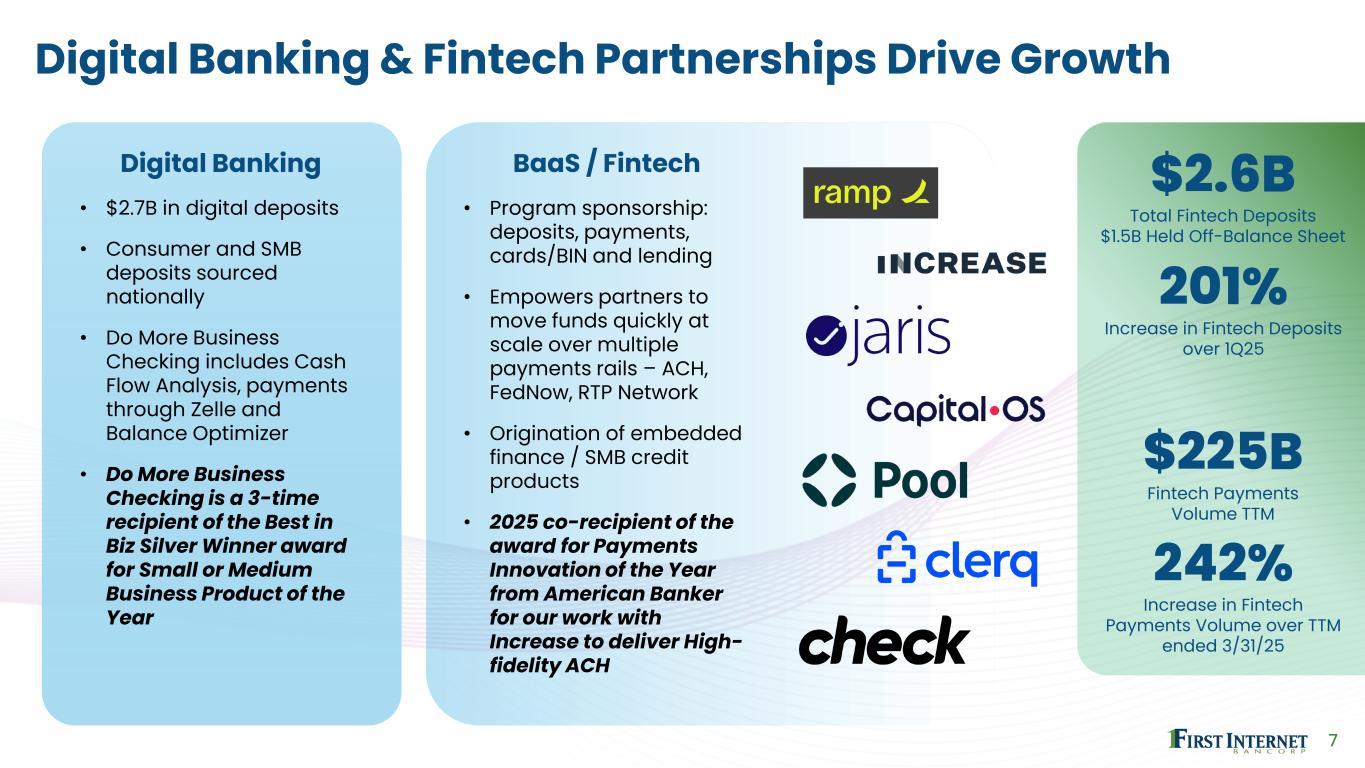
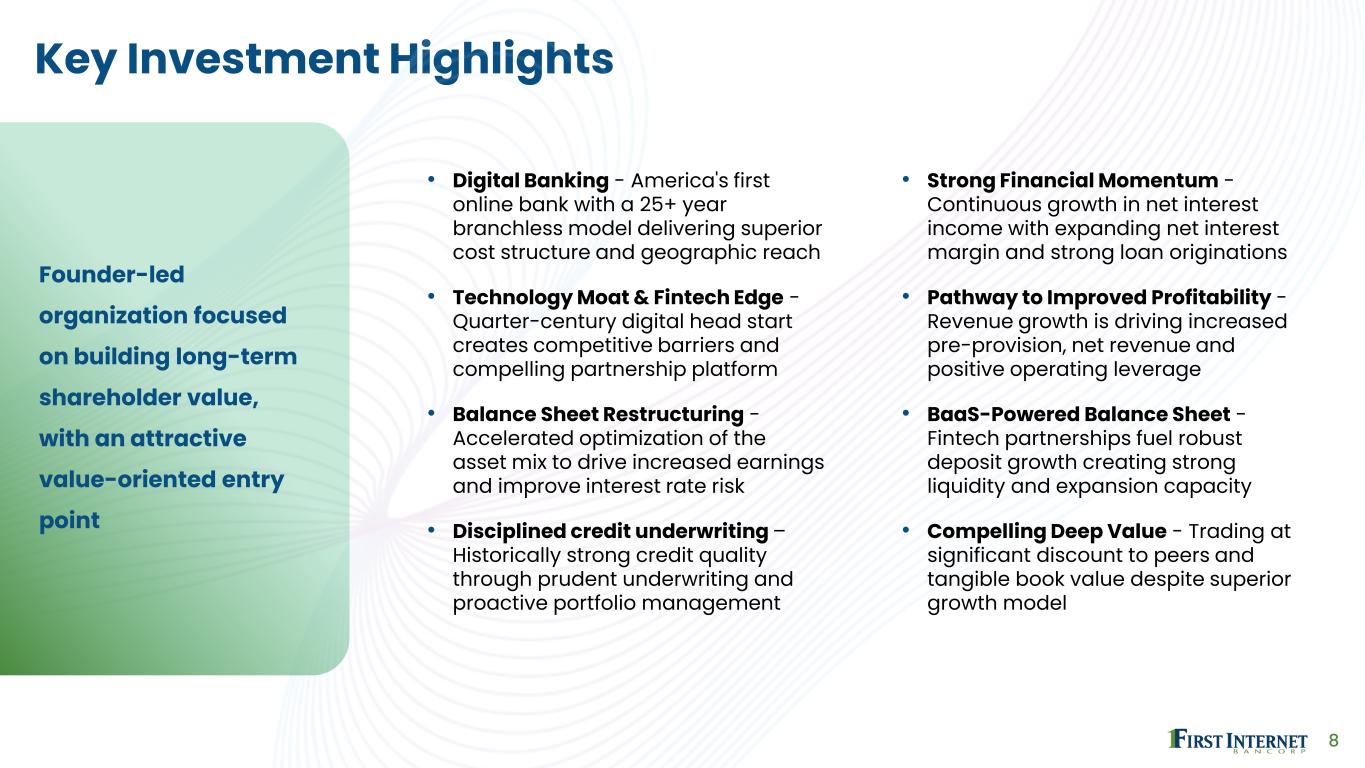
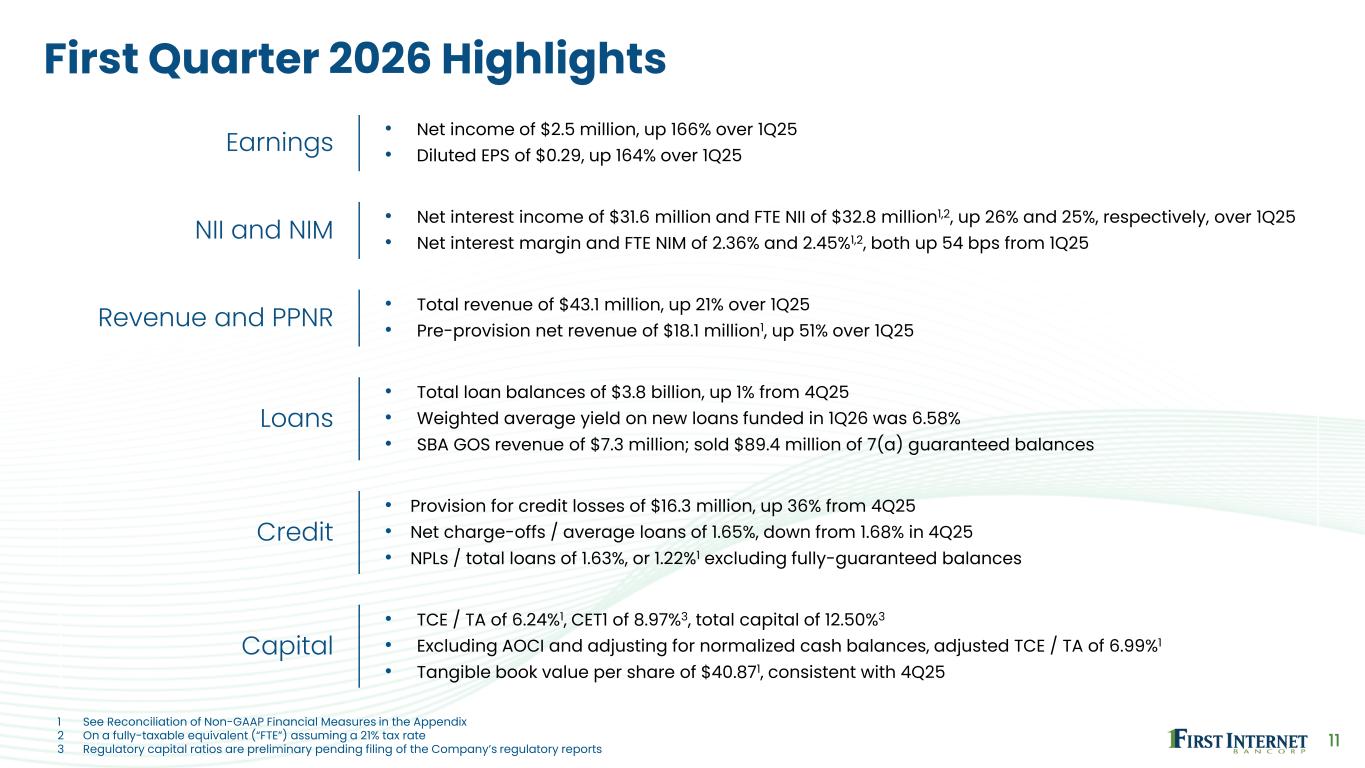
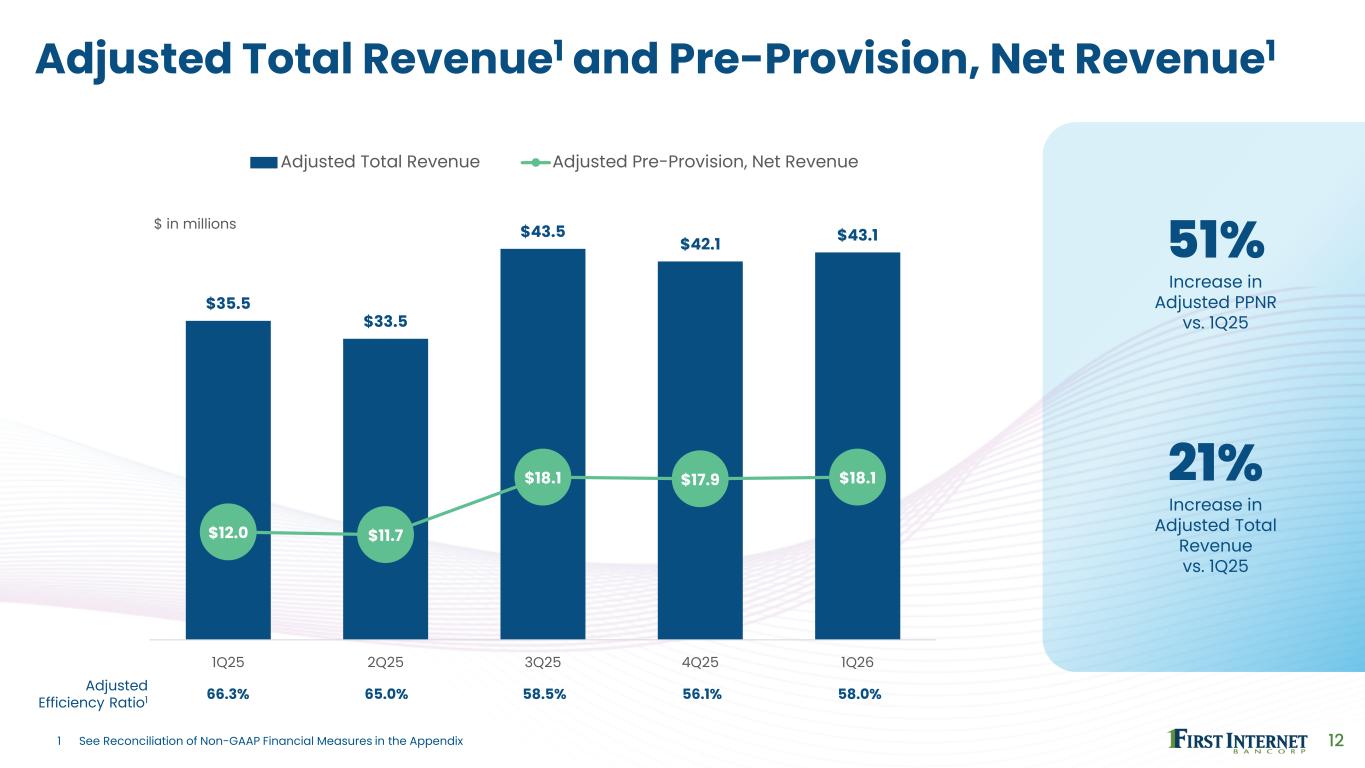
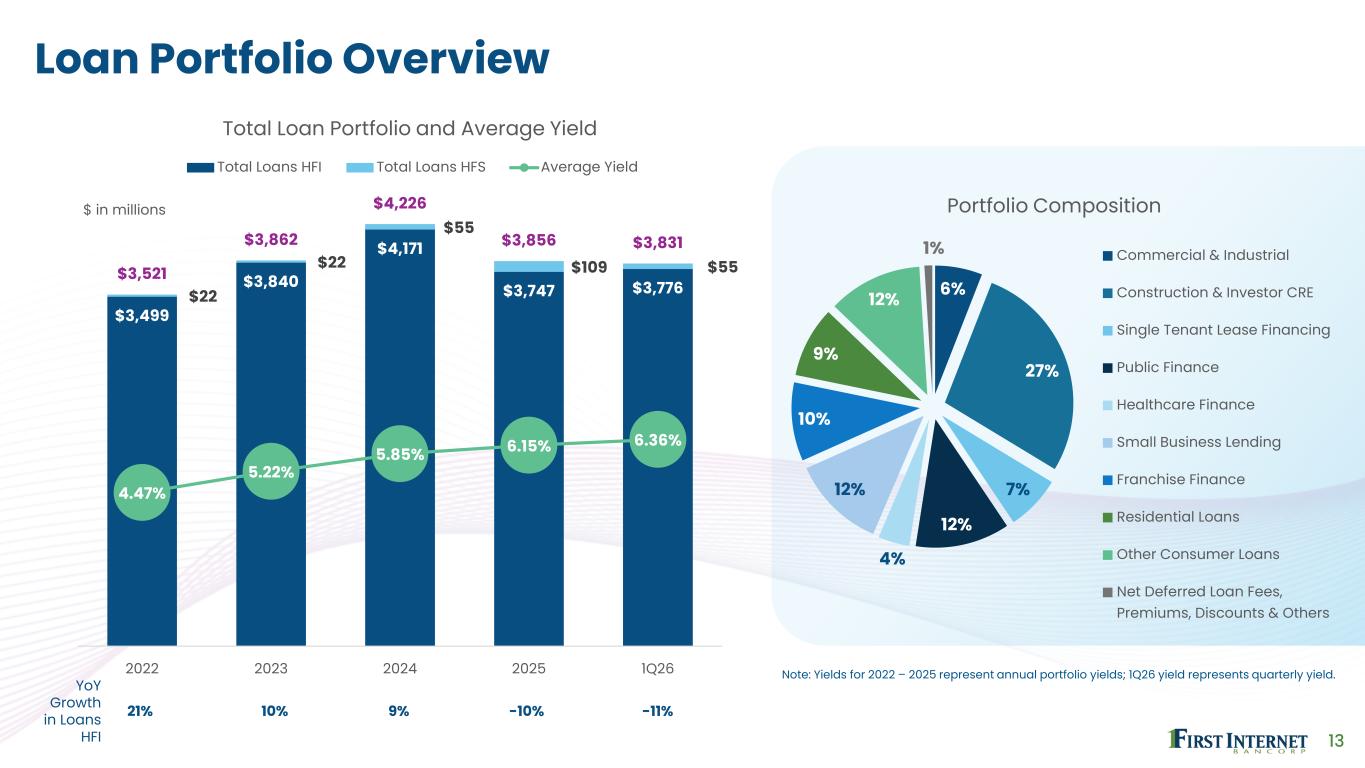
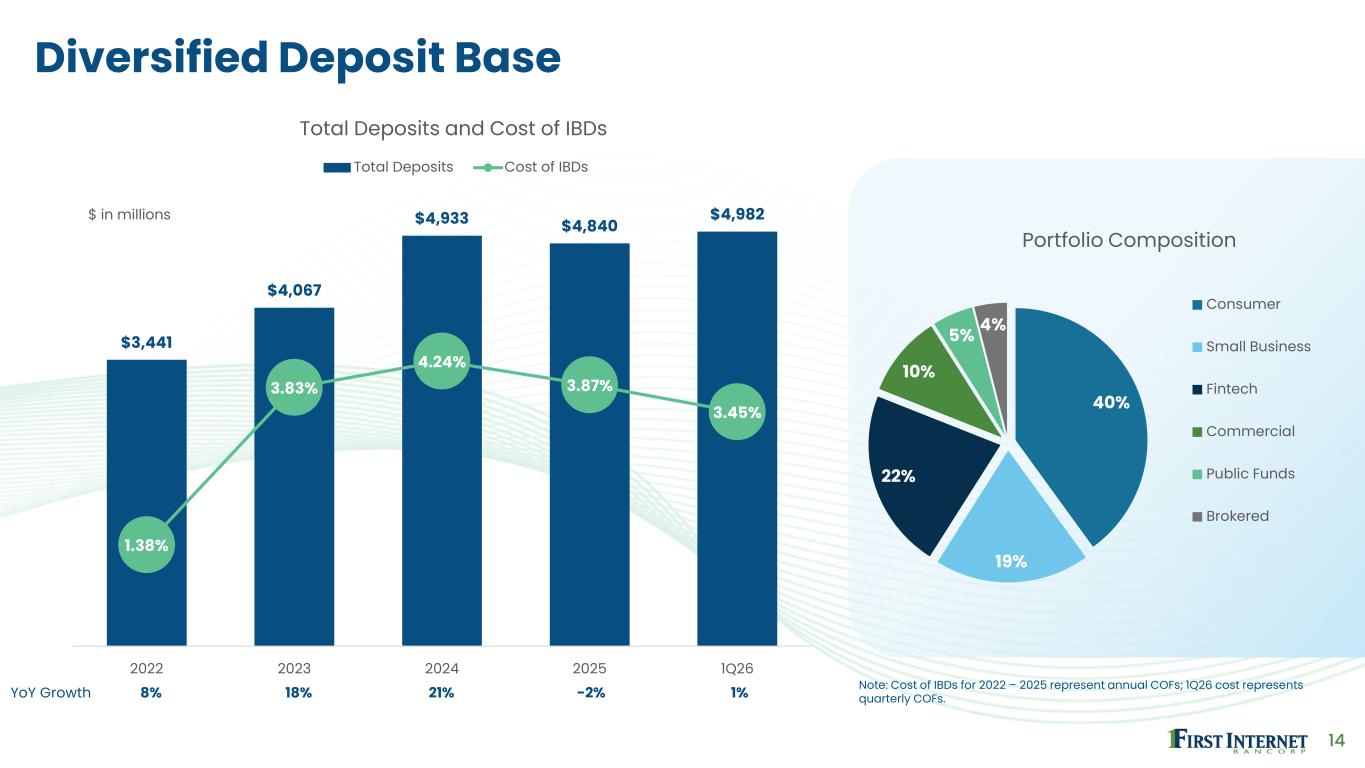
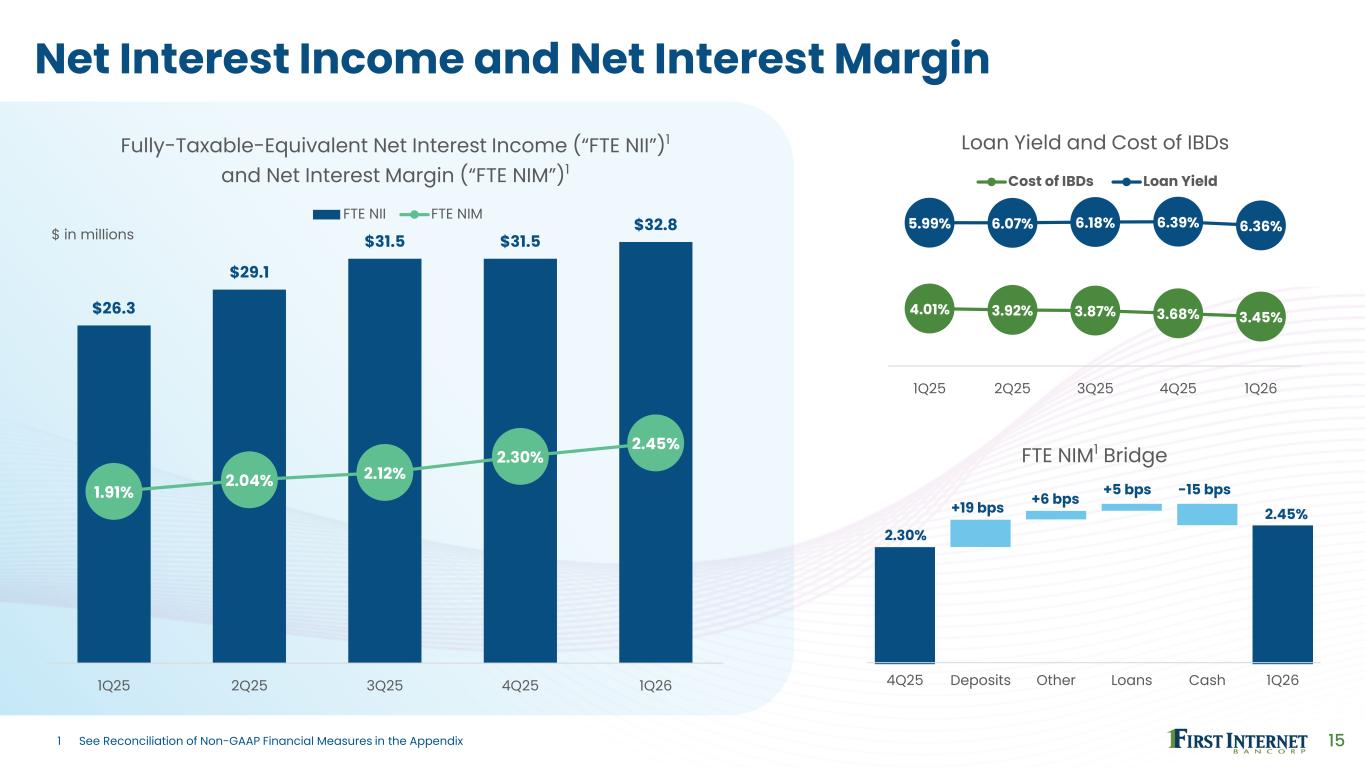
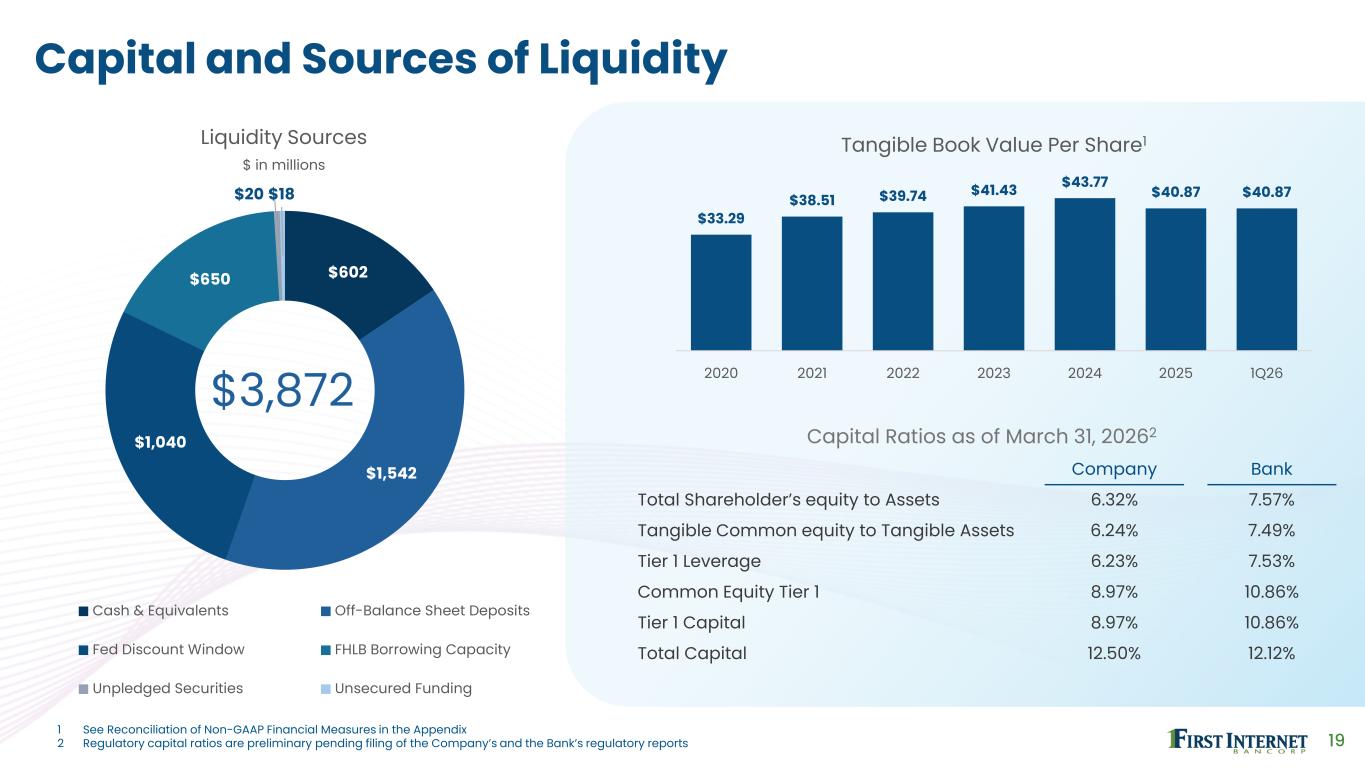
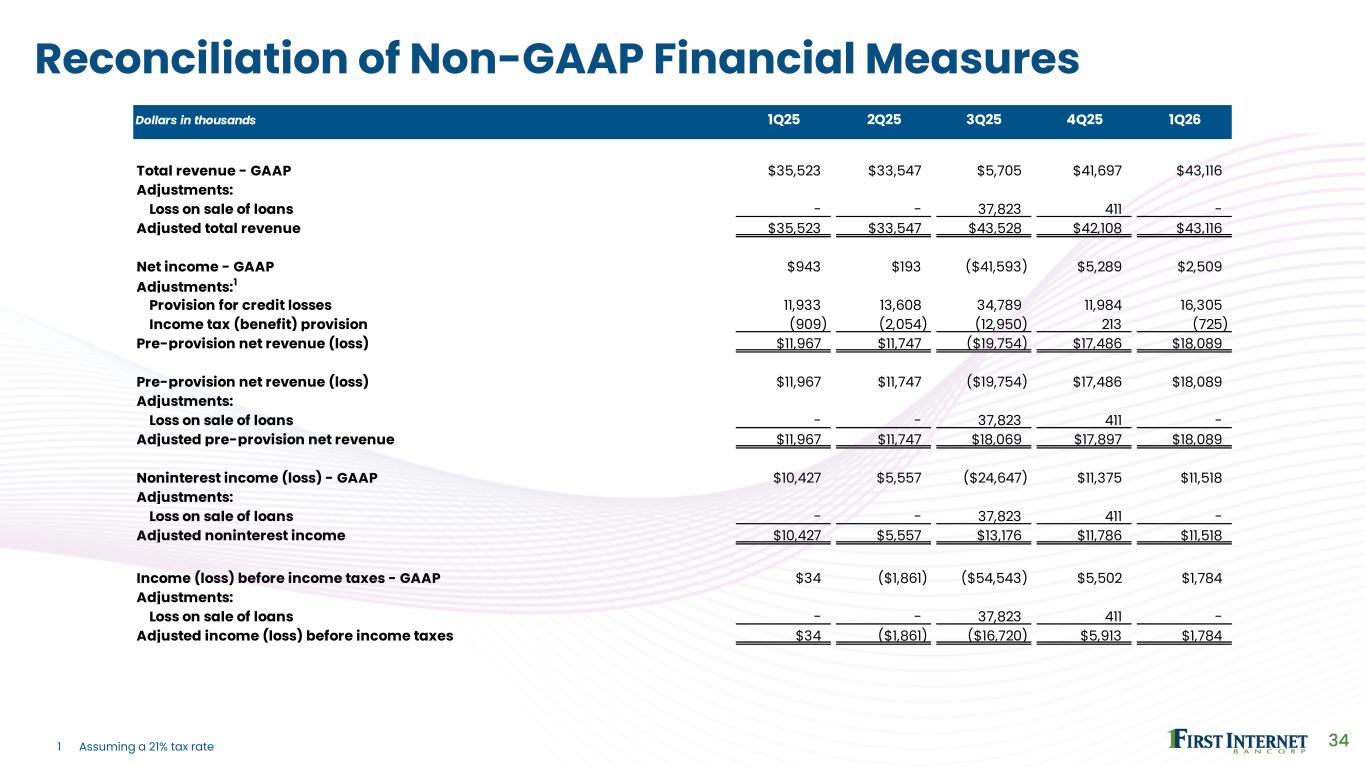
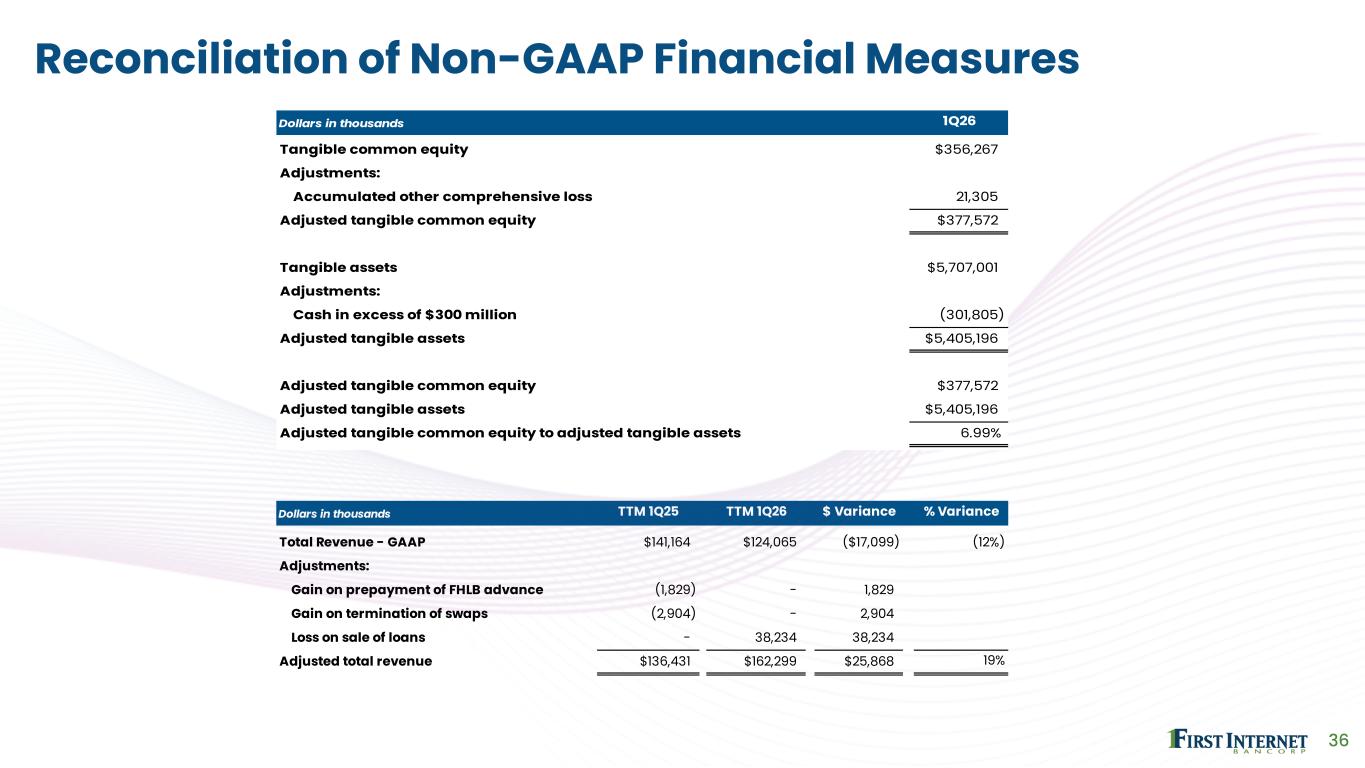
Thank you, Julia. Good afternoon, and thank you for joining us on the call today. We delivered strong first quarter results that demonstrated the resilience and strength of our diversified business model. We generated solid revenue growth, expanded our net interest margin and continued making meaningful progress on credit quality, all the while navigating an uncertain macroeconomic environment. Let me start with some of the highlights for the quarter. Total revenue reached $43.1 million in the first quarter, up 21% year-over-year, driven by a 26% increase in net interest income. Our fully taxable equivalent net interest margin expanded to 2.45 percent, a 54 basis point improvement from a year ago and 15 basis points sequentially. This margin expansion reflects the benefits of our proactive balance sheet management strategy and the power of our deposit franchise, combined with our scalable nationwide lending platforms. Pre-provision net revenue grew 51 percent year over year to $18.1 million underscoring our ability to generate strong operating leverage while maintaining disciplined expense management. This performance gives us confidence in our ability to drive sustainable profitability as we continue to work through our credit normalization process. On credit, our overall loan book remains solid and continues to perform in line with industry trends. In addition, we're seeing tangible evidence that the decisive actions we've taken over the past several quarters are yielding favorable results on the two problem portfolios, SBA and franchise. Our provision for credit losses for the quarter came in better than expected and we're observing improving trends in our portfolio with delinquency and non-performing loans headed in the right direction. The credit trends we're seeing, particularly in our SBA portfolio, reflect the impact of enhanced underwriting standards, more vigorous portfolio monitoring, and responsive problem loan resolution. On the growth front, our commercial lending pipelines remain robust across multiple verticals. Total loans increased to $3.8 billion with particularly strong production in single-tenant, lease financing, and construction lending, as well as in one of our emerging verticals, wealth advisory lending. While we maintain appropriately conservative underwriting standards, we're seeing great opportunities to deploy capital into high-quality commercial relationships at attractive yields. Turning to the other side of our balance sheet, total deposits reached $5 billion, up from $4.8 billion in the prior quarter. We continue to benefit from the strength and flexibility of our banking-as-a-service initiatives. Importantly, we're seeing continued growth in lower-cost fintech deposits, which has also allowed us to let higher-cost CDs and broker deposits mature without replacement. Our fintech deposit platform also provides us with significant balance sheet management flexibility. During the quarter, average fintech deposits totaled 2.4 billion dollars, an increase of over 186 percent from the first quarter of 2025. At quarter in, we had moved approximately 1.5 billion dollars of these deposits off balance sheets, optimizing our asset size while maintaining these valuable customer relationships and the associated fee income streams. This capability is a unique competitive advantage that enhances both our profitability and our capital efficiency. In our SBA business, while seasonality and tightened underwriting resulted in softer loan production for the quarter, we're pleased with the strong foundation we're building and how the business is positioned for long-term profitable growth. To further align our strategy in SBA, we've strengthened the business by promoting Gary Carter to the position of National Sales Manager. Gary rejoined us a year ago as our Senior SBA Credit Officer, bringing deep industry expertise, including his role at Live Oak Bank. That will help us continue building this business from the Sound Foundation. Our capital and liquidity position remained solid as we were able to closely manage the size of the average balance sheet while continuing to grow revenue. Regulatory capital ratios remain well above minimum requirements with a total capital ratio of 12.5% and a common equity tier one ratio of 8.97%, as well as substantial liquidity coverage. Moving to our strategic investments in technology and artificial intelligence, We continue to invest thoughtfully in digital capabilities that enhance the customer experience, improve operational efficiency, and position us for long-term growth. These technology investments aren't just about maintaining our competitive position. They're also about creating sustainable advantages in how we serve customers, manage risk, and drive operational excellence. Looking ahead, we're navigating an uncertain macro environment from a position of increasing strength. Our diversified business model is generating strong revenue growth. Our deposit franchise provides funding advantages and strategic flexibility. We've proven our ability to make difficult decisions and execute effectively. The credit challenges we've experienced are manageable in the context of our overall business. We've taken decisive action, strengthening underwriting standards, enhancing risk management, and addressing problem loans proactively. We see the benefits in improving trends and expect continued progress throughout 2026. We are not standing still. We're investing in AI and technology to enhance efficiency and customer experience, strengthening our commercial banking capabilities, expanding fintech partnerships, and repositioning our SBA business on a stronger foundation. We're confident in our strategy, our team, and our ability to deliver value for shareholders. I'll now turn it over to Nicole for operational highlights, including commercial lending, SBA, banking as a service, and credit.
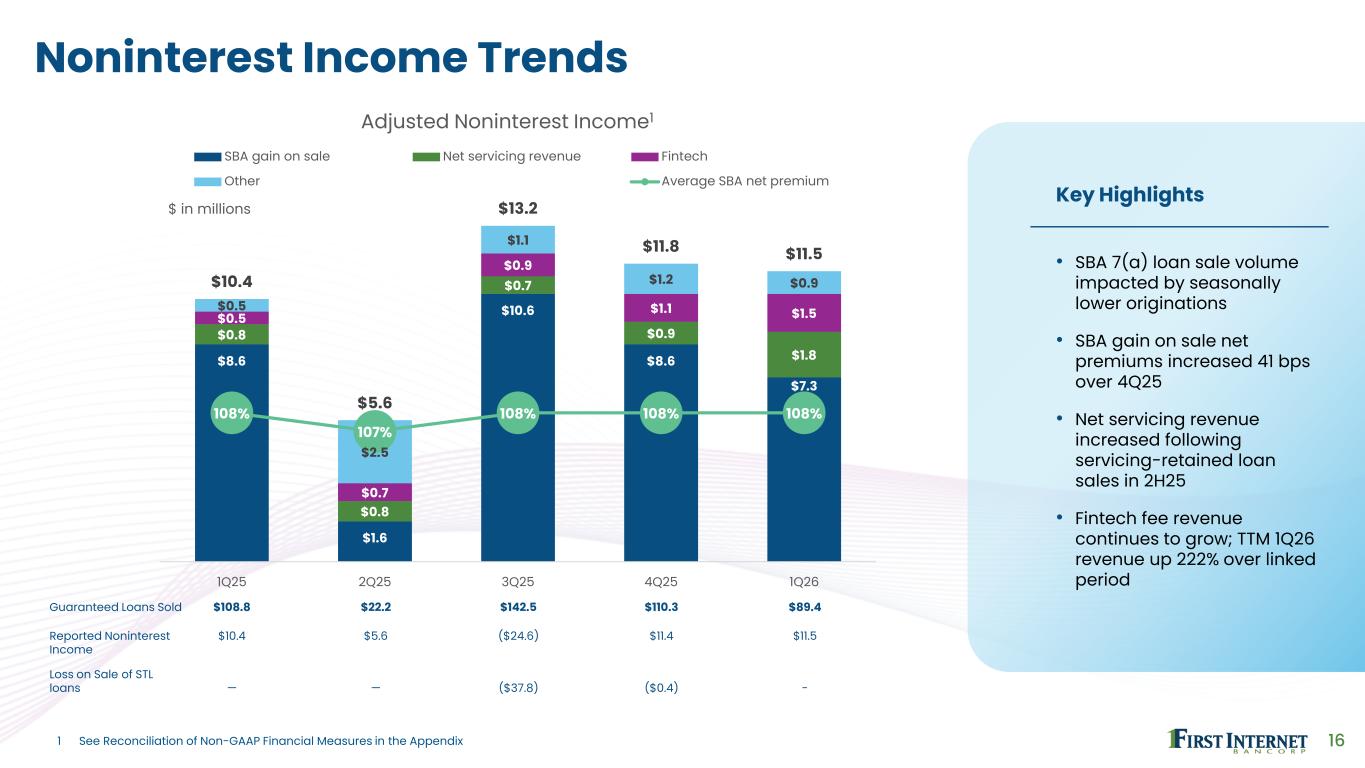
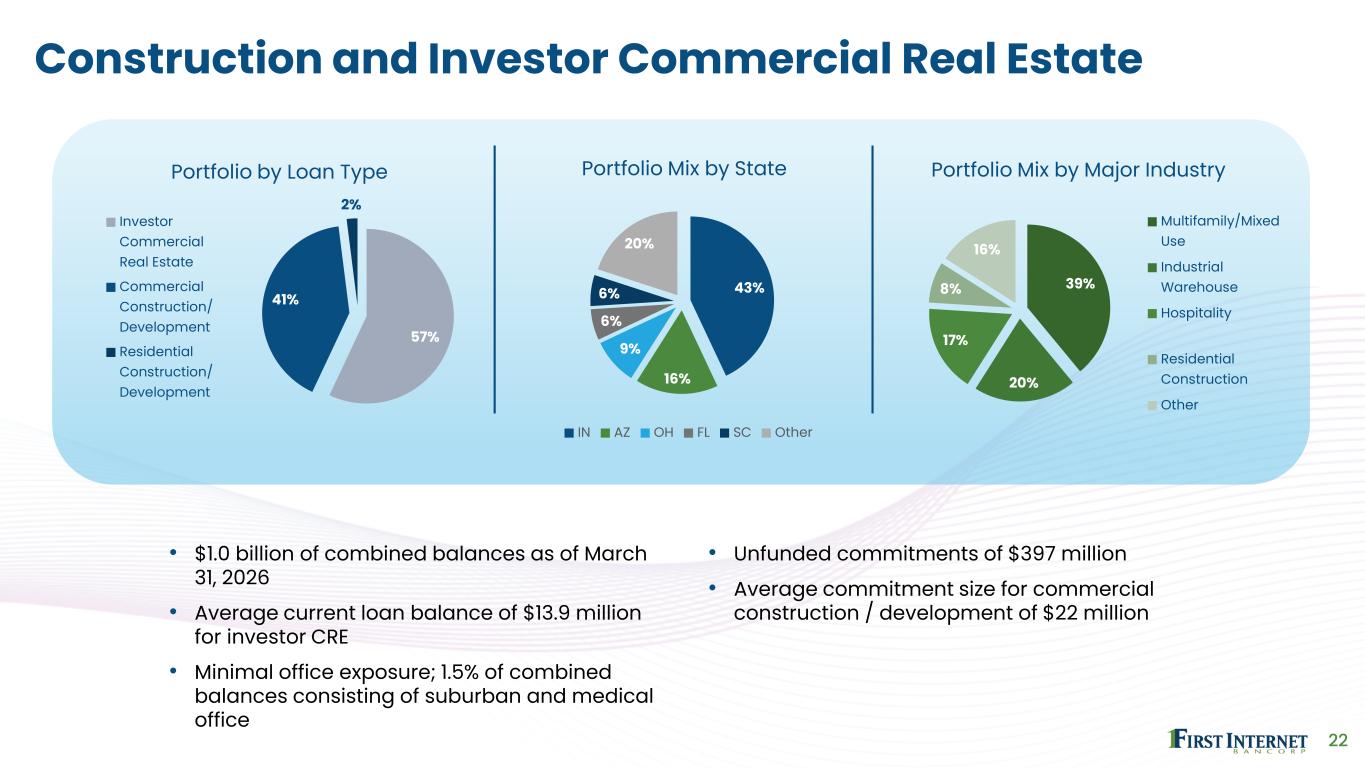
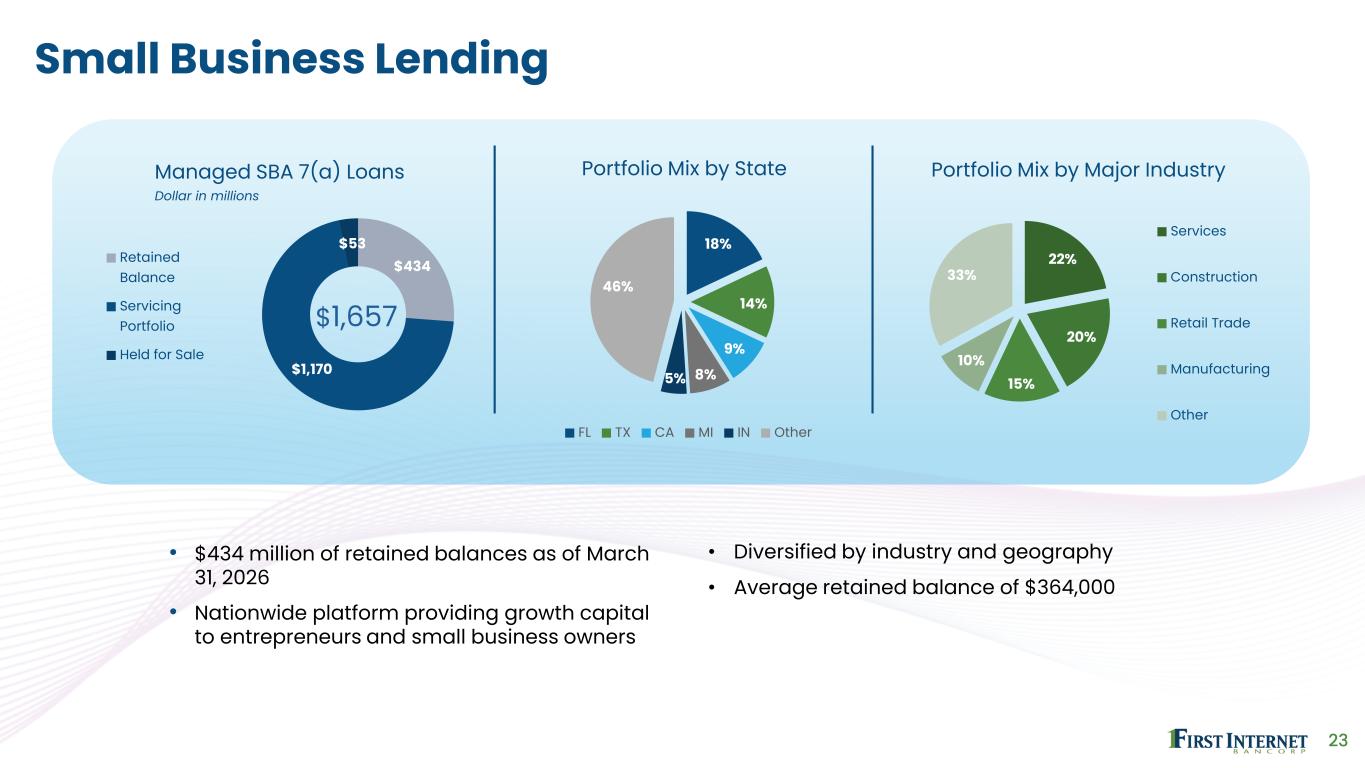
Thank you, David. Starting with commercial real estate, we saw solid first quarter activity, with particularly strong production and construction and single-tenant lease financing. These businesses continue to perform well, with strong credit quality and attractive risk-adjusted returns on new originations. We were also pleased to see higher balances in a couple of our emerging verticals, wealth advisory lending and equipment finance. The pipeline remains healthy, with disciplined underwriting and good yields on new commitments. Turning to SBA, as David mentioned in his comments, the deliberate shift we communicated in our last call that prioritizes credit quality over volume, combined with a seasonally lighter first quarter resulted in lower originations for the quarter. This translated into lower loan sale volume and lower gain on sale revenue compared to the linked quarter. Regarding gain on sale revenue, while premiums have been strong so far this year, we still expect to retain more production on our balance sheet in future periods, as the pricing on certain higher quality deals will not fetch quite the same premiums in the secondary market. We generally look at a 12-month earnback period when making decisions on whether to sell or hold loans. While this will impact gain-on-sale revenue for the year, it will be highly additive to net interest income and net interest margin in future periods. Nonetheless, barring any macroeconomic deterioration, we remain optimistic about the previously shared production and gain on sale targets for the full year. Importantly, while we're being selective about growth in this portfolio, we remain committed to small business lending as a core business. This is an attractive lending vertical with good long-term economics, and we have the platform, expertise, and relationships to compete effectively once we've fully worked through this current credit cycle. As to credit performance, we've made substantial progress over the past several quarters through proactive and prudent actions. We've significantly enhanced our underwriting standards, added experienced talent to our credit and portfolio management teams, and implemented more robust monitoring and early warning systems. We've also been proactive in working with our borrowers to prevent the formation of non-performing loans and we're seeing results. As of March 31st, delinquencies in the SBA portfolio have improved 118 basis points quarter over quarter and 126 basis points year over year. As we look ahead, our focus in SBA is on durability and consistency rather than near-term volume. Loans originated under our revised standards are showing more stable early behavior. While these newer vintages are still early in their life cycle, we're encouraged by what we're seeing in terms of borrower performance, responsiveness, and overall portfolio dynamics. The operational changes we've made across underwriting, execution, and portfolio oversight are now fully embedded in the business. This enables us to remain selective today while preserving the ability to scale responsibly as conditions normalize. Our objective is an SBA portfolio with attractive long-term economics and reduced volatility across cycles, and we are building with that goal in mind. In franchise finance, we continue to make progress working through problem loans. Our special assets team was busy during the quarter coming to resolution on several credits. While net charge-off activity remained elevated during the quarter, it more than offset non-performing loan formation as non-accrual franchise finance loans dropped to their lowest level in four quarters. Looking at our banking-as-a-service operations, we continue to see strong momentum with our FinTech partners. These relationships provide valuable deposit funding, generate attractive fee income, and position us at the forefront of innovation in digital banking. We processed over $82 billion in payments volume during the quarter, an increase of over 260% year over year through a carefully curated partner network. A reflection of our efforts to strengthen and deepen existing relationships while cultivating new partnerships. We are constantly evaluating new partnership opportunities while ensuring we maintain the highest standards of compliance and risk management. Across the bank, we continue to invest strategically in AI and automation to drive efficiency and enhance customer service. Our strong data foundation, built through previous investments in our data warehouse and integrated data sources now supports our infrastructure upgrades for AI agent processing. While scoping our own proprietary agents, we've already deployed third-party AI capabilities with measurable impact, such as fraud detection agents that screen outbound transfers before processing. Additionally, our virtual customer service agent resolves approximately 45% of inquiries, significantly reducing the burden on human agents and improving response times. The effects of this are validated by the favorable results from the Net Promoter Score Framework and customer listening program we implemented in the first quarter with our consumer and small business banking team. Out of the gate, our scores are well above industry average. We have built relationships through transparency and delivering on our promises, and that loyalty delivers strong returns. The diversity of our business model is another key strength. We have multiple engines driving growth and profitability. Our commercial lending is performing well. Our consumer lending remains stable. Our fintech partnerships continue to grow, and we're seeing improving trends in SBA. We're executing on all of this with appropriately conservative underwriting standards that position us for sustainable, profitable growth. I will now turn it over to Ken for additional insight into our first quarter performance and update to our 2026 outlook.
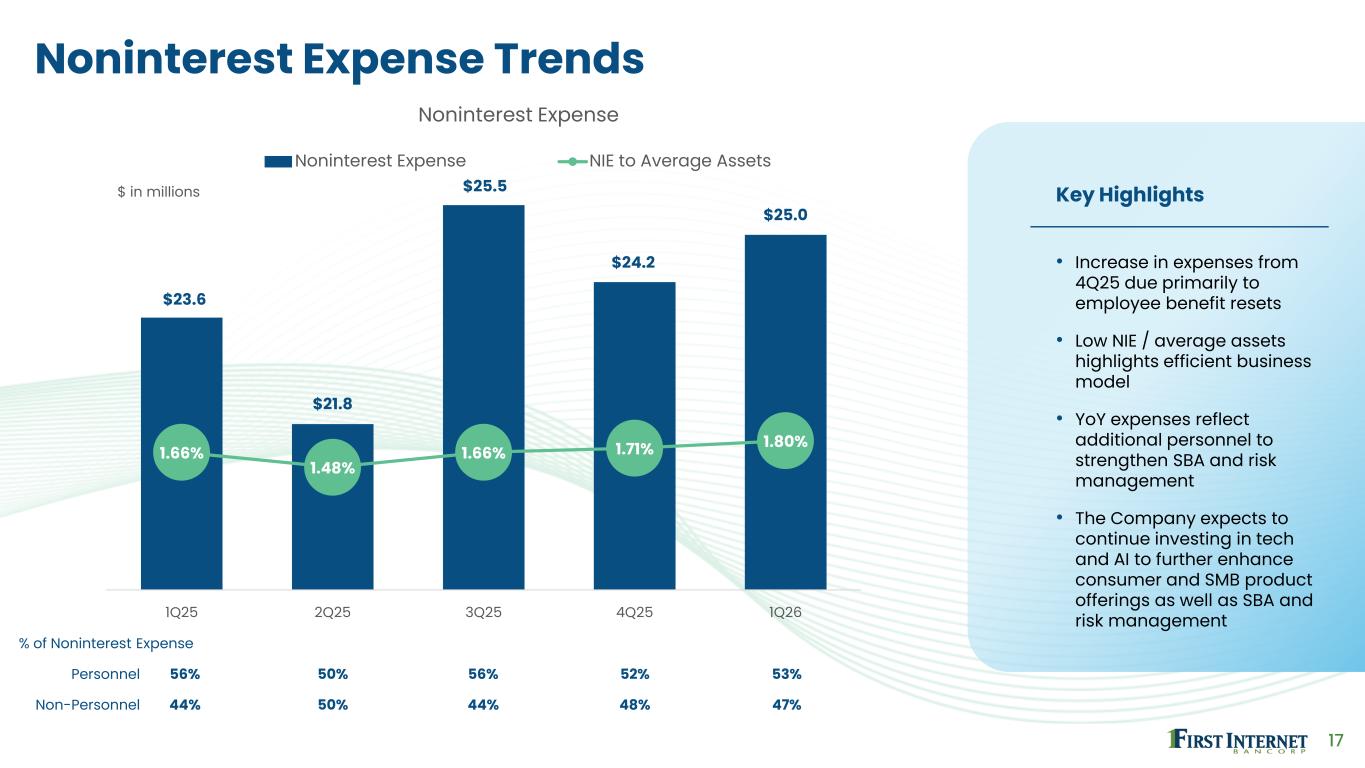
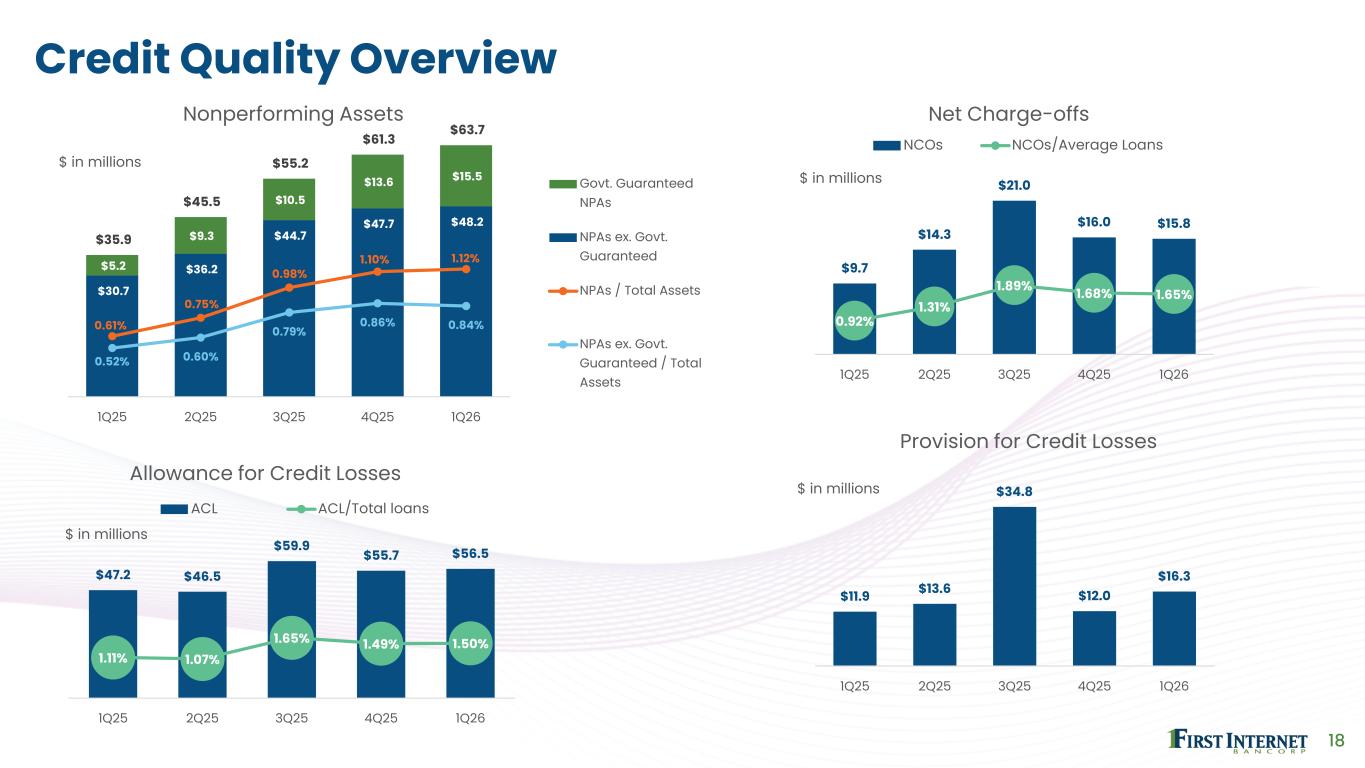
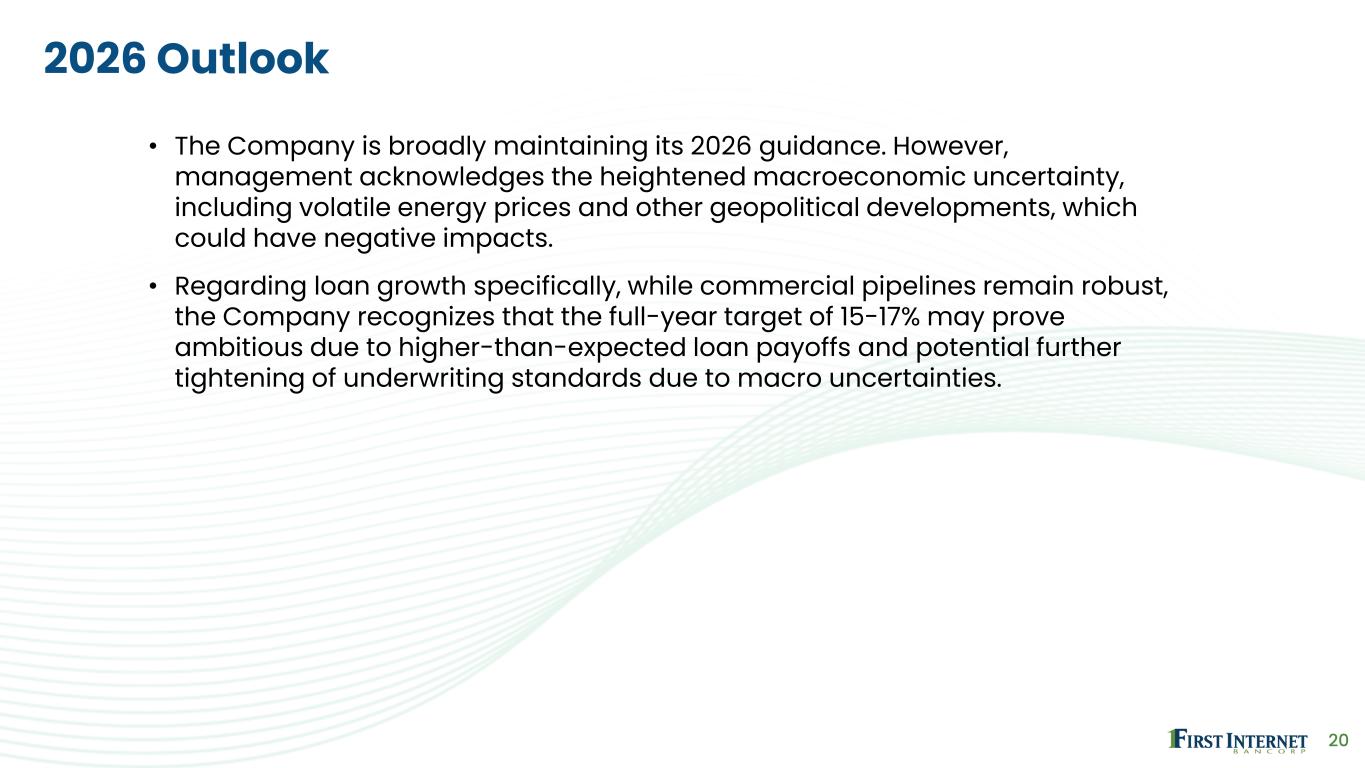
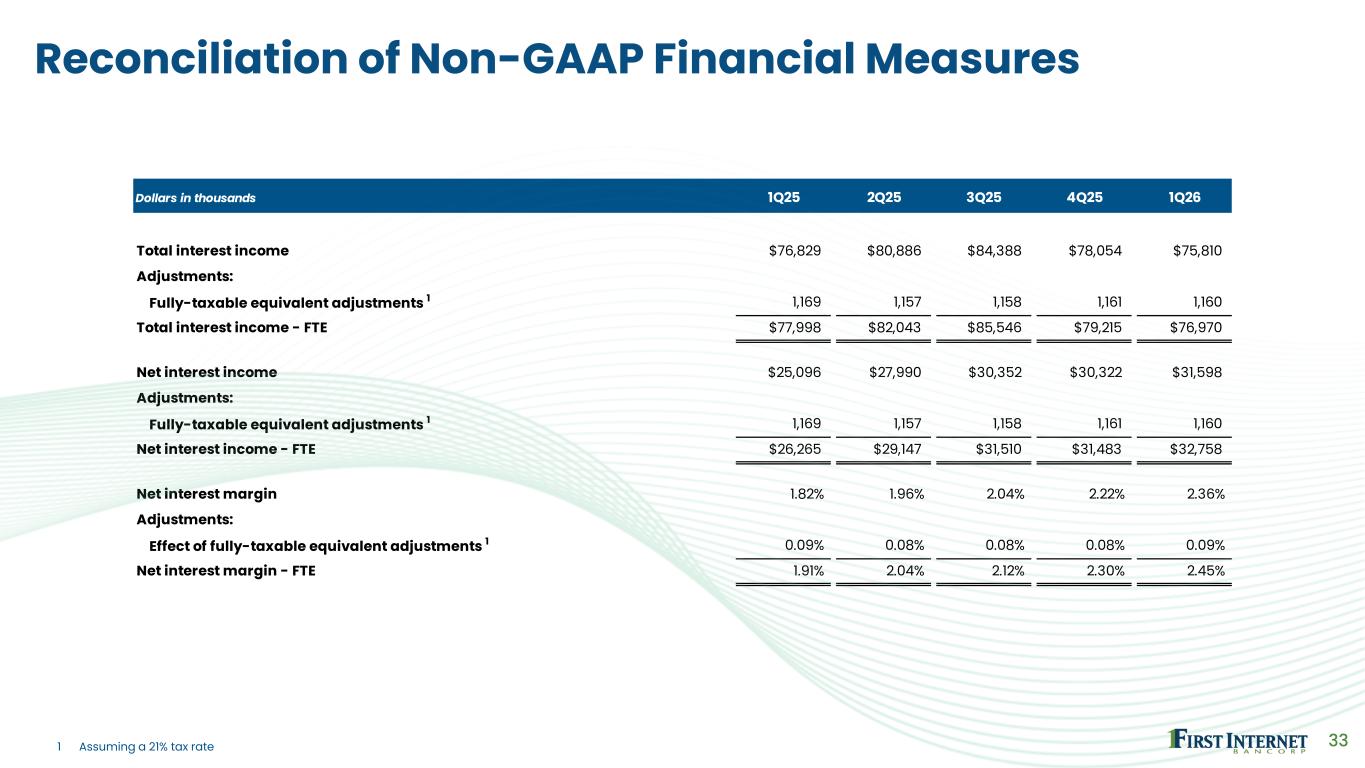
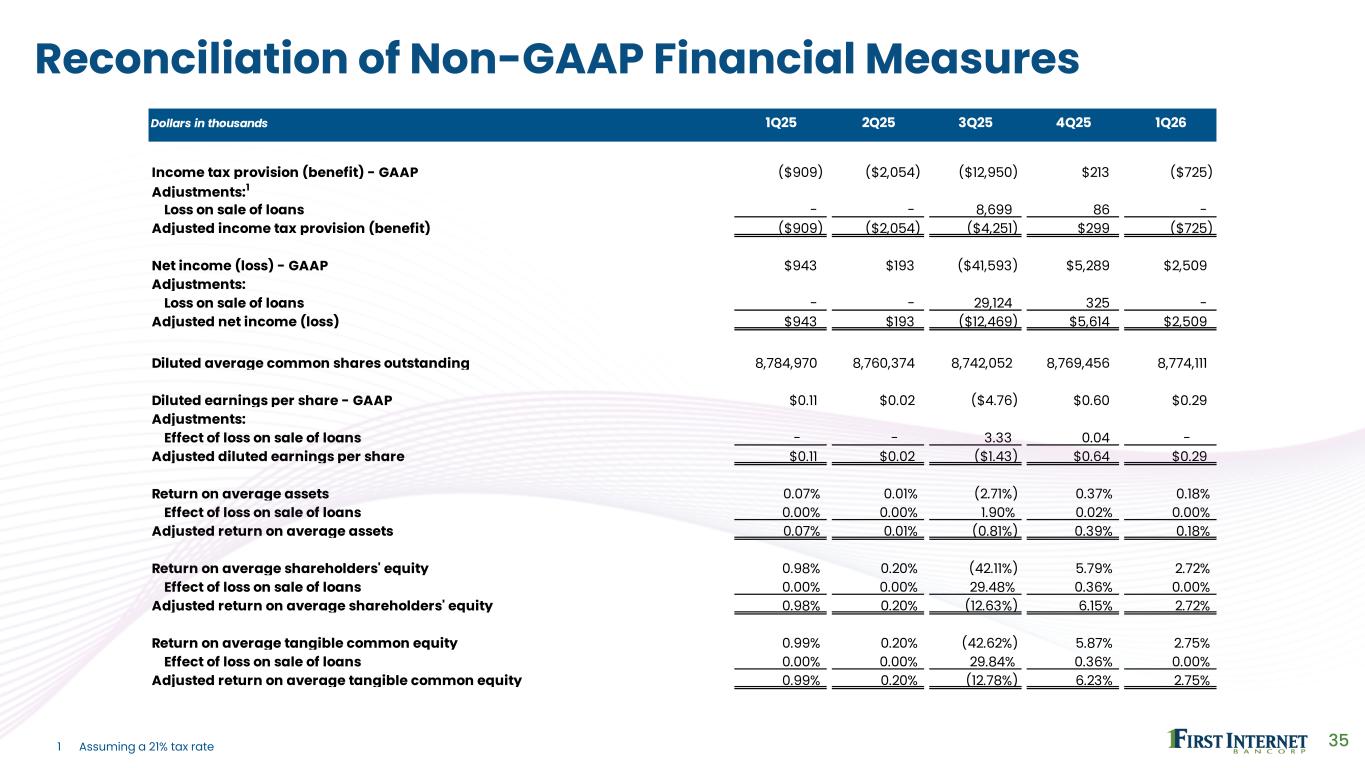
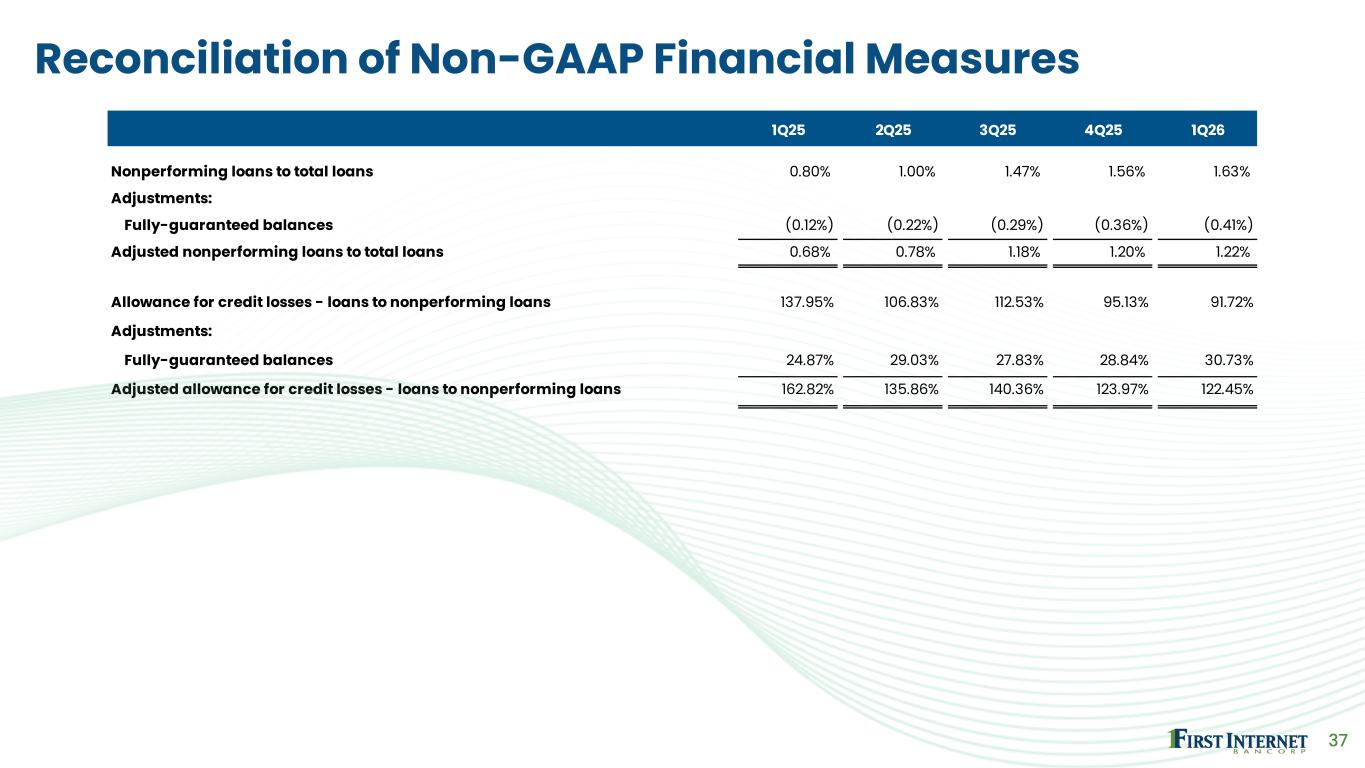
Thanks, Nicole. We are pleased to report solid first quarter results with net income of $2.5 million, or 29 cents per diluted share. Total Total revenue for the quarter was $43.1 million, a 21% increase over the prior year period, and when combined with well-managed expenses, pre-provision net revenue totaled $18.1 million, up 51% year-over-year. These results reflect our diversified business model, strong operational execution, and sustained business momentum across our core segments. Net interest income for the first quarter was $31.6 million, or $32.8 million, on a fully taxable equivalent basis, up about 26 and 25 percent, respectively, year over year. Net interest margin improved to 2.36 percent, or 2.45 percent on a fully taxable equivalent basis, up 14 and 15 basis points, respectively, from the prior quarter, and both up 54 basis points year over year. The yield on average interest-earning assets for the quarter rose to 5.67% compared to 5.57% in the prior year period, as higher rates on new loan originations more than offset the impact of Federal Reserve rate cuts in late 2025. We also saw a meaningful decline in funding costs during the same period, with the cost of interest-bearing deposits falling 56 basis points to 3.45%. The ability to maintain and increase yields on interest-earning assets in conjunction with declining costs of interest-bearing deposits demonstrates delivery on our years-long effort to reposition the balance sheet and optimize our mix of earning assets. Non-interest income for the quarter totaled $11.5 million, up almost 11% year-over-year as fee revenue from our fintech partnerships continued to grow, supplemented by higher net loan servicing revenue following the servicing-retained sale of single-tenant lease financing loans in 2025. David and Nicole both touched on our positive momentum in the banking-as-a-service space, which is evidenced by the growth in fee revenue, with quarterly revenue increasing over 200% compared to the first quarter of 2025 and increasing over 220% on a trailing 12-month basis. Non-interest expense for the quarter totaled $25 million, up only 6% year-over-year despite continued investment in technology and AI to enhance both front and back office operations and costs related to working out problem loans. Turning to credit, the provision for credit losses was $16.3 million in the first quarter, which was a little better than our initial expectations. The provision for the quarter included net charge-offs of $15.8 million dollars and additional specific reserves in our franchise finance portfolio. Relative to our original forecast, the lighter provision was due to a combination of lower loan balances and unfunded commitments, as well as updates to the assumptions in the CECL model. Our allowance for credit losses at quarter end was 56.5 million dollars, or 1.5 percent of total loans, up slightly from year-end. Non-performing loans increased to $61.6 million or 1.63% of total loans. However, a portion of the increase consists of fully guaranteed SBA 7A balances where the government guarantee substantially mitigates our loss exposure. Excluding fully guaranteed balances, non-performing loans to total loans drops to 1.22%. Another component of the increase in non-performing loans was accruing loans 90 days or more past due. However, the largest portion of this increase, about $6 million, relates to one relationship that we expect to pay off in full in the second quarter. I will also note that our SBA team was successful in bringing some past due borrowers current shortly after quarter end, reducing delinquencies even further. At quarter end, the ratio of the allowance for credit losses to non-performing loans was 92%. Adjusting non-performing loans to remove the fully guaranteed SBA balances, the allowance coverage ratio improves to 122%. While we are pleased with the improvement in non-performing loans and delinquencies, our updated allowance for credit losses model reflects our expectation that the provision for credit losses will remain elevated in the second quarter, but then improve gradually in the second half of the year. Total loans as of March 31, 2026, were $3.8 billion, an increase of $29.1 million, or 1%, compared to the length quarter, and a decrease of $479 million, or 11%, compared to March 31, 2025. David and Nicole both covered some of the lending highlights from the quarter where we experienced growth. Overall, origination activity was fairly strong across our commercial and consumer areas. We did, however, experience some early payoff and maturity activity in the franchise finance, public finance, and recreational vehicles portfolios, and in particular saw early payoffs of some large balance relationships in the investor commercial real estate portfolio, which impacted total loan growth during the quarter. Total deposits as of March 31, 2026, were $5 billion, representing an increase of $142 million, or 3%, compared to December 31, 2025, and an increase of $36 million, or 1%, compared to March 31, 2025. David talked about the continued strong growth in fintech deposits, which has allowed us to further improve the mix of deposits and drive funding costs lower. Average CD and broker deposit balances, our highest cost of deposit funding, were down over $180 million from the prior quarter. The weighted average cost of maturing CDs in the first quarter was 4.19 percent, while the average cost of fintech deposits was 3.19 percent, and the cost of new CDs was 3.62 percent. As the cost of maturing CDs in the second quarter is 4.11%, and in the third quarter is 4.06%, we have the ability to drive funding costs lower throughout the year and, hence, drive net interest income and net interest margin higher, even in a flat rate environment. Looking at our full year 2026 outlook, we're broadly maintaining the guidance we provided in January. However, we want to acknowledge the heightened macroeconomic uncertainty we're navigating, including volatile energy prices and other potential geopolitical developments. While we're confident in our business momentum and strategic positioning, we're taking a measured approach given the current uncertain environment. With regard to loan growth, while our commercial pipelines remain robust and our consumer business continues to produce solid results, we recognize our full year target could prove ambitious given higher than expected loan payoffs and the evolving macro headwinds, which could lead to further tightening of underwriting standards. We're closely monitoring the current environment and will provide updates as the year progresses. In summary, we feel confident in the underlying momentum of our business and our ability to navigate the current macro environment while positioning the business for accelerating profitability in the second half of the year and into 2027. with that i'll turn it back to the operator for questions thank you we will now begin the question and answer session and your first question comes from the line of nathan race with piper sandler your line is open please go ahead hi everyone good afternoon thanks for taking the questions um just wondering if you could just help us um kind of unpack the charge-offs a bit
and more so this quarter, and just generally what kind of visibility do you have into charge off over the balance of this year? I know you guys have spent a lot of time scrubbing the SBA portfolio. We're just curious, within that context, how we should think about the 50 to $53 million provisioning forecast that was laid out last quarter for this year.
Yeah, I think as we think about it, I think it's still very similar to what we had talked about last quarter, where we expect the bulk of it in the second half of the year. In terms of, you know, charge-offs for this quarter, you know, we had, you know, 15 to 16 million of charge-offs. I think where, you know, where SBA, you know, I think our SBA came in line with what we were forecasting. Our franchise number was a little bit higher because we took action on some other credits probably sooner rather than later. but I think, you know, I think we still continue to feel like first quarter is probably going to be the worst of the quarters, and second quarter, you know, you can look at even though we made progress on reducing non-accrual, unguaranteed SBA balances, and franchise balances, you know, we still have elevated non-performing loans that we need to work through, but, you know, our special assets team is working through those. And I think we'll probably see some resolution on many of those here in the second quarter. And I think by the time we get to the third and fourth quarters, you know, I think our feeling is that we'll be through a lot of the, you know, kind of some of the older vintages where there's probably still some potential problems. And by the time we get to the end of the year, you know, the credit costs are going to, you know, be at a far more moderate level.
Okay, got it. That's really helpful. Maybe changing gears to the margin. You know, with the Fed on hold, I think that's a bit of a headwind in terms of deposit repricing. But David, you mentioned a lot of success you're having, you know, bringing on some lower cost deposits from some fintech relationships.
So just curious, you know, how you're kind of thinking about the margin trajectory over the next few quarters, assuming, you know, the Fed remains on pause and just trying to jive down with the uh nri growth expectations for this year that were laid out last quarter of i believe 155 to 160 million we're sitting here nate ken and i are pointing fingers back and forth he's uh on it yeah the net interest margin the biggest issue that we have out here even without and we did not put in our forecast at the beginning of the year uh any rate decreases we did have not come back and modified it with any rate increases yet But from the get-go, we weren't anticipating any rate fall off this year. But because of the CDs that are maturing and running off, as Ken said earlier, they're north of 4%. New CDs that we're adding and rolling are in the 3.6 range. So there's a gap there, but even better yet on the fintech deposits are coming in at about 3.19, almost 100 basis points improvement. So that'll continue throughout the course of the year. We have another 800 million rolling between now and year end. So we could be up in that 290 range by the end of the year.
Yeah, I think, Nate, in terms of what we, I mean, kind of similar to what we talked about last quarter, I think our forecasting still holds that we'll probably, I mean, feel like a 10 to 15 basis point improvement through the 10 to 15 basis point improvement per quarter through the end of the year is a very, very achievable target on our end.
Okay. And then, David, I believe you said to get you to the 290 by the fourth quarter, if I heard you correctly? Yeah. Okay. Great. All right. I'll step back. I appreciate all the color. Thanks, everyone.
Operator
Your next question comes from the line of Brent Rabbiton with Stone X Group. Your line is open. Please go ahead.
Hey, good afternoon, everyone. Wanted to just continue to talk about guidance. And you just mentioned the 290 guidance. I think for the outlook in January, you mentioned 275 to 280 by the fourth quarter. You know, it sounds like the only tweak that you've made, if I'm hearing this right, really is, you know, you're a bit more conservative on, on that 15 to 17% loan growth target, just given some uncertainties. Um, but I was a little surprised you didn't tweak down maybe the expense guide a little bit from 111 to 112. Um, you know, and then also it seemed like the fee income guide could have increased, um, you know, any, any thoughts on the income and expense guidance and just the variables that, that might impact that.
Yeah, I think on the expense side, Brad, I think we're, the guidance we had out there before, I think we're good keeping it there to, just for conservatism. I do think, you know, if, for example, in the macro headwinds, if you will, impact originations, or you know, if maybe the SBA originations are lighter in the first half of the year, whatever we have we have some offsets on the expense side certainly an incentive compensation you know tied to loan origination so there there are definitely some offsets there on the expense side that would take that number lower and then on the fee side too there there's levers there too I mean as we you know Nicole said in her comments that you know we expect to retain more balances going forward in SBA given some of the higher quality deals we're doing. But, you know, as we put in our deck, you know, look, premiums are holding in there on gain on sale. So there, you know, there could be if the premium levels hold up near the high end of the range, I mean, there's the opportunity to sell more into the secondary market and drive higher fee income, you know. So there's a number of different levers there that could offset at perhaps any shortfall in the loan growth.
Okay, so there's leverage to both of those line segments. Yeah, absolutely. And then I know you guys have been working really hard on the franchise and SBA. You know, when I think about the macro, you know, of higher oil prices, I guess the only piece of your portfolio that I start to think about would be the RV portfolio and I know quite a few of that or a lot of that is this is not rvs per se it's horse trailers and things that people use for for work but you know have you guys seen any migration in the rv books you know as you've been looking at that portfolio just to you know watch it as as oil prices slash gas um that's been higher that's a great question brett i'll take that one uh we actually just had a credit committee meeting this morning and we're talking around the table with all of our lending
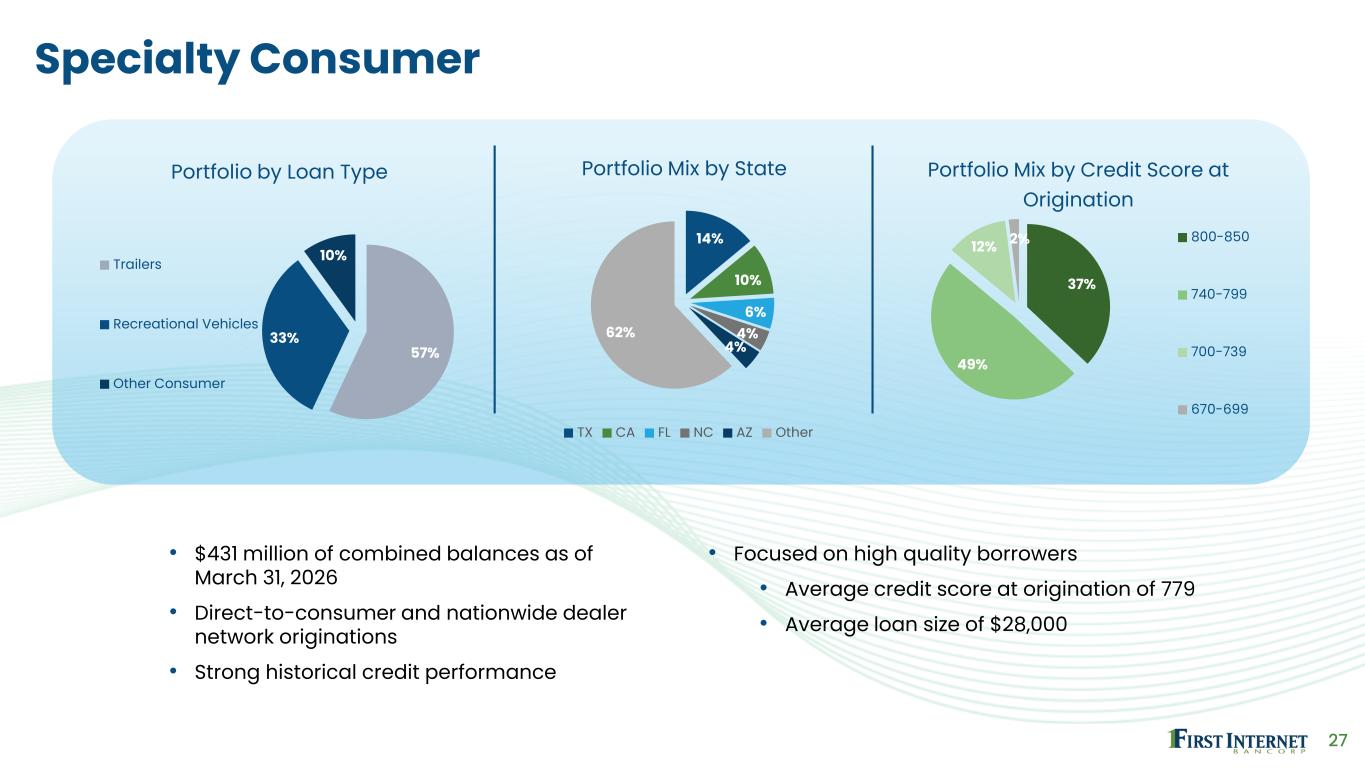
lines about the impact of fuel prices. I think diesel fuels up over a dollar per gallon, and certainly regular gasoline is as well. Our consumers have not been affected. We are not seeing any increase in delinquencies or any problem loans in the consumer book as a result to fuel prices. The horse trailers in particular have always performed well, even with headwinds. Other lines of business that could be, and in fact, originations are very solid. So even in this first quarter, and the conflict has been going on for a little over a month now, so we're not seeing any depreciable decline in new originations with people spooked by the prices. So that's a positive sign. In other lines of business, equipment finance, we do some lending for fleet vehicles. We're not seeing any issues there that are related to fuel prices. We've also done some outbound contacting of our top SBA customers who are most likely based on their industry to be affected by fuel pricing. So that's not just transportation, but it's anything that would have a fuel component to it. And we're hearing no issues related to fuel pricing at this point. Some have had to pass along price increases to their customers, but overall we're not seeing any weakness in the portfolio as a result.
Certainly we all hope that the conflict gets resolved even later. yeah that's uh i think everyone hopes that um and then if i could just ask one last one you know just around you guys highlighted the 82 billion of payments processed um when i think about some of the stuff that you've been doing in fintech i guess i look at the fee income and just think that that that you know there should be some momentum and fees aside from whatever happens to the sba bucket you know do we start to see bigger fees related to all this all these things you're doing in fintech or or is that just going to be um you know a process over time it just it
just seems like you're gaining some momentum on fintech side but it hasn't yet showed up in really in a meaningful way on the fee side well we are seeing some momentum there and i think what's important is that we have negative net revenue churn, which means we are seeing really good retention from our existing programs. And we have been able to increase our fee structure in a way that helps us to support them and support the growth of the program. We're not bringing on new programs at a rate that we cannot sustain. So we always have a backlog of customers that we've been talking to. We're in due diligence with half a dozen programs, but we're trying to make sure that we're bringing them on in a really responsible way, and we have some solid partners that are meaningful. So I think on a year-over-year basis, we've doubled the fees that we're seeing in our FinTech partnership line of business, but it does show up in different ways across our our income statement. For instance, uh, the balances that we've been able to push off balance sheets, um, those are not showing up in the interest, um, income or interest expense, but those are showing up in non-interest income. Um, you're also seeing the fees and the non-interest income, and then we do have a couple of lending programs, and those are going to show up then in, in, uh, interest income. Does that help?
That is helpful. Do those, do those things show up in the other line or what, what line item do those show up in?
Yeah, Brett, they really show, they show up in the other line item. Well, in two, they show up in the other line item. They also show up in the services and fees, service charges and fees line item. But just to put some numbers around that, I mean, in, in the fourth quarter, we had about, just to call it a little bit over one million for the quarter in fee income. In the first quarter of 26, we had a little over one and a half million of fee income. So to Nicole's point, with some of the momentum that we're getting with some of the existing partners, higher volumes, higher payments volumes, higher deposits, more deposits pushed off balance sheet. I mean, if you run rate that, you're talking about a 50% growth year over year and you're starting to talk about real dollars okay and ken just to be clear that that 1.5 that that encompasses all of your all of your fintech operations yeah that's that's just that's just fees right that doesn't include any interest income from any of our lending partners um that's just pure fee income yeah okay great appreciate that color thanks everybody Thanks.
Operator
Your next question comes from the line of Emily Lee with KBW. Your line is open. Please go ahead.
Hi, everyone. This is Emily stepping in for Tim Switzer. Thanks for taking my question.
Hi, Emily. Yeah. So, you mentioned you're in due diligence with about half a dozen programs right now for on the FinTech side. Can you speak more on just those partners in the pipeline and maybe the projected timing of those launches or an idea of kind of potential earnings impacts surrounding those?
Well, we are not known for being easy in the fintech space. In fact, I think we've gotten a reputation for being one of the tougher due diligence programs out there. So we certainly kick the tires and give them a good opportunity to understand what our expectations are because, in fact, we are the regulators of these programs because they are, in fact, our customers in many cases. So right now, I know we have a couple of lending programs that we are taking a look at. We also have a couple of deposit programs that are out there. We have one that is moving much closer to approval, and so I think that would be a second quarter onboarding event. But some of them, you know, some of them will go more slowly, especially when there is a consumer lending program involved, for instance. That's going to be probably the longest due diligence process. Something that might be a business payments program can be a bit faster. It just depends on the nature of the program and when that starts to show up. also depends on whether or not the program is existing with another financial institution as a sponsor bank. A conversion is a different beast and usually can be quicker to have an impact on the financial statements as opposed to a brand new program that needs to ramp up itself. So it all depends is the very official answer to that. But we have some that we do expect to be bringing on in the next quarter and then the third quarter as well.
Understood. Thank you. And then also just on the NIM, you mentioned, you know, 10 to 15 basis points of improvement per quarter through the end of the year as a very achievable target. That's if the Fed doesn't cut, but what would be the impact of 125 BIPs cut?
If they cut, and this is, keep in mind, we run this on a static balance sheet. So this doesn't impact, you know, this doesn't take into account growth, but on a static balance sheet you're talking about probably 2.2 to 2.3 million dollars annually of net interest income yeah great got it uh well thank you for taking my questions yep thanks emily your next question comes from the line of george sutton with craig hollum your line is open please go ahead hey guys uh this is logan on for george um first one for you i was wondering if you could just kind of talk about the loan-to-deposit ratio.
Logan
Analyst — Craig-Hallum
I've got it kind of stepping down again this quarter and you've talked about how it's kind of, you know, a historically low point for you guys. I wonder if you could just sort of address sort of the path for that from here, especially as we think about potentially lower loan growth this year and just sort of how you plan to manage that.
Well, I think over the course of the year, we expect the loan-to-deposit ratio to increase. You know, we ended the year with pretty healthy cash balances, and it's kind of hard to look at any particular quarter-end cash balances because sometimes they're inflated due to payments activity at the end of a month. But we do have, in our minds, excess cash that we can, you know, just take out of the cash and deploy, so we probably see that ratio. you know, if we're at 75, 70, you know, 76% this quarter, you know, probably gradually stepping up and probably being somewhere closer to 85 to 90% in the fourth quarter. And I think that's, you know, we like that because you're obviously, you're deploying cash into higher interest earning assets, loans, but on keeping the balance sheet relatively, you know, keeping balance sheet growth to a minimum?
We had a couple very large commercial loans, literally one paid at the last day of the quarter that was over $50 million and knocked it down. So that kind of messed up the ratios pretty quickly. But as we are in that commercial market now, we can have some pretty big swings. And as Ken said, we have swings on the deposit side at quarter end because of bill payment services and we also have people trying to close deals or clear them up by quarter end so that number didn't intentionally go down it was just a matter of math and the way things happened in that last week of the quarter okay got it um and then maybe maybe just a high level one for you david i mean the last few quarters you kind of mentioned that you know returning to that one percent return on asset level and obviously there's a lot of moving dynamics this year but but maybe just talk about sort of the steps that you need to take to to sort of get back there and call it the the medium term yeah we get back to our what we think our numbers are for the fourth quarter that'll set us up to be back into the one percent return for 2027 and we just continue the improvements We've got a great base taking that number forward through our calculations. We'll be right back at 1% by the end of 2027.
Logan
Analyst — Craig-Hallum
Okay. Thanks, Logan.
Operator
Your next question comes from the line of John Rodas with Breen Capital. Your line is open. Please go ahead.
Good evening, everybody. um hey can the uh what drove the tax benefit this quarter and how should we think about the tax rate going forward um the you know again it's when when when net income is is low like it has been we we do get a significant benefit from our our tax-exempt businesses is particularly our public finance portfolio. So we have to get to a certain level of pre-tax income before, you know, you start applying rates to it. I mean, I think if we're in the range of, oh, I don't know, call it, you know, maybe three million of pre-tax or less, probably that tax rate's going to be non-existent to a credit. And then kind of once you get into, you know, maybe north of $5 million to $8 million or so, you're probably a low, mid-single-digit tax rate. And then if we get into, say, a $10 to $12 million of pre-tax income, you're probably looking closer to a 7% to 9% tax rate, effective tax rate that is. It's just when pre-tax income is low, we get such a benefit from the, you know, not only the tax-exempt business in public finance, but we also get benefits from some LIHTC investments. And obviously from last year, we have an NOL that we can carry forward when we make money. So as long as, when pre-tax income is low, we're going to have a pretty, we're going to have a decent tax credit. Yeah.
It's a moving target then.
It is until. All right. Thanks, John. Okay. Thank you.
Operator
Your final question comes from the line of Nathan Race with Piper Sandler. Your line is open. Please go ahead.
Yeah. Appreciate you taking the follow-up just on the sba revenue going forward i appreciate nicole's comments earlier around you know holding some production for a longer seasoning period i think was what she was loading into so i'm just trying to think about kind of the cadence of uh sba revenue i think in the past it's been more back half loaded but i know you guys made a number of changes to your platform and credit infrastructure over the last uh handful of quarters so i was just hoping you could kind of speak to the cadence of kind of sba revenue within that context yeah i think you know So historically, if we go back in time a couple years, it's probably like first quarter, it was seasonally light, although oftentimes you may reap the benefit of a strong fourth quarter in terms of loan sales.
But in terms of originations, first quarter historically has been light, then it ramps up in the second, ramps in the third, and then usually maybe comes back a little bit in the fourth quarter. I think the way that we're looking at it this year and the experience we saw certainly in the first quarter with, again, kind of changing our approach on underwriting and having our team get around that combined with just the typical seasonality is that probably the way that we're looking at originations this year is that there's going to be a ramp up throughout the year. And, you know, second quarter will be a little bit higher than first, and third quarter and fourth quarter, you know, will be, you know, I don't want to use the word significantly higher, but we do have those third and fourth quarters ramping up in terms of origination volume much, much higher than we have second and first quarter.
And our pipeline is building. It's up about a third from where it was at year end, so that would suggest that we're going to be in a good position to hit that.
Okay. So it sounds like the base case is SBA revenue grows from here. And the guidance in last quarter on total fee income, which I believe was 33 to 35 million, it's going to be higher than that, correct?
Well, I think right now we think, keep in mind, that's total fee income. I think last quarter we said in terms of just pure gain on sale, somewhere in the 19 to 20 million range. Just that line item within the fee income. I think, as we talked about, I think we still feel good about that total amount. Maybe it just shifts a little bit more towards third and fourth quarter than, say, I mean, we had a pretty good first quarter without a doubt. The second, the third and the fourth quarters are definitely stronger than the second quarter.
Okay, got it. that's all I had. I appreciate taking the follow-up. Thank you. Thanks, Sam.
Operator
I will now turn the call back over to David Becker for closing remarks.
Guys, we thank you for joining us today and for all the thoughtful questions we had. We're pleased with the strong momentum that we built during the first quarter. We remain competent in our ability to execute on the priorities we've outlined for the year. We are very mindful, as we have said many times about the macroeconomic uncertainty, but we think we're executing from a position of strength, and we're well positioned for improving profitability throughout this year and beyond. So we appreciate your continued support. Look forward to keeping you updated on our progress next quarter. Thank you very much.
Operator
Ladies and gentlemen, that concludes today's call. Thank you all for joining. You may now disconnect.