
M&T Bank Corp 8-K, filed Oct 16, 2026
M&T Bank Corp (MTB)
8-K
2026-10-16
For: 2026-10-16
View Original
Added on
October 16, 2026
About this 8-K
M&T Bank Corp filed this 8-K on October 16, 2026.
M&T Bank Corporation reported third quarter 2026 net income of $775 million and diluted EPS of $5.04. Average loans grew $2.6 billion, and the CET1 capital ratio is estimated at 10.16%. AI summary
Items reported
- Item 2.02: Financial results
- Item 7.01: Regulation FD disclosure
- Item 9.01: Financial statements and exhibits
UNITED STATES
SECURITIES AND EXCHANGE COMMISSION
Washington, D.C. 20549
___________________________________
FORM 8-K
___________________________________
CURRENT REPORT
Pursuant to Section 13 or 15(d)
of the Securities Exchange Act of 1934
Date of Report (date of earliest event reported): October 16, 2026
___________________________________
(Exact name of registrant as specified in its charter)
___________________________________
(State or other jurisdiction of incorporation) | ||||||||
(Commission File Number) | (I.R.S. Employer Identification Number) | |||||||
(Address of principal executive offices) | (Zip Code) | |||||||
Registrant's telephone number, including area code: ( | ||||||||
Check the appropriate box below if the Form 8-K filing is intended to simultaneously satisfy the filing obligation of the registrant under any of the following provisions (see General Instructions A.2. below):
Written communications pursuant to Rule 425 under the Securities Act (17 CFR 230.425) | |||||
Soliciting material pursuant to Rule 14a-12 under the Exchange Act (17 CFR 240.14a-12) | |||||
Pre-commencement communications pursuant to Rule 14d-2(b) under the Exchange Act (17 CFR 240.14d-2(b)) | |||||
Pre-commencement communications pursuant to Rule 13e-4(c) under the Exchange Act (17 CFR 240.13e-4(c)) | |||||
Securities registered pursuant to Section 12(b) of the Act: | ||||||||
Title of Each Class | Trading Symbols | Name of Each Exchange on Which Registered | ||||||
Perpetual Fixed-to-Floating Rate Non-Cumulative Preferred Stock, Series H | ||||||||
Perpetual Fixed Rate Non-Cumulative Preferred Stock, Series J | ||||||||
Preferred Stock, Series K | ||||||||
Perpetual Fixed Rate Non-Cumulative Preferred Stock, Series L | ||||||||
Indicate by check mark whether the registrant is an emerging growth company as defined in Rule 405 of the Securities Act of 1933 (§ 230.405 of this chapter) or Rule 12b-2 of the Securities Exchange Act of 1934 (§ 240.12b-2 of this chapter).
Emerging growth company ☐
If an emerging growth company, indicate by check mark if the registrant has elected not to use the extended transition period for complying with any new or revised financial accounting standards provided pursuant to Section 13(a) of the Exchange Act. ☐
Item 2.02. Results of Operations and Financial Condition
On October 16, 2026, M&T Bank Corporation (“M&T”) announced its results of operations for the quarter ended September 30, 2026. The public announcement was made by means of a news release, the text of which is set forth in Exhibit 99.1 hereto.
The information in Item 2.02 of this Form 8-K, including Exhibit 99.1 attached hereto, is being furnished and shall not be deemed to be “filed” for purposes of Section 18 of the Securities Exchange Act of 1934 (the “Exchange Act”), or otherwise subject to the liability of such section, nor shall it be deemed incorporated by reference in any filing of M&T under the Securities Act of 1933 or the Exchange Act, regardless of any general incorporation language in such filing, unless expressly incorporated by specific reference in such filing.
Item 7.01. Regulation FD Disclosure.
On October 16, 2026, M&T posted an investor presentation to its website. A copy of the presentation is attached as Exhibit 99.2 hereto. From time to time, M&T may use this presentation in conversations with investors and analysts. The presentation can be found on the Investor Relations page of M&T’s website at ir.mtb.com/events-presentations.
The information in Item 7.01 of this Form 8-K, including Exhibit 99.2 attached hereto, is being furnished and shall not be deemed to be “filed” for purposes of Section 18 of the Exchange Act, or otherwise subject to the liability of such section, nor shall it be deemed incorporated by reference in any filing of M&T under the Securities Act of 1933 or the Exchange Act, regardless of any general incorporation language in such filing, unless expressly incorporated by specific reference in such filing.
Item 9.01 - Financial Statements and Exhibits
(d) The following exhibits are being filed herewith:
Exhibit No. | Exhibit Description | |||||||
99.1 | ||||||||
99.2 | ||||||||
104 | Cover Page Interactive Data File (embedded within the Inline XBRL document) | |||||||
SIGNATURE
Pursuant to the requirements of the Securities Exchange Act of 1934, as amended, the Registrant has duly caused this report to be signed on its behalf by the undersigned hereunto duly authorized.
Date: | By: | /s/ Daryl N. Bible | |||||||||||||||
Daryl N. Bible | |||||||||||||||||
Senior Executive Vice President and Chief Financial Officer | |||||||||||||||||
Exhibit 99.1
 | News Release | ||||
| One M&T Plaza, Buffalo, NY 14203 | October 16, 2026 | ||||
M&T Bank Corporation (NYSE:MTB) announces third quarter 2026 results | |||||
M&T Bank Corporation ("M&T" or "the Company") reports quarterly net income of $775 million or $5.04 of diluted earnings per common share.
| (Dollars in millions, except per share data) | 3Q26 | 2Q26 | 3Q25 | |||||||||||||||||||||||||||||
| Earnings Highlights | ||||||||||||||||||||||||||||||||
| Net interest income | $ | 1,793 | $ | 1,792 | $ | 1,761 | ||||||||||||||||||||||||||
| Taxable-equivalent adjustment | 12 | 12 | 12 | |||||||||||||||||||||||||||||
| Net interest income - taxable-equivalent | 1,805 | 1,804 | 1,773 | |||||||||||||||||||||||||||||
| Provision for credit losses | 135 | 120 | 125 | |||||||||||||||||||||||||||||
| Noninterest income | 743 | 740 | 752 | |||||||||||||||||||||||||||||
| Noninterest expense | 1,393 | 1,349 | 1,363 | |||||||||||||||||||||||||||||
| Net income | 775 | 818 | 792 | |||||||||||||||||||||||||||||
| Net income available to common shareholders - diluted | 732 | 781 | 754 | |||||||||||||||||||||||||||||
| Diluted earnings per common share | 5.04 | 5.32 | 4.82 | |||||||||||||||||||||||||||||
| Return on average assets - annualized | 1.40 | % | 1.51 | % | 1.49 | % | ||||||||||||||||||||||||||
| Return on average common shareholders' equity - annualized | 11.44 | 12.30 | 11.45 | |||||||||||||||||||||||||||||
| Average Balance Sheet | ||||||||||||||||||||||||||||||||
| Total assets | $ | 218,860 | $ | 216,532 | $ | 211,053 | ||||||||||||||||||||||||||
| Interest-bearing deposits at banks | 14,209 | 15,061 | 17,739 | |||||||||||||||||||||||||||||
| Investment securities | 38,552 | 38,728 | 36,559 | |||||||||||||||||||||||||||||
| Loans | 143,296 | 140,650 | 135,890 | |||||||||||||||||||||||||||||
| Deposits | 166,777 | 163,524 | 162,576 | |||||||||||||||||||||||||||||
| Borrowings | 19,225 | 20,794 | 15,633 | |||||||||||||||||||||||||||||
| Selected Ratios | ||||||||||||||||||||||||||||||||
| (Amounts expressed as a percent, except per share data) | ||||||||||||||||||||||||||||||||
| Net interest margin | 3.65 | % | 3.70 | % | 3.69 | % | ||||||||||||||||||||||||||
| Efficiency ratio (1) | 54.4 | 52.8 | 53.6 | |||||||||||||||||||||||||||||
| Net charge-offs to average total loans - annualized | .35 | .23 | .42 | |||||||||||||||||||||||||||||
| Allowance for loan losses to total loans | 1.51 | 1.53 | 1.59 | |||||||||||||||||||||||||||||
| Nonaccrual loans to total loans | .90 | .85 | 1.11 | |||||||||||||||||||||||||||||
| Common equity Tier 1 ("CET1") capital ratio (2) | 10.16 | 10.19 | 10.99 | |||||||||||||||||||||||||||||
| Common shareholders' equity per share | $ | 174.95 | $ | 176.03 | $ | 170.43 | ||||||||||||||||||||||||||
(1) A reconciliation of non-GAAP measures is included in the tables that accompany this release.
(2) CET1 capital ratio at September 30, 2026 is estimated.
| Financial Highlights | ||
•Taxable-equivalent net interest income increased nominally in the recent quarter as compared with the second quarter of 2026 reflecting an additional day, partially offset by lower interest income on nonaccrual loans.
•Average loans grew $2.6 billion in the recent quarter reflecting higher average commercial real estate loan balances of $1.6 billion, consumer loan balances of $634 million and residential real estate loan balances of $367 million.
•Higher noninterest income in the recent quarter reflects an increase in residential mortgage banking revenues, partially offset by a decrease in capital markets and advisory revenues and a lower distribution from M&T's investment in Bayview Lending Group LLC ("BLG").
•Noninterest expense reflects increases in outside data processing and software costs and professional and other services expense as well as higher personnel costs from an additional working day in the recent quarter.
•The allowance for loan losses as a percent of total loans declined 2 basis points to 1.51% at September 30, 2026.
•In the recent quarter, M&T repurchased 1.3 million shares of its common stock at a total cost of $323 million. M&T's CET1 capital ratio is estimated to be 10.16% at September 30, 2026.
| Chief Financial Officer Commentary | ||
"M&T's third quarter results were highlighted by strong loan and deposit growth, stable credit and a solid capital position. Fee income in the recent quarter continues to reflect the breadth of M&T's franchise and our ability to meet customers' evolving needs through a wide range of financial capabilities. The continued strength across customer-driven revenue streams demonstrates the value of our diversified business model and the depth of our customer relationships. These relationships are at the heart of our purpose, to make a difference in people's lives. I want to thank our employees for their ongoing commitment to the communities and customers we serve."
- Daryl N. Bible, M&T's Chief Financial Officer
| Contact: | ||||||||
| Investor Relations: | Rajiv Ranjan | 716.842.5138 | ||||||
| Steve Wendelboe | 716.842.5138 | |||||||
| Media Relations: | Frank Lentini | 929.651.0447 | ||||||
| Third Quarter 2026 Results | ||||
| Financial Reporting Matters | ||||||||||||||
As reported on M&T's Form 8-K dated September 28, 2026, effective for the third quarter of 2026 M&T made certain changes and reclassifications to Other income categories presented in its Consolidated Statement of Income. Also effective for the third quarter of 2026, M&T began separately presenting loans held for sale from loans held for investment in its Consolidated Balance Sheet and its Average Balance Sheet and Annualized Taxable-equivalent Rates disclosures. Accordingly, annualized taxable-equivalent rates for each impacted loan category and certain loan-based credit quality ratios exclude loans held for sale. Additionally, as reported in M&T's Form 10-Q for the quarter ended June 30, 2026, in conjunction with the implementation of a new general ledger platform during the second quarter of 2026, the Company modified its methodology for calculating annualized taxable-equivalent rates for certain earning assets and interest-bearing liabilities, including certain average deposit balances. All periods presented herein reflect those changes.
| Non-GAAP Measures (1) | ||||||||||||||||||||||||||||||||
| (Dollars in millions, except per share data) | 3Q26 | 2Q26 | Change 3Q26 vs. 2Q26 | 3Q25 | Change 3Q26 vs. 3Q25 | |||||||||||||||||||||||||||
| Net operating income | $ | 780 | $ | 823 | -5 | % | $ | 798 | -2 | % | ||||||||||||||||||||||
| Diluted net operating earnings per common share | 5.08 | 5.35 | -5 | 4.87 | 4 | |||||||||||||||||||||||||||
| Annualized return on average tangible assets | 1.47 | % | 1.59 | % | 1.56 | % | ||||||||||||||||||||||||||
| Annualized return on average tangible common equity | 17.29 | 18.57 | 17.13 | |||||||||||||||||||||||||||||
| Efficiency ratio | 54.4 | 52.8 | 53.6 | |||||||||||||||||||||||||||||
| Tangible equity per common share | $ | 115.88 | $ | 117.41 | -1 | $ | 115.31 | — | ||||||||||||||||||||||||
(1)A reconciliation of non-GAAP measures is included in the tables that accompany this release.
M&T consistently provides supplemental reporting of its results on a “net operating” or “tangible” basis, from which M&T excludes the after-tax effect of amortization of core deposit and other intangible assets (and the related goodwill and core deposit and other intangible asset balances, net of applicable deferred tax amounts) and expenses associated with merging acquired operations into M&T (when incurred), since such items are considered by management to be “nonoperating” in nature.
| Taxable-equivalent Net Interest Income (1) | ||||||||||||||||||||||||||||||||
| (Dollars in millions) | 3Q26 | 2Q26 | Change 3Q26 vs. 2Q26 | 3Q25 | Change 3Q26 vs. 3Q25 | |||||||||||||||||||||||||||
| Average earning assets | $ | 196,739 | $ | 195,216 | 1 | % | $ | 190,920 | 3 | % | ||||||||||||||||||||||
| Average interest-bearing liabilities | 142,294 | 140,354 | 1 | 134,153 | 6 | |||||||||||||||||||||||||||
| Net interest income - taxable-equivalent | 1,805 | 1,804 | — | 1,773 | 2 | |||||||||||||||||||||||||||
| Yield on average earning assets | 5.41 | % | 5.40 | % | 5.60 | % | ||||||||||||||||||||||||||
| Cost of interest-bearing liabilities | 2.44 | 2.36 | 2.72 | |||||||||||||||||||||||||||||
| Net interest spread | 2.97 | 3.04 | 2.88 | |||||||||||||||||||||||||||||
| Net interest margin | 3.65 | 3.70 | 3.69 | |||||||||||||||||||||||||||||
(1)Condensed Consolidated Average Balance Sheet and Annualized Taxable-equivalent Rates are included in the accompanying table on page 15.
2
| Third Quarter 2026 Results | ||||
Taxable-equivalent net interest income in the recent quarter rose nominally from the second quarter of 2026 reflecting an additional day, lower interest income on nonaccrual loans and loan growth funded by interest-bearing deposits as the Company reduced its average short-term borrowings. Taxable-equivalent net interest income increased $32 million, or 2%, as compared with the year-earlier third quarter reflecting lower rates paid on average interest-bearing deposits and growth in average loans and investment securities, partially offset by lower yields received on loans.
| Average Earning Assets | ||||||||||||||||||||||||||||||||
| (Dollars in millions) | 3Q26 | 2Q26 | Change 3Q26 vs. 2Q26 | 3Q25 | Change 3Q26 vs. 3Q25 | |||||||||||||||||||||||||||
| Interest-bearing deposits at banks | $ | 14,209 | $ | 15,061 | -6 | % | $ | 17,739 | -20 | % | ||||||||||||||||||||||
| Investment securities | 38,552 | 38,728 | — | 36,559 | 5 | |||||||||||||||||||||||||||
| Loans held for sale | 682 | 777 | -12 | 637 | 7 | |||||||||||||||||||||||||||
| Loans: (1) | ||||||||||||||||||||||||||||||||
| Commercial and industrial | 65,887 | 65,883 | — | 61,687 | 7 | |||||||||||||||||||||||||||
| Real estate - commercial | 24,862 | 23,221 | 7 | 23,982 | 4 | |||||||||||||||||||||||||||
| Real estate - residential | 25,194 | 24,827 | 1 | 24,122 | 4 | |||||||||||||||||||||||||||
| Consumer | 27,353 | 26,719 | 2 | 26,099 | 5 | |||||||||||||||||||||||||||
| Total loans | 143,296 | 140,650 | 2 | 135,890 | 5 | |||||||||||||||||||||||||||
| Other | — | — | — | 95 | -100 | |||||||||||||||||||||||||||
| Total earning assets | $ | 196,739 | $ | 195,216 | 1 | $ | 190,920 | 3 | ||||||||||||||||||||||||
(1)Supplemental information on loan balances is included in the accompanying table on page 16.
Average earning assets rose $1.5 billion from the second quarter of 2026 reflecting growth in average commercial real estate loan balances of $1.6 billion, average consumer loan balances of $634 million and average residential real estate loan balances of $367 million.
Average earning assets increased $5.8 billion from the third quarter of 2025, reflecting loan growth across all loan portfolios. Average commercial and industrial loan balances increased $4.2 billion, spanning most industry types. Average consumer, residential real estate and commercial real estate loan balances grew $1.3 billion, $1.1 billion and $880 million, respectively. The average balance of investment securities increased $2.0 billion from the year-earlier quarter, reflecting purchases of fixed rate mortgage-backed securities.
| Average Interest-bearing Liabilities | ||||||||||||||||||||||||||||||||
| (Dollars in millions) | 3Q26 | 2Q26 | Change 3Q26 vs. 2Q26 | 3Q25 | Change 3Q26 vs. 3Q25 | |||||||||||||||||||||||||||
| Interest-bearing deposits: | ||||||||||||||||||||||||||||||||
| Savings and interest-checking deposits | $ | 108,013 | $ | 105,752 | 2 | % | $ | 104,630 | 3 | % | ||||||||||||||||||||||
| Time deposits | 15,056 | 13,808 | 9 | 13,890 | 8 | |||||||||||||||||||||||||||
| Total interest-bearing deposits | 123,069 | 119,560 | 3 | 118,520 | 4 | |||||||||||||||||||||||||||
| Short-term borrowings | 5,248 | 8,016 | -35 | 2,844 | 85 | |||||||||||||||||||||||||||
| Long-term borrowings | 13,977 | 12,778 | 9 | 12,789 | 9 | |||||||||||||||||||||||||||
| Total interest-bearing liabilities | $ | 142,294 | $ | 140,354 | 1 | $ | 134,153 | 6 | ||||||||||||||||||||||||
3
| Third Quarter 2026 Results | ||||
Average interest-bearing liabilities in the recent quarter rose $1.9 billion from the second quarter of 2026 reflecting growth in average interest-bearing deposits of $3.5 billion and higher average long-term borrowings resulting from asset securitizations and issuances of senior and subordinated notes. Those increases were partially offset by a $2.9 billion decline in average short-term borrowings from the FHLB of New York.
Average interest-bearing liabilities increased $8.1 billion from the third quarter of 2025 reflecting growth in average interest-bearing deposits of $4.5 billion, higher average short-term borrowings from the FHLB of New York of $1.9 billion and an increase in average long-term borrowings of $1.2 billion resulting from asset securitizations and issuances of subordinated notes, partially offset by net maturities of senior notes.
| Provision for Credit Losses/Asset Quality | ||||||||||||||||||||||||||||||||
| (Dollars in millions) | 3Q26 | 2Q26 | Change 3Q26 vs. 2Q26 | 3Q25 | Change 3Q26 vs. 3Q25 | |||||||||||||||||||||||||||
| At end of quarter | ||||||||||||||||||||||||||||||||
| Nonaccrual loans | $ | 1,298 | $ | 1,208 | 7 | % | $ | 1,512 | -14 | % | ||||||||||||||||||||||
| Real estate and other foreclosed assets | 28 | 23 | 22 | 37 | -26 | |||||||||||||||||||||||||||
| Total nonperforming assets | 1,326 | 1,231 | 8 | 1,549 | -14 | |||||||||||||||||||||||||||
| Accruing loans past due 90 days or more (1) | 570 | 603 | -5 | 432 | 32 | |||||||||||||||||||||||||||
| Nonaccrual loans as % of loans outstanding | .90 | % | .85 | % | 1.11 | % | ||||||||||||||||||||||||||
| Allowance for loan losses | $ | 2,179 | $ | 2,176 | — | $ | 2,161 | 1 | ||||||||||||||||||||||||
| Allowance for loan losses as % of loans outstanding | 1.51 | % | 1.53 | % | 1.59 | % | ||||||||||||||||||||||||||
| Reserve for unfunded credit commitments | $ | 93 | $ | 95 | -2 | $ | 95 | -2 | ||||||||||||||||||||||||
| For the period | ||||||||||||||||||||||||||||||||
| Provision for loan losses | $ | 130 | $ | 120 | 8 | $ | 110 | 18 | ||||||||||||||||||||||||
| Provision for unfunded credit commitments | 5 | — | — | 15 | -67 | |||||||||||||||||||||||||||
| Total provision for credit losses | 135 | 120 | 13 | 125 | 8 | |||||||||||||||||||||||||||
| Net charge-offs | 127 | 80 | 59 | 146 | -12 | |||||||||||||||||||||||||||
| Net charge-offs as % of average loans (annualized) | .35 | % | .23 | % | .42 | % | ||||||||||||||||||||||||||
(1)Predominantly government-guaranteed residential real estate.
The provision for credit losses was $135 million in the third quarter of 2026 as compared with $120 million in the second quarter of 2026 and $125 million in the third quarter of 2025. The allowance for loan losses as a percent of loans outstanding was 1.51% at September 30, 2026 and 1.53% at June 30, 2026, each improved from 1.59% at September 30, 2025, reflecting lower levels of criticized loans.
Nonaccrual loans were $1.3 billion at September 30, 2026 and $1.2 billion at June 30, 2026, compared with $1.5 billion at September 30, 2025. The lower level of nonaccrual loans at September 30, 2026 and June 30, 2026 as compared with September 30, 2025 reflects a decrease in commercial and industrial and commercial real estate nonaccrual loans.
4
| Third Quarter 2026 Results | ||||
| Noninterest Income | ||||||||||||||||||||||||||||||||
| (Dollars in millions) | 3Q26 | 2Q26 | Change 3Q26 vs. 2Q26 | 3Q25 | Change 3Q26 vs. 3Q25 | |||||||||||||||||||||||||||
| Trust and investment services income | $ | 230 | $ | 235 | -2 | % | $ | 217 | 6 | % | ||||||||||||||||||||||
| Mortgage banking revenues (1) | 152 | 127 | 19 | 147 | 3 | |||||||||||||||||||||||||||
| Service charges on deposit accounts | 109 | 107 | 1 | 105 | 3 | |||||||||||||||||||||||||||
| Card revenues | 90 | 89 | 2 | 90 | — | |||||||||||||||||||||||||||
| Letter of credit and credit-related fees | 46 | 44 | 4 | 45 | 3 | |||||||||||||||||||||||||||
| Capital markets and advisory revenues | 32 | 41 | -24 | 35 | -8 | |||||||||||||||||||||||||||
| Gain (loss) on bank investment securities | (1) | 2 | — | 1 | — | |||||||||||||||||||||||||||
| Other revenues from operations (2) | 85 | 95 | -12 | 112 | -25 | |||||||||||||||||||||||||||
| Total | $ | 743 | $ | 740 | — | $ | 752 | -1 | ||||||||||||||||||||||||
(1)Supplemental information on mortgage banking activities is included in the accompanying table on page 17.
(2)Supplemental information on other revenues from operations is included in the accompanying table on page 18.
Effective January 1, 2026, the Company elected to prospectively measure its residential mortgage loan servicing right assets at fair value with changes in fair value reflected in mortgage banking revenues. As a result, amortization associated with residential mortgage loan servicing right assets previously recognized in other costs of operations before 2026 is no longer recorded. Instead, beginning in 2026 fair value changes in residential mortgage loan servicing right assets, inclusive of the realization of expected net servicing revenues over time, are included in mortgage banking revenues. On December 31, 2025, the Company began economically hedging the risk of fair value changes in these assets through the use of various interest rate derivative contracts, for which changes in fair value are also reflected in mortgage banking revenues.
Noninterest income in the third quarter of 2026 increased $3 million from 2026's second quarter.
•Trust and investment services income declined $5 million reflecting seasonal tax services fees earned by the wealth management business in the second quarter of 2026.
•Mortgage banking revenues increased $25 million reflecting a rise in residential mortgage loan sub-servicing income. In June 2026, the Company began sub-servicing $62.9 billion of additional residential mortgage loans.
•Capital markets and advisory revenues decreased $9 million reflecting a decline in loan syndication fees and lower revenues from interest rate swap transactions with commercial customers.
•Other revenues from operations decreased $10 million reflecting a lower distribution from M&T's investment in BLG in the recent quarter.
Noninterest income declined $9 million, or 1%, as compared with the third quarter of 2025.
•Trust and investment services income rose $13 million reflecting higher corporate trust revenues from the Company's institutional services business and an increase in personal trust and investment services revenues from its wealth management businesses.
•Mortgage banking revenues increased $5 million reflecting a rise in residential mortgage loan sub-servicing income, partially offset by the impact of the Company's fair value accounting election described above and lower gains on commercial mortgage loans originated for sale.
•Other revenues from operations decreased $27 million reflecting a $28 million distribution of an earnout payment from the Company's 2023 sale of its Collective Investment Trust ("CIT") business and a $12 million gain on the sale of equipment leases each in the third quarter of 2025, partially offset by an $11 million higher distribution from M&T's investment in BLG in the recent quarter.
5
| Third Quarter 2026 Results | ||||
| Noninterest Expense | ||||||||||||||||||||||||||||||||
| (Dollars in millions) | 3Q26 | 2Q26 | Change 3Q26 vs. 2Q26 | 3Q25 | Change 3Q26 vs. 3Q25 | |||||||||||||||||||||||||||
| Salaries and employee benefits | $ | 832 | $ | 826 | 1 | % | $ | 833 | — | % | ||||||||||||||||||||||
| Outside data processing and software | 173 | 154 | 12 | 138 | 25 | |||||||||||||||||||||||||||
| Equipment and net occupancy | 131 | 129 | — | 129 | 1 | |||||||||||||||||||||||||||
| Professional and other services | 97 | 89 | 10 | 81 | 22 | |||||||||||||||||||||||||||
| FDIC assessments | 19 | 18 | 15 | 13 | 55 | |||||||||||||||||||||||||||
| Advertising and marketing | 29 | 27 | 7 | 23 | 26 | |||||||||||||||||||||||||||
| Amortization of core deposit and other intangible assets | 7 | 7 | — | 10 | -27 | |||||||||||||||||||||||||||
| Other costs of operations | 105 | 99 | 6 | 136 | -23 | |||||||||||||||||||||||||||
| Total | $ | 1,393 | $ | 1,349 | 3 | $ | 1,363 | 2 | ||||||||||||||||||||||||
Noninterest expense rose $44 million, or 3%, from the second quarter of 2026.
•Salaries and employee benefits expense increased $6 million reflecting an additional working day in the recent quarter, partially offset by lower payroll-related taxes.
•Outside data processing and software costs increased $19 million reflecting higher software maintenance and enhancements to the Company's technology infrastructure.
•Professional and other services rose $8 million reflecting support for enhancements to the Company's technology infrastructure and other enterprise initiatives.
•Other costs of operations increased $6 million reflecting the Company's obligation under agreements to share in losses stemming from certain litigation of Visa, Inc.
Noninterest expense increased $30 million, or 2%, from the third quarter of 2025.
•Outside data processing and software costs rose $35 million reflecting costs associated with enhancements to the Company's technology infrastructure.
•Professional and other services increased $16 million reflecting support for enhancements to the Company's technology infrastructure and other enterprise initiatives and higher legal service costs.
•FDIC assessments were $6 million higher in the recent quarter reflecting the reduction of estimated special assessment expense in the third quarter of 2025 resulting from a decrease in the FDIC's loss estimates associated with certain failed banks.
•Other costs of operations decreased $31 million reflecting the amortization associated with residential mortgage loan servicing right assets in the third quarter of 2025 and lower expense associated with the Company's supplemental executive retirement savings plan in the recent quarter.
| Income Taxes | ||
6
| Third Quarter 2026 Results | ||||
| Capital and Liquidity | ||||||||||||||||||||
| 3Q26 | 2Q26 | 3Q25 | ||||||||||||||||||
| CET1 capital | 10.16 | % | (1) | 10.19 | % | 10.99 | % | |||||||||||||
| Tier 1 capital | 11.93 | (1) | 11.64 | 12.49 | ||||||||||||||||
| Total capital | 13.93 | (1) | 13.73 | 14.35 | ||||||||||||||||
| Tangible capital – common | 7.85 | 8.07 | 8.79 | |||||||||||||||||
(1)Capital ratios at September 30, 2026 are estimated.
M&T's capital ratios remained well above the minimum set forth by regulatory requirements. Cash dividends declared on M&T's common and preferred stock totaled $217 million and $42 million, respectively, for the quarter ended September 30, 2026. M&T's current stress capital buffer is 2.7%.
Reflecting rising interest rates, accumulated other comprehensive income declined $588 million in the recent quarter. In July 2026, the Company transferred $8.3 billion of residential mortgage-backed securities from the available-for-sale portfolio to the held-to-maturity portfolio with net unrealized gains of $8 million. Unrealized losses on those transferred securities at September 30, 2026 were $222 million ($165 million net of tax).
M&T repurchased shares of its common stock at a cost of $323 million during the recent quarter, compared with $465 million and $409 million in the second quarter of 2026 and the third quarter of 2025, respectively.
The CET1 capital ratio for M&T was estimated at 10.16% as of September 30, 2026. M&T's total risk-weighted assets at September 30, 2026 are estimated to be $170.6 billion. Reflecting loan growth and share repurchase activity in the recent quarter and the impact of unrealized losses on investment securities available for sale included in accumulated other comprehensive income at September 30, 2026, M&T's tangible common equity to tangible asset ratio at September 30, 2026 declined 22 basis points from June 30, 2026 and 94 basis points from September 30, 2025.
While not subject to the liquidity coverage ratio ("LCR") requirements, M&T estimates that its LCR on September 30, 2026 was 107%, exceeding the regulatory minimum standards that would be applicable if it were a Category III institution subject to the Category III reduced LCR requirements.
| Conference Call | ||
| About M&T | ||
7
| Third Quarter 2026 Results | ||||
| Forward-Looking Statements | ||
This news release and related conference call may contain forward-looking statements within the meaning of the Private Securities Litigation Reform Act of 1995 and the rules and regulations of the SEC. Any statement that does not describe historical or current facts is a forward-looking statement, including statements based on current expectations, estimates and projections about M&T's business, and management's beliefs and assumptions.
Statements regarding the potential effects of events or factors specific to M&T and/or the financial industry as a whole, as well as national and global events generally, on M&T's business, financial condition, liquidity and results of operations may constitute forward-looking statements. Such statements are subject to the risk that the actual effects may differ, possibly materially, from what is reflected in those forward-looking statements due to factors and future developments that are uncertain, unpredictable and in many cases beyond M&T's control.
Forward-looking statements are typically identified by words such as "believe," "expect," "anticipate," "intend," "target," "estimate," "continue," or "potential," by future conditional verbs such as "will," "would," "should," "could," or "may," or by variations of such words or by similar expressions. These statements are not guarantees of future performance and involve certain risks, uncertainties and assumptions which are difficult to predict and may cause actual outcomes to differ materially from what is expressed or forecasted.
While there can be no assurance that any list of risks and uncertainties is complete, important factors that could cause actual outcomes and results to differ materially from those contemplated by forward-looking statements include the following, without limitation: economic conditions and growth rates, including inflation and market volatility; events, developments and current conditions in the financial services industry, including trust, brokerage and investment management businesses; changes in interest rates, spreads on earning assets and interest-bearing liabilities, and interest rate sensitivity; prepayment speeds, loan originations, loan concentrations by type and industry, credit losses and market values on loans, collateral securing loans, and other assets; sources of liquidity; levels of client deposits; ability to contain costs and expenses; changes in M&T's credit ratings; domestic or international political developments and other geopolitical events, including trade and tariff policies and international conflicts and hostilities; changes and trends in the securities markets; common shares outstanding and common stock price volatility; fair value of and number of stock-based compensation awards to be issued in future periods; the impact of changes in market values on trust-, brokerage-, and investment management-related revenues; federal, state or local legislation and/or regulations affecting the financial services industry, or M&T and its subsidiaries individually or collectively, including tax policy; regulatory supervision and oversight, including monetary policy and capital requirements; governmental and public policy changes; political conditions, either nationally or in the states in which M&T and its subsidiaries do business; the initiation and outcome of potential, pending and future litigation, investigations and governmental proceedings, including tax-related examinations and other matters; operational risk events, including loss resulting from fraud by employees or persons outside M&T and breaches in data and cybersecurity; changes in accounting policies or procedures as may be required by the Financial Accounting Standards Board, regulatory agencies or legislation; increasing price, product and service competition by competitors, including new entrants; technological developments and changes; the ability to continue to introduce competitive new products and services on a timely, cost-effective basis; the mix of products and services; protection and validity of intellectual property rights; reliance on large customers; technological, implementation and cost/financial risks in large, multi-year contracts; continued availability of financing; financial resources in the amounts, at the times and on the terms required to support M&T and its subsidiaries' future businesses; and material differences in the actual financial results of merger, acquisition, divestment and investment activities compared with M&T's initial expectations, including the full realization of anticipated cost savings and revenue enhancements.
These are representative of the factors that could affect the outcome of the forward-looking statements. In addition, as noted, such statements could be affected by general industry and market conditions and growth rates, general economic and political conditions, either nationally or in the states in which M&T and its subsidiaries do business, and other factors.
M&T provides further detail regarding these risks and uncertainties in its Form 10-K for the year ended December 31, 2025, including in the Risk Factors section of such report, as well as in other SEC filings. Forward-looking statements speak only as of the date they are made, and M&T assumes no duty and does not undertake to update forward-looking statements.
8
| Third Quarter 2026 Results | ||||
Financial Highlights
| Three Months Ended | Nine Months Ended | ||||||||||||||||||||||||||||||||||
| September 30, | September 30, | ||||||||||||||||||||||||||||||||||
| (Dollars in millions, except per share, shares in thousands) | 2026 | 2025 | Change | 2026 | 2025 | Change | |||||||||||||||||||||||||||||
| Performance | |||||||||||||||||||||||||||||||||||
| Net income | $ | 775 | $ | 792 | -2 | % | $ | 2,257 | $ | 2,092 | 8 | % | |||||||||||||||||||||||
| Net income available to common shareholders | 732 | 754 | -3 | 2,133 | 1,981 | 8 | |||||||||||||||||||||||||||||
| Per common share: | |||||||||||||||||||||||||||||||||||
| Basic earnings | 5.08 | 4.85 | 5 | 14.57 | 12.41 | 17 | |||||||||||||||||||||||||||||
| Diluted earnings | 5.04 | 4.82 | 5 | 14.48 | 12.34 | 17 | |||||||||||||||||||||||||||||
| Cash dividends | 1.50 | 1.50 | — | 4.50 | 4.20 | 7 | |||||||||||||||||||||||||||||
| Common shares outstanding: | |||||||||||||||||||||||||||||||||||
| Average - diluted | 145,174 | 156,553 | -7 | 147,329 | 160,503 | -8 | |||||||||||||||||||||||||||||
| Period end | 143,708 | 154,518 | -7 | 143,708 | 154,518 | -7 | |||||||||||||||||||||||||||||
| Return on (annualized): | |||||||||||||||||||||||||||||||||||
| Average total assets | 1.40 | % | 1.49 | % | 1.39 | % | 1.33 | % | |||||||||||||||||||||||||||
| Average common shareholders' equity | 11.44 | 11.45 | 11.13 | 10.07 | |||||||||||||||||||||||||||||||
| Taxable-equivalent net interest income | $ | 1,805 | $ | 1,773 | 2 | $ | 5,372 | $ | 5,202 | 3 | |||||||||||||||||||||||||
| Yield on average earning assets | 5.41 | % | 5.60 | % | 5.39 | % | 5.54 | % | |||||||||||||||||||||||||||
| Cost of interest-bearing liabilities | 2.44 | 2.72 | 2.38 | 2.71 | |||||||||||||||||||||||||||||||
| Net interest spread | 2.97 | 2.88 | 3.01 | 2.83 | |||||||||||||||||||||||||||||||
| Contribution of interest-free funds | .68 | .81 | .67 | .82 | |||||||||||||||||||||||||||||||
| Net interest margin | 3.65 | 3.69 | 3.68 | 3.65 | |||||||||||||||||||||||||||||||
| Net charge-offs to average total net loans (annualized) | .35 | .42 | .30 | .36 | |||||||||||||||||||||||||||||||
| Net operating results (1) | |||||||||||||||||||||||||||||||||||
| Net operating income | $ | 780 | $ | 798 | -2 | $ | 2,274 | $ | 2,116 | 7 | |||||||||||||||||||||||||
| Diluted net operating earnings per common share | 5.08 | 4.87 | 4 | 14.60 | 12.49 | 17 | |||||||||||||||||||||||||||||
| Return on (annualized): | |||||||||||||||||||||||||||||||||||
| Average tangible assets | 1.47 | % | 1.56 | % | 1.46 | % | 1.41 | % | |||||||||||||||||||||||||||
| Average tangible common equity | 17.29 | 17.13 | 16.78 | 15.07 | |||||||||||||||||||||||||||||||
| Efficiency ratio | 54.4 | 53.6 | 55.1 | 56.3 | |||||||||||||||||||||||||||||||
| At September 30, | |||||||||||||||||||||||||||||||||||
| Loan quality | 2026 | 2025 | Change | ||||||||||||||||||||||||||||||||
| Nonaccrual loans | $ | 1,298 | $ | 1,512 | -14 | % | |||||||||||||||||||||||||||||
| Real estate and other foreclosed assets | 28 | 37 | -26 | ||||||||||||||||||||||||||||||||
| Total nonperforming assets | $ | 1,326 | $ | 1,549 | -14 | ||||||||||||||||||||||||||||||
| Accruing loans past due 90 days or more | $ | 570 | $ | 432 | 32 | ||||||||||||||||||||||||||||||
| Government guaranteed loans included in totals above: | |||||||||||||||||||||||||||||||||||
| Nonaccrual loans | 81 | 71 | 13 | ||||||||||||||||||||||||||||||||
| Accruing loans past due 90 days or more | 556 | 403 | 38 | ||||||||||||||||||||||||||||||||
| Nonaccrual loans to total loans | .90 | % | 1.11 | % | |||||||||||||||||||||||||||||||
| Allowance for loan losses to total loans | 1.51 | 1.59 | |||||||||||||||||||||||||||||||||
| Additional information | |||||||||||||||||||||||||||||||||||
| Period end common stock price | $ | 217.60 | $ | 197.62 | 10 | ||||||||||||||||||||||||||||||
| Full-service domestic banking offices (2) | 906 | 942 | -4 | ||||||||||||||||||||||||||||||||
| Full-time equivalent employees | 21,562 | 22,383 | -4 | ||||||||||||||||||||||||||||||||
(1) Excludes amortization and balances related to goodwill and core deposit and other intangible assets and merger-related expenses which, except in the calculation of the efficiency ratio, are net
of applicable income tax effects. Reconciliations of net income with net operating income appear on page 19.
(2) In the first quarter of 2026, thirteen domestic banking offices formerly classified as full service were designated as limited service per regulatory filings.
9
| Third Quarter 2026 Results | ||||
Financial Highlights, Five Quarter Trend
| Three Months Ended | |||||||||||||||||||||||||||||
| September 30, | June 30, | March 31, | December 31, | September 30, | |||||||||||||||||||||||||
| (Dollars in millions, except per share, shares in thousands) | 2026 | 2026 | 2026 | 2025 | 2025 | ||||||||||||||||||||||||
| Performance | |||||||||||||||||||||||||||||
| Net income | $ | 775 | $ | 818 | $ | 664 | $ | 759 | $ | 792 | |||||||||||||||||||
| Net income available to common shareholders | 732 | 781 | 620 | 718 | 754 | ||||||||||||||||||||||||
| Per common share: | |||||||||||||||||||||||||||||
| Basic earnings | 5.08 | 5.35 | 4.16 | 4.71 | 4.85 | ||||||||||||||||||||||||
| Diluted earnings | 5.04 | 5.32 | 4.13 | 4.67 | 4.82 | ||||||||||||||||||||||||
| Cash dividends | 1.50 | 1.50 | 1.50 | 1.50 | 1.50 | ||||||||||||||||||||||||
| Common shares outstanding: | |||||||||||||||||||||||||||||
| Average - diluted | 145,174 | 146,758 | 150,109 | 153,712 | 156,553 | ||||||||||||||||||||||||
| Period end | 143,708 | 144,933 | 146,917 | 151,840 | 154,518 | ||||||||||||||||||||||||
| Return on (annualized): | |||||||||||||||||||||||||||||
| Average total assets | 1.40 | % | 1.51 | % | 1.26 | % | 1.41 | % | 1.49 | % | |||||||||||||||||||
| Average common shareholders' equity | 11.44 | 12.30 | 9.67 | 10.87 | 11.45 | ||||||||||||||||||||||||
| Taxable-equivalent net interest income | $ | 1,805 | $ | 1,804 | $ | 1,763 | $ | 1,790 | $ | 1,773 | |||||||||||||||||||
| Yield on average earning assets | 5.41 | % | 5.40 | % | 5.35 | % | 5.47 | % | 5.60 | % | |||||||||||||||||||
| Cost of interest-bearing liabilities | 2.44 | 2.36 | 2.32 | 2.52 | 2.72 | ||||||||||||||||||||||||
| Net interest spread | 2.97 | 3.04 | 3.03 | 2.95 | 2.88 | ||||||||||||||||||||||||
| Contribution of interest-free funds | .68 | .66 | .67 | .75 | .81 | ||||||||||||||||||||||||
| Net interest margin | 3.65 | 3.70 | 3.70 | 3.70 | 3.69 | ||||||||||||||||||||||||
| Net charge-offs to average total net loans (annualized) | .35 | .23 | .31 | .54 | .42 | ||||||||||||||||||||||||
| Net operating results (1) | |||||||||||||||||||||||||||||
| Net operating income | $ | 780 | $ | 823 | $ | 671 | $ | 767 | $ | 798 | |||||||||||||||||||
| Diluted net operating earnings per common share | 5.08 | 5.35 | 4.18 | 4.72 | 4.87 | ||||||||||||||||||||||||
| Return on (annualized): | |||||||||||||||||||||||||||||
| Average tangible assets | 1.47 | % | 1.59 | % | 1.33 | % | 1.49 | % | 1.56 | % | |||||||||||||||||||
| Average tangible common equity | 17.29 | 18.57 | 14.51 | 16.24 | 17.13 | ||||||||||||||||||||||||
| Efficiency ratio | 54.4 | 52.8 | 58.3 | 55.1 | 53.6 | ||||||||||||||||||||||||
| September 30, | June 30, | March 31, | December 31, | September 30, | |||||||||||||||||||||||||
| Loan quality | 2026 | 2026 | 2026 | 2025 | 2025 | ||||||||||||||||||||||||
| Nonaccrual loans | $ | 1,298 | $ | 1,208 | $ | 1,240 | $ | 1,252 | $ | 1,512 | |||||||||||||||||||
| Real estate and other foreclosed assets | 28 | 23 | 27 | 35 | 37 | ||||||||||||||||||||||||
| Total nonperforming assets | $ | 1,326 | $ | 1,231 | $ | 1,267 | $ | 1,287 | $ | 1,549 | |||||||||||||||||||
| Accruing loans past due 90 days or more | $ | 570 | $ | 603 | $ | 646 | $ | 561 | $ | 432 | |||||||||||||||||||
| Government guaranteed loans included in totals above: | |||||||||||||||||||||||||||||
| Nonaccrual loans | 81 | 78 | 85 | 83 | 71 | ||||||||||||||||||||||||
| Accruing loans past due 90 days or more | 556 | 586 | 634 | 543 | 403 | ||||||||||||||||||||||||
| Nonaccrual loans to total loans | .90 | % | .85 | % | .89 | % | .91 | % | 1.11 | % | |||||||||||||||||||
| Allowance for loan losses to total loans | 1.51 | 1.53 | 1.54 | 1.54 | 1.59 | ||||||||||||||||||||||||
| Additional information | |||||||||||||||||||||||||||||
| Period end common stock price | $ | 217.60 | $ | 238.01 | $ | 206.72 | $ | 201.48 | $ | 197.62 | |||||||||||||||||||
| Full-service domestic banking offices (2) | 906 | 911 | 930 | 942 | 942 | ||||||||||||||||||||||||
| Full-time equivalent employees | 21,562 | 21,662 | 21,866 | 22,080 | 22,383 | ||||||||||||||||||||||||
(1) Excludes amortization and balances related to goodwill and core deposit and other intangible assets and merger-related expenses which, except in the calculation of the efficiency ratio, are net
of applicable income tax effects. Reconciliations of net income with net operating income appear on page 20.
(2) In the first quarter of 2026, thirteen domestic banking offices formerly classified as full service were designated as limited service per regulatory filings.
10
| Third Quarter 2026 Results | ||||
Condensed Consolidated Statement of Income
| Three Months Ended | Nine Months Ended | ||||||||||||||||||||||||||||||||||||||||||||||||||||
| September 30, | September 30, | ||||||||||||||||||||||||||||||||||||||||||||||||||||
| (Dollars in millions) | 2026 | 2025 | Change | 2026 | 2025 | Change | |||||||||||||||||||||||||||||||||||||||||||||||
| Interest income | $ | 2,667 | $ | 2,680 | — | % | $ | 7,823 | $ | 7,849 | — | % | |||||||||||||||||||||||||||||||||||||||||
| Interest expense | 874 | 919 | -5 | 2,486 | 2,680 | -7 | |||||||||||||||||||||||||||||||||||||||||||||||
| Net interest income | 1,793 | 1,761 | 2 | 5,337 | 5,169 | 3 | |||||||||||||||||||||||||||||||||||||||||||||||
| Provision for credit losses | 135 | 125 | 8 | 395 | 380 | 4 | |||||||||||||||||||||||||||||||||||||||||||||||
| Net interest income after provision for credit losses | 1,658 | 1,636 | 1 | 4,942 | 4,789 | 3 | |||||||||||||||||||||||||||||||||||||||||||||||
| Other income: | |||||||||||||||||||||||||||||||||||||||||||||||||||||
| Trust and investment services income | 230 | 217 | 6 | 684 | 643 | 7 | |||||||||||||||||||||||||||||||||||||||||||||||
| Mortgage banking revenues | 152 | 147 | 3 | 406 | 395 | 3 | |||||||||||||||||||||||||||||||||||||||||||||||
| Service charges on deposit accounts | 109 | 105 | 3 | 322 | 307 | 5 | |||||||||||||||||||||||||||||||||||||||||||||||
| Card revenues | 90 | 90 | — | 257 | 257 | — | |||||||||||||||||||||||||||||||||||||||||||||||
| Letter of credit and credit-related fees | 46 | 45 | 3 | 132 | 132 | — | |||||||||||||||||||||||||||||||||||||||||||||||
| Capital markets and advisory revenues | 32 | 35 | -8 | 109 | 89 | 23 | |||||||||||||||||||||||||||||||||||||||||||||||
| Gain (loss) on bank investment securities | (1) | 1 | — | 5 | 1 | — | |||||||||||||||||||||||||||||||||||||||||||||||
| Other revenues from operations | 85 | 112 | -25 | 257 | 222 | 16 | |||||||||||||||||||||||||||||||||||||||||||||||
| Total other income | 743 | 752 | -1 | 2,172 | 2,046 | 6 | |||||||||||||||||||||||||||||||||||||||||||||||
| Other expense: | |||||||||||||||||||||||||||||||||||||||||||||||||||||
| Salaries and employee benefits | 832 | 833 | — | 2,572 | 2,533 | 2 | |||||||||||||||||||||||||||||||||||||||||||||||
| Outside data processing and software | 173 | 138 | 25 | 471 | 412 | 14 | |||||||||||||||||||||||||||||||||||||||||||||||
| Equipment and net occupancy | 131 | 129 | 1 | 393 | 391 | — | |||||||||||||||||||||||||||||||||||||||||||||||
| Professional and other services | 97 | 81 | 22 | 279 | 251 | 12 | |||||||||||||||||||||||||||||||||||||||||||||||
| FDIC assessments | 19 | 13 | 55 | 60 | 58 | 4 | |||||||||||||||||||||||||||||||||||||||||||||||
| Advertising and marketing | 29 | 23 | 26 | 77 | 70 | 9 | |||||||||||||||||||||||||||||||||||||||||||||||
| Amortization of core deposit and other intangible assets | 7 | 10 | -27 | 23 | 32 | -27 | |||||||||||||||||||||||||||||||||||||||||||||||
| Other costs of operations | 105 | 136 | -23 | 305 | 367 | -17 | |||||||||||||||||||||||||||||||||||||||||||||||
| Total other expense | 1,393 | 1,363 | 2 | 4,180 | 4,114 | 2 | |||||||||||||||||||||||||||||||||||||||||||||||
| Income before taxes | 1,008 | 1,025 | -2 | 2,934 | 2,721 | 8 | |||||||||||||||||||||||||||||||||||||||||||||||
| Income taxes | 233 | 233 | — | 677 | 629 | 8 | |||||||||||||||||||||||||||||||||||||||||||||||
| Net income | $ | 775 | $ | 792 | -2 | % | $ | 2,257 | $ | 2,092 | 8 | % | |||||||||||||||||||||||||||||||||||||||||
11
| Third Quarter 2026 Results | ||||
Condensed Consolidated Statement of Income, Five Quarter Trend
| Three Months Ended | |||||||||||||||||||||||||||||
| September 30, | June 30, | March 31, | December 31, | September 30, | |||||||||||||||||||||||||
| (Dollars in millions) | 2026 | 2026 | 2026 | 2025 | 2025 | ||||||||||||||||||||||||
| Interest income | $ | 2,667 | $ | 2,620 | $ | 2,536 | $ | 2,637 | $ | 2,680 | |||||||||||||||||||
| Interest expense | 874 | 828 | 784 | 858 | 919 | ||||||||||||||||||||||||
| Net interest income | 1,793 | 1,792 | 1,752 | 1,779 | 1,761 | ||||||||||||||||||||||||
| Provision for credit losses | 135 | 120 | 140 | 125 | 125 | ||||||||||||||||||||||||
| Net interest income after provision for credit losses | 1,658 | 1,672 | 1,612 | 1,654 | 1,636 | ||||||||||||||||||||||||
| Other income: | |||||||||||||||||||||||||||||
| Trust and investment services income | 230 | 235 | 219 | 220 | 217 | ||||||||||||||||||||||||
| Mortgage banking revenues | 152 | 127 | 127 | 155 | 147 | ||||||||||||||||||||||||
| Service charges on deposit accounts | 109 | 107 | 106 | 105 | 105 | ||||||||||||||||||||||||
| Card revenues | 90 | 89 | 78 | 87 | 90 | ||||||||||||||||||||||||
| Letter of credit and credit-related fees | 46 | 44 | 42 | 47 | 45 | ||||||||||||||||||||||||
| Capital markets and advisory revenues | 32 | 41 | 36 | 31 | 35 | ||||||||||||||||||||||||
| Gain (loss) on bank investment securities | (1) | 2 | 4 | 1 | 1 | ||||||||||||||||||||||||
| Other revenues from operations | 85 | 95 | 77 | 50 | 112 | ||||||||||||||||||||||||
| Total other income | 743 | 740 | 689 | 696 | 752 | ||||||||||||||||||||||||
| Other expense: | |||||||||||||||||||||||||||||
| Salaries and employee benefits | 832 | 826 | 914 | 809 | 833 | ||||||||||||||||||||||||
| Outside data processing and software | 173 | 154 | 144 | 146 | 138 | ||||||||||||||||||||||||
| Equipment and net occupancy | 131 | 129 | 133 | 134 | 129 | ||||||||||||||||||||||||
| Professional and other services | 97 | 89 | 93 | 105 | 81 | ||||||||||||||||||||||||
| FDIC assessments | 19 | 18 | 23 | (8) | 13 | ||||||||||||||||||||||||
| Advertising and marketing | 29 | 27 | 21 | 32 | 23 | ||||||||||||||||||||||||
| Amortization of core deposit and other intangible assets | 7 | 7 | 9 | 10 | 10 | ||||||||||||||||||||||||
| Other costs of operations | 105 | 99 | 101 | 151 | 136 | ||||||||||||||||||||||||
| Total other expense | 1,393 | 1,349 | 1,438 | 1,379 | 1,363 | ||||||||||||||||||||||||
| Income before taxes | 1,008 | 1,063 | 863 | 971 | 1,025 | ||||||||||||||||||||||||
| Income taxes | 233 | 245 | 199 | 212 | 233 | ||||||||||||||||||||||||
| Net income | $ | 775 | $ | 818 | $ | 664 | $ | 759 | $ | 792 | |||||||||||||||||||
12
| Third Quarter 2026 Results | ||||
Condensed Consolidated Balance Sheet
| September 30, | |||||||||||||||||
| (Dollars in millions) | 2026 | 2025 | Change | ||||||||||||||
| ASSETS | |||||||||||||||||
| Cash and due from banks | $ | 1,796 | $ | 1,950 | -8 | % | |||||||||||
| Interest-bearing deposits at banks | 14,342 | 16,751 | -14 | ||||||||||||||
| Investment securities | 37,894 | 36,864 | 3 | ||||||||||||||
| Loans held for sale | 696 | 629 | 11 | ||||||||||||||
| Loans: | |||||||||||||||||
| Commercial and industrial | 66,373 | 61,863 | 7 | ||||||||||||||
| Real estate - commercial | 25,561 | 23,768 | 8 | ||||||||||||||
| Real estate - residential | 25,301 | 24,335 | 4 | ||||||||||||||
| Consumer | 27,521 | 26,379 | 4 | ||||||||||||||
| Total loans | 144,756 | 136,345 | 6 | ||||||||||||||
| Allowance for loan losses | (2,179) | (2,161) | 1 | ||||||||||||||
| Net loans | 142,577 | 134,184 | 6 | ||||||||||||||
| Goodwill | 8,465 | 8,465 | — | ||||||||||||||
| Core deposit and other intangible assets | 41 | 74 | -45 | ||||||||||||||
| Other assets | 14,699 | 12,360 | 19 | ||||||||||||||
| Total assets | $ | 220,510 | $ | 211,277 | 4 | % | |||||||||||
| LIABILITIES AND SHAREHOLDERS' EQUITY | |||||||||||||||||
| Noninterest-bearing deposits | $ | 44,819 | $ | 44,994 | — | % | |||||||||||
| Interest-bearing deposits | 122,691 | 118,432 | 4 | ||||||||||||||
| Total deposits | 167,510 | 163,426 | 2 | ||||||||||||||
| Short-term borrowings | 6,373 | 2,059 | 209 | ||||||||||||||
| Long-term borrowings | 13,648 | 12,928 | 6 | ||||||||||||||
| Accrued interest and other liabilities | 4,820 | 4,136 | 17 | ||||||||||||||
| Total liabilities | 192,351 | 182,549 | 5 | ||||||||||||||
| Shareholders' equity: | |||||||||||||||||
| Preferred | 3,017 | 2,394 | 26 | ||||||||||||||
| Common | 25,142 | 26,334 | -5 | ||||||||||||||
| Total shareholders' equity | 28,159 | 28,728 | -2 | ||||||||||||||
| Total liabilities and shareholders' equity | $ | 220,510 | $ | 211,277 | 4 | % | |||||||||||
13
| Third Quarter 2026 Results | ||||
Condensed Consolidated Balance Sheet, Five Quarter Trend
| September 30, | June 30, | March 31, | December 31, | September 30, | |||||||||||||||||||||||||
| (Dollars in millions) | 2026 | 2026 | 2026 | 2025 | 2025 | ||||||||||||||||||||||||
| ASSETS | |||||||||||||||||||||||||||||
| Cash and due from banks | $ | 1,796 | $ | 1,939 | $ | 1,903 | $ | 1,701 | $ | 1,950 | |||||||||||||||||||
| Interest-bearing deposits at banks | 14,342 | 15,499 | 14,445 | 17,068 | 16,751 | ||||||||||||||||||||||||
| Investment securities | 37,894 | 38,374 | 38,621 | 36,649 | 36,864 | ||||||||||||||||||||||||
| Loans held for sale | 696 | 663 | 861 | 1,067 | 629 | ||||||||||||||||||||||||
| Loans: | |||||||||||||||||||||||||||||
| Commercial and industrial | 66,373 | 65,995 | 65,216 | 63,406 | 61,863 | ||||||||||||||||||||||||
| Real estate - commercial | 25,561 | 24,233 | 22,986 | 23,335 | 23,768 | ||||||||||||||||||||||||
| Real estate - residential | 25,301 | 25,128 | 24,530 | 24,433 | 24,335 | ||||||||||||||||||||||||
| Consumer | 27,521 | 27,174 | 26,321 | 26,461 | 26,379 | ||||||||||||||||||||||||
| Total loans | 144,756 | 142,530 | 139,053 | 137,635 | 136,345 | ||||||||||||||||||||||||
| Allowance for loan losses | (2,179) | (2,176) | (2,136) | (2,116) | (2,161) | ||||||||||||||||||||||||
| Net loans | 142,577 | 140,354 | 136,917 | 135,519 | 134,184 | ||||||||||||||||||||||||
| Goodwill | 8,465 | 8,465 | 8,465 | 8,465 | 8,465 | ||||||||||||||||||||||||
| Core deposit and other intangible assets | 41 | 48 | 55 | 64 | 74 | ||||||||||||||||||||||||
| Other assets | 14,699 | 13,919 | 13,469 | 12,977 | 12,360 | ||||||||||||||||||||||||
| Total assets | $ | 220,510 | $ | 219,261 | $ | 214,736 | $ | 213,510 | $ | 211,277 | |||||||||||||||||||
| LIABILITIES AND SHAREHOLDERS' EQUITY | |||||||||||||||||||||||||||||
| Noninterest-bearing deposits | $ | 44,819 | $ | 48,295 | $ | 45,892 | $ | 46,509 | $ | 44,994 | |||||||||||||||||||
| Interest-bearing deposits | 122,691 | 120,590 | 117,849 | 120,400 | 118,432 | ||||||||||||||||||||||||
| Total deposits | 167,510 | 168,885 | 163,741 | 166,909 | 163,426 | ||||||||||||||||||||||||
| Short-term borrowings | 6,373 | 4,614 | 7,851 | 2,149 | 2,059 | ||||||||||||||||||||||||
| Long-term borrowings | 13,648 | 13,568 | 11,175 | 10,911 | 12,928 | ||||||||||||||||||||||||
| Accrued interest and other liabilities | 4,820 | 4,248 | 3,997 | 4,364 | 4,136 | ||||||||||||||||||||||||
| Total liabilities | 192,351 | 191,315 | 186,764 | 184,333 | 182,549 | ||||||||||||||||||||||||
| Shareholders' equity: | |||||||||||||||||||||||||||||
| Preferred | 3,017 | 2,434 | 2,434 | 2,834 | 2,394 | ||||||||||||||||||||||||
| Common | 25,142 | 25,512 | 25,538 | 26,343 | 26,334 | ||||||||||||||||||||||||
| Total shareholders' equity | 28,159 | 27,946 | 27,972 | 29,177 | 28,728 | ||||||||||||||||||||||||
| Total liabilities and shareholders' equity | $ | 220,510 | $ | 219,261 | $ | 214,736 | $ | 213,510 | $ | 211,277 | |||||||||||||||||||
14
| Third Quarter 2026 Results | ||||
Condensed Consolidated Average Balance Sheet and Annualized Taxable-equivalent Rates
| Three Months Ended | Change in Balance | Nine Months Ended | |||||||||||||||||||||||||||||||||||||||||||||||||||||||||||||||||||||||||||||||||||||||||||||||||||||||||
| September 30, | June 30, | September 30, | September 30, 2026 from | September 30, | Change | ||||||||||||||||||||||||||||||||||||||||||||||||||||||||||||||||||||||||||||||||||||||||||||||||||||||
| 2026 | 2026 | 2025 | June 30, | September 30, | 2026 | 2025 | in | ||||||||||||||||||||||||||||||||||||||||||||||||||||||||||||||||||||||||||||||||||||||||||||||||||||
| (Dollars in millions) | Balance | Rate | Balance | Rate | Balance | Rate | 2026 | 2025 | Balance | Rate | Balance | Rate | Balance | ||||||||||||||||||||||||||||||||||||||||||||||||||||||||||||||||||||||||||||||||||||||||||||||
| ASSETS | |||||||||||||||||||||||||||||||||||||||||||||||||||||||||||||||||||||||||||||||||||||||||||||||||||||||||||
| Interest-bearing deposits at banks | $ | 14,209 | 3.79 | % | $ | 15,061 | 3.72 | % | $ | 17,739 | 4.43 | % | -6 | % | -20 | % | $ | 15,159 | 3.74 | % | $ | 19,037 | 4.46 | % | -20 | % | |||||||||||||||||||||||||||||||||||||||||||||||||||||||||||||||||||||||||||||||||
| Investment securities (1) | 38,552 | 4.33 | 38,728 | 4.29 | 36,559 | 4.15 | — | 5 | 38,378 | 4.28 | 35,466 | 3.98 | 8 | ||||||||||||||||||||||||||||||||||||||||||||||||||||||||||||||||||||||||||||||||||||||||||||||
| Loans held for sale | 682 | 5.48 | 777 | 5.50 | 637 | 5.85 | -12 | 7 | 819 | 5.45 | 750 | 6.92 | 9 | ||||||||||||||||||||||||||||||||||||||||||||||||||||||||||||||||||||||||||||||||||||||||||||||
| Loans: | |||||||||||||||||||||||||||||||||||||||||||||||||||||||||||||||||||||||||||||||||||||||||||||||||||||||||||
| Commercial and industrial | 65,887 | 6.00 | 65,883 | 6.00 | 61,687 | 6.45 | — | 7 | 65,139 | 6.00 | 61,234 | 6.41 | 6 | ||||||||||||||||||||||||||||||||||||||||||||||||||||||||||||||||||||||||||||||||||||||||||||||
| Real estate - commercial | 24,862 | 6.03 | 23,221 | 6.29 | 23,982 | 6.45 | 7 | 4 | 23,709 | 6.15 | 24,796 | 6.34 | -4 | ||||||||||||||||||||||||||||||||||||||||||||||||||||||||||||||||||||||||||||||||||||||||||||||
| Real estate - residential | 25,194 | 4.69 | 24,827 | 4.63 | 24,122 | 4.57 | 1 | 4 | 24,832 | 4.62 | 23,543 | 4.50 | 5 | ||||||||||||||||||||||||||||||||||||||||||||||||||||||||||||||||||||||||||||||||||||||||||||||
| Consumer | 27,353 | 6.47 | 26,719 | 6.46 | 26,099 | 6.60 | 2 | 5 | 26,797 | 6.47 | 25,275 | 6.58 | 6 | ||||||||||||||||||||||||||||||||||||||||||||||||||||||||||||||||||||||||||||||||||||||||||||||
| Total loans | 143,296 | 5.86 | 140,650 | 5.89 | 135,890 | 6.15 | 2 | 5 | 140,477 | 5.87 | 134,848 | 6.09 | 4 | ||||||||||||||||||||||||||||||||||||||||||||||||||||||||||||||||||||||||||||||||||||||||||||||
| Other | — | — | — | — | 95 | 3.45 | — | -100 | 31 | — | 96 | 3.46 | -67 | ||||||||||||||||||||||||||||||||||||||||||||||||||||||||||||||||||||||||||||||||||||||||||||||
| Total earning assets | 196,739 | 5.41 | 195,216 | 5.40 | 190,920 | 5.60 | 1 | 3 | 194,864 | 5.39 | 190,197 | 5.54 | 2 | ||||||||||||||||||||||||||||||||||||||||||||||||||||||||||||||||||||||||||||||||||||||||||||||
| Goodwill | 8,465 | 8,465 | 8,465 | — | — | 8,465 | 8,465 | — | |||||||||||||||||||||||||||||||||||||||||||||||||||||||||||||||||||||||||||||||||||||||||||||||||||
| Core deposit and other intangible assets | 45 | 51 | 79 | -12 | -43 | 52 | 86 | -40 | |||||||||||||||||||||||||||||||||||||||||||||||||||||||||||||||||||||||||||||||||||||||||||||||||||
| Other assets | 13,611 | 12,800 | 11,589 | 6 | 17 | 13,043 | 11,141 | 17 | |||||||||||||||||||||||||||||||||||||||||||||||||||||||||||||||||||||||||||||||||||||||||||||||||||
| Total assets | $ | 218,860 | $ | 216,532 | $ | 211,053 | 1 | % | 4 | % | $ | 216,424 | $ | 209,889 | 3 | % | |||||||||||||||||||||||||||||||||||||||||||||||||||||||||||||||||||||||||||||||||||||||||||
| LIABILITIES AND SHAREHOLDERS' EQUITY | |||||||||||||||||||||||||||||||||||||||||||||||||||||||||||||||||||||||||||||||||||||||||||||||||||||||||||
| Interest-bearing deposits: | |||||||||||||||||||||||||||||||||||||||||||||||||||||||||||||||||||||||||||||||||||||||||||||||||||||||||||
| Savings and interest-checking deposits | $ | 108,013 | 1.89 | % | $ | 105,752 | 1.81 | % | $ | 104,630 | 2.23 | % | 2 | % | 3 | % | $ | 106,783 | 1.85 | % | $ | 103,378 | 2.22 | % | 3 | % | |||||||||||||||||||||||||||||||||||||||||||||||||||||||||||||||||||||||||||||||||
| Time deposits | 15,056 | 3.19 | 13,808 | 3.02 | 13,890 | 3.40 | 9 | 8 | 13,982 | 3.08 | 14,056 | 3.48 | -1 | ||||||||||||||||||||||||||||||||||||||||||||||||||||||||||||||||||||||||||||||||||||||||||||||
| Total interest-bearing deposits | 123,069 | 2.05 | 119,560 | 1.95 | 118,520 | 2.36 | 3 | 4 | 120,765 | 1.99 | 117,434 | 2.37 | 3 | ||||||||||||||||||||||||||||||||||||||||||||||||||||||||||||||||||||||||||||||||||||||||||||||
| Short-term borrowings | 5,248 | 3.89 | 8,016 | 3.86 | 2,844 | 4.50 | -35 | 85 | 6,318 | 3.87 | 3,013 | 4.50 | 110 | ||||||||||||||||||||||||||||||||||||||||||||||||||||||||||||||||||||||||||||||||||||||||||||||
| Long-term borrowings | 13,977 | 5.32 | 12,778 | 5.33 | 12,789 | 5.64 | 9 | 9 | 12,617 | 5.35 | 11,675 | 5.64 | 8 | ||||||||||||||||||||||||||||||||||||||||||||||||||||||||||||||||||||||||||||||||||||||||||||||
| Total interest-bearing liabilities | 142,294 | 2.44 | 140,354 | 2.36 | 134,153 | 2.72 | 1 | 6 | 139,700 | 2.38 | 132,122 | 2.71 | 6 | ||||||||||||||||||||||||||||||||||||||||||||||||||||||||||||||||||||||||||||||||||||||||||||||
| Noninterest-bearing deposits | 43,708 | 43,964 | 44,056 | -1 | -1 | 44,070 | 44,877 | -2 | |||||||||||||||||||||||||||||||||||||||||||||||||||||||||||||||||||||||||||||||||||||||||||||||||||
| Other liabilities | 4,527 | 4,275 | 4,261 | 6 | 6 | 4,349 | 4,142 | 5 | |||||||||||||||||||||||||||||||||||||||||||||||||||||||||||||||||||||||||||||||||||||||||||||||||||
| Total liabilities | 190,529 | 188,593 | 182,470 | 1 | 4 | 188,119 | 181,141 | 4 | |||||||||||||||||||||||||||||||||||||||||||||||||||||||||||||||||||||||||||||||||||||||||||||||||||
| Shareholders' equity | 28,331 | 27,939 | 28,583 | 1 | -1 | 28,305 | 28,748 | -2 | |||||||||||||||||||||||||||||||||||||||||||||||||||||||||||||||||||||||||||||||||||||||||||||||||||
| Total liabilities and shareholders' equity | $ | 218,860 | $ | 216,532 | $ | 211,053 | 1 | % | 4 | % | $ | 216,424 | $ | 209,889 | 3 | % | |||||||||||||||||||||||||||||||||||||||||||||||||||||||||||||||||||||||||||||||||||||||||||
| Net interest spread | 2.97 | 3.04 | 2.88 | 3.01 | 2.83 | ||||||||||||||||||||||||||||||||||||||||||||||||||||||||||||||||||||||||||||||||||||||||||||||||||||||
| Contribution of interest-free funds | .68 | .66 | .81 | .67 | .82 | ||||||||||||||||||||||||||||||||||||||||||||||||||||||||||||||||||||||||||||||||||||||||||||||||||||||
| Net interest margin | 3.65 | % | 3.70 | % | 3.69 | % | 3.68 | % | 3.65 | % | |||||||||||||||||||||||||||||||||||||||||||||||||||||||||||||||||||||||||||||||||||||||||||||||||
(1) Yields on investment securities for the nine-month period ended September 30, 2025 reflect $18 million of lower taxable-equivalent interest income resulting from an alignment of amortization periods for certain municipal bonds obtained from the acquisition of People's United Financial, Inc.
15
| Third Quarter 2026 Results | ||||
Supplemental Information - Loan Balances
| September 30, | June 30, | March 31, | December 31, | September 30, | |||||||||||||||||||||||||
| (Dollars in millions) | 2026 | 2026 | 2026 | 2025 | 2025 | ||||||||||||||||||||||||
| Commercial and industrial | |||||||||||||||||||||||||||||
| Commercial and industrial excluding owner-occupied real estate by industry: | |||||||||||||||||||||||||||||
| Financial and insurance | $ | 13,731 | $ | 13,804 | $ | 13,488 | $ | 12,749 | $ | 12,077 | |||||||||||||||||||
| Services | 8,719 | 8,534 | 8,207 | 7,887 | 7,685 | ||||||||||||||||||||||||
| Motor vehicle and recreational finance dealers | 6,706 | 6,966 | 7,061 | 7,185 | 6,636 | ||||||||||||||||||||||||
| Manufacturing | 6,311 | 6,389 | 6,402 | 6,094 | 6,238 | ||||||||||||||||||||||||
| Wholesale | 4,473 | 4,330 | 4,343 | 4,373 | 4,244 | ||||||||||||||||||||||||
| Transportation, communications, utilities | 4,456 | 4,199 | 3,928 | 3,883 | 3,754 | ||||||||||||||||||||||||
| Retail | 3,347 | 3,319 | 3,302 | 3,087 | 3,112 | ||||||||||||||||||||||||
| Construction | 2,412 | 2,445 | 2,305 | 2,260 | 2,205 | ||||||||||||||||||||||||
| Health services | 1,811 | 1,707 | 1,835 | 1,816 | 1,779 | ||||||||||||||||||||||||
| Real estate investors | 1,589 | 1,521 | 1,662 | 1,574 | 1,505 | ||||||||||||||||||||||||
| Other | 1,370 | 1,397 | 1,362 | 1,300 | 1,567 | ||||||||||||||||||||||||
| Total commercial and industrial excluding owner-occupied real estate | 54,925 | 54,611 | 53,895 | 52,208 | 50,802 | ||||||||||||||||||||||||
| Owner-occupied real estate by industry: | |||||||||||||||||||||||||||||
| Services | 2,351 | 2,362 | 2,377 | 2,368 | 2,308 | ||||||||||||||||||||||||
| Motor vehicle and recreational finance dealers | 2,263 | 2,180 | 2,217 | 2,234 | 2,162 | ||||||||||||||||||||||||
| Retail | 1,929 | 1,926 | 1,916 | 1,893 | 1,825 | ||||||||||||||||||||||||
| Health services | 1,413 | 1,464 | 1,335 | 1,268 | 1,320 | ||||||||||||||||||||||||
| Wholesale | 1,079 | 1,035 | 1,029 | 978 | 975 | ||||||||||||||||||||||||
| Manufacturing | 735 | 712 | 727 | 791 | 783 | ||||||||||||||||||||||||
| Real estate investors | 585 | 607 | 617 | 616 | 634 | ||||||||||||||||||||||||
| Other | 1,093 | 1,098 | 1,103 | 1,050 | 1,054 | ||||||||||||||||||||||||
| Total owner-occupied real estate | 11,448 | 11,384 | 11,321 | 11,198 | 11,061 | ||||||||||||||||||||||||
| Total commercial and industrial | 66,373 | 65,995 | 65,216 | 63,406 | 61,863 | ||||||||||||||||||||||||
| Commercial real estate | |||||||||||||||||||||||||||||
| Permanent finance by property type: | |||||||||||||||||||||||||||||
| Apartments/Multifamily | 7,320 | 6,865 | 6,269 | 6,353 | 6,270 | ||||||||||||||||||||||||
| Retail/Service | 4,313 | 4,259 | 4,237 | 4,164 | 4,320 | ||||||||||||||||||||||||
| Industrial/Warehouse | 3,510 | 3,276 | 2,462 | 2,297 | 2,175 | ||||||||||||||||||||||||
| Office | 3,066 | 3,147 | 3,282 | 3,423 | 3,487 | ||||||||||||||||||||||||
| Health services | 1,841 | 1,583 | 1,507 | 1,548 | 1,554 | ||||||||||||||||||||||||
| Hotel | 1,728 | 1,665 | 1,727 | 1,743 | 1,776 | ||||||||||||||||||||||||
| Other | 443 | 180 | 187 | 180 | 202 | ||||||||||||||||||||||||
| Total permanent | 22,221 | 20,975 | 19,671 | 19,708 | 19,784 | ||||||||||||||||||||||||
| Construction/Development | 3,340 | 3,258 | 3,315 | 3,627 | 3,984 | ||||||||||||||||||||||||
| Total commercial real estate | 25,561 | 24,233 | 22,986 | 23,335 | 23,768 | ||||||||||||||||||||||||
| Residential real estate | |||||||||||||||||||||||||||||
| Residential real estate | 25,301 | 25,128 | 24,530 | 24,433 | 24,335 | ||||||||||||||||||||||||
| Consumer | |||||||||||||||||||||||||||||
| Home equity lines and loans | 4,991 | 4,891 | 4,796 | 4,807 | 4,730 | ||||||||||||||||||||||||
| Recreational finance | 15,170 | 14,856 | 14,144 | 14,092 | 14,152 | ||||||||||||||||||||||||
| Automobile | 4,871 | 4,969 | 5,016 | 5,167 | 5,223 | ||||||||||||||||||||||||
| Other | 2,489 | 2,458 | 2,365 | 2,395 | 2,274 | ||||||||||||||||||||||||
| Total consumer | 27,521 | 27,174 | 26,321 | 26,461 | 26,379 | ||||||||||||||||||||||||
| Total loans | $ | 144,756 | $ | 142,530 | $ | 139,053 | $ | 137,635 | $ | 136,345 | |||||||||||||||||||
16
| Third Quarter 2026 Results | ||||
Supplemental Information - Mortgage Banking Activities
| Three Months Ended | Change | Nine Months Ended | Change | ||||||||||||||||||||||||||||||||||||||||||||
| September 30, | June 30, | September 30, | September 30, | ||||||||||||||||||||||||||||||||||||||||||||
| (Dollars in millions) | 2026 | 2026 | Amount | % | 2026 | 2025 | Amount | % | |||||||||||||||||||||||||||||||||||||||
| Residential mortgage banking revenues | |||||||||||||||||||||||||||||||||||||||||||||||
| Gains on loans originated for sale | $ | 9 | $ | 7 | $ | 2 | 30 | % | $ | 24 | $ | 23 | $ | 1 | 4 | % | |||||||||||||||||||||||||||||||
| Loan servicing: | |||||||||||||||||||||||||||||||||||||||||||||||
| Loan servicing fees | 33 | 33 | — | -1 | 98 | 105 | (7) | -7 | |||||||||||||||||||||||||||||||||||||||
| Changes in fair value of mortgage loan servicing right assets, net of hedging activities | (16) | (11) | (5) | -37 | (40) | — | (40) | — | |||||||||||||||||||||||||||||||||||||||
| Loan sub-servicing and other fees | 93 | 67 | 26 | 38 | 222 | 159 | 63 | 39 | |||||||||||||||||||||||||||||||||||||||
| Total loan servicing | 110 | 89 | 21 | 23 | 280 | 264 | 16 | 6 | |||||||||||||||||||||||||||||||||||||||
| Total residential mortgage banking revenues | $ | 119 | $ | 96 | $ | 23 | 24 | % | $ | 304 | $ | 287 | $ | 17 | 6 | % | |||||||||||||||||||||||||||||||
| New commitments to originate loans for sale | $ | 377 | $ | 411 | $ | (34) | -8 | % | $ | 1,188 | $ | 1,019 | $ | 169 | 17 | % | |||||||||||||||||||||||||||||||
| September 30, | June 30, | March 31, | December 31, | September 30, | |||||||||||||||||||||||||
| (Dollars in millions) | 2026 | 2026 | 2026 | 2025 | 2025 | ||||||||||||||||||||||||
| Balances at period end | |||||||||||||||||||||||||||||
| Loans held for sale | $ | 249 | $ | 256 | $ | 327 | $ | 441 | $ | 327 | |||||||||||||||||||
| Commitments to originate loans for sale | 191 | 258 | 222 | 224 | 329 | ||||||||||||||||||||||||
| Commitments to sell loans | 407 | 467 | 544 | 645 | 576 | ||||||||||||||||||||||||
| Capitalized mortgage loan servicing assets | 572 | 540 | 542 | 287 | 305 | ||||||||||||||||||||||||
| Loans serviced for others | 34,909 | 35,253 | 35,586 | 35,873 | 36,421 | ||||||||||||||||||||||||
| Loans sub-serviced for others | 179,605 | 183,599 | 123,968 | 156,938 | 161,785 | ||||||||||||||||||||||||
| Total loans serviced for others | $ | 214,514 | $ | 218,852 | $ | 159,554 | $ | 192,811 | $ | 198,206 | |||||||||||||||||||
| Three Months Ended | Change | Nine Months Ended | Change | ||||||||||||||||||||||||||||||||||||||||||||
| September 30, | June 30, | September 30, | September 30, | ||||||||||||||||||||||||||||||||||||||||||||
| (Dollars in millions) | 2026 | 2026 | Amount | % | 2026 | 2025 | Amount | % | |||||||||||||||||||||||||||||||||||||||
| Commercial mortgage banking revenues | |||||||||||||||||||||||||||||||||||||||||||||||
| Gains on loans originated for sale | $ | 13 | $ | 13 | $ | — | — | % | $ | 44 | $ | 50 | $ | (6) | -12 | % | |||||||||||||||||||||||||||||||
| Loan servicing fees and other | 20 | 18 | 2 | 9 | 58 | 58 | — | — | |||||||||||||||||||||||||||||||||||||||
| Total commercial mortgage banking revenues | $ | 33 | $ | 31 | $ | 2 | 5 | % | $ | 102 | $ | 108 | $ | (6) | -6 | % | |||||||||||||||||||||||||||||||
| Loans originated for sale to other investors | $ | 737 | $ | 746 | $ | (9) | -1 | % | $ | 2,618 | $ | 3,138 | $ | (520) | -17 | % | |||||||||||||||||||||||||||||||
| September 30, | June 30, | March 31, | December 31, | September 30, | |||||||||||||||||||||||||
| (Dollars in millions) | 2026 | 2026 | 2026 | 2025 | 2025 | ||||||||||||||||||||||||
| Balances at period end | |||||||||||||||||||||||||||||
| Loans held for sale | $ | 263 | $ | 259 | $ | 359 | $ | 484 | $ | 278 | |||||||||||||||||||
| Commitments to originate loans for sale | 559 | 485 | 529 | 773 | 1,074 | ||||||||||||||||||||||||
| Commitments to sell loans | 826 | 740 | 903 | 1,253 | 1,292 | ||||||||||||||||||||||||
| Capitalized mortgage loan servicing assets | 132 | 136 | 138 | 132 | 123 | ||||||||||||||||||||||||
| Loans serviced for others | 31,204 | 31,368 | 30,934 | 30,309 | 28,957 | ||||||||||||||||||||||||
| Loans sub-serviced for others | 4,013 | 4,072 | 4,194 | 4,231 | 4,297 | ||||||||||||||||||||||||
| Total loans serviced for others | $ | 35,217 | $ | 35,440 | $ | 35,128 | $ | 34,540 | $ | 33,254 | |||||||||||||||||||
17
| Third Quarter 2026 Results | ||||
Supplemental Information - Other Revenues from Operations
| Three Months Ended | Nine Months Ended | ||||||||||||||||||||||||||||||||||||||||||||||
| September 30, | June 30, | Change | September 30, | September 30, | Change | ||||||||||||||||||||||||||||||||||||||||||
| (Dollars in millions) | 2026 | 2026 | Amount | % | 2026 | 2025 | Amount | % | |||||||||||||||||||||||||||||||||||||||
| Bank owned life insurance revenue | $ | 17 | $ | 20 | $ | (3) | -12 | % | $ | 55 | $ | 56 | $ | (1) | -2 | % | |||||||||||||||||||||||||||||||
| Equipment operating lease income | 12 | 11 | 1 | 4 | 34 | 37 | (3) | -9 | |||||||||||||||||||||||||||||||||||||||
| BLG income | 31 | 47 | (16) | -34 | 111 | 20 | 91 | 455 | |||||||||||||||||||||||||||||||||||||||
| Earnout payment related to 2023 sale of CIT business | — | — | — | — | — | 28 | (28) | -100 | |||||||||||||||||||||||||||||||||||||||
| Gains on sales of out-of-footprint loan portfolio | — | — | — | — | — | 15 | (15) | -100 | |||||||||||||||||||||||||||||||||||||||
| Gain on sale of institutional services subsidiary | — | — | — | — | — | 10 | (10) | -100 | |||||||||||||||||||||||||||||||||||||||
| Other | 25 | 17 | 8 | 47 | 57 | 56 | 1 | 2 | |||||||||||||||||||||||||||||||||||||||
| Total other revenues from operations | $ | 85 | $ | 95 | $ | (10) | -12 | % | $ | 257 | $ | 222 | $ | 35 | 16 | % | |||||||||||||||||||||||||||||||
| Three Months Ended | |||||||||||||||||||||||||||||
| September 30, | June 30, | March 31, | December 31, | September 30, | |||||||||||||||||||||||||
| (Dollars in millions) | 2026 | 2026 | 2026 | 2025 | 2025 | ||||||||||||||||||||||||
| Bank owned life insurance revenue | $ | 17 | $ | 20 | $ | 18 | $ | 19 | $ | 21 | |||||||||||||||||||
| Equipment operating lease income | 12 | 11 | 11 | 11 | 12 | ||||||||||||||||||||||||
| BLG income | 31 | 47 | 33 | — | 20 | ||||||||||||||||||||||||
| Earnout payment related to 2023 sale of CIT business | — | — | — | — | 28 | ||||||||||||||||||||||||
| Other | 25 | 17 | 15 | 20 | 31 | ||||||||||||||||||||||||
| Total other revenues from operations | $ | 85 | $ | 95 | $ | 77 | $ | 50 | $ | 112 | |||||||||||||||||||
Supplemental Information - Interest Rate Swap Agreements Designated as Hedges at September 30, 2026
| (Dollars in billions) | September 30, 2026 | December 31, 2026 | March 31, 2027 | June 30, 2027 | September 30, 2027 | December 31, 2027 | March 31, 2028 | ||||||||||||||||||||||||||||||||||||||||
| Fair value hedges: | |||||||||||||||||||||||||||||||||||||||||||||||
| Active | $ | 6.1 | $ | 6.1 | $ | 6.1 | $ | 6.1 | $ | 5.1 | $ | 6.4 | $ | 5.9 | |||||||||||||||||||||||||||||||||
| Forward-starting | 1.3 | 1.3 | 1.3 | 1.3 | 1.3 | — | — | ||||||||||||||||||||||||||||||||||||||||
| Cash flow hedges: | |||||||||||||||||||||||||||||||||||||||||||||||
| Active | 16.7 | 17.5 | 17.0 | 17.7 | 15.2 | 13.9 | 12.7 | ||||||||||||||||||||||||||||||||||||||||
| Forward-starting | 8.8 | 8.0 | 5.8 | 1.8 | 1.8 | 1.5 | — | ||||||||||||||||||||||||||||||||||||||||
| Fair value hedges - weighted-average fixed rate: | |||||||||||||||||||||||||||||||||||||||||||||||
| Active | 3.56 | % | 3.56 | % | 3.56 | % | 3.56 | % | 3.66 | % | 3.85 | % | 3.85 | % | |||||||||||||||||||||||||||||||||
| Forward-starting | 4.62 | 4.62 | 4.62 | 4.62 | 4.62 | — | — | ||||||||||||||||||||||||||||||||||||||||
| Cash flow hedges - weighted-average fixed rate: | |||||||||||||||||||||||||||||||||||||||||||||||
| Active | 3.70 | 3.69 | 3.67 | 3.78 | 3.78 | 3.76 | 3.87 | ||||||||||||||||||||||||||||||||||||||||
| Forward-starting | 3.97 | 4.01 | 4.23 | 4.56 | 4.56 | 4.55 | — | ||||||||||||||||||||||||||||||||||||||||
18
| Third Quarter 2026 Results | ||||
Reconciliation of Quarterly GAAP to Non-GAAP Measures
| Three Months Ended | Nine Months Ended | ||||||||||||||||||||||||||||||||||
| September 30, | September 30, | ||||||||||||||||||||||||||||||||||
| 2026 | 2025 | 2026 | 2025 | ||||||||||||||||||||||||||||||||
| (Dollars in millions, except per share) | |||||||||||||||||||||||||||||||||||
| Income statement data | |||||||||||||||||||||||||||||||||||
| Net income | |||||||||||||||||||||||||||||||||||
| Net income | $ | 775 | $ | 792 | $ | 2,257 | $ | 2,092 | |||||||||||||||||||||||||||
| Amortization of core deposit and other intangible assets (1) | 5 | 6 | 17 | 24 | |||||||||||||||||||||||||||||||
| Net operating income | $ | 780 | $ | 798 | $ | 2,274 | $ | 2,116 | |||||||||||||||||||||||||||
| Earnings per common share | |||||||||||||||||||||||||||||||||||
| Diluted earnings per common share | $ | 5.04 | $ | 4.82 | $ | 14.48 | $ | 12.34 | |||||||||||||||||||||||||||
| Amortization of core deposit and other intangible assets (1) | .04 | .05 | .12 | .15 | |||||||||||||||||||||||||||||||
| Diluted net operating earnings per common share | $ | 5.08 | $ | 4.87 | $ | 14.60 | $ | 12.49 | |||||||||||||||||||||||||||
| Other expense | |||||||||||||||||||||||||||||||||||
| Other expense | $ | 1,393 | $ | 1,363 | $ | 4,180 | $ | 4,114 | |||||||||||||||||||||||||||
| Amortization of core deposit and other intangible assets | (7) | (10) | (23) | (32) | |||||||||||||||||||||||||||||||
| Noninterest operating expense | $ | 1,386 | $ | 1,353 | $ | 4,157 | $ | 4,082 | |||||||||||||||||||||||||||
| Efficiency ratio | |||||||||||||||||||||||||||||||||||
| Noninterest operating expense (numerator) | $ | 1,386 | $ | 1,353 | $ | 4,157 | $ | 4,082 | |||||||||||||||||||||||||||
| Taxable-equivalent net interest income | $ | 1,805 | $ | 1,773 | $ | 5,372 | $ | 5,202 | |||||||||||||||||||||||||||
| Other income | 743 | 752 | 2,172 | 2,046 | |||||||||||||||||||||||||||||||
| Less: Gain (loss) on bank investment securities | (1) | 1 | 5 | 1 | |||||||||||||||||||||||||||||||
| Denominator | $ | 2,549 | $ | 2,524 | $ | 7,539 | $ | 7,247 | |||||||||||||||||||||||||||
| Efficiency ratio | 54.4 | % | 53.6 | % | 55.1 | % | 56.3 | % | |||||||||||||||||||||||||||
| Balance sheet data | |||||||||||||||||||||||||||||||||||
| Average assets | |||||||||||||||||||||||||||||||||||
| Average assets | $ | 218,860 | $ | 211,053 | $ | 216,424 | $ | 209,889 | |||||||||||||||||||||||||||
| Goodwill | (8,465) | (8,465) | (8,465) | (8,465) | |||||||||||||||||||||||||||||||
| Core deposit and other intangible assets | (45) | (79) | (52) | (86) | |||||||||||||||||||||||||||||||
| Deferred taxes | 17 | 24 | 18 | 25 | |||||||||||||||||||||||||||||||
| Average tangible assets | $ | 210,367 | $ | 202,533 | $ | 207,925 | $ | 201,363 | |||||||||||||||||||||||||||
| Average common equity | |||||||||||||||||||||||||||||||||||
| Average total equity | $ | 28,331 | $ | 28,583 | $ | 28,305 | $ | 28,748 | |||||||||||||||||||||||||||
| Preferred stock | (2,890) | (2,394) | (2,635) | (2,394) | |||||||||||||||||||||||||||||||
| Average common equity | 25,441 | 26,189 | 25,670 | 26,354 | |||||||||||||||||||||||||||||||
| Goodwill | (8,465) | (8,465) | (8,465) | (8,465) | |||||||||||||||||||||||||||||||
| Core deposit and other intangible assets | (45) | (79) | (52) | (86) | |||||||||||||||||||||||||||||||
| Deferred taxes | 17 | 24 | 18 | 25 | |||||||||||||||||||||||||||||||
| Average tangible common equity | $ | 16,948 | $ | 17,669 | $ | 17,171 | $ | 17,828 | |||||||||||||||||||||||||||
| At end of quarter | |||||||||||||||||||||||||||||||||||
| Total assets | |||||||||||||||||||||||||||||||||||
| Total assets | $ | 220,510 | $ | 211,277 | |||||||||||||||||||||||||||||||
| Goodwill | (8,465) | (8,465) | |||||||||||||||||||||||||||||||||
| Core deposit and other intangible assets | (41) | (74) | |||||||||||||||||||||||||||||||||
| Deferred taxes | 16 | 23 | |||||||||||||||||||||||||||||||||
| Total tangible assets | $ | 212,020 | $ | 202,761 | |||||||||||||||||||||||||||||||
| Total common equity | |||||||||||||||||||||||||||||||||||
| Total equity | $ | 28,159 | $ | 28,728 | |||||||||||||||||||||||||||||||
| Preferred stock | (3,017) | (2,394) | |||||||||||||||||||||||||||||||||
| Common equity | 25,142 | 26,334 | |||||||||||||||||||||||||||||||||
| Goodwill | (8,465) | (8,465) | |||||||||||||||||||||||||||||||||
| Core deposit and other intangible assets | (41) | (74) | |||||||||||||||||||||||||||||||||
| Deferred taxes | 16 | 23 | |||||||||||||||||||||||||||||||||
| Total tangible common equity | $ | 16,652 | $ | 17,818 | |||||||||||||||||||||||||||||||
(1) After any related tax effect.
19
| Third Quarter 2026 Results | ||||
Reconciliation of Quarterly GAAP to Non-GAAP Measures, Five Quarter Trend
| Three Months Ended | |||||||||||||||||||||||||||||
| September 30, | June 30, | March 31, | December 31, | September 30, | |||||||||||||||||||||||||
| 2026 | 2026 | 2026 | 2025 | 2025 | |||||||||||||||||||||||||
| (Dollars in millions, except per share) | |||||||||||||||||||||||||||||
| Income statement data | |||||||||||||||||||||||||||||
| Net income | |||||||||||||||||||||||||||||
| Net income | $ | 775 | $ | 818 | $ | 664 | $ | 759 | $ | 792 | |||||||||||||||||||
| Amortization of core deposit and other intangible assets (1) | 5 | 5 | 7 | 8 | 6 | ||||||||||||||||||||||||
| Net operating income | $ | 780 | $ | 823 | $ | 671 | $ | 767 | $ | 798 | |||||||||||||||||||
| Earnings per common share | |||||||||||||||||||||||||||||
| Diluted earnings per common share | $ | 5.04 | $ | 5.32 | $ | 4.13 | $ | 4.67 | $ | 4.82 | |||||||||||||||||||
| Amortization of core deposit and other intangible assets (1) | .04 | .03 | .05 | .05 | .05 | ||||||||||||||||||||||||
| Diluted net operating earnings per common share | $ | 5.08 | $ | 5.35 | $ | 4.18 | $ | 4.72 | $ | 4.87 | |||||||||||||||||||
| Other expense | |||||||||||||||||||||||||||||
| Other expense | $ | 1,393 | $ | 1,349 | $ | 1,438 | $ | 1,379 | $ | 1,363 | |||||||||||||||||||
| Amortization of core deposit and other intangible assets | (7) | (7) | (9) | (10) | (10) | ||||||||||||||||||||||||
| Noninterest operating expense | $ | 1,386 | $ | 1,342 | $ | 1,429 | $ | 1,369 | $ | 1,353 | |||||||||||||||||||
| Efficiency ratio | |||||||||||||||||||||||||||||
| Noninterest operating expense (numerator) | $ | 1,386 | $ | 1,342 | $ | 1,429 | $ | 1,369 | $ | 1,353 | |||||||||||||||||||
| Taxable-equivalent net interest income | $ | 1,805 | $ | 1,804 | $ | 1,763 | $ | 1,790 | $ | 1,773 | |||||||||||||||||||
| Other income | 743 | 740 | 689 | 696 | 752 | ||||||||||||||||||||||||
| Less: Gain (loss) on bank investment securities | (1) | 2 | 4 | 1 | 1 | ||||||||||||||||||||||||
| Denominator | $ | 2,549 | $ | 2,542 | $ | 2,448 | $ | 2,485 | $ | 2,524 | |||||||||||||||||||
| Efficiency ratio | 54.4 | % | 52.8 | % | 58.3 | % | 55.1 | % | 53.6 | % | |||||||||||||||||||
| Balance sheet data | |||||||||||||||||||||||||||||
| Average assets | |||||||||||||||||||||||||||||
| Average assets | $ | 218,860 | $ | 216,532 | $ | 213,828 | $ | 212,891 | $ | 211,053 | |||||||||||||||||||
| Goodwill | (8,465) | (8,465) | (8,465) | (8,465) | (8,465) | ||||||||||||||||||||||||
| Core deposit and other intangible assets | (45) | (51) | (59) | (69) | (79) | ||||||||||||||||||||||||
| Deferred taxes | 17 | 17 | 19 | 22 | 24 | ||||||||||||||||||||||||
| Average tangible assets | $ | 210,367 | $ | 208,033 | $ | 205,323 | $ | 204,379 | $ | 202,533 | |||||||||||||||||||
| Average common equity | |||||||||||||||||||||||||||||
| Average total equity | $ | 28,331 | $ | 27,939 | $ | 28,648 | $ | 28,970 | $ | 28,583 | |||||||||||||||||||
| Preferred stock | (2,890) | (2,434) | (2,576) | (2,691) | (2,394) | ||||||||||||||||||||||||
| Average common equity | 25,441 | 25,505 | 26,072 | 26,279 | 26,189 | ||||||||||||||||||||||||
| Goodwill | (8,465) | (8,465) | (8,465) | (8,465) | (8,465) | ||||||||||||||||||||||||
| Core deposit and other intangible assets | (45) | (51) | (59) | (69) | (79) | ||||||||||||||||||||||||
| Deferred taxes | 17 | 17 | 19 | 22 | 24 | ||||||||||||||||||||||||
| Average tangible common equity | $ | 16,948 | $ | 17,006 | $ | 17,567 | $ | 17,767 | $ | 17,669 | |||||||||||||||||||
| At end of quarter | |||||||||||||||||||||||||||||
| Total assets | |||||||||||||||||||||||||||||
| Total assets | $ | 220,510 | $ | 219,261 | $ | 214,736 | $ | 213,510 | $ | 211,277 | |||||||||||||||||||
| Goodwill | (8,465) | (8,465) | (8,465) | (8,465) | (8,465) | ||||||||||||||||||||||||
| Core deposit and other intangible assets | (41) | (48) | (55) | (64) | (74) | ||||||||||||||||||||||||
| Deferred taxes | 16 | 17 | 18 | 20 | 23 | ||||||||||||||||||||||||
| Total tangible assets | $ | 212,020 | $ | 210,765 | $ | 206,234 | $ | 205,001 | $ | 202,761 | |||||||||||||||||||
| Total common equity | |||||||||||||||||||||||||||||
| Total equity | $ | 28,159 | $ | 27,946 | $ | 27,972 | $ | 29,177 | $ | 28,728 | |||||||||||||||||||
| Preferred stock | (3,017) | (2,434) | (2,434) | (2,834) | (2,394) | ||||||||||||||||||||||||
| Common equity | 25,142 | 25,512 | 25,538 | 26,343 | 26,334 | ||||||||||||||||||||||||
| Goodwill | (8,465) | (8,465) | (8,465) | (8,465) | (8,465) | ||||||||||||||||||||||||
| Core deposit and other intangible assets | (41) | (48) | (55) | (64) | (74) | ||||||||||||||||||||||||
| Deferred taxes | 16 | 17 | 18 | 20 | 23 | ||||||||||||||||||||||||
| Total tangible common equity | $ | 16,652 | $ | 17,016 | $ | 17,036 | $ | 17,834 | $ | 17,818 | |||||||||||||||||||
(1) After any related tax effect.
20

Earnings Results 3rd Quarter 2026 October 16, 2026 Exhibit 99.2

2 This presentation may contain forward-looking statements regarding M&T Bank Corporation (“M&T”) within the meaning of the Private Securities Litigation Reform Act of 1995 and the rules and regulations of the Securities and Exchange Commission (“SEC”). Any statement that does not describe historical or current facts is a forward-looking statement, including statements based on current expectations, estimates and projections about M&T's business, and management's beliefs and assumptions. Statements regarding the potential effects of events or factors specific to M&T and/or the financial industry as a whole, as well as national and global events generally, on M&T's business, financial condition, liquidity and results of operations may constitute forward-looking statements. Such statements are subject to the risk that the actual effects may differ, possibly materially, from what is reflected in those forward-looking statements due to factors and future developments that are uncertain, unpredictable and in many cases beyond M&T's control. Forward-looking statements are typically identified by words such as "believe," "expect," "anticipate," "intend," "target," "estimate," "continue," or "potential," by future conditional verbs such as "will," "would," "should," "could," or "may," or by variations of such words or by similar expressions. These statements are not guarantees of future performance and involve certain risks, uncertainties and assumptions which are difficult to predict and may cause actual outcomes to differ materially from what is expressed or forecasted. While there can be no assurance that any list of risks and uncertainties is complete, important factors that could cause actual outcomes and results to differ materially from those contemplated by forward-looking statements include the following, without limitation: economic conditions and growth rates, including inflation and market volatility; events, developments and current conditions in the financial services industry, including trust, brokerage and investment management businesses; changes in interest rates, spreads on earning assets and interest-bearing liabilities, and interest rate sensitivity; prepayment speeds, loan originations, loan concentrations by type and industry, credit losses and market values on loans, collateral securing loans, and other assets; sources of liquidity; levels of client deposits; ability to contain costs and expenses; changes in M&T's credit ratings; domestic or international political developments and other geopolitical events, including trade and tariff policies and international conflicts and hostilities; changes and trends in the securities markets; common shares outstanding and common stock price volatility; fair value of and number of stock-based compensation awards to be issued in future periods; the impact of changes in market values on trust-, brokerage-, and investment management-related revenues; federal, state or local legislation and/or regulations affecting the financial services industry, or M&T and its subsidiaries individually or collectively, including tax policy; regulatory supervision and oversight, including monetary policy and capital requirements; governmental and public policy changes; political conditions, either nationally or in the states in which M&T and its subsidiaries do business; the initiation and outcome of potential, pending and future litigation, investigations and governmental proceedings, including tax-related examinations and other matters; operational risk events, including loss resulting from fraud by employees or persons outside M&T and breaches in data and cybersecurity; changes in accounting policies or procedures as may be required by the Financial Accounting Standards Board, regulatory agencies or legislation; increasing price, product and service competition by competitors, including new entrants; technological developments and changes; the ability to continue to introduce competitive new products and services on a timely, cost-effective basis; the mix of products and services; protection and validity of intellectual property rights; reliance on large customers; technological, implementation and cost/ financial risks in large, multi-year contracts; continued availability of financing; financial resources in the amounts, at the times and on the terms required to support M&T and its subsidiaries' future businesses; and material differences in the actual financial results of merger, acquisition, divestment and investment activities compared with M&T's initial expectations, including the full realization of anticipated cost savings and revenue enhancements. These are representative of the factors that could affect the outcome of the forward-looking statements. In addition, as noted, such statements could be affected by general industry and market conditions and growth rates, general economic and political conditions, either nationally or in the states in which M&T and its subsidiaries do business, and other factors. M&T provides further detail regarding these risks and uncertainties in its Form 10-K for the year ended December 31, 2025, including in the Risk Factors section of such report, as well as in other SEC filings. Forward-looking statements speak only as of the date they are made, and M&T assumes no duty and does not undertake to update forward-looking statements. Annualized, pro forma, projected, and estimated numbers are used for illustrative purposes only, are not forecasts and may not reflect actual results. This presentation also contains financial information and performance measures determined by methods other than in accordance with accounting principles generally accepted in the United States ("GAAP"). Management believes investors may find these non-GAAP financial measures useful. These disclosures should not be viewed as a substitute for financial measures determined in accordance with GAAP, nor are they necessarily comparable to non-GAAP performance measures that may be presented by other companies. Please see the Appendix for reconciliation of GAAP with corresponding non- GAAP measures, as indicated in the presentation. Forward-Looking Statements and Non-GAAP Financial Measures
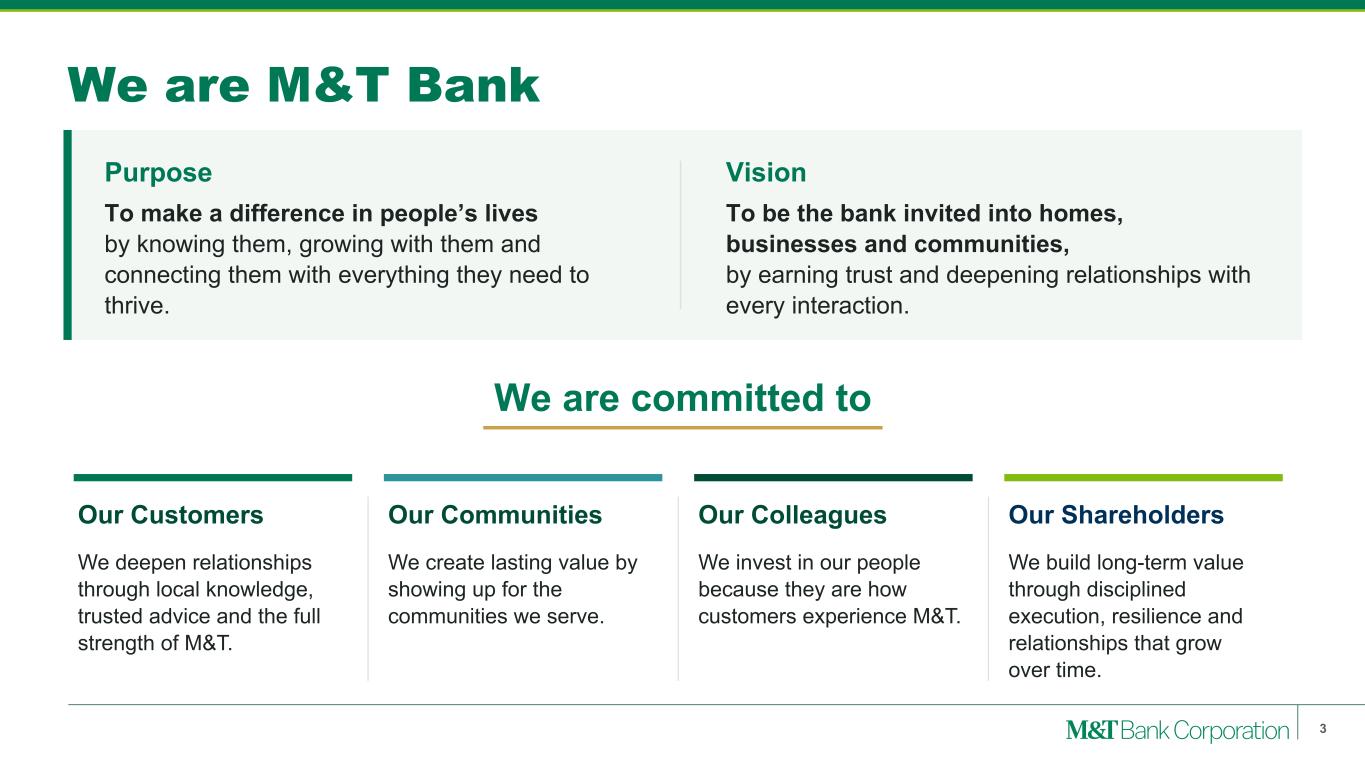
We are M&T Bank Purpose To make a difference in people’s lives by knowing them, growing with them and connecting them with everything they need to thrive. Vision To be the bank invited into homes, businesses and communities, by earning trust and deepening relationships with every interaction. We are committed to Our Customers We deepen relationships through local knowledge, trusted advice and the full strength of M&T. Our Communities We create lasting value by showing up for the communities we serve. Our Colleagues We invest in our people because they are how customers experience M&T. Our Shareholders We build long-term value through disciplined execution, resilience and relationships that grow over time. 3
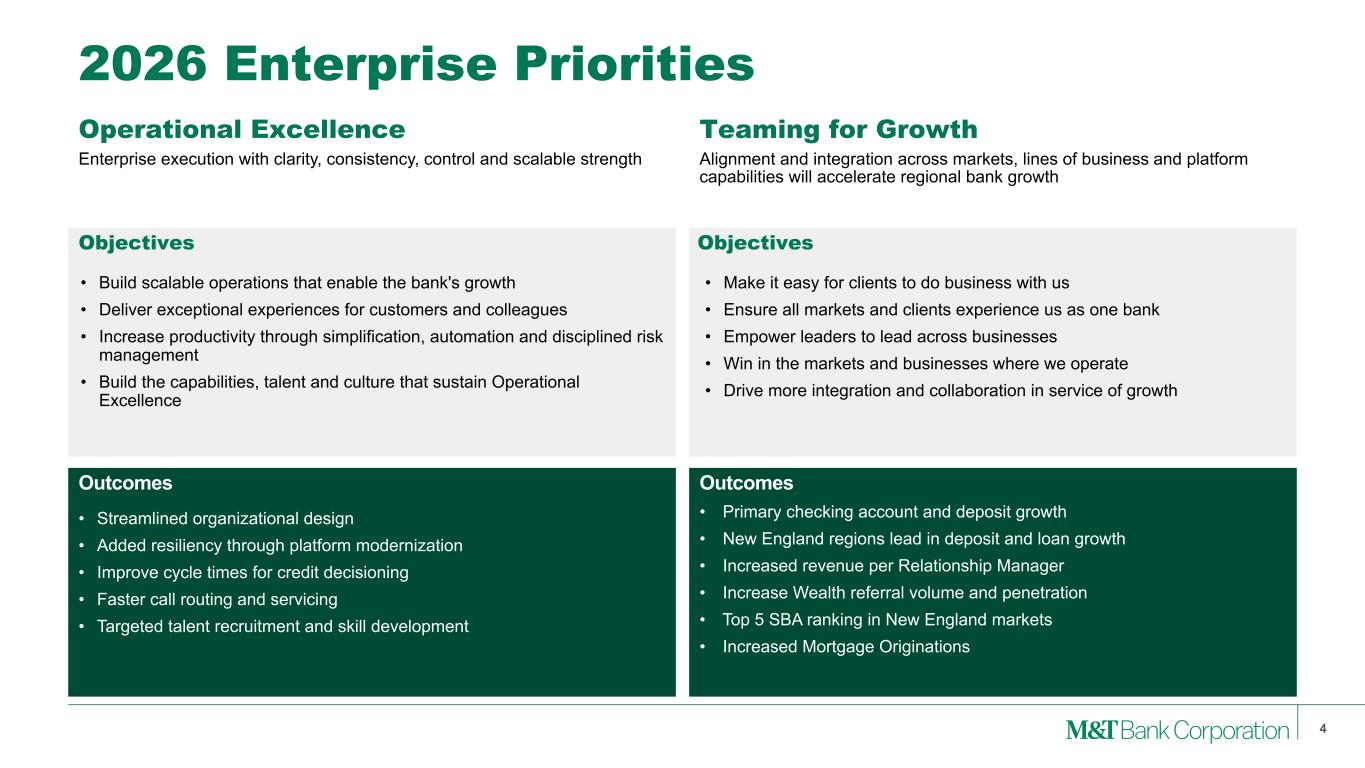
Operational Excellence Alignment and integration across markets, lines of business and platform capabilities will accelerate regional bank growth 4 2026 Enterprise Priorities Teaming for Growth • Make it easy for clients to do business with us • Ensure all markets and clients experience us as one bank • Empower leaders to lead across businesses • Win in the markets and businesses where we operate • Drive more integration and collaboration in service of growth Enterprise execution with clarity, consistency, control and scalable strength • Build scalable operations that enable the bank's growth • Deliver exceptional experiences for customers and colleagues • Increase productivity through simplification, automation and disciplined risk management • Build the capabilities, talent and culture that sustain Operational Excellence • Streamlined organizational design • Added resiliency through platform modernization • Improve cycle times for credit decisioning • Faster call routing and servicing • Targeted talent recruitment and skill development • Primary checking account and deposit growth • New England regions lead in deposit and loan growth • Increased revenue per Relationship Manager • Increase Wealth referral volume and penetration • Top 5 SBA ranking in New England markets • Increased Mortgage Originations Objectives Objectives Outcomes Outcomes

Key Awards and Accolades Received 13 “Best Bank” Awards across Small Business and Middle-Market Categories Jennifer Warren, CEO, Wilmington Trust Finalist, Executive Excellence Award Michael Wisler, CIO, M&T Bank Named to Inaugural Pacesetters List Received #1 Ranking among U.S. Companies 5
6 Financial Results
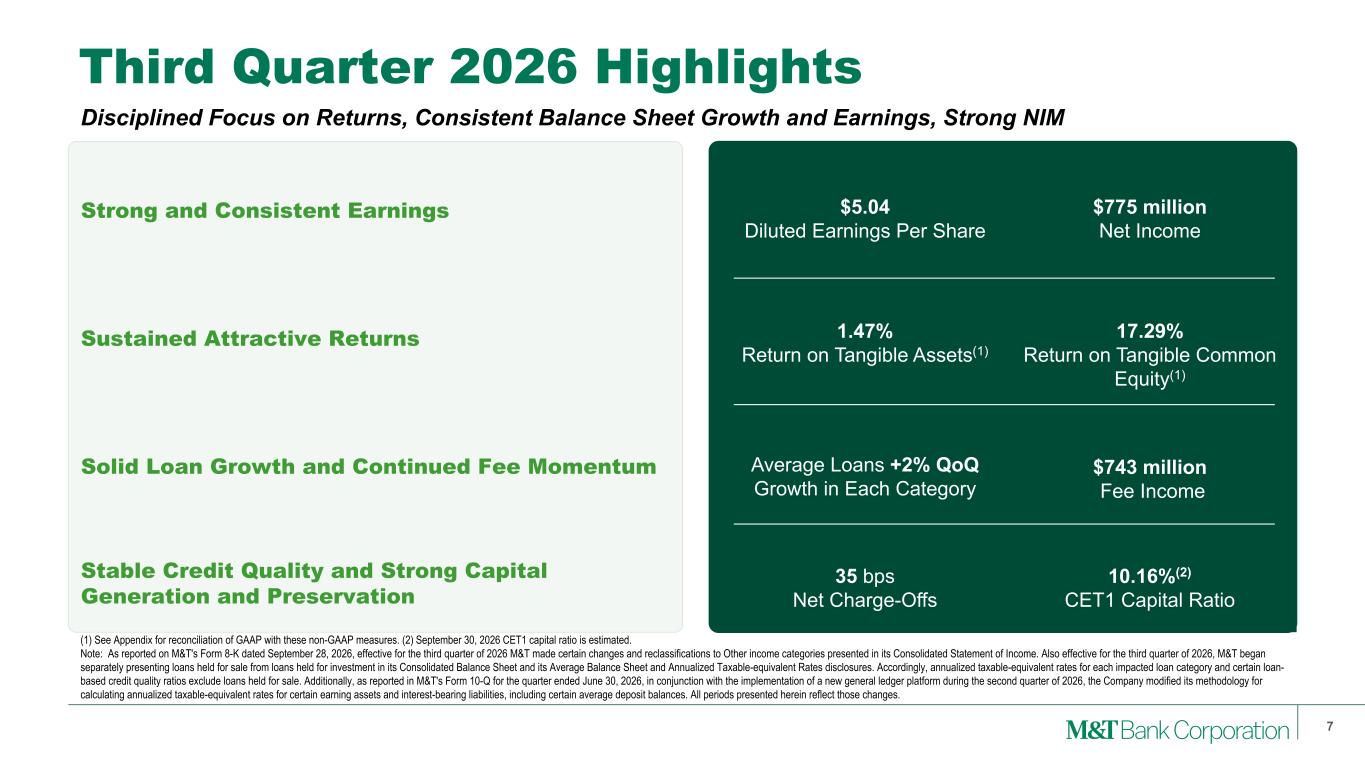
Third Quarter 2026 Highlights 7 (1) See Appendix for reconciliation of GAAP with these non-GAAP measures. (2) September 30, 2026 CET1 capital ratio is estimated. Note: As reported on M&T's Form 8-K dated September 28, 2026, effective for the third quarter of 2026 M&T made certain changes and reclassifications to Other income categories presented in its Consolidated Statement of Income. Also effective for the third quarter of 2026, M&T began separately presenting loans held for sale from loans held for investment in its Consolidated Balance Sheet and its Average Balance Sheet and Annualized Taxable-equivalent Rates disclosures. Accordingly, annualized taxable-equivalent rates for each impacted loan category and certain loan- based credit quality ratios exclude loans held for sale. Additionally, as reported in M&T's Form 10-Q for the quarter ended June 30, 2026, in conjunction with the implementation of a new general ledger platform during the second quarter of 2026, the Company modified its methodology for calculating annualized taxable-equivalent rates for certain earning assets and interest-bearing liabilities, including certain average deposit balances. All periods presented herein reflect those changes. Disciplined Focus on Returns, Consistent Balance Sheet Growth and Earnings, Strong NIM Strong and Consistent Earnings Sustained Attractive Returns Solid Loan Growth and Continued Fee Momentum Stable Credit Quality and Strong Capital Generation and Preservation $5.04 Diluted Earnings Per Share $775 million Net Income 1.47% Return on Tangible Assets(1) 17.29% Return on Tangible Common Equity(1) Average Loans +2% QoQ Growth in Each Category $743 million Fee Income 35 bps Net Charge-Offs 10.16%(2) CET1 Capital Ratio
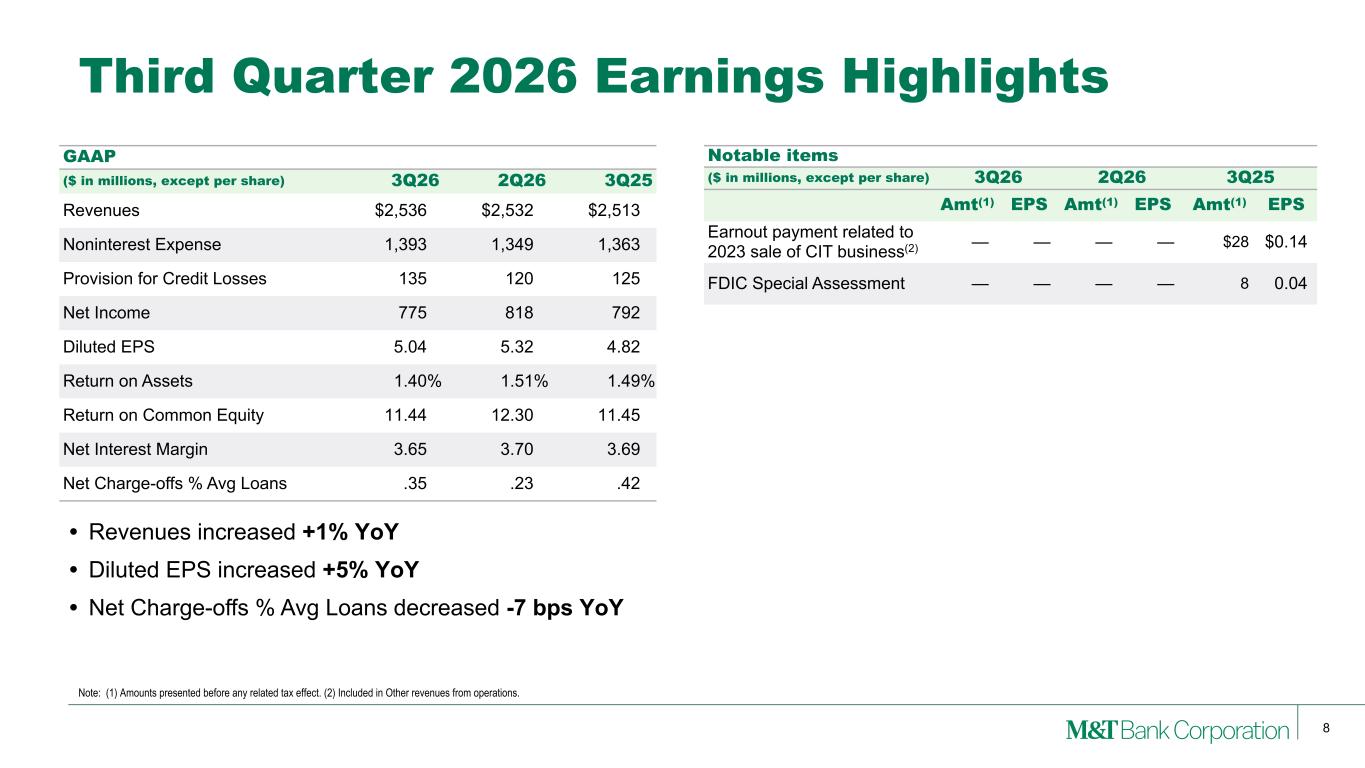
8 • Revenues increased +1% YoY • Diluted EPS increased +5% YoY • Net Charge-offs % Avg Loans decreased -7 bps YoY Notable items ($ in millions, except per share) 3Q26 2Q26 3Q25 Amt(1) EPS Amt(1) EPS Amt(1) EPS Earnout payment related to 2023 sale of CIT business(2) — — — — $28 $0.14 FDIC Special Assessment — — — — 8 0.04 Third Quarter 2026 Earnings Highlights GAAP ($ in millions, except per share) 3Q26 2Q26 3Q25 Revenues $2,536 $2,532 $2,513 Noninterest Expense 1,393 1,349 1,363 Provision for Credit Losses 135 120 125 Net Income 775 818 792 Diluted EPS 5.04 5.32 4.82 Return on Assets 1.40% 1.51% 1.49% Return on Common Equity 11.44 12.30 11.45 Net Interest Margin 3.65 3.70 3.69 Net Charge-offs % Avg Loans .35 .23 .42 Note: (1) Amounts presented before any related tax effect. (2) Included in Other revenues from operations.
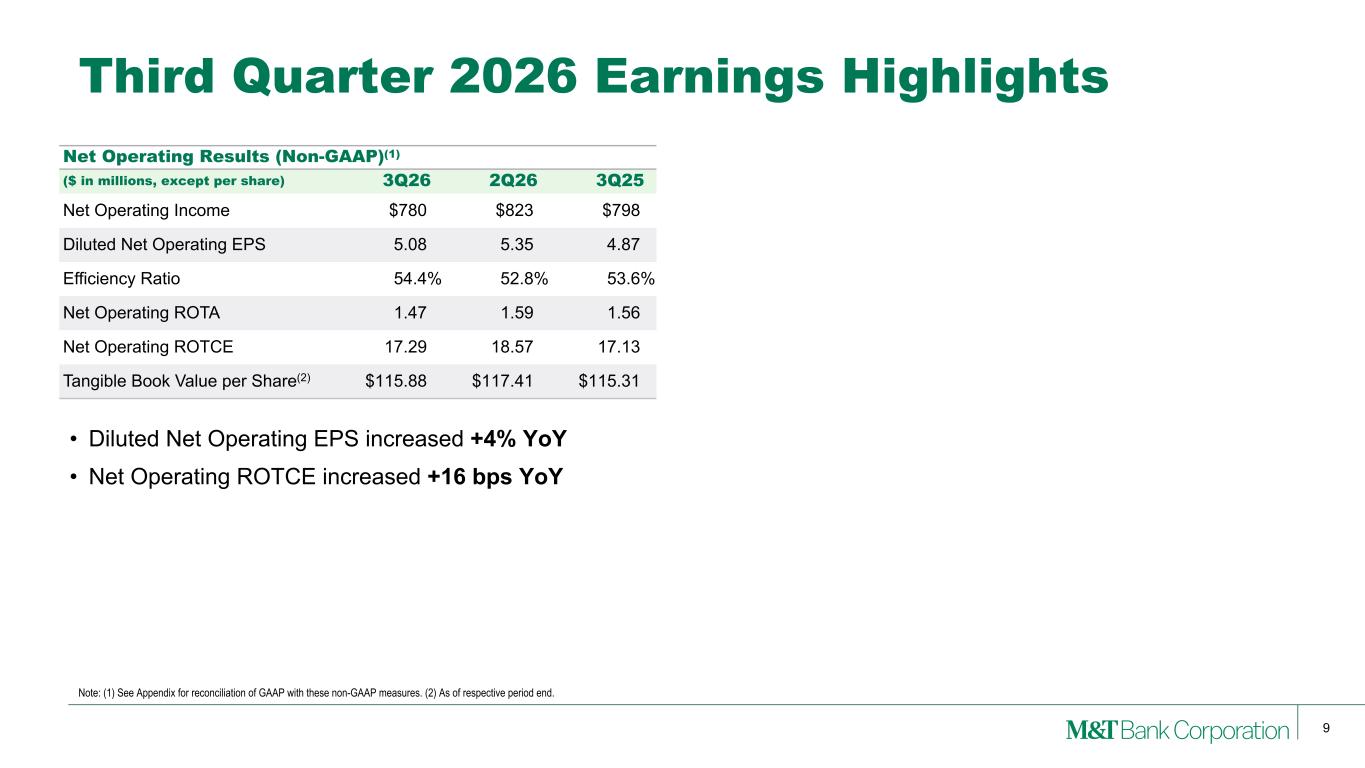
9 Note: (1) See Appendix for reconciliation of GAAP with these non-GAAP measures. (2) As of respective period end. Third Quarter 2026 Earnings Highlights Net Operating Results (Non-GAAP)(1) ($ in millions, except per share) 3Q26 2Q26 3Q25 Net Operating Income $780 $823 $798 Diluted Net Operating EPS 5.08 5.35 4.87 Efficiency Ratio 54.4% 52.8% 53.6% Net Operating ROTA 1.47 1.59 1.56 Net Operating ROTCE 17.29 18.57 17.13 Tangible Book Value per Share(2) $115.88 $117.41 $115.31 • Diluted Net Operating EPS increased +4% YoY • Net Operating ROTCE increased +16 bps YoY
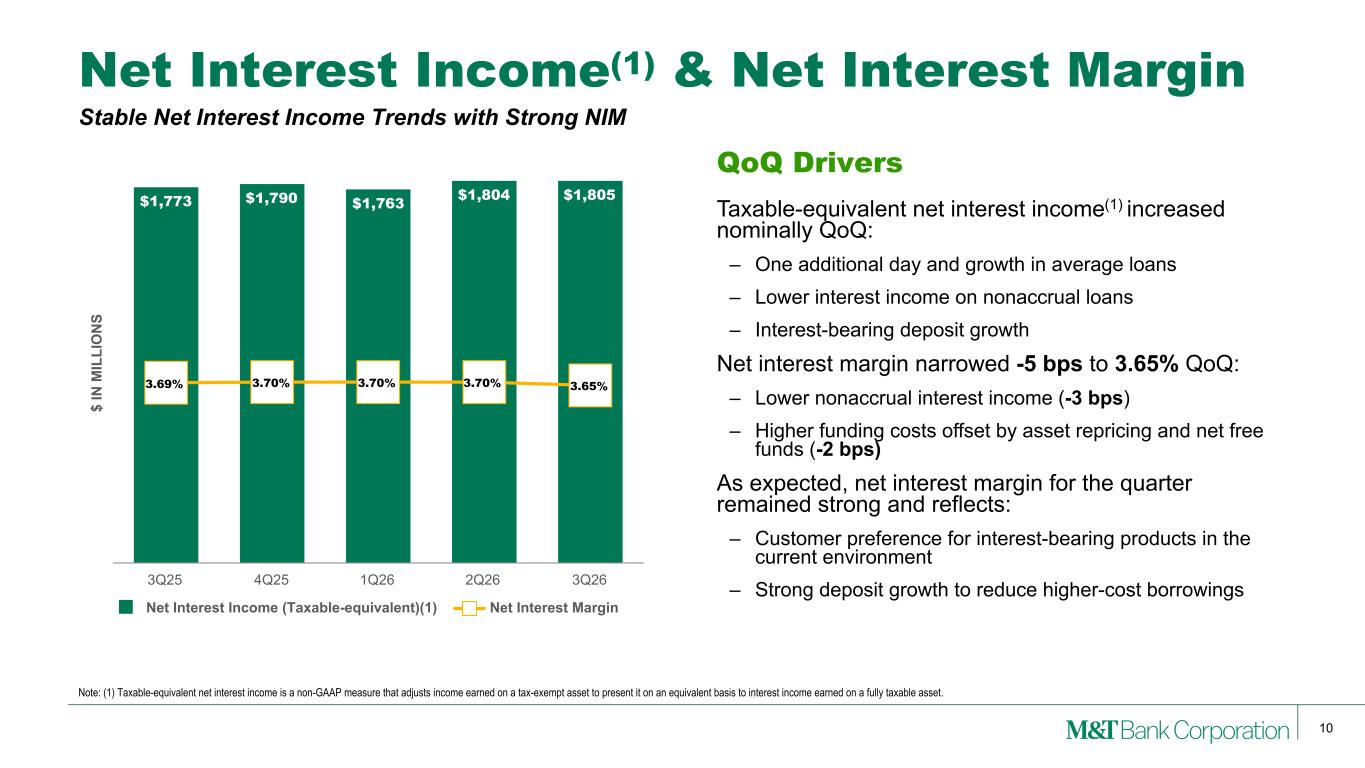
10 Net Interest Income(1) & Net Interest Margin Note: (1) Taxable-equivalent net interest income is a non-GAAP measure that adjusts income earned on a tax-exempt asset to present it on an equivalent basis to interest income earned on a fully taxable asset. Stable Net Interest Income Trends with Strong NIM $ IN M IL LI O N S $1,773 $1,790 $1,763 $1,804 $1,805 3.69% 3.70% 3.70% 3.70% 3.65% Net Interest Income (Taxable-equivalent)(1) Net Interest Margin 3Q25 4Q25 1Q26 2Q26 3Q26 QoQ Drivers Taxable-equivalent net interest income(1) increased nominally QoQ: – One additional day and growth in average loans – Lower interest income on nonaccrual loans – Interest-bearing deposit growth Net interest margin narrowed -5 bps to 3.65% QoQ: – Lower nonaccrual interest income (-3 bps) – Higher funding costs offset by asset repricing and net free funds (-2 bps) As expected, net interest margin for the quarter remained strong and reflects: – Customer preference for interest-bearing products in the current environment – Strong deposit growth to reduce higher-cost borrowings

11 • Capital levels strong with CET1 capital ratio of 10.16%(2) • Repurchased $323 million(3) of common shares in 3Q26 Change 3Q26 vs Average Balances, $ in billions, except per share 3Q26 2Q26 3Q25 2Q26 3Q25 Interest-bearing Deposits at Banks $14.2 $15.1 $17.7 -6% -20% Investment Securities 38.6 38.7 36.6 — 5 Loans Held for Sale 0.7 0.8 0.6 -12 7 Commercial and Industrial (“C&I”) 65.9 65.9 61.7 — 7 Commercial Real Estate (“CRE”) 24.9 23.2 24.0 7 4 Residential Real Estate ("RRE") 25.2 24.9 24.1 1 4 Consumer 27.3 26.7 26.1 2 5 Total Loans 143.3 140.7 135.9 2 5 Earning Assets 196.7 195.2 190.9 1 3 Deposits 166.8 163.5 162.6 2 3 Borrowings 19.2 20.8 15.6 -8 23 Common Shareholders’ Equity 25.4 25.5 26.2 — -3 As of Quarter End Common Shareholders' Equity per Share $174.95 $176.03 $170.43 -1% 3% Tangible Equity per Common Share(1) 115.88 117.41 115.31 -1 — Tangible Common Equity / Tangible Assets(1) 7.85 % 8.07 % 8.79 % -22 bps -94 bps Common Equity Tier 1 ("CET1") Capital Ratio 10.16 10.19 10.99 -3 bps -83 bps Balance Sheet – Overview Note: (1) See Appendix for reconciliation of GAAP with these non-GAAP measures. (2) September 30, 2026 CET1 capital ratio is estimated. (3) Includes share repurchase excise tax. Disciplined Balance Sheet Growth and Strong Capital Levels Supported by Capital Generation and Preservation (2)
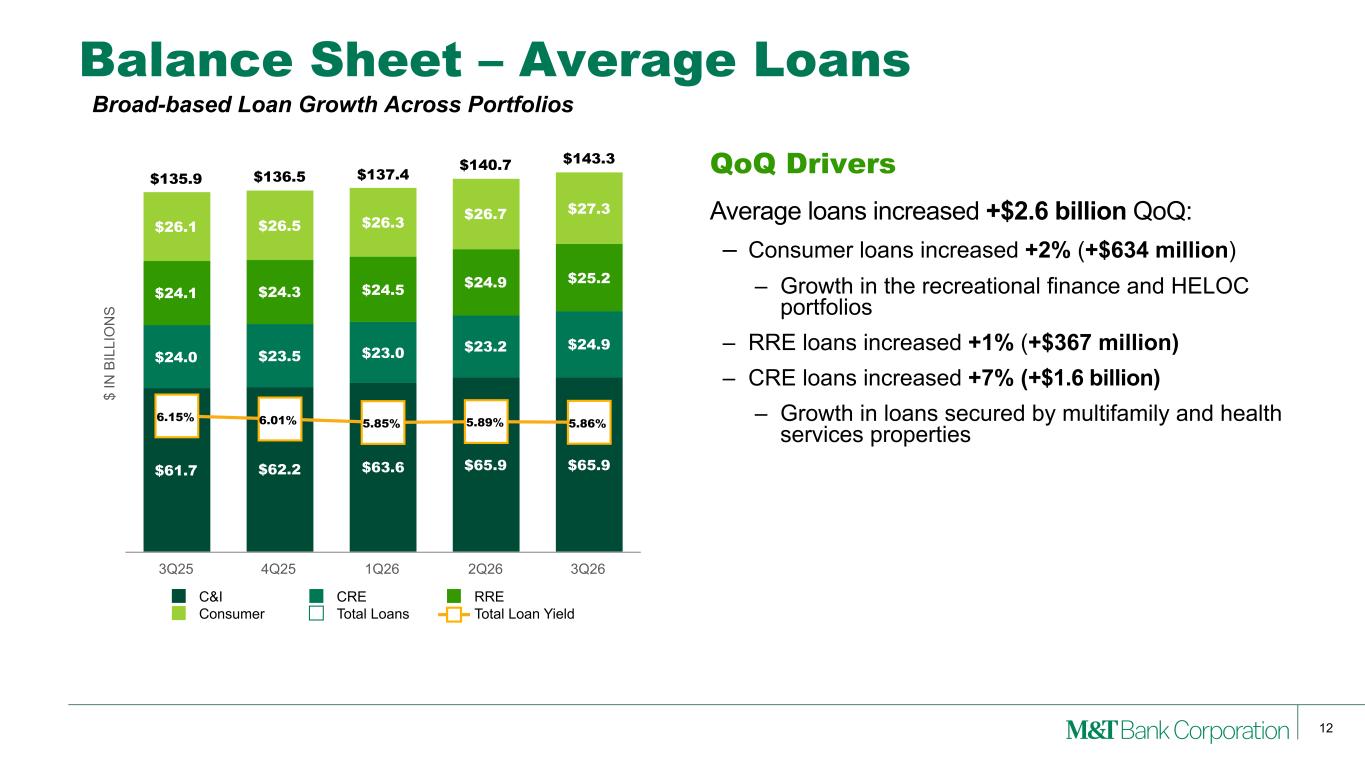
12 Balance Sheet – Average Loans QoQ Drivers Average loans increased +$2.6 billion QoQ: – Consumer loans increased +2% (+$634 million) – Growth in the recreational finance and HELOC portfolios – RRE loans increased +1% (+$367 million) – CRE loans increased +7% (+$1.6 billion) – Growth in loans secured by multifamily and health services properties $ IN B IL LI O N S $61.7 $62.2 $63.6 $65.9 $65.9 $24.0 $23.5 $23.0 $23.2 $24.9 $24.1 $24.3 $24.5 $24.9 $25.2 $26.1 $26.5 $26.3 $26.7 $27.3 $135.9 $136.5 $137.4 $140.7 $143.3 6.15% 6.01% 5.85% 5.89% 5.86% C&I CRE RRE Consumer Total Loans Total Loan Yield 3Q25 4Q25 1Q26 2Q26 3Q26 Broad-based Loan Growth Across Portfolios
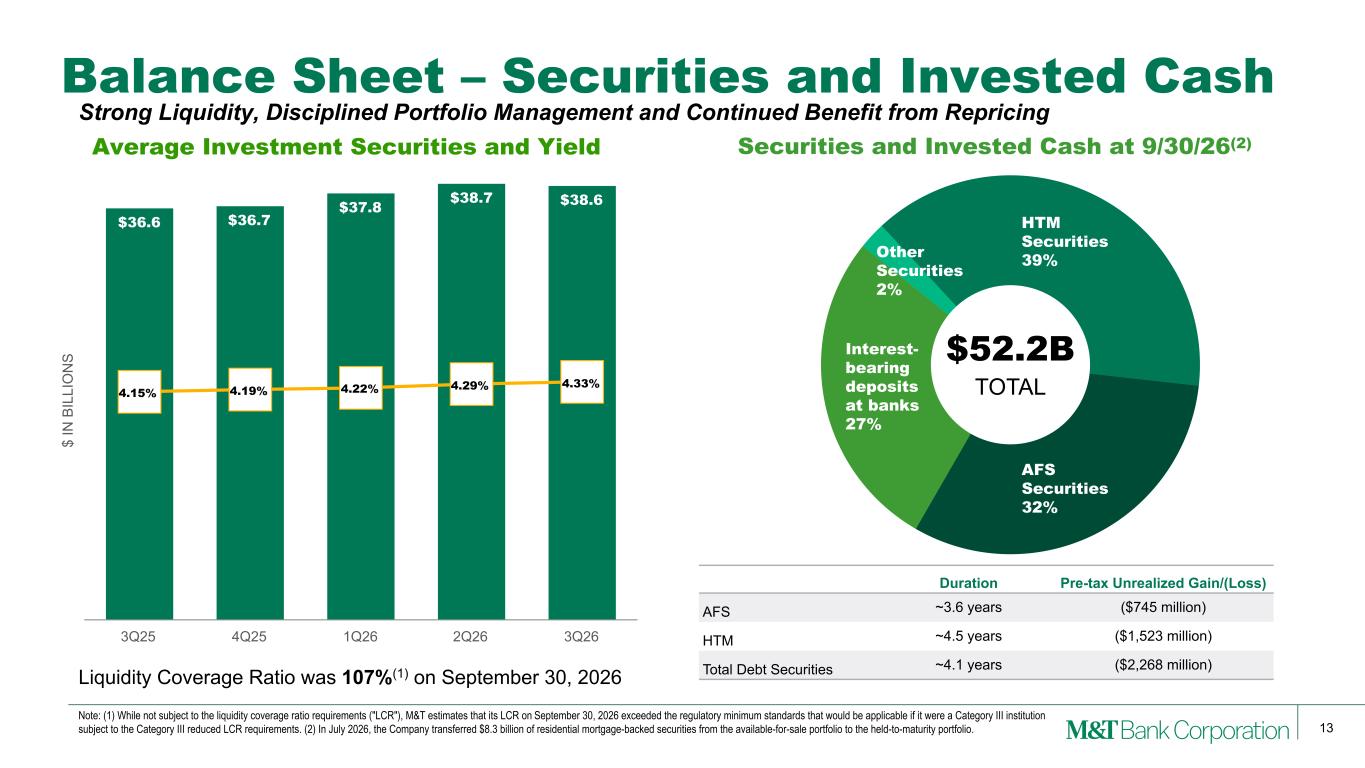
13 Balance Sheet – Securities and Invested Cash Liquidity Coverage Ratio was 107%(1) on September 30, 2026 Duration Pre-tax Unrealized Gain/(Loss) AFS ~3.6 years ($745 million) HTM ~4.5 years ($1,523 million) Total Debt Securities ~4.1 years ($2,268 million) $ IN B IL LI O N S Average Investment Securities and Yield $36.6 $36.7 $37.8 $38.7 $38.6 4.15% 4.19% 4.22% 4.29% 4.33% 3Q25 4Q25 1Q26 2Q26 3Q26 Interest- bearing deposits at banks 27% Other Securities 2% HTM Securities 39% AFS Securities 32% $52.2B TOTAL Securities and Invested Cash at 9/30/26(2) Note: (1) While not subject to the liquidity coverage ratio requirements ("LCR"), M&T estimates that its LCR on September 30, 2026 exceeded the regulatory minimum standards that would be applicable if it were a Category III institution subject to the Category III reduced LCR requirements. (2) In July 2026, the Company transferred $8.3 billion of residential mortgage-backed securities from the available-for-sale portfolio to the held-to-maturity portfolio. Strong Liquidity, Disciplined Portfolio Management and Continued Benefit from Repricing
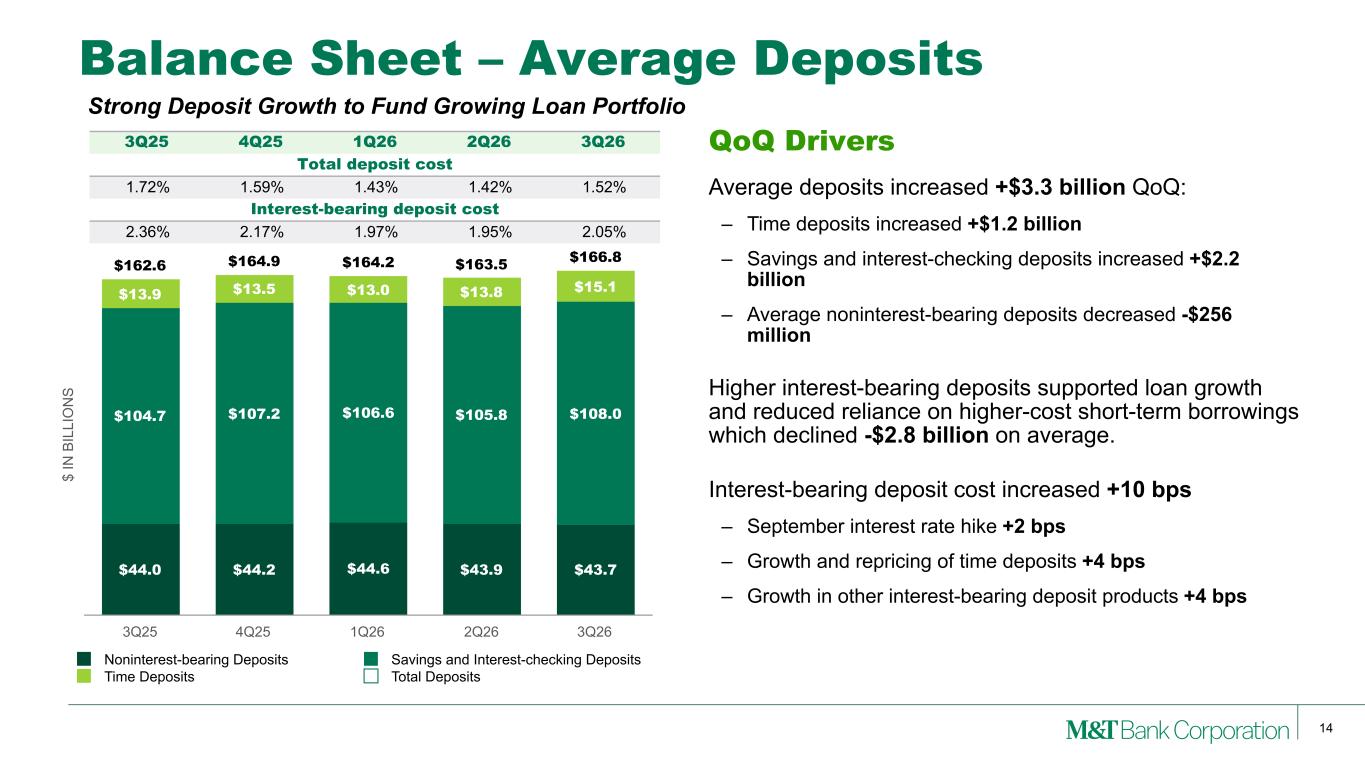
14 Balance Sheet – Average Deposits QoQ Drivers Average deposits increased +$3.3 billion QoQ: – Time deposits increased +$1.2 billion – Savings and interest-checking deposits increased +$2.2 billion – Average noninterest-bearing deposits decreased -$256 million Higher interest-bearing deposits supported loan growth and reduced reliance on higher-cost short-term borrowings which declined -$2.8 billion on average. Interest-bearing deposit cost increased +10 bps – September interest rate hike +2 bps – Growth and repricing of time deposits +4 bps – Growth in other interest-bearing deposit products +4 bps $ IN B IL LI O N S $44.0 $44.2 $44.6 $43.9 $43.7 $104.7 $107.2 $106.6 $105.8 $108.0 $13.9 $13.5 $13.0 $13.8 $15.1 $162.6 $164.9 $164.2 $163.5 $166.8 Noninterest-bearing Deposits Savings and Interest-checking Deposits Time Deposits Total Deposits 3Q25 4Q25 1Q26 2Q26 3Q26 3Q25 4Q25 1Q26 2Q26 3Q26 Total deposit cost 1.72% 1.59% 1.43% 1.42% 1.52% Interest-bearing deposit cost 2.36% 2.17% 1.97% 1.95% 2.05% Strong Deposit Growth to Fund Growing Loan Portfolio
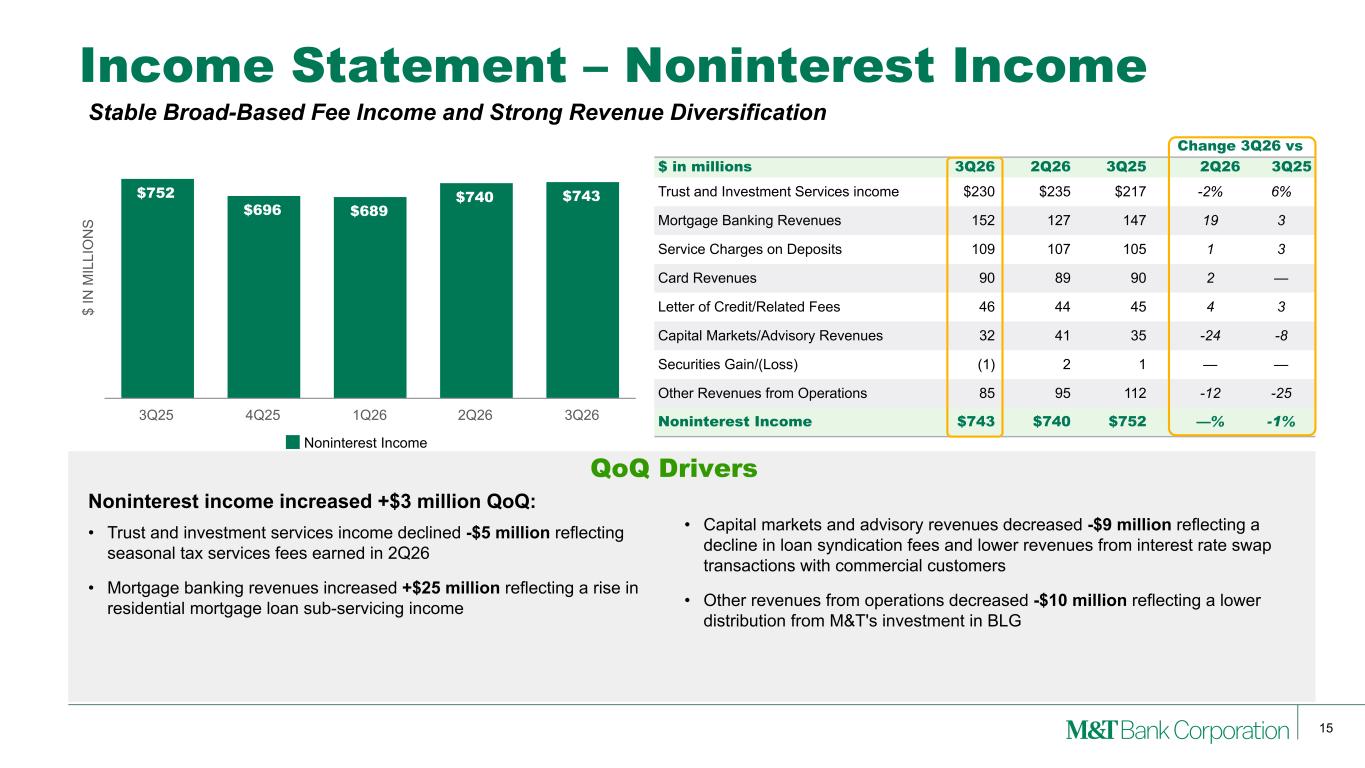
15 $ IN M IL LI O N S $752 $696 $689 $740 $743 Noninterest Income 3Q25 4Q25 1Q26 2Q26 3Q26 Change 3Q26 vs $ in millions 3Q26 2Q26 3Q25 2Q26 3Q25 Trust and Investment Services income $230 $235 $217 -2% 6% Mortgage Banking Revenues 152 127 147 19 3 Service Charges on Deposits 109 107 105 1 3 Card Revenues 90 89 90 2 — Letter of Credit/Related Fees 46 44 45 4 3 Capital Markets/Advisory Revenues 32 41 35 -24 -8 Securities Gain/(Loss) (1) 2 1 — — Other Revenues from Operations 85 95 112 -12 -25 Noninterest Income $743 $740 $752 —% -1% • Capital markets and advisory revenues decreased -$9 million reflecting a decline in loan syndication fees and lower revenues from interest rate swap transactions with commercial customers • Other revenues from operations decreased -$10 million reflecting a lower distribution from M&T's investment in BLG Income Statement – Noninterest Income Noninterest income increased +$3 million QoQ: • Trust and investment services income declined -$5 million reflecting seasonal tax services fees earned in 2Q26 • Mortgage banking revenues increased +$25 million reflecting a rise in residential mortgage loan sub-servicing income QoQ Drivers Stable Broad-Based Fee Income and Strong Revenue Diversification
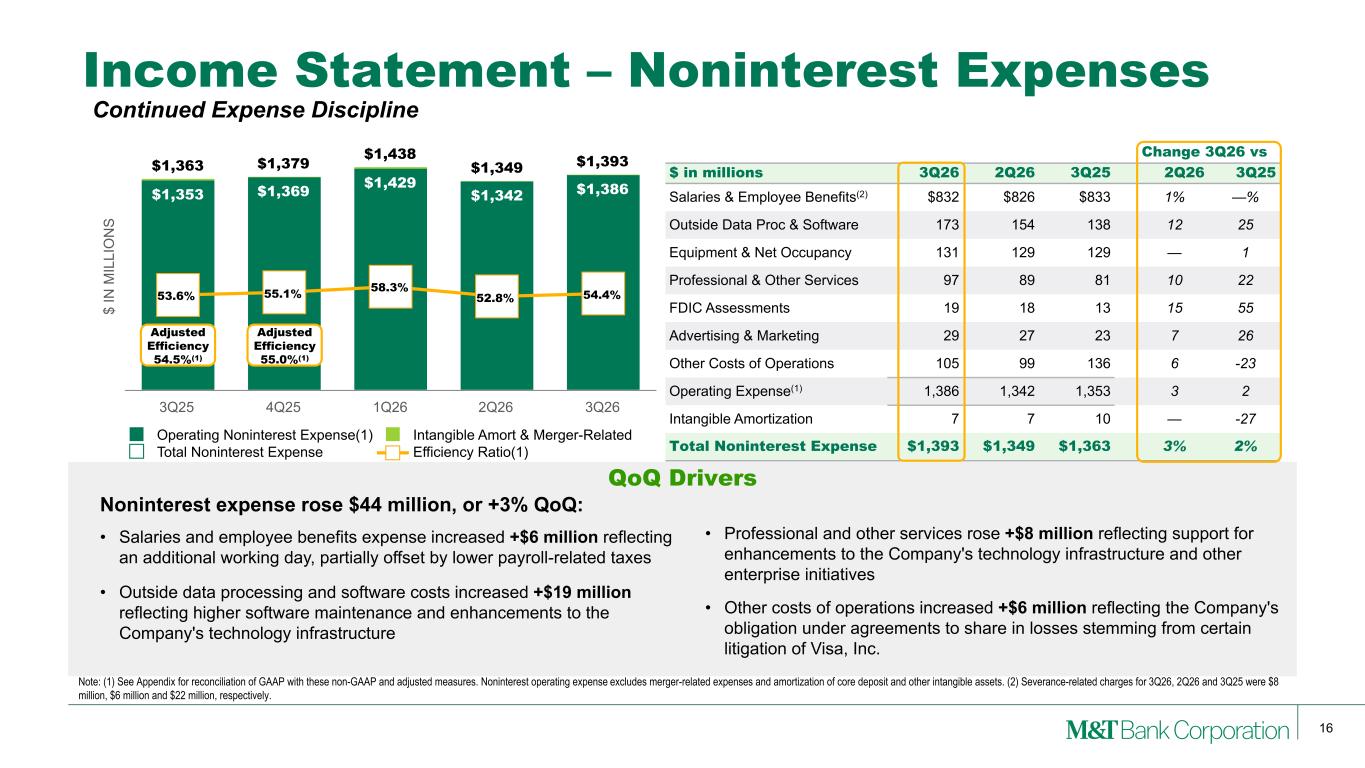
16 $ IN M IL LI O N S $1,353 $1,369 $1,429 $1,342 $1,386 $1,363 $1,379 $1,438 $1,349 $1,393 53.6% 55.1% 58.3% 52.8% 54.4% Operating Noninterest Expense(1) Intangible Amort & Merger-Related Total Noninterest Expense Efficiency Ratio(1) 3Q25 4Q25 1Q26 2Q26 3Q26 Change 3Q26 vs $ in millions 3Q26 2Q26 3Q25 2Q26 3Q25 Salaries & Employee Benefits(2) $832 $826 $833 1% —% Outside Data Proc & Software 173 154 138 12 25 Equipment & Net Occupancy 131 129 129 — 1 Professional & Other Services 97 89 81 10 22 FDIC Assessments 19 18 13 15 55 Advertising & Marketing 29 27 23 7 26 Other Costs of Operations 105 99 136 6 -23 Operating Expense(1) 1,386 1,342 1,353 3 2 Intangible Amortization 7 7 10 — -27 Total Noninterest Expense $1,393 $1,349 $1,363 3% 2% Income Statement – Noninterest Expenses Noninterest expense rose $44 million, or +3% QoQ: • Salaries and employee benefits expense increased +$6 million reflecting an additional working day, partially offset by lower payroll-related taxes • Outside data processing and software costs increased +$19 million reflecting higher software maintenance and enhancements to the Company's technology infrastructure Note: (1) See Appendix for reconciliation of GAAP with these non-GAAP and adjusted measures. Noninterest operating expense excludes merger-related expenses and amortization of core deposit and other intangible assets. (2) Severance-related charges for 3Q26, 2Q26 and 3Q25 were $8 million, $6 million and $22 million, respectively. QoQ Drivers Adjusted Efficiency 54.5%(1) Adjusted Efficiency 55.0%(1) • Professional and other services rose +$8 million reflecting support for enhancements to the Company's technology infrastructure and other enterprise initiatives • Other costs of operations increased +$6 million reflecting the Company's obligation under agreements to share in losses stemming from certain litigation of Visa, Inc. Continued Expense Discipline
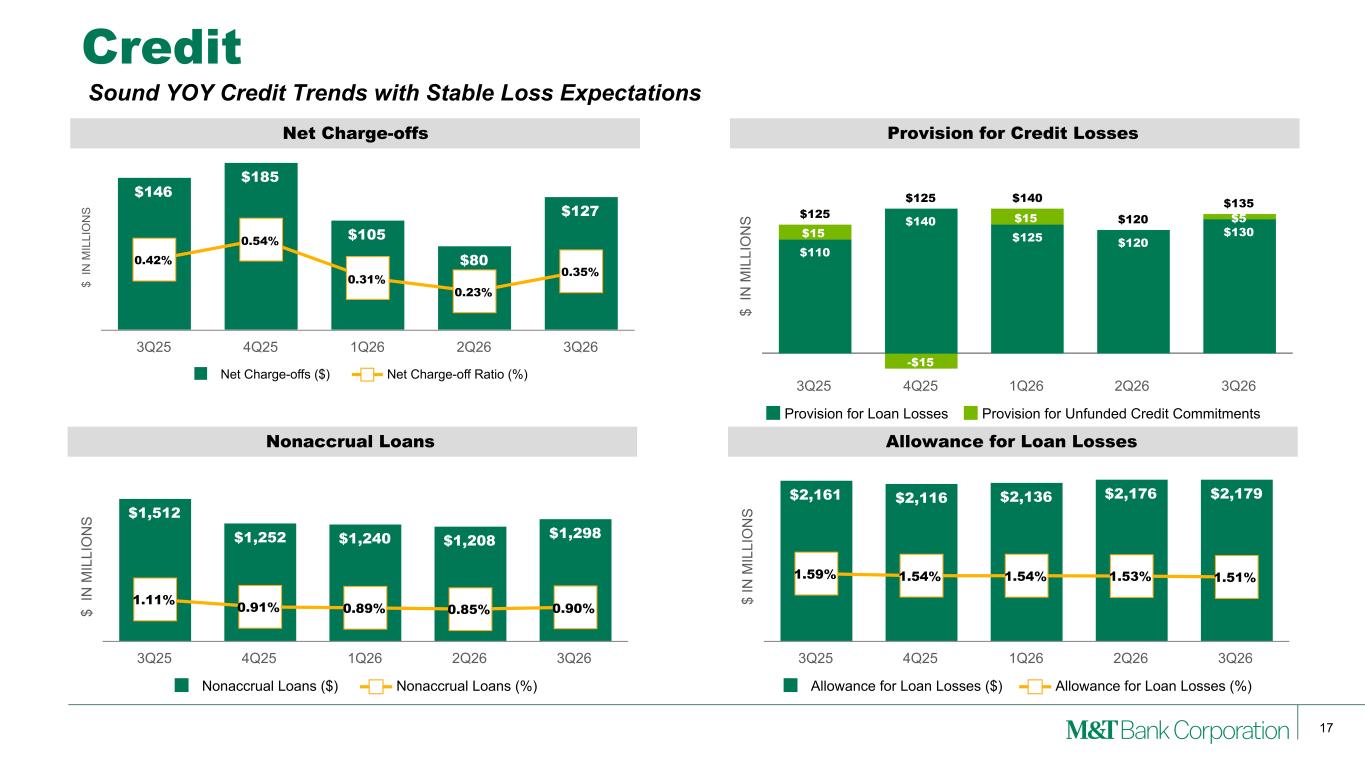
17 $ IN M IL LI O N S Nonaccrual Loans $1,512 $1,252 $1,240 $1,208 $1,298 1.11% 0.91% 0.89% 0.85% 0.90% Nonaccrual Loans ($) Nonaccrual Loans (%) 3Q25 4Q25 1Q26 2Q26 3Q26 $ IN M IL LI O N S Net Charge-offs $146 $185 $105 $80 $127 0.42% 0.54% 0.31% 0.23% 0.35% Net Charge-offs ($) Net Charge-off Ratio (%) 3Q25 4Q25 1Q26 2Q26 3Q26 Credit $ IN M IL LI O N S Allowance for Loan Losses $2,161 $2,116 $2,136 $2,176 $2,179 1.59% 1.54% 1.54% 1.53% 1.51% Allowance for Loan Losses ($) Allowance for Loan Losses (%) 3Q25 4Q25 1Q26 2Q26 3Q26 $ IN M IL LI O N S Provision for Credit Losses $125 $125 $140 $120 $135 $110 $140 $125 $120 $130$15 -$15 $15 $5 Provision for Loan Losses Provision for Unfunded Credit Commitments 3Q25 4Q25 1Q26 2Q26 3Q26 Sound YOY Credit Trends with Stable Loss Expectations
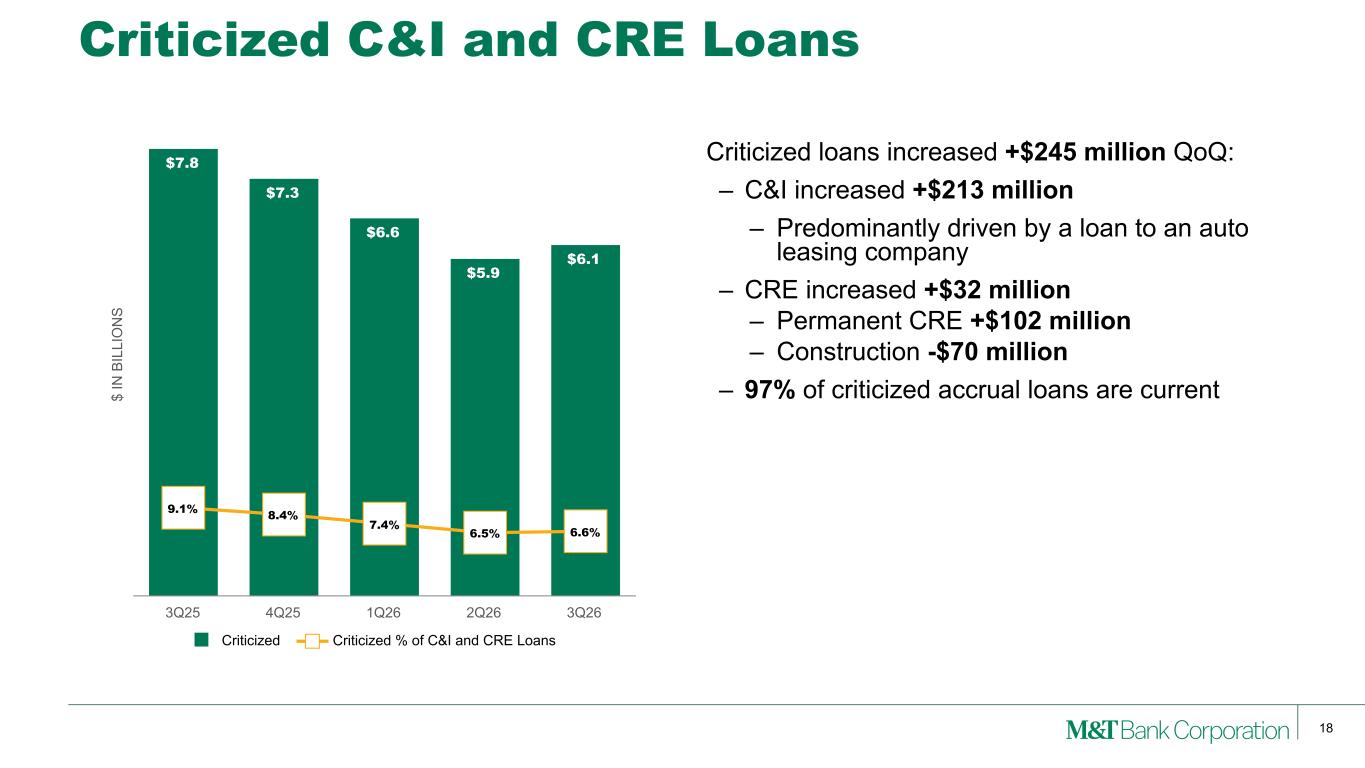
18 Criticized C&I and CRE Loans Criticized loans increased +$245 million QoQ: – C&I increased +$213 million – Predominantly driven by a loan to an auto leasing company – CRE increased +$32 million – Permanent CRE +$102 million – Construction -$70 million – 97% of criticized accrual loans are current$ IN B IL LI O N S $7.8 $7.3 $6.6 $5.9 $6.1 9.1% 8.4% 7.4% 6.5% 6.6% Criticized Criticized % of C&I and CRE Loans 3Q25 4Q25 1Q26 2Q26 3Q26
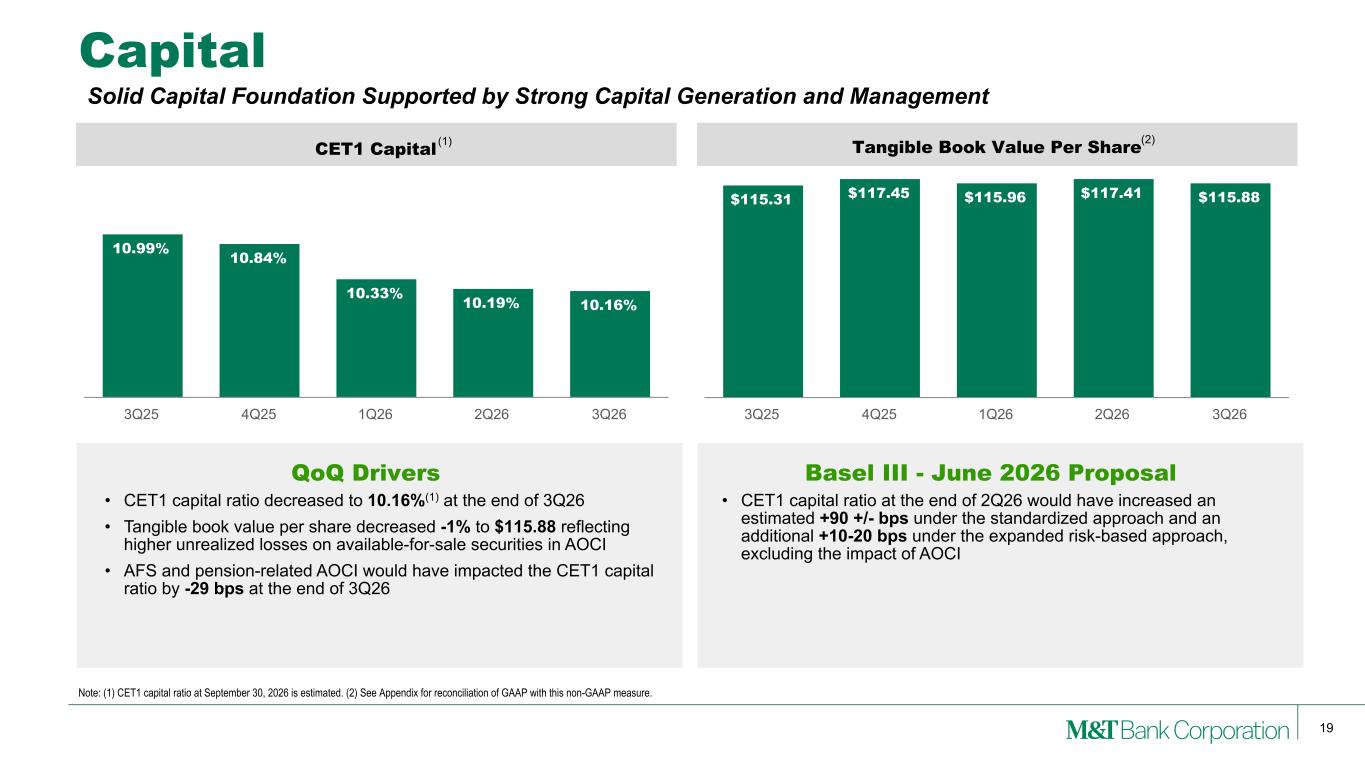
19 CET1 Capital 10.99% 10.84% 10.33% 10.19% 10.16% 3Q25 4Q25 1Q26 2Q26 3Q26 Tangible Book Value Per Share $115.31 $117.45 $115.96 $117.41 $115.88 3Q25 4Q25 1Q26 2Q26 3Q26 Capital • CET1 capital ratio decreased to 10.16%(1) at the end of 3Q26 • Tangible book value per share decreased -1% to $115.88 reflecting higher unrealized losses on available-for-sale securities in AOCI • AFS and pension-related AOCI would have impacted the CET1 capital ratio by -29 bps at the end of 3Q26 Note: (1) CET1 capital ratio at September 30, 2026 is estimated. (2) See Appendix for reconciliation of GAAP with this non-GAAP measure. QoQ Drivers (1) (2) Basel III - June 2026 Proposal • CET1 capital ratio at the end of 2Q26 would have increased an estimated +90 +/- bps under the standardized approach and an additional +10-20 bps under the expanded risk-based approach, excluding the impact of AOCI Solid Capital Foundation Supported by Strong Capital Generation and Management
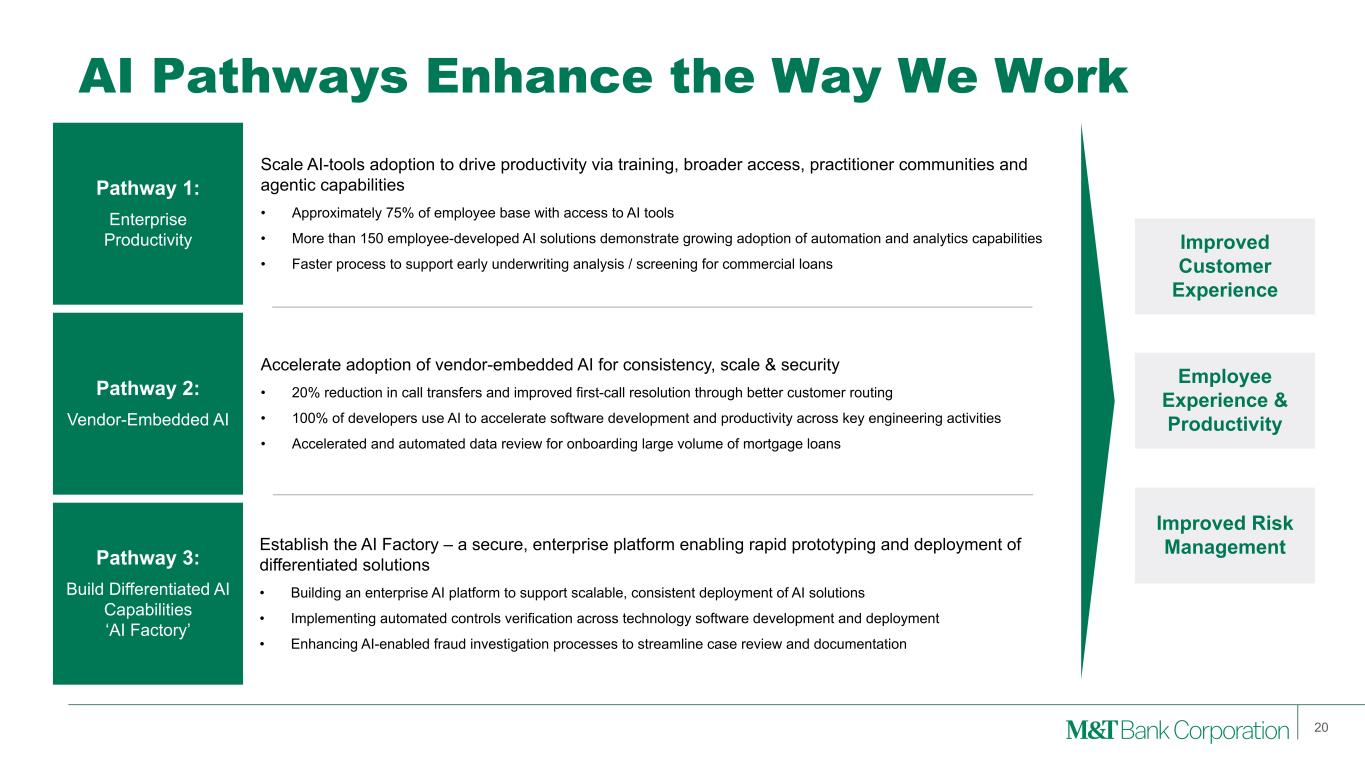
AI Pathways Enhance the Way We Work 20 Pathway 1: Enterprise Productivity Pathway 2: Vendor-Embedded AI Pathway 3: Build Differentiated AI Capabilities ‘AI Factory’ Scale AI-tools adoption to drive productivity via training, broader access, practitioner communities and agentic capabilities • Approximately 75% of employee base with access to AI tools • More than 150 employee-developed AI solutions demonstrate growing adoption of automation and analytics capabilities • Faster process to support early underwriting analysis / screening for commercial loans Accelerate adoption of vendor-embedded AI for consistency, scale & security • 20% reduction in call transfers and improved first-call resolution through better customer routing • 100% of developers use AI to accelerate software development and productivity across key engineering activities • Accelerated and automated data review for onboarding large volume of mortgage loans Establish the AI Factory – a secure, enterprise platform enabling rapid prototyping and deployment of differentiated solutions • Building an enterprise AI platform to support scalable, consistent deployment of AI solutions • Implementing automated controls verification across technology software development and deployment • Enhancing AI-enabled fraud investigation processes to streamline case review and documentation Improved Customer Experience Employee Experience & Productivity Improved Risk Management
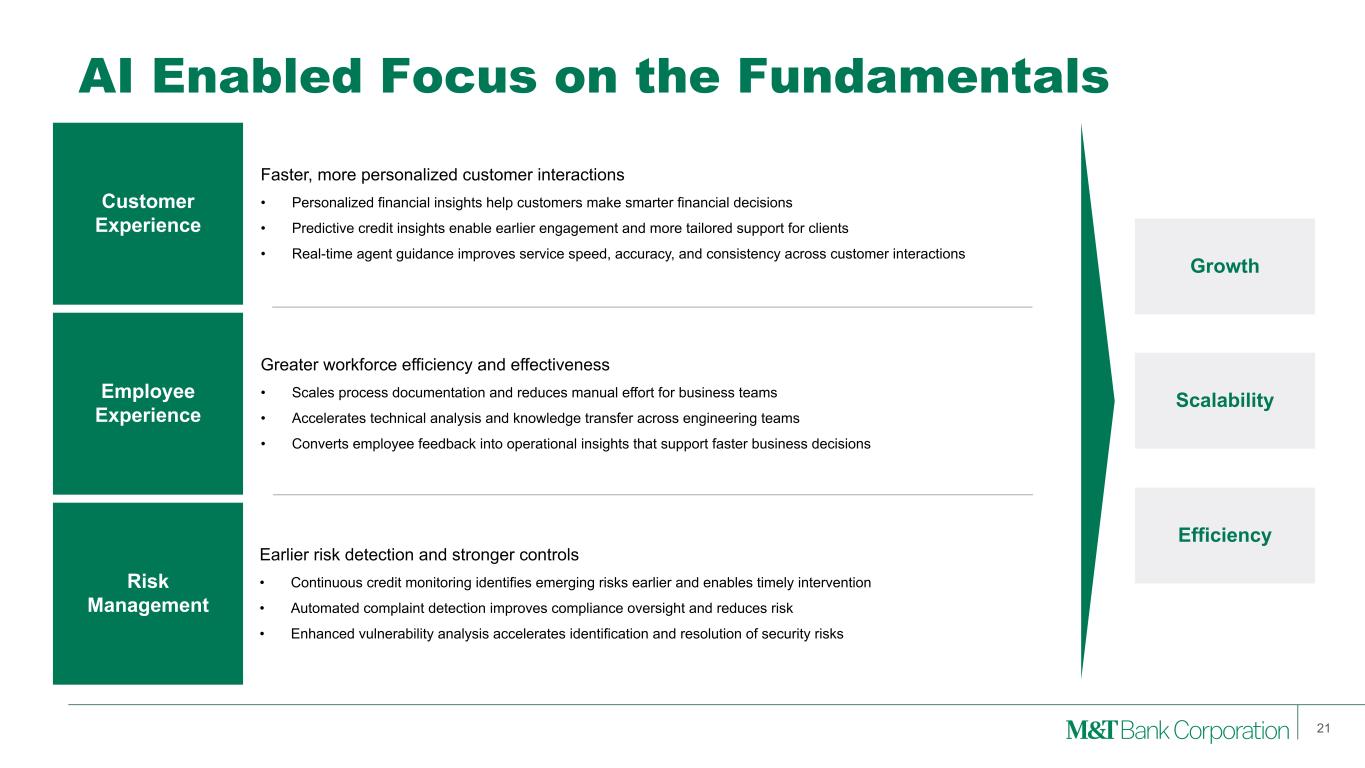
AI Enabled Focus on the Fundamentals 21 21 Customer Experience Employee Experience Risk Management Faster, more personalized customer interactions • Personalized financial insights help customers make smarter financial decisions • Predictive credit insights enable earlier engagement and more tailored support for clients • Real-time agent guidance improves service speed, accuracy, and consistency across customer interactions Greater workforce efficiency and effectiveness • Scales process documentation and reduces manual effort for business teams • Accelerates technical analysis and knowledge transfer across engineering teams • Converts employee feedback into operational insights that support faster business decisions Earlier risk detection and stronger controls • Continuous credit monitoring identifies emerging risks earlier and enables timely intervention • Automated complaint detection improves compliance oversight and reduces risk • Enhanced vulnerability analysis accelerates identification and resolution of security risks Growth Scalability Efficiency

22 4Q26 Outlook 4Q26 Outlook Comments In co m e St at em en t Net Interest Income Taxable-equivalent $1.83 to $1.85 billion • 4Q NIM in the mid-3.60's • Reflects one additional rate increase in 4Q Fee Income $710 to $730 million • Stable to modest growth in most fee income categories GAAP Expense Includes intangible amortization $1.39 to $1.41 billion • Continued investment in enterprise initiatives and well-managed non-investment spend Net Charge-Offs % of Average Loans 35 to 40 basis points Tax Rate Taxable-equivalent 24.0% +/- A ve ra ge B al an ce s Loans (including loans HFS) $145 to $146 billion • Growth in C&I, CRE and Consumer loans Deposits $169 to $170 billion • Focus on growing operational accounts and other customer deposits at a reasonable cost CET1 Capital Ratio 10.0% to 10.25%

23 Why invest in M&T? • Long term focused with deeply embedded culture • Business operated to represent the best interests of all key stakeholders • Energized colleagues consistently serving our customers and communities • A safe haven for our clients as proven during turbulent times and crisis • Experienced and seasoned management team • Strong risk controls with long track record of credit outperformance through cycles • Leading position in core markets • 15-17% ROTCE(1) • Robust dividend growth • 8% TBV per share growth(2) Source: FactSet, S&P Global, Company Filings. Note: (1) ROTCE range comprises 5 years of the trailing 3-year ROTCE from 2020-2025, consistent with M&T's measurement of ROTCE for performance-based stock compensation. (2) TBV per share growth represents CAGR from 2020-2025. Purpose-Driven Successful and Sustainable Business Model that Produces Strong Shareholder Returns Purpose Driven Organization Successful and Sustainable Business Model Strong Shareholder Returns

24 Appendix

25 M&T consistently provides supplemental reporting of its results on a “net operating” or “tangible” basis, from which M&T excludes the after-tax effect of amortization of core deposit and other intangible assets (and the related goodwill, core deposit and other intangible asset balances, net of applicable deferred tax amounts) and gains (when realized) and expenses (when incurred) associated with merging acquired operations into M&T, since such items are considered by management to be “nonoperating” in nature. Although “net operating income” as defined by M&T is not a GAAP measure, M&T’s management believes that this information helps investors understand the effect of acquisition activity in reported results. Appendix Note: (1) After any related tax effect. GAAP to Net Operating (Non-GAAP) Reconciliation In millions, except per share 3Q25 4Q25 1Q26 2Q26 3Q26 Net income Net income $792 $759 $664 $818 $775 Amortization of core deposits and other intangible assets (1) 6 8 7 5 5 Net operating income $798 $767 $671 $823 $780 Earnings per common share Diluted earnings per common share $4.82 $4.67 $4.13 $5.32 $5.04 Amortization of core deposits and other intangible assets (1) 0.05 0.05 0.05 0.03 0.04 Diluted net operating earnings per common share $4.87 $4.72 $4.18 $5.35 $5.08
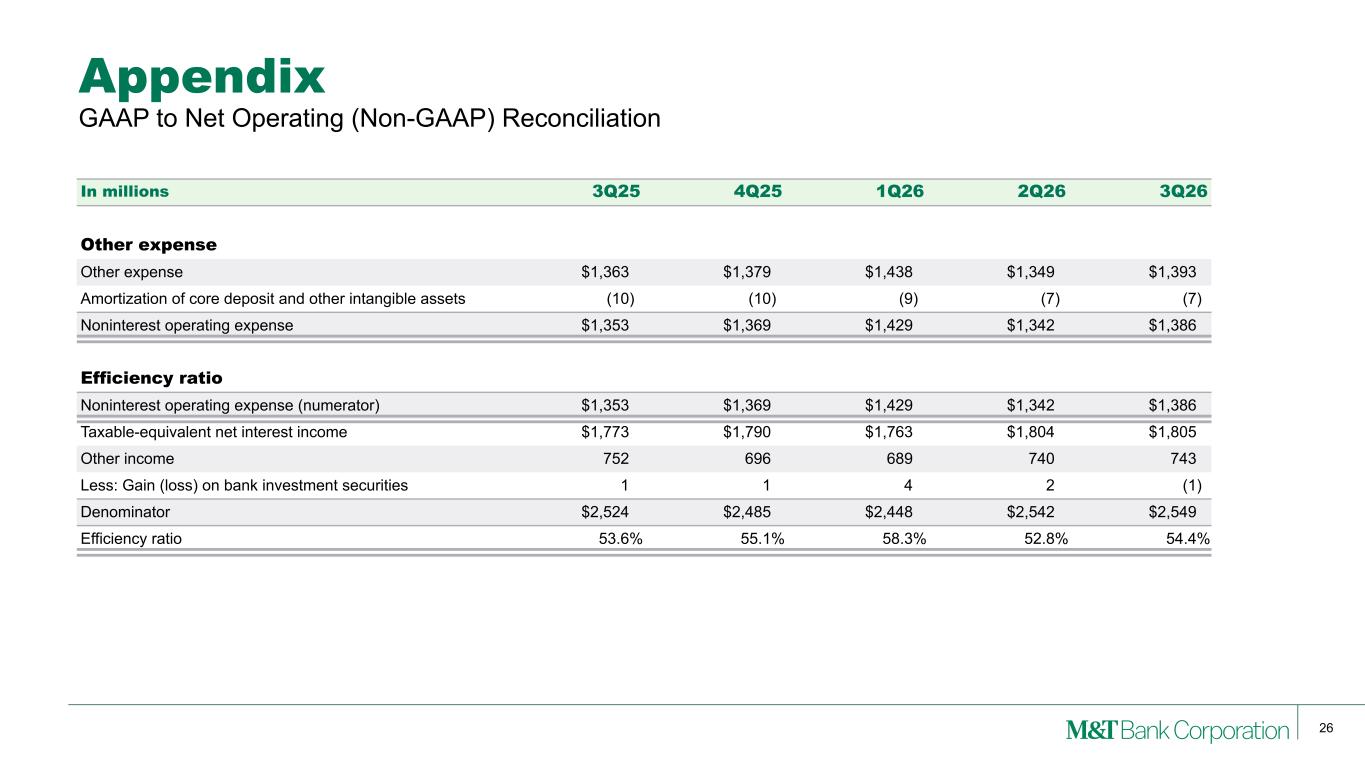
26 Appendix GAAP to Net Operating (Non-GAAP) Reconciliation In millions 3Q25 4Q25 1Q26 2Q26 3Q26 Other expense Other expense $1,363 $1,379 $1,438 $1,349 $1,393 Amortization of core deposit and other intangible assets (10) (10) (9) (7) (7) Noninterest operating expense $1,353 $1,369 $1,429 $1,342 $1,386 Efficiency ratio Noninterest operating expense (numerator) $1,353 $1,369 $1,429 $1,342 $1,386 Taxable-equivalent net interest income $1,773 $1,790 $1,763 $1,804 $1,805 Other income 752 696 689 740 743 Less: Gain (loss) on bank investment securities 1 1 4 2 (1) Denominator $2,524 $2,485 $2,448 $2,542 $2,549 Efficiency ratio 53.6 % 55.1 % 58.3 % 52.8 % 54.4 %

27 Appendix In millions 3Q25 4Q25 1Q26 2Q26 3Q26 Average assets Average assets $211,053 $212,891 $213,828 $216,532 $218,860 Goodwill (8,465) (8,465) (8,465) (8,465) (8,465) Core deposit and other intangible assets (79) (69) (59) (51) (45) Deferred taxes 24 22 19 17 17 Average tangible assets $202,533 $204,379 $205,323 $208,033 $210,367 Average common equity Average total equity $28,583 $28,970 $28,648 $27,939 $28,331 Preferred stock (2,394) (2,691) (2,576) (2,434) (2,890) Average common equity 26,189 26,279 26,072 25,505 25,441 Goodwill (8,465) (8,465) (8,465) (8,465) (8,465) Core deposit and other intangible assets (79) (69) (59) (51) (45) Deferred taxes 24 22 19 17 17 Average tangible common equity $17,669 $17,767 $17,567 $17,006 $16,948 GAAP to Tangible (Non-GAAP) Reconciliation
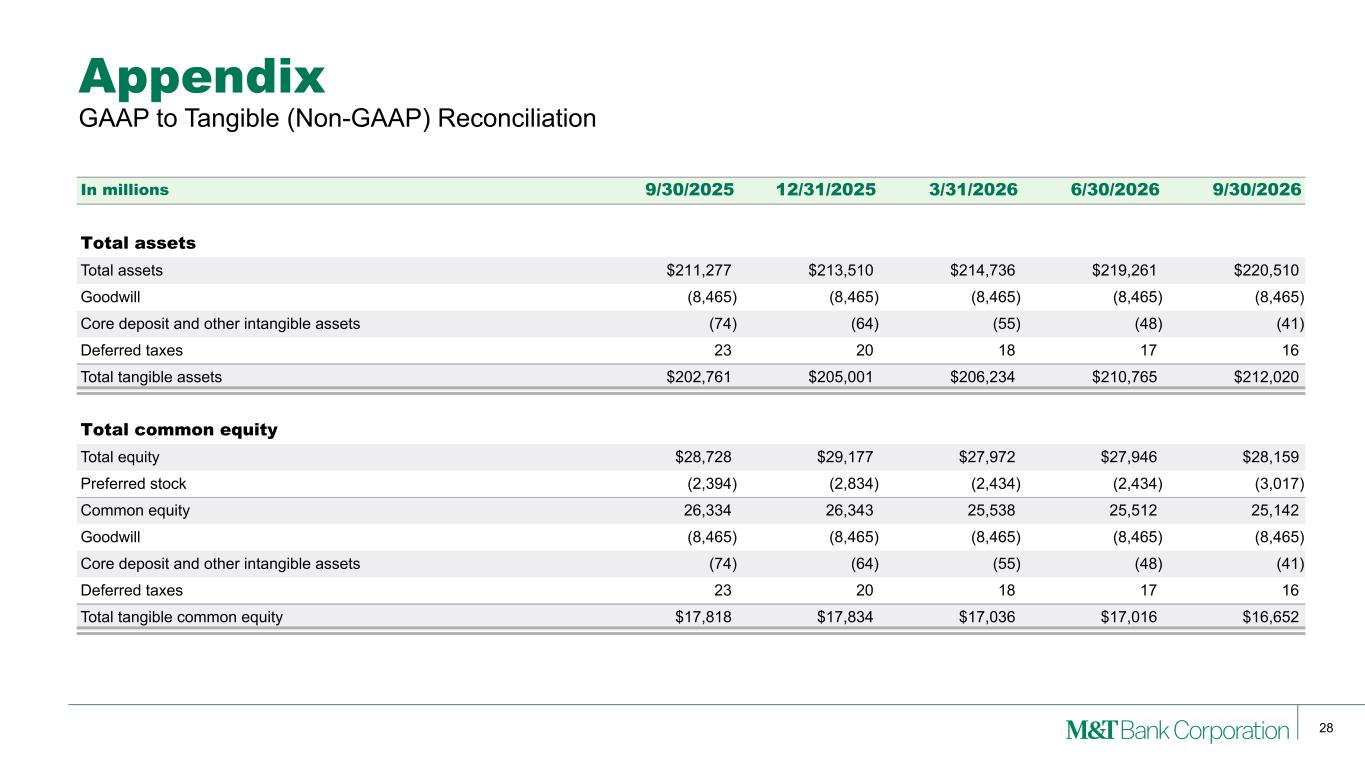
28 Appendix In millions 9/30/2025 12/31/2025 3/31/2026 6/30/2026 9/30/2026 Total assets Total assets $211,277 $213,510 $214,736 $219,261 $220,510 Goodwill (8,465) (8,465) (8,465) (8,465) (8,465) Core deposit and other intangible assets (74) (64) (55) (48) (41) Deferred taxes 23 20 18 17 16 Total tangible assets $202,761 $205,001 $206,234 $210,765 $212,020 Total common equity Total equity $28,728 $29,177 $27,972 $27,946 $28,159 Preferred stock (2,394) (2,834) (2,434) (2,434) (3,017) Common equity 26,334 26,343 25,538 25,512 25,142 Goodwill (8,465) (8,465) (8,465) (8,465) (8,465) Core deposit and other intangible assets (74) (64) (55) (48) (41) Deferred taxes 23 20 18 17 16 Total tangible common equity $17,818 $17,834 $17,036 $17,016 $16,652 GAAP to Tangible (Non-GAAP) Reconciliation

29 Appendix Reconciliation of Adjusted Metrics In millions 3Q25 4Q25 1Q26 2Q26 3Q26 Other income - Adjusted Other income $752 $696 Earnout payment related to 2023 sale of CIT business (28) — Other income - Adjusted $724 $696 Noninterest operating expense - Adjusted Noninterest operating expense $1,353 $1,369 Charitable contribution — (30) FDIC Special Assessment 8 29 Noninterest operating expense - Adjusted $1,361 $1,368 Efficiency ratio - Adjusted Noninterest operating expense (numerator) - Adjusted $1,361 $1,368 Taxable-equivalent net interest income - Adjusted 1,773 1,790 Other income - Adjusted 724 696 Less: Gain (loss) on bank investment securities — 1 Denominator $2,497 $2,485 Efficiency ratio - Adjusted 54.5% 55.0%