Operator
Good day and thank you for standing by. Welcome to the Alpine Q1-2026 earnings call. At this time, all participants are in a listen-only mode. After the speaker's presentation, there will be a question and answer session. To ask a question during this session, you will need to press star 11 on your telephone and wait for your name to be announced. To withdraw your question, please press star 11 again. Please be advised that today's conference is being recorded. I would now like to hand the conference over to your first speaker today, Jenna McKinney, Director of Finance. Please go ahead.
Thank you. Joining me and participating on the call this morning are John Albright, President and Chief Executive Officer, Philip Mays, Chief Financial Officer, and other members of the executive team who will be available to answer questions during the call. As a reminder, many of our comments today are considered forward-looking statements under federal securities laws. The company's actual future results may differ significantly from the matters discussed in these forward-looking statements, and we undertake no duty to update these statements. Factors and risks that could cause actual results to differ materially from expectations are disclosed from time to time in greater detail in the company's Form 10-K, Form 10-Q, and other SEC filings. You can find our SEC reports, earnings release, and most recent investor presentation, which contain reconciliations of the non-GAAP financial measures we use, on our website at www.alpinereit.com. With that, I will turn the call over to John.
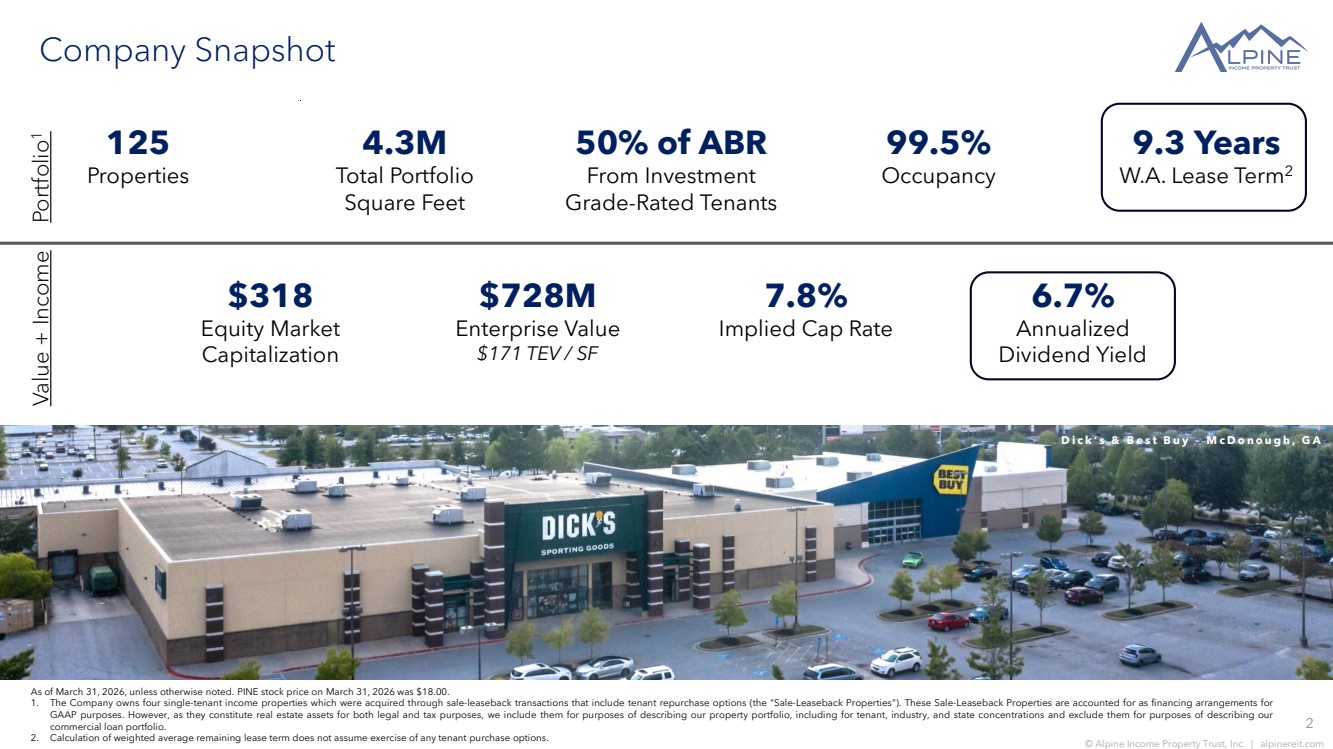
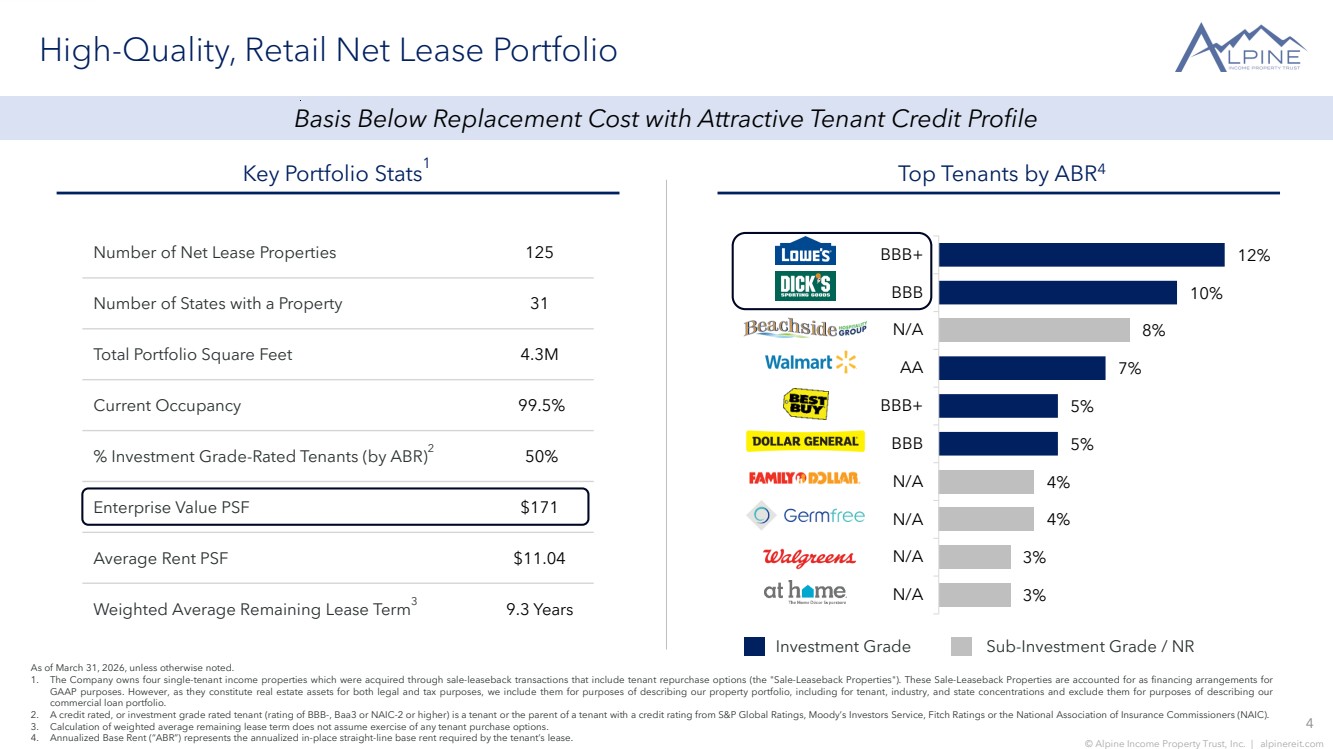
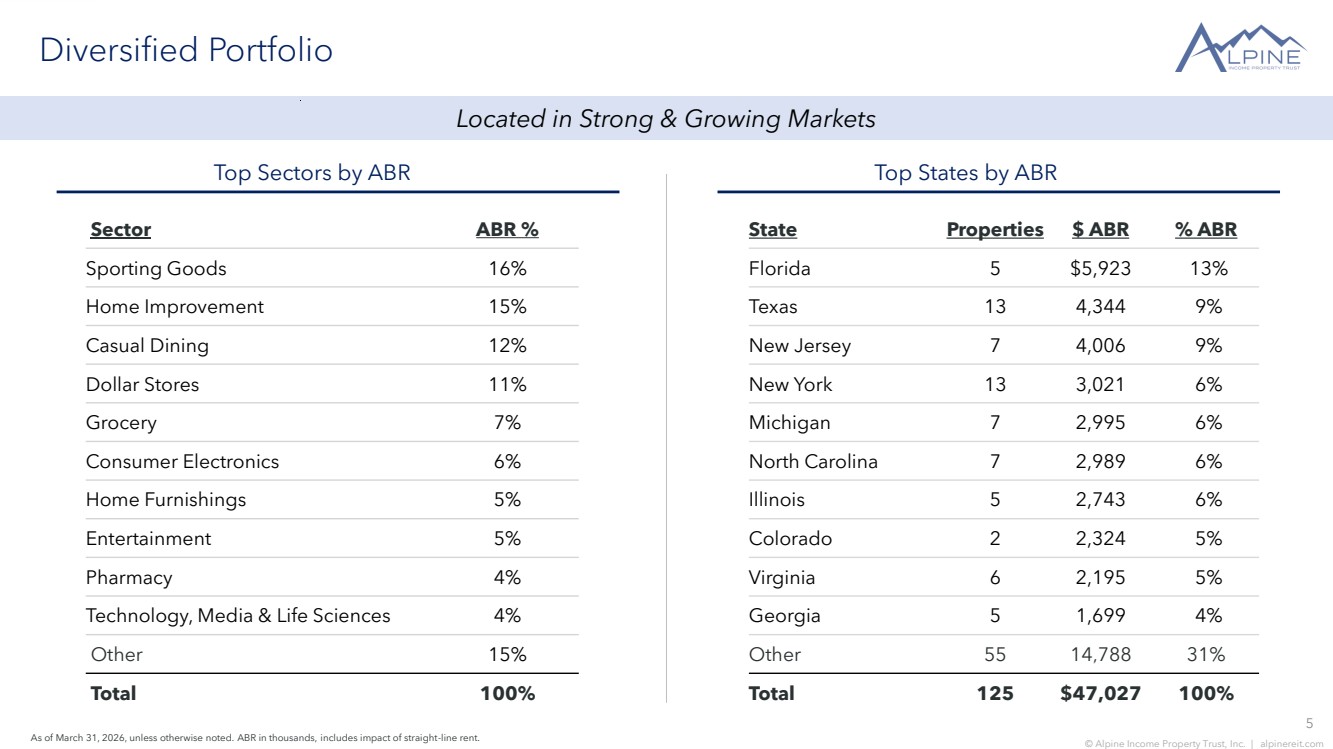
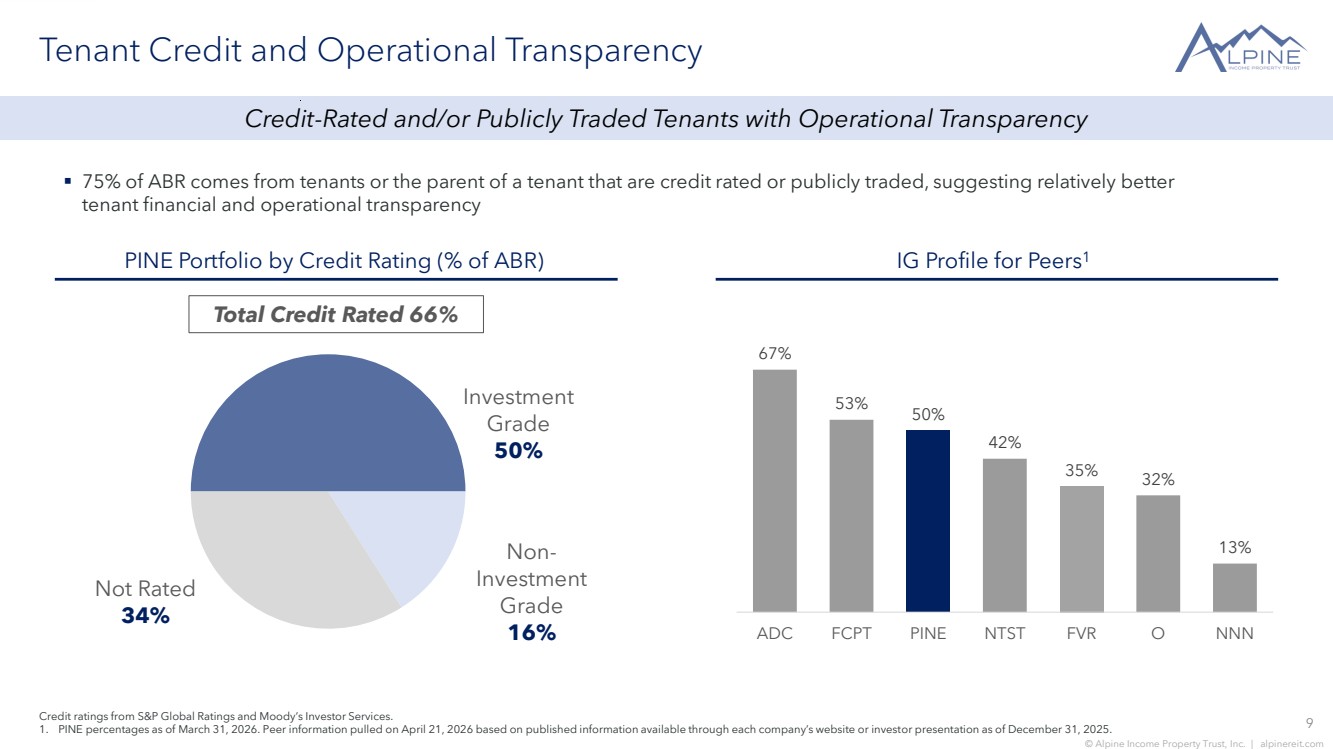
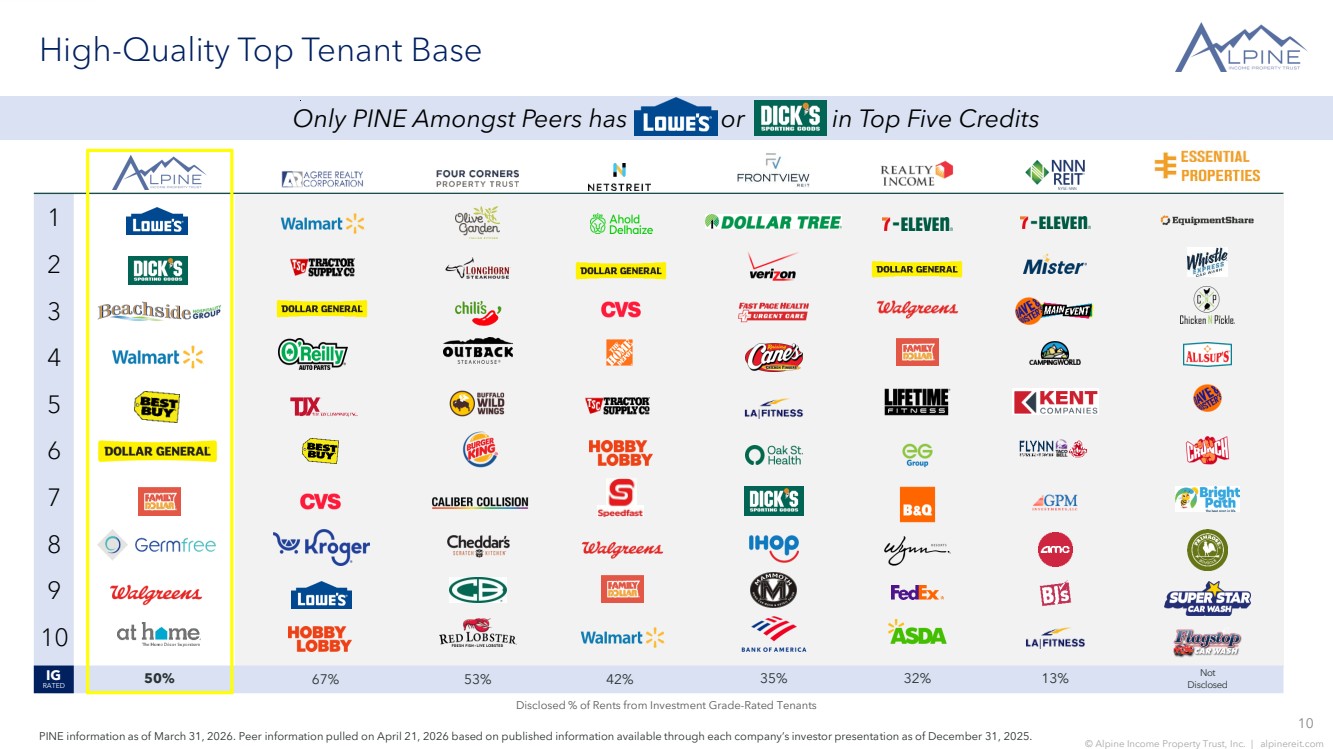
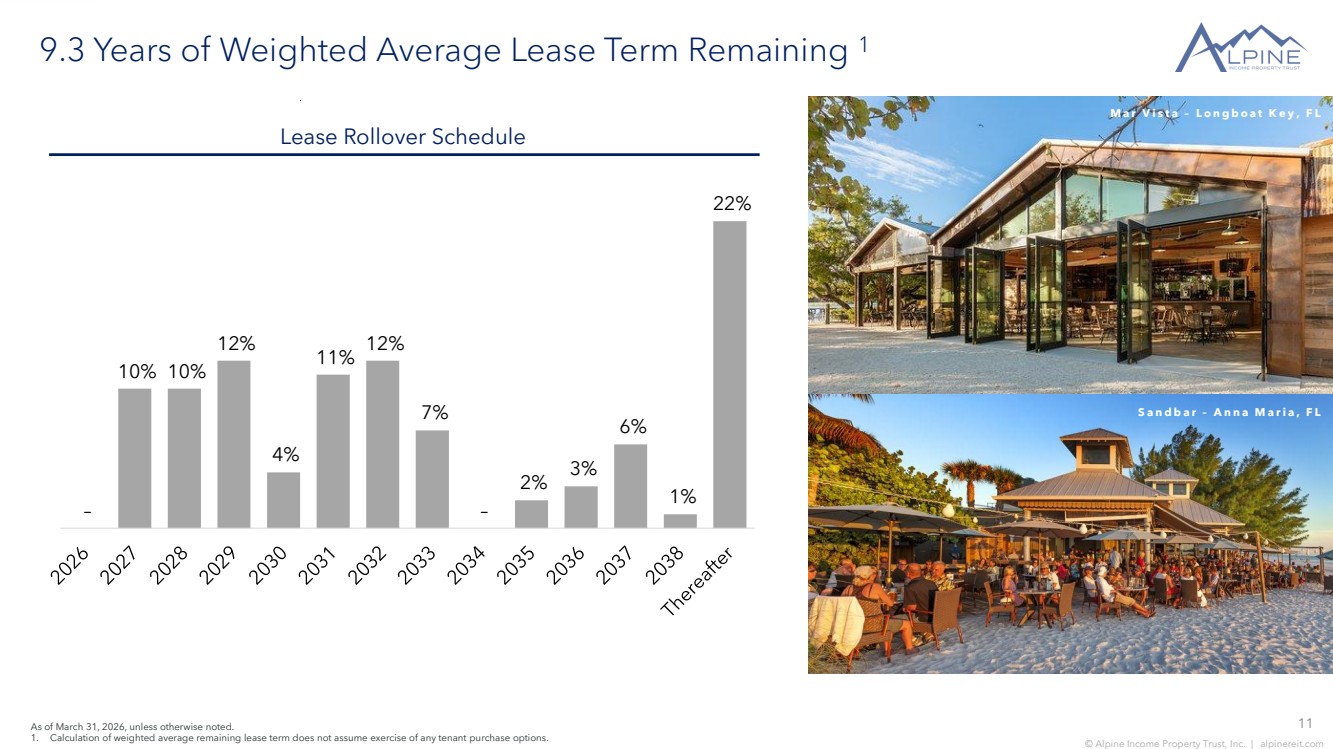
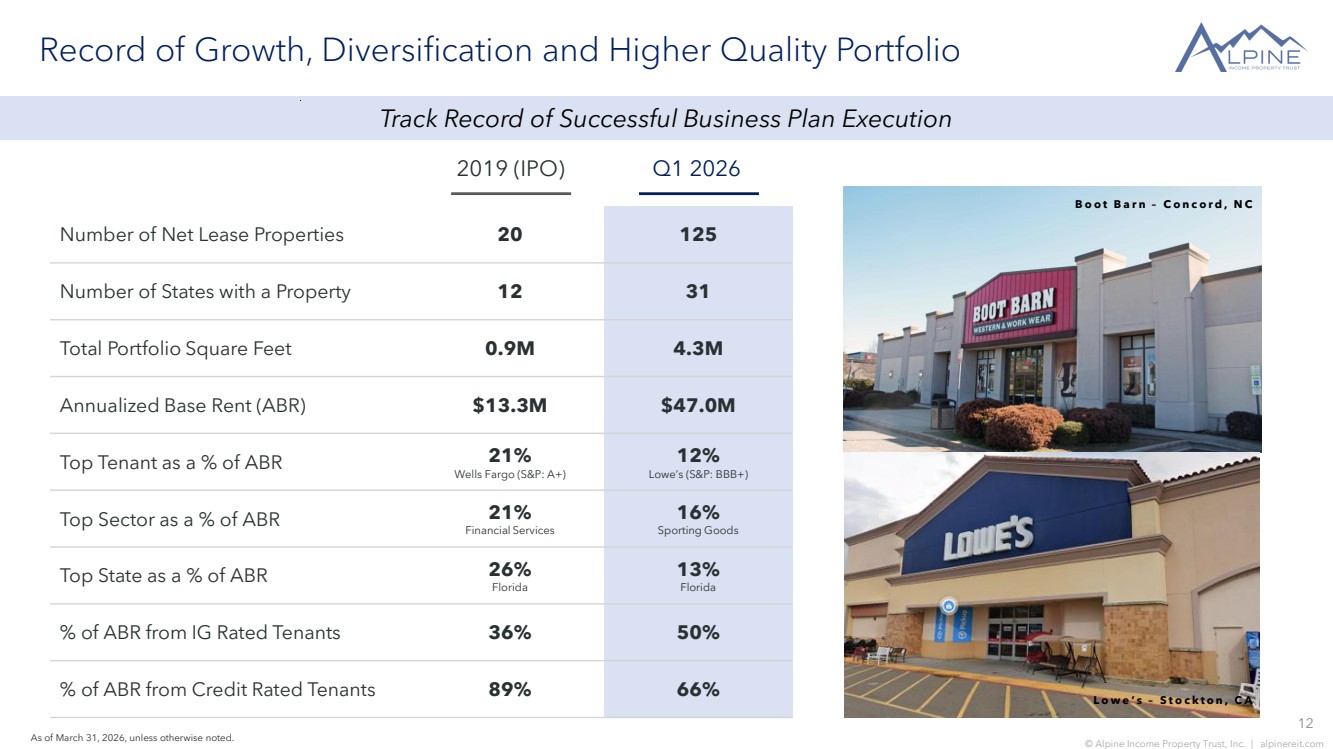
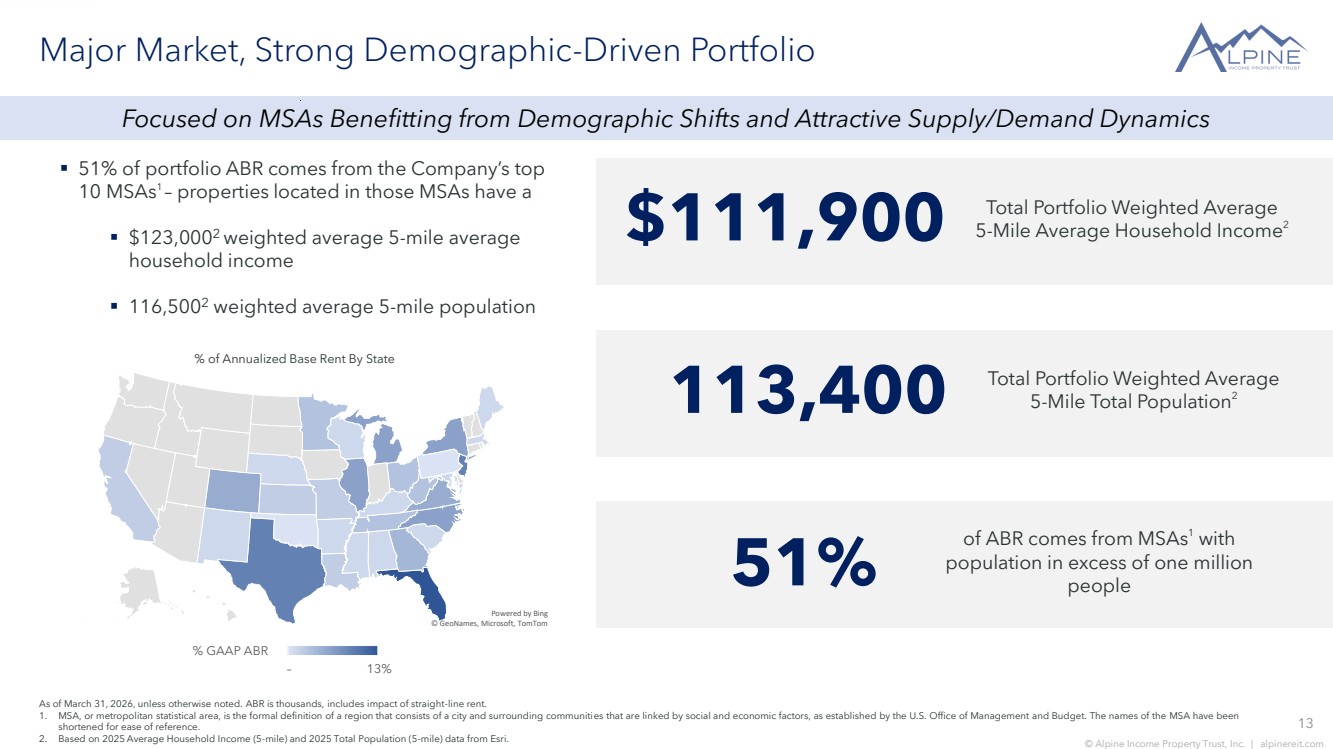
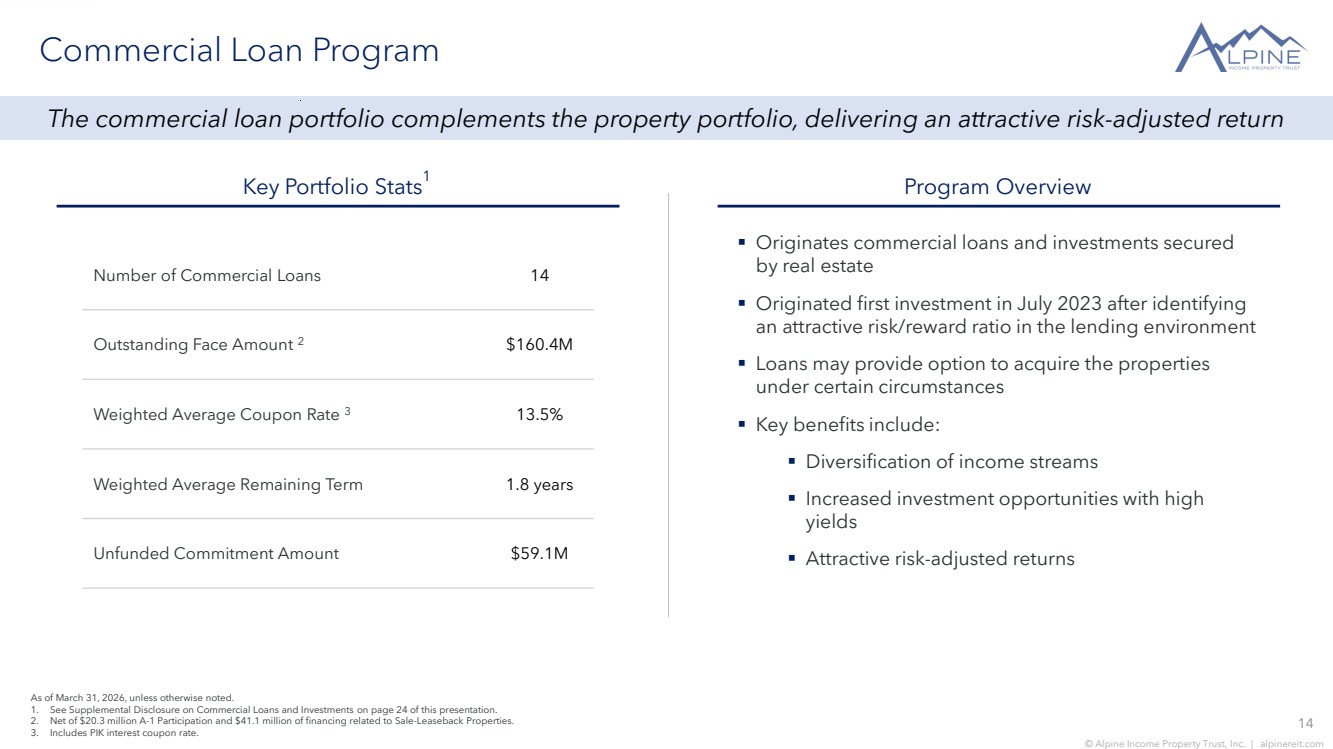
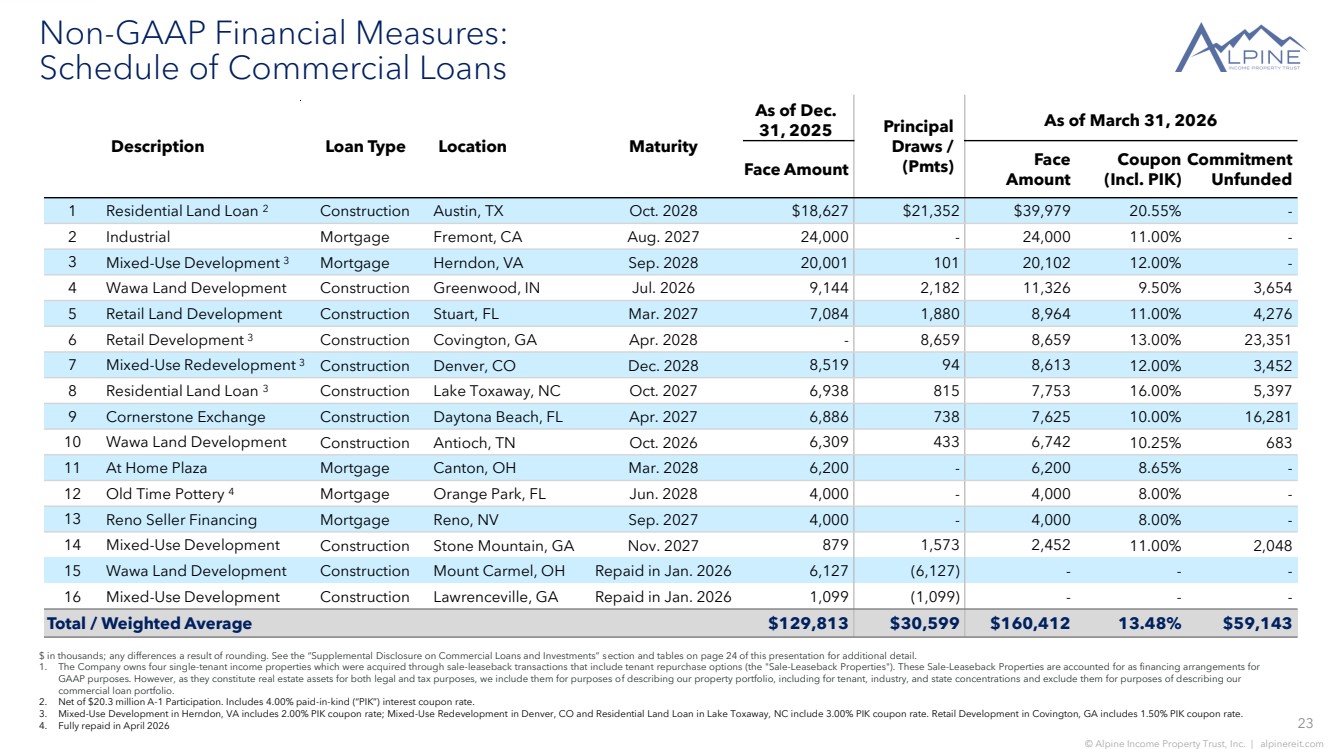
Thank you, Jenna, and good morning, everyone. We are pleased to report a strong first quarter in 2026 building on a record level of investment activity we achieved in 2025 we continue to execute our investment strategy by seeking to assemble a high quality portfolio of single tenant net lease properties leads to investment grade rated tenants in addition to originating commercial loans with attractive risk adjusted returns secured by high quality real estate with strong experienced sponsors during the quarter we acquired a retail property in downtown aspen colorado for 10 million dollars this acquisition was structured as a 50-year absolute triple net master lease and initial cap rate of eight and a half percent with one and a quarter percent annual rent escalators with regards to the property dispositions we continue to selectively prune our portfolio selling three non-investment grade rated lease properties for 5.8 million dollars and a weighted average exit cap of 7.4 percent as a result of our combined first quarter property transactions our property portfolio consists of 125 properties totaling 4.3 million square feet across 31 states with a 99.5 percent occupancy in a waltz of 9.3 years 50 percent of our ABR is generated from investment grade rated tenants with Lowe's to exporting goods walmart and best buy representing four of our top five tenants additionally during the quarter we originated a 32 million dollar first mortgage loan of which 8.6 million was funded at close the loan carries a 24-month term with an initial interest rate of 13 percent inclusive of a 1.5% paid-in-kind interest, stepping down to an 11.5% current pay rate upon the borrower meeting certain conditions. The loan will fund the development of a 101,000-square-foot retail center with national investment-grade rated tenants and three out parcels. The retail center is located in the Atlanta MSA, is shadow anchored by 128,500 square foot target, currently in development, and is adjacent to an existing Publix, creating a strong and varied merchandising mix. Further, with regards to our commercial loan portfolio, we closed and funded the $31.8 million phase two of our first mortgage loan investment secured by a luxury residential development located in Austin Texas metropolitan area the a1 participation that was previously announced contributed an additional 10.8 million dollars towards this funding accordingly net of the a1 participation our combined investment in phase 1 and phase 2 of this loan was 40 million dollars at quarter end reflecting this quarter's loan activity including two loan repayments totaling 7.2 million in January, our commercial loan portfolio totaled $160.4 million with a weighted average current yield, including PIC interest of 13.5% at quarter end. We have sought to originate loan investments that complement our property portfolio and increase the overall yield earned on our total assets. Notably, our loan portfolio has now grown to our targeted level of approximately 20% of our total undepreciated asset value. However, as noted previously, timing of funding and repayments of loan investments may cause the relative size of the loan portfolio to vary quarter to quarter. Looking forward, we have a highly attractive pipeline of investment opportunities, including high-quality properties, net lease, investment-grade tenants, and attractive loan opportunities. Given this robust pipeline and our recently completed investment activity, We utilize both our common and preferred ATM programs this quarter, raising a combined $36.2 million of equity. Furthermore, we are raising our 2026 outlook for investment volume by $100 million and increasing guidance for FFO and FFO per diluted share to new ranges that imply approximately 12% growth at the midpoints. And with that, I'll turn the call over to Phil.
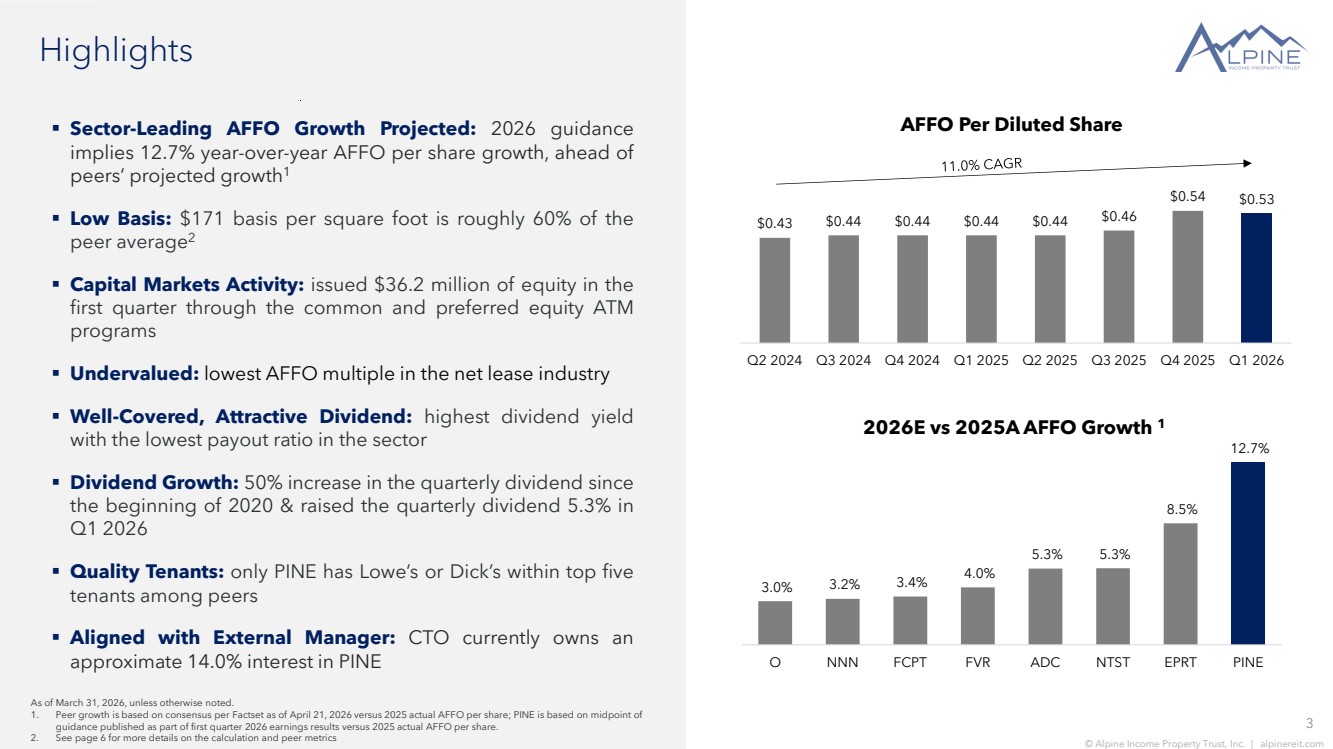
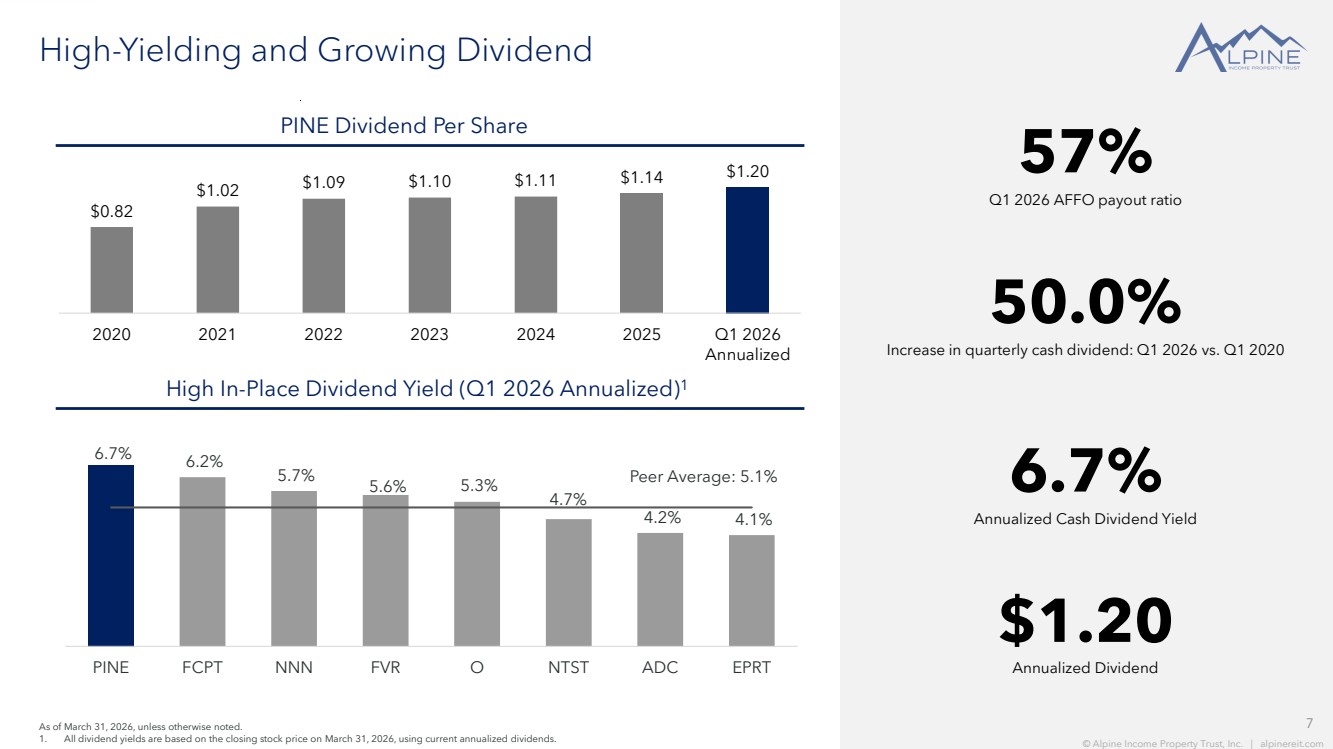
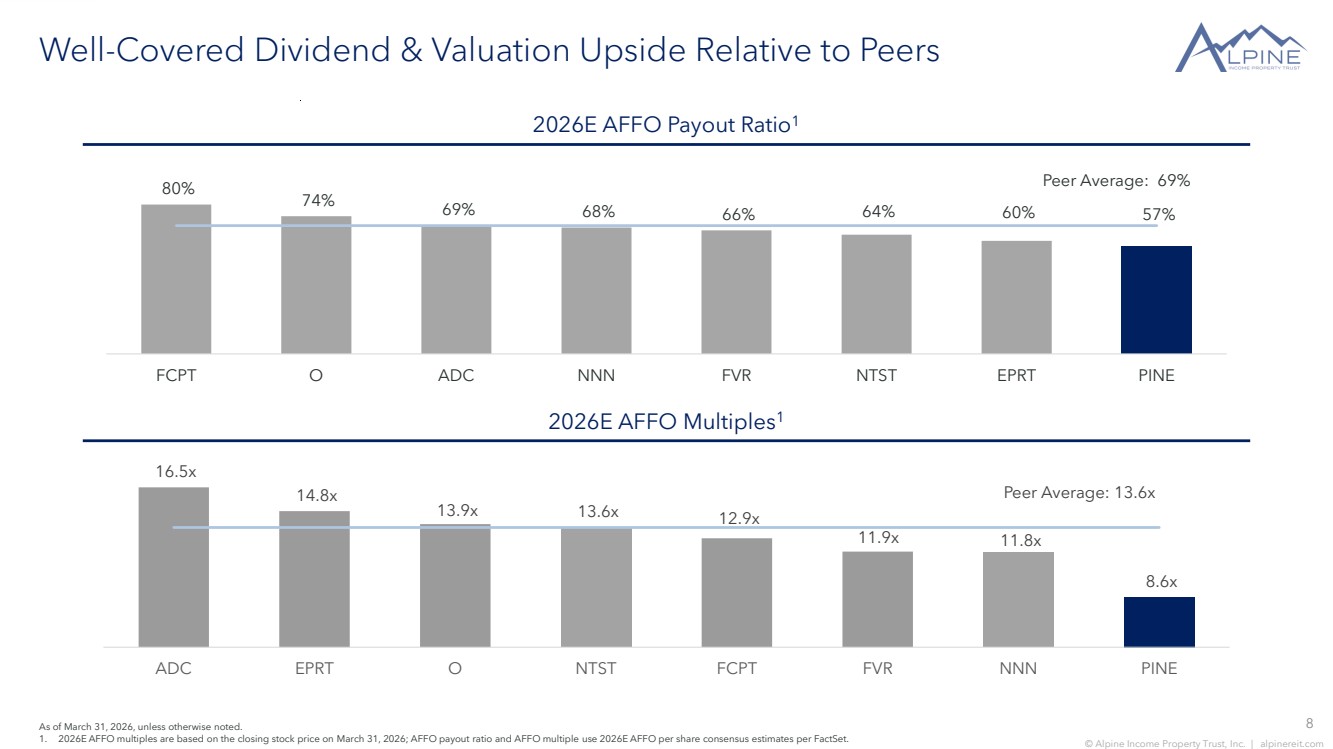
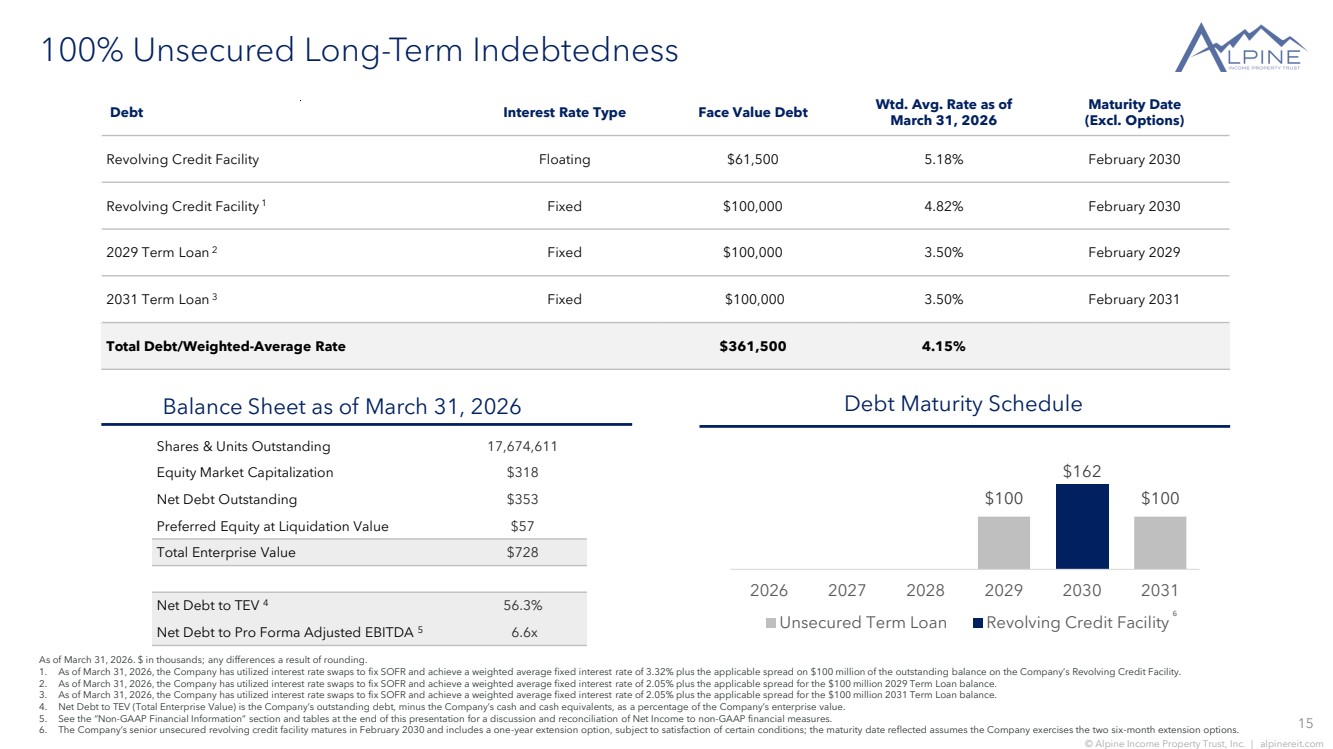
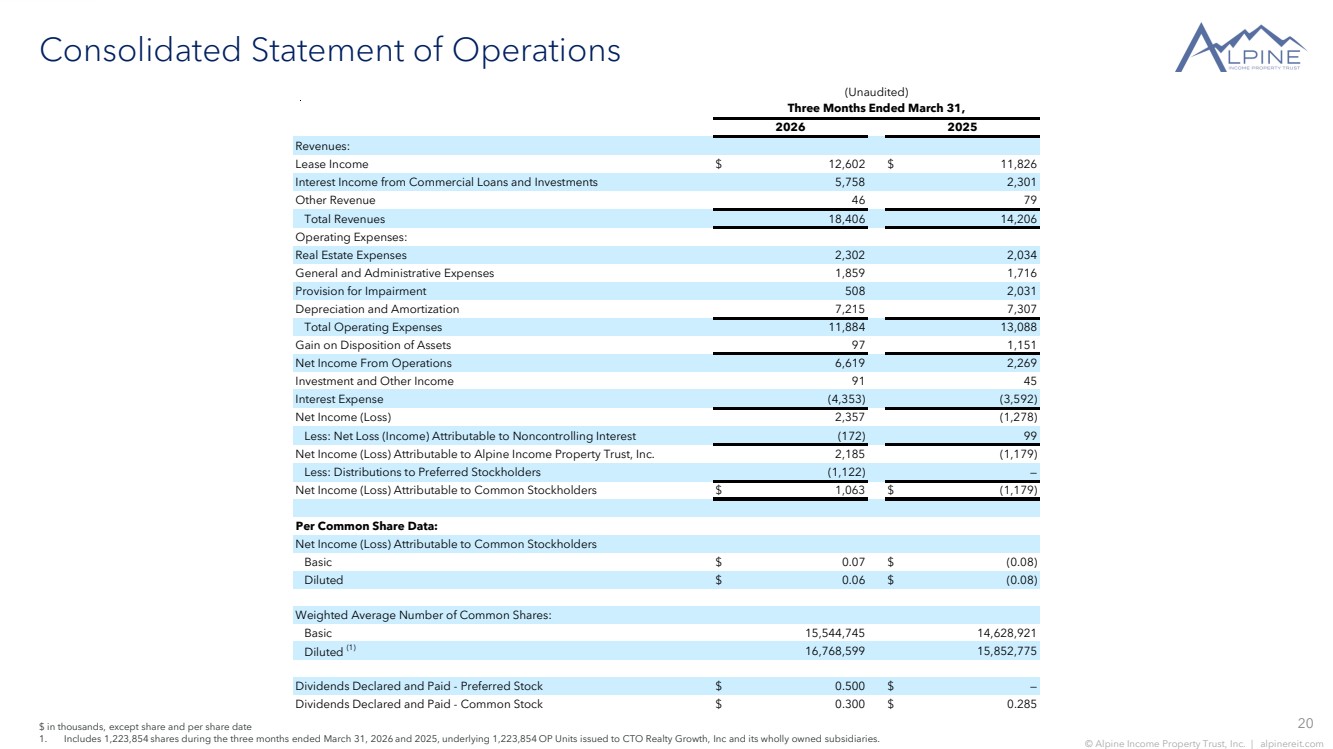
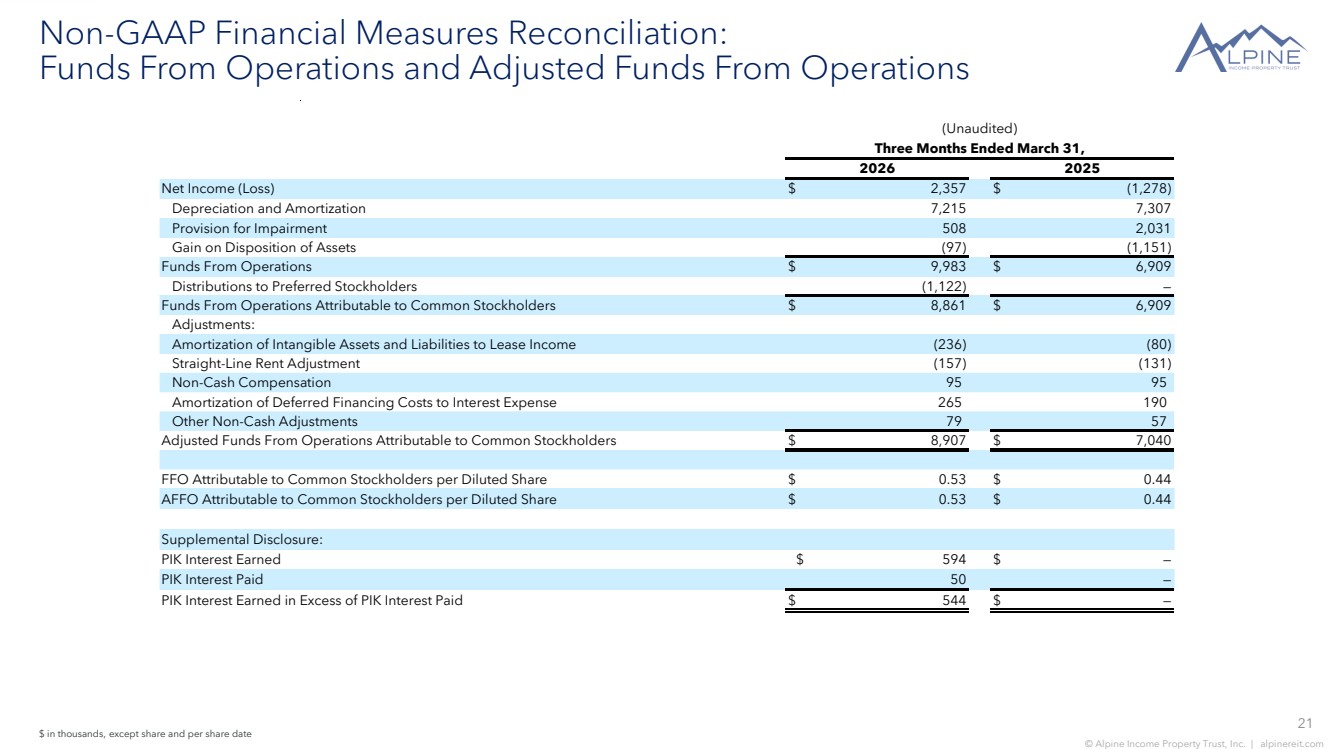
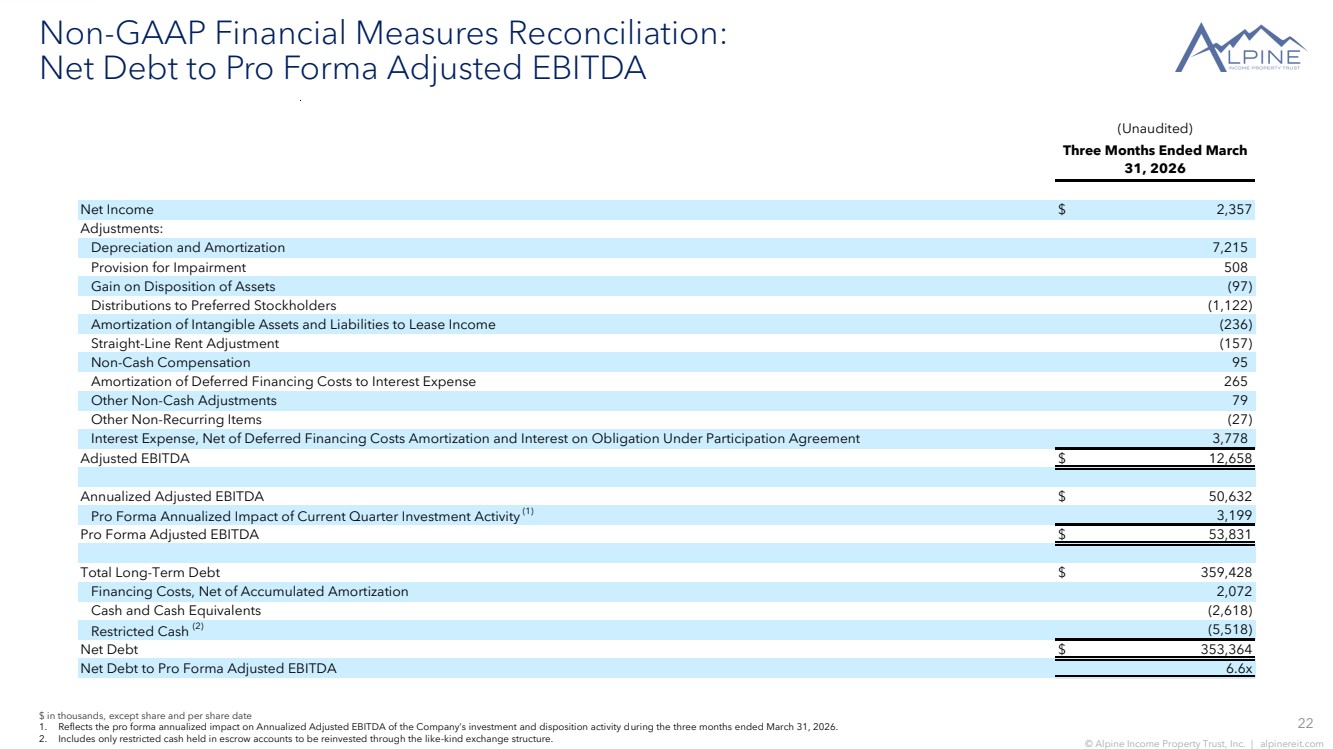
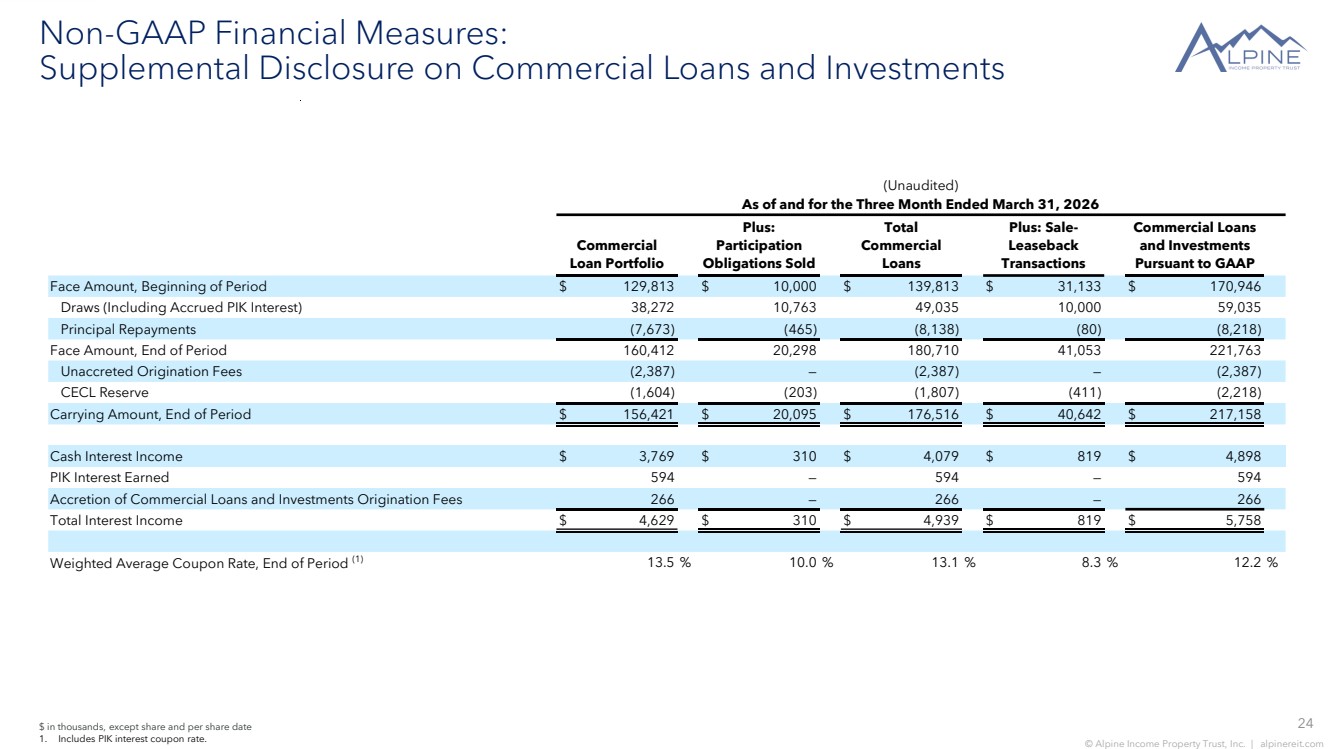
Thanks, John. Beginning with financial results. For the quarter, total revenue was $18.4 million, including lease income of $12.6 million and interest income from commercial loan investments of $5.8 million. FFO and AFFO for the quarter were both 53 cents per diluted share, representing 20% growth over the prior year period. Earnings growth for the quarter was driven by investment activity, in particular, our commercial loan investments as we grew the loan portfolio to approximately 20% of our total undepreciated asset value. Moving to the balance sheet. During the first quarter, we amended and restated our unsecured credit facility. Our new facility includes a $250 million revolver due February 2030 with two six-month extension options, a $100 million term loan maturing in 2029, and a $100 million term loan maturing in 2031. At closing, we applied existing SOFR swaps, locking in initial fixed interest rates for both term loans at approximately 3.5% for $100 million of the outstanding balance under the revolving facility at approximately 4.8%. As the existing swap agreements mature, we have entered into four swap agreements, which will result in changes to the current interest rates. I refer you to our prior press release announcing the amended credit facility, which discusses the timing and impact of those changes. Notably, with the closing of this facility, we now have no debt maturing for almost three years. During the quarter, we were also active on both our common and preferred ATM programs. Under our common ATM, we issued approximately 1.7 million shares at a weighted average gross price of $19.31 per share for net proceeds of $31.6 million. And under our preferred ATM, we issued approximately 186,000 shares at a weighted average gross price of $25.17 per share for net proceeds of $4.6 million. Reflecting our investment activity and equity issuance, we ended the quarter with net debt to perform adjusted EBITDA of 6.6 times and approximately $90 million of liquidity. John provided an update on our property portfolio. As previously noted, our property portfolio includes properties acquired through sales leaseback transactions, and at quarter end, approximately 11% of our ABR, or $5 million, is generated from these properties, which include the Aspen property acquired this quarter and three previously acquired restaurants. Although these sales leaseback properties constitute real estate for both tax and legal purposes, GAAP requires them to be accounted for as financings. Accordingly, current annual cash payments from these properties of approximately $3.7 million are reflected as interest income rather than lease income. Also, as a reminder, our quarterly earnings press release includes a supplemental table that provides the details for both our commercial loan portfolio and related interest earnings. With respect to our common dividend, as previously announced in February, the Board increased our quarterly common dividend by 5.3% from $0.285 per share to $0.30 per share beginning this quarter. This new quarterly common dividend rate represents just a 57% AFFO payout ratio for the quarter. Now, turning to guidance, for the full year 2026, we are increasing our FFO outlook to a new range of $2.09 to $2.13 per diluted share, and our AFFO outlook to a new range of $2.11 to $2.15 per diluted share. Further, as John discussed, we are increasing our investment activity by $100 million to a new range of $170 million to $200 million. With that operator, please open the call to questions.
Operator
Certainly. As a reminder to ask a question, please press star 11 on your touchtone telephone and wait for your name to be announced. To withdraw your question, please press star 11 again. Please stand by while we compile our Q&A roster. Our first question will be coming from the line of Michael Goldsmith of UBS. Your line is open, Michael.
Good morning. Thanks a lot for taking my question. First question, guys, you've talked about the strategy of high-quality net lease in combination with the commercial loan. So can you just talk a little bit about your acquisitions, you know, your activity in the quarter, and then what's in the pipeline and how that fits with that overall strategy?
Yeah, I mean, I think it's pretty straightforward. You know, we have a fair amount of activity in the pipeline right now that we're, you know, really trying to bring in some additional investment grade credits higher up in our credit profile. And, you know, we're finding some good opportunities. So we're actually very optimistic on what we can do in this coming quarter. And then on the loan side, you know, there are a couple loans still in the pipeline. And as we have some lower-yielding loans burn off, pay off in the upcoming months, that will be a nice recycle into higher-yielding and high-quality loans. So it's kind of a little bit more of the same. So, you know, everything looks pretty good from our perspective right now.
Thanks for that. And to follow up on your last point, I presume you're referring to this July 2026 loan. And is that just like, is that only, I guess you have one more kind of near-term loan expiring off of 2026, in 2026. I guess as, you know, you commented in the call how, you know, that could add some volatility to kind of like to the earnings, but, you know, you feel good about the opportunities to redeploy and limit some of that volatility in the near-to-intermediate term?
Yeah, we feel very confident on kind of, you know, as we've expanded the loan program and done multiple loans with those developers, you know, they are getting very used to kind of our, you know, the way we do business and the bespoke way we can kind of tailor these loans with their development needs. And so as these loans pay off, there's something else in the pipeline that they need to accommodate. So the pipeline is very strong and very high quality, and the sponsors are high quality as well. So, yeah, feeling good that these lower-yielding loans that are going to be paying off and some are going to be paying off. We think early we'll have good opportunities to reinvest.
Thank you very much. Good luck in the second quarter.
Operator
And our next question will be coming from the line of Jay Kornreich of VP. Your line is open.
Hey, good morning. At the end of your comments, you referenced the loan portfolio nearly at the cap of 20% of total assets. So should we expect kind of a shift in strategy from here, where the bulk of new investments are coming more so from the more traditional net lease real estate and set of loans? And if so, I guess, how do you view your cost of capital and deal spreads you could achieve on those types of new investments?
Yeah, so we do have a larger amount in the pipeline of traditional net lease investments. And as far as some of the additional loans in the pipeline, As I mentioned, you know, those will probably be, you know, fulfilling a need that we have with the lower yielding loans paying off. And so with regards to kind of our, you know, cost of capital, as you know, in our five plus years, we've always been kind of cost of capital kind of constrained. So we do move out some properties at lower cap rates and recycle. But the yields that we have in front of us on the net lease acquisition side work well with sort of our capital structure right now. But, Phil, do you want to chime in on that sort of end?
Yeah, I think that's right. And then, you know, if you just think about it going forward, Jay, kind of we are near that 20% cap, kind of an 80-20 blend, 80% properties, 20% loans. And you look at the yields we've done in both of those buckets, you know, your cost of capital works nicely with that.
Okay. Appreciate that commentary. And then I guess just maybe on the disposition side, you know, you guys have done a significant amount of work over the past 18 or so months just with right-sizing 10 exposures, you know, shrinking exposure to Walgreens and dollar stores. while I guess also, you know, buying higher credit in Walmart. Are there any other specific exposures you're kind of focused on right-setting at this point?
No, not really. I mean, even though, you know, I think in the past we've gotten asked about at-home and so forth, but the at-homes that we have are very high-performing, and we've had interest from other tenants that want to buy the at-home and bring in their concept and at home is not interested in moving. So we're in a good spot where we've gotten a high-yielding asset and a great location in Charlotte, and we're pretty confident they're going to be renewing because they're declining people that want to give them a check. So even though you may see some credits that don't fit, It's all about the quality of the real estate, and there's actually one that we're working on right now that you would say would be a very low-quality tenant, but we have an investment-grade tenant that wants to take over that space, and it looks like we'll be able to negotiate a buyout. So we're always looking to prune and upgrade, but, again, it's all about the locations that we kind of really specialize in trying to buy that we know that if these cents leave, there's going to be a nice replacement opportunity.
Okay, I appreciate that, Keller. That's it for me.
Operator
And our next question will come from the line of Matthew Erdner of Jones Trading. Your line is open.
Hey, good morning, guys. Thanks for taking the questions. Sticking with the loan portfolio for a little bit, do you guys have any loan-to-own options that you see yourselves capitalizing on, or is it just going to be kind of recycled back into new loans?
Yeah, the cap rates that they'll be able to sell these assets will not work with sort of our investment program. So most likely, none of these will turn into ownership positions, but certainly, you know, as the developers build these tenants out and look to sell them, they give us a right or really just come to us and say, do you want to buy it and we'll save a real estate commission. But the cap rates are very strong for these assets. So unfortunately, they just really won't fit. But, you know, hopefully down the road, we'll find some where we can actually fit those into. And if we have a 1031 need, that could be more where that opportunity comes in.
Got it. That's helpful. And then looking out a little bit into 27, 28, it looks like 20% of the leases are rolling over. Could you just kind of walk through the process? And if you've started discussions, you know, with some of those tenants and just, you know, how you envision those discussions going?
Yeah, I mean, you know, I think that, you know, everything that we have coming up, we've been in discussions with these tenants over time. And if we had, if we had issues, we would probably be dealing with them early. So feel very strong that these are going to be renewal candidates. And as you know, you know, that's one of the opportunities that where we like to buy with a shorter term leases with the high chance of renewal. And a lot of these things are below market. And so, you know, that's, that's why we're, you know, there, you're going to probably see a lot of natural renewals happen and usually get a bump on the leases as well.
Got it. That's great color. That's all for me. Congrats on the quarter.
Operator
And our next question will come from the line of Gaurav Mehta of AGP, Alliance Global Partners. The line is open.
Yeah, thank you. Good morning. I wanted to ask you on your investment grade exposure and the lease term. As you look to acquire more property, should we expect that you would look to increase that exposure and increase the lease term further?
Yeah, look, that's always the goal. And, you know, there's a little bit of a mix. There's some properties in the acquisition pipeline that are shorter duration. And so there's definitely an opportunity to go in there and do an extend blend. But, again, as I just mentioned, a lot of the lease rates are so low that we don't really want to give up that bump because we want, you know, higher lease duration. But, you know, what we have here in the pipeline is accretive to our lease duration as far as getting it longer term. And so that will look pretty good for us. But, you know, again, we're not in a hurry to kind of just have a higher lease duration and give up economics to our shareholders.
Thanks for that, Kalar. Second question on the investment guidance, just to clarify, the $170,000 to $200,000, Is that what you're deploying, or is that on the loan side that includes what you're funding, or is it originations?
Yeah, so generally both funding and deploying, or if you want to look at the loans on the origination basis, both will fall in that range. I would say probably the funding is going to be, just looking at the pipeline, it's a little hard to estimate with future loans and what funds it's closing. But right now, I'd say the funding is probably $20 million less than the deployment, you know, including full origination values. But both will fall within that range.
All right. Thanks for taking my time.
Operator
And our next question will be coming from the line of Wesley Galladay of Baird. Your line is open, Wesley.
Hey, good morning, everyone. I just want to go back to the question about the lease renewals. Do a lot of those tenants with the below-market leases, do they have options? or can you just mark those to market?
They have options. So unfortunately, it's going to be a set bump based on the renewal options.
Okay. Then a quick one on the accounting side. There's a lot of restricted cash around $24 million. Is that mainly tied to the, I guess, the more senior loans that you sold? And does that restricted cash get released throughout the year?
Hey, Wes, it's Phil. So you have most of that restricted cash at the end of the quarter is related to loan reserves. We take pretty healthy reserves up front as part of our loan process and closing. So a lot of that restricted cash is related to loan reserves. Okay. Thank you very much.
Operator
Next question will come from the line of RJ Milligan of Raymond James. Your line is open.
Hey, good morning, guys. So maybe to follow up on that loan reserves comment, Phil, obviously, you know, with net least. We can go down the top tenant list and look for people that are on the watch list. We don't have a lot of visibility on the loan book. I'm just curious if there's anything that you guys have on the watch list in terms of the loan book. Obviously, the PIC is a pretty big component. Is there anything that gives you any concern about collecting that as those loans mature?
Yes. Let me be clear about the loan reserves. We'll take reserves related to real estate taxes or a certain period of interest up front, and it's just part of our underwriting, and Stephen or John can chime up and provide more details on that. We don't really have any credit concerns about any of the loans, and none of those reserves are credit-related. It is just part of our underwriting, conservative underwriting, and making sure we get nice cash deposits up front, you know, related to like a year of debt service or something like that.
Yeah, so, RJ, we basically want to really have these loans structured pretty tightly. So we force the reserve so we don't have to worry about real estate taxes, interest, and so forth. And so out of our loan book, there are no concerns right now. The PIC is really done to accommodate the timing of how long it takes to develop. So you have less cash burn while you're developing. But the book is very healthy right now. Great. That's helpful.
And then, Phil, maybe just on the capital raising side, you guys did a little preferred and some equity this year. How do you think about the more attractive capital sources going forward as we move through the year?
Yeah, I mean, just as far as we ended the quarter with about $90 million of liquidity. At this point, we're generating probably close to $15 million of cash flow on an annual run rate, so that's obviously a great use for us on the free cash flow. Then John spoke earlier about dispositions, you know, at a lower cap rate, so that would be another use. And then, you know, after that, RJ, we could look to be opportunistic on common or preferred, you know, if it's trading at a good level.
Okay, that's helpful. Thank you.
Operator
And our next question comes from the line of John Masaka of B. Riley Securities. Your line is open.
I know we've talked a lot about the loan book over the call, but maybe kind of going to the one new loan originated in one queue, you know, there's a step down in there if they meet certain conditions. What are kind of maybe some color around the conditions that they would need to hit to get down to that 11.5%? that?
Yeah, so basically they've been negotiating leases and waiting for tenants to go through their signing process. And so if some of the leases hadn't been signed by the time we closed it, so we said, you know, the rate needs to be higher until you kind of get those finalized. So it should be relatively short duration, unfortunately. But that's what that's about.
Okay. And then I know the Austin loan was kind of contingent on them kind of, you know, selling some of the homes in a piece of property. So, I mean, how is that progressing? I guess, how does that impact maybe, you know, interest income from that particularly large loan investment you've made?
Yeah. So, I'll answer kind of the cadence on the lot sales. So, they're selling lots. So as you know, as the lots are sold, it goes to our A1 participant first. And, you know, given that it's, you know, obviously late spring, you know, the activity is stronger, but the asset has a large amenity that won't be open until the fall. So we expect that in the fall is really where the lot sales are going to pick up as people kind of are going to get a lot more excited about when it's closer to having the large amenity open.
Okay. I mean, I guess maybe the anticipation there is that your portion of the loan won't start getting paid down until towards the end of the year? Correct. Correct. And then last one, Phil, maybe on guidance. In terms of G&A assumptions in the guidance, are you assuming any incentive fee payout to CTO at this point?
I know it's kind of early in the year, but just kind of thoughts around how that could maybe impact your guidance outlook. yeah so the guidance doesn't assume any incentive fee what is in there right is a little bit higher of a management fee run rate given the equity that we issued so for the quarter the management fee was about a million 250 just based on the equity that was issued during the quarter to go for it run rates about a hundred grand higher a quarter so million 350 assuming no additional equity. But other than adjusting the management fee for our expectations, there's no incentive fee in the guidance. Okay. I appreciate that. That's it for me. Thank you.
Operator
Our next question will come from the line of Craig Cacera of Lucid Capital Markets. Your line is open, Craig.
Hey, good morning, guys. We've been hearing from some of your competitors that there are an increasing number of portfolios coming to the market, basically from family offices that got into the space in 2021 and issued five-year debt at rock-bottom rates. Maybe they don't want to refinance. Are you seeing any small portfolios that might be attractive as acquisition candidates?
We're seeing a little bit of owners of assets that are coming up on a duration or they want to lower their exposure in a larger portfolio. But we're not seeing, you know, bigger portfolio sort of opportunities. The ones that we're looking at are really, you know, nice size for us. And, you know, luckily being a small cap, you know, company is that, you know, these assets can really move the needle versus the very large companies that, you know, really need to do those portfolio acquisitions. So we'll let the large tankers, you know, take on those. And as we just add these one and twos, you know, they all add up very nicely for us. But we're not really chasing any sort of portfolio opportunities.
Okay, got it. Just one more for me. I think you were buying about a 7.4 cash cap rate last year. This quarter you closed at 8.5. Just curious to hear your overall viewpoint on the acquisition environment. Has there been any move in pricing or should we expect something closer to call it 7.5% this year?
Yeah, you're going to be closer to 7.5% this coming quarter, at least, and maybe might see some opportunities in a quarter or two that are higher.
All right. That's it for me.
Operator
And I'm showing no further questions. This concludes today's program. Thank you for participating. You may now disconnect.