Operator
Good morning, and welcome to the Regents Financial Corporation's Quarterly Earnings Call. My name is Chris, and I will be your operator for today's call. I would like to remind everyone that all participant phone lines have been placed on listen only. At the end of the call, there will be a question and answer session. If you wish to ask a question, please press star 1 on your telephone keypad. A confirmation tone will indicate your lines in the question queue. I will now turn the call over to Dana Nolan to begin.
Dana Nolan Thank you, Chris. Welcome to Region's fourth quarter and full year 2025 earnings call. John and David will provide high-level commentary regarding our results. Earnings documents, which include a forward-looking statement disclaimer and non-GAAP reconciliations, are available in the Investor Relations section of our website. These disclosures cover our presentation materials, today's prepared remarks, and Q&A. I will now turn the call over to John.
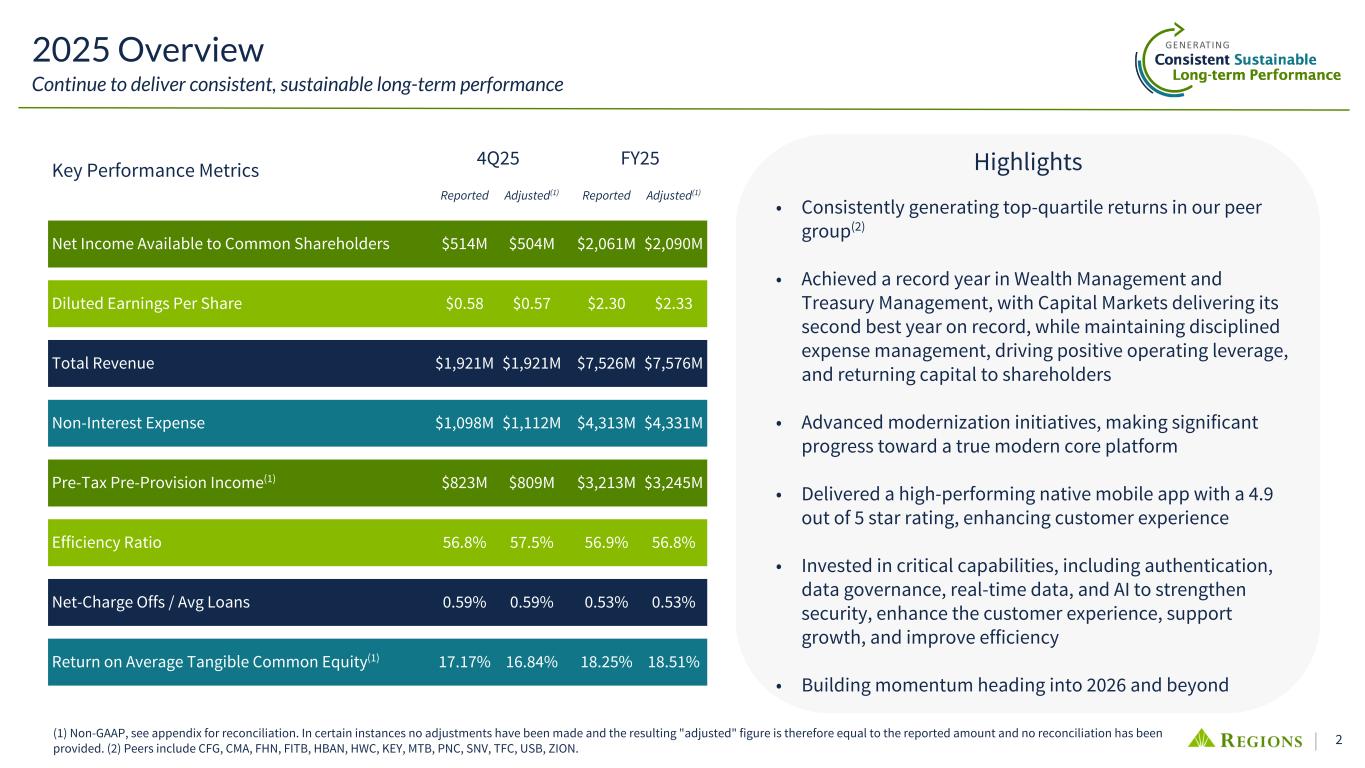
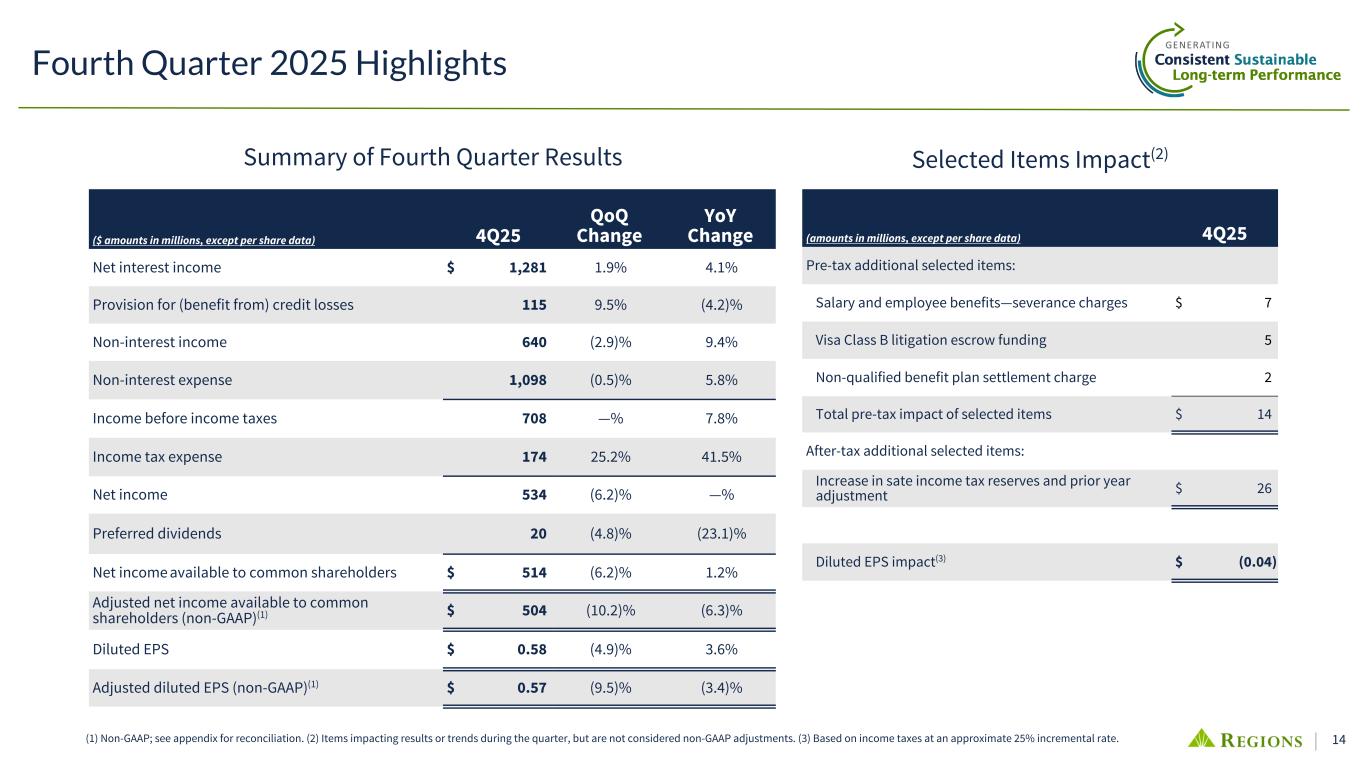
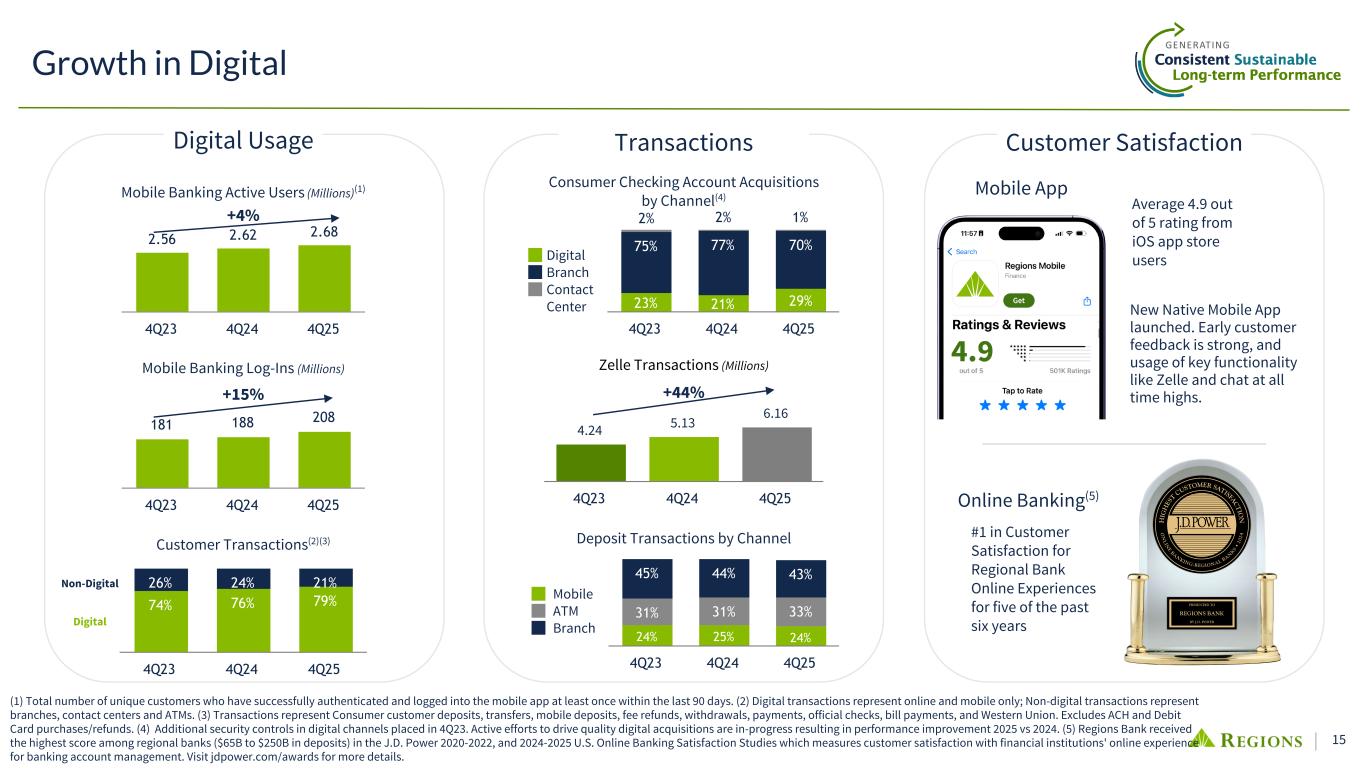
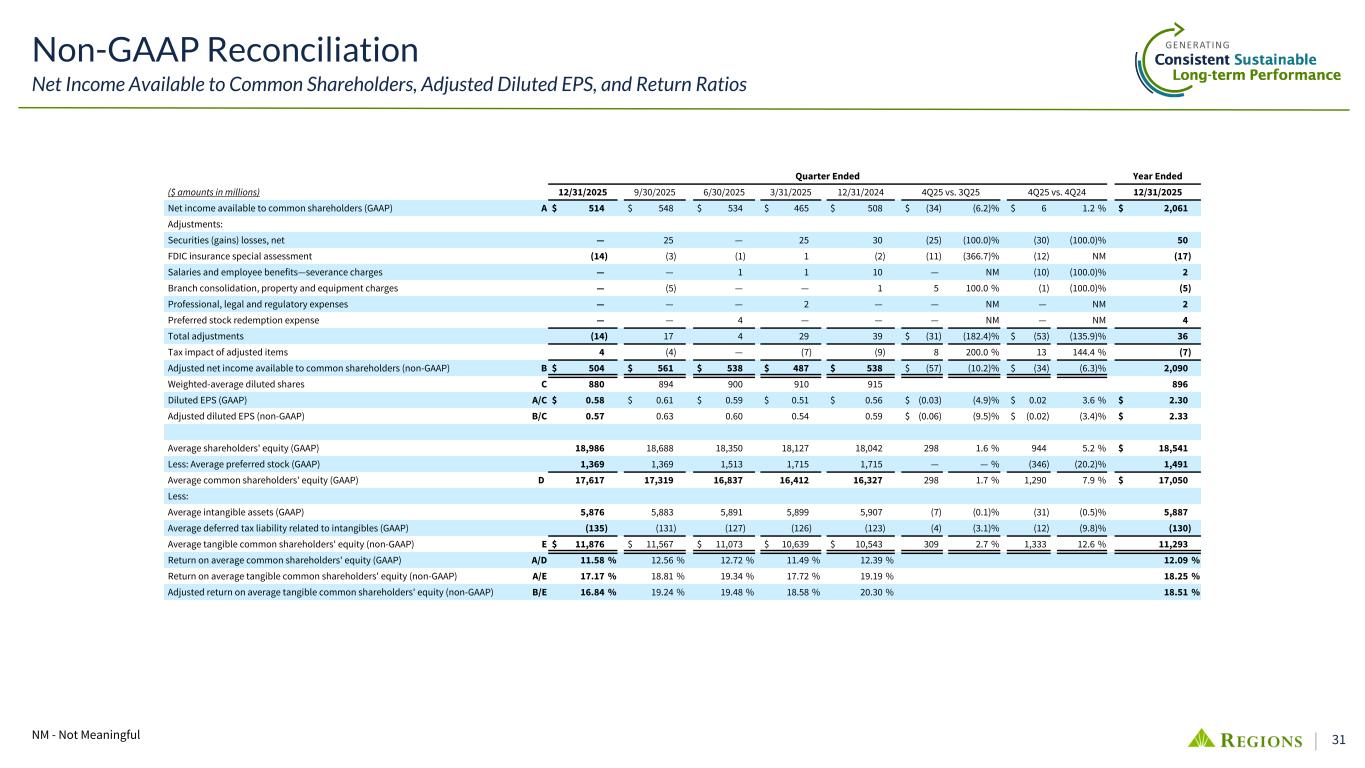
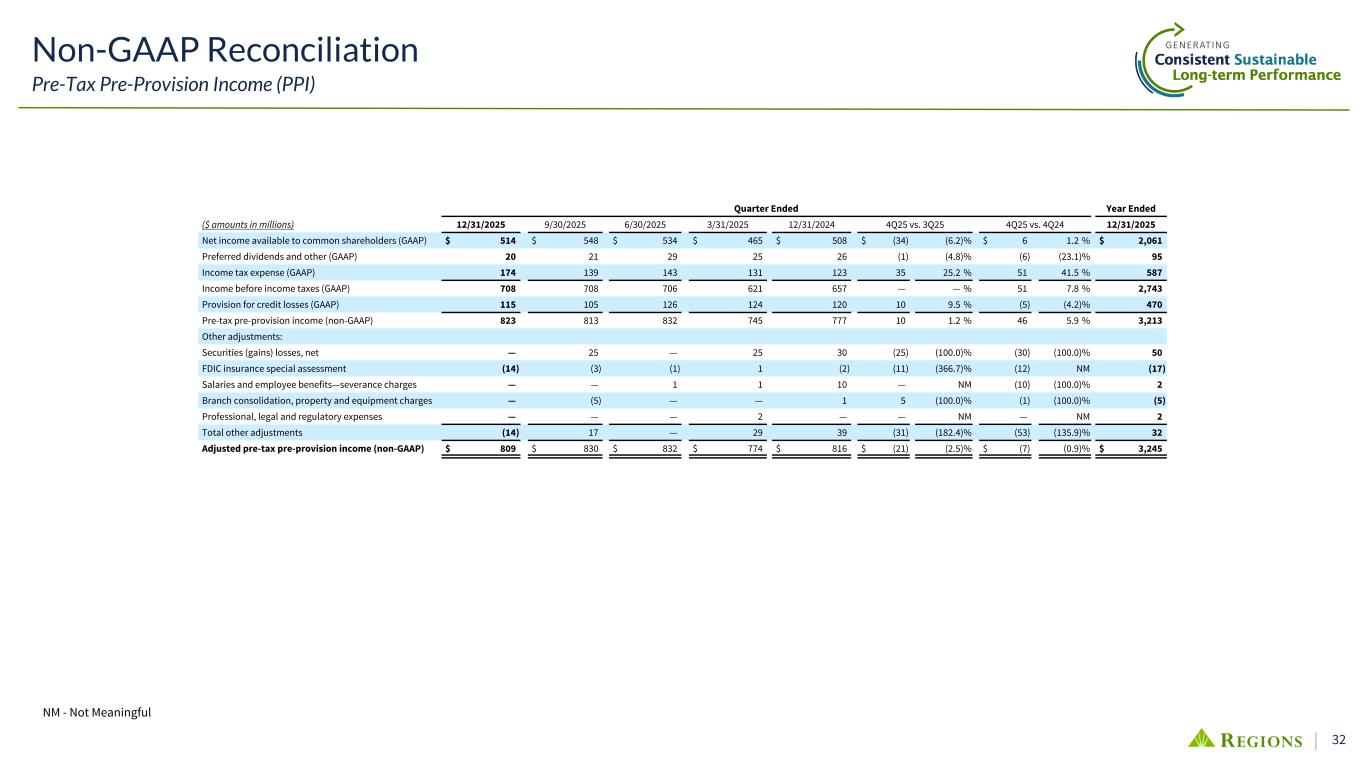
Thank you, Dana, and good morning, everyone. We appreciate you joining our call today. Before we begin, I'd like to take a moment and personally thank David Turner for his service and leadership. After a nearly 40-year career in auditing and finance, including 20 years of service at Regions, he's made the decision to retire. David has been one of, if not the longest serving CFOs across the financial space and is highly respected given his depth of experience. David joined the bank at a critical moment in our history, strategic insight, and disciplined approach to financial management. Reed has not only navigated an exceptionally challenging period for our industry, the foundation we stand on today. While we certainly will miss David's leadership, not to mention his trademark sense of humor, I'm genuinely excited about working closely with Anil Chata, our newly appointed CFO. Anil brings a deep understanding of Regis' strategic vision and is fully aligned with our near-term goals and long-term priorities, having been a key member of David's leadership in our business, building an earnings per share of $2.1 adjusted basis. So it generated one of the highest returns on tangible common equity in the industry at just over 18%. We also reported solid fourth quarter earnings of $514 million, resulting in earnings per share of $0.58 and $0.57 on an adjusted basis. We had a few items which negatively impacted fourth quarter earnings by an additional $0.04. Dave will provide more detail on those in a moment. As you look at our results, it's clear we executed well against our strategic priorities and continue to build momentum heading into 2026 and beyond. We've made significant progress in hiring bankers to support our growth initiatives, and our investments in priority markets continue to pay off, accounting for over 40% of our new corporate client growth during 2025. We also made meaningful progress on our multi-year effort to modernize our core systems. When complete, we will be among a very small number of regional banks operating on a true modern core platform, something we believe will strengthen our competitive position. We launched the new native mobile app that's performing exceptionally well, earning a 4.9 out of five-star rating in the App Store. And we continue to invest in capabilities that matter, authentication, data governance, data management, and real-time data. These Investments strengthen security, enhance the customer experience, support growth, and expand the use of both traditional and generative AI across the company. Our transformation touches every layer of our technology stack and every business channel and support function. We feel good about where we are and the opportunities ahead. At the same time, we've remained disciplined and focused on the fundamentals. Loan growth was challenged in 2025. Large corporate customers took advantage of very attractive financing opportunities in the capital markets and paid down debt. Our commitment to ongoing portfolio management and focus on risk-adjusted returns also drove reductions in loans outstanding as we exited certain portfolios and continued to benefit from fixed asset turnover and prudent funding cost management, non-interest income by 5% in 2020. As our wealth managed $2 billion to share financial results through focused strategic execution, advancing our modernization agenda, strengthening our technology foundation, and driving performance across the franchise. We enter 2026 with momentum, a disciplined operating posture and a clear commitment to generating. I want to thank our 20,000 and Regions Associates. Their dedication is serving customers, living our values, and executing with integrity as a result of their leadership.
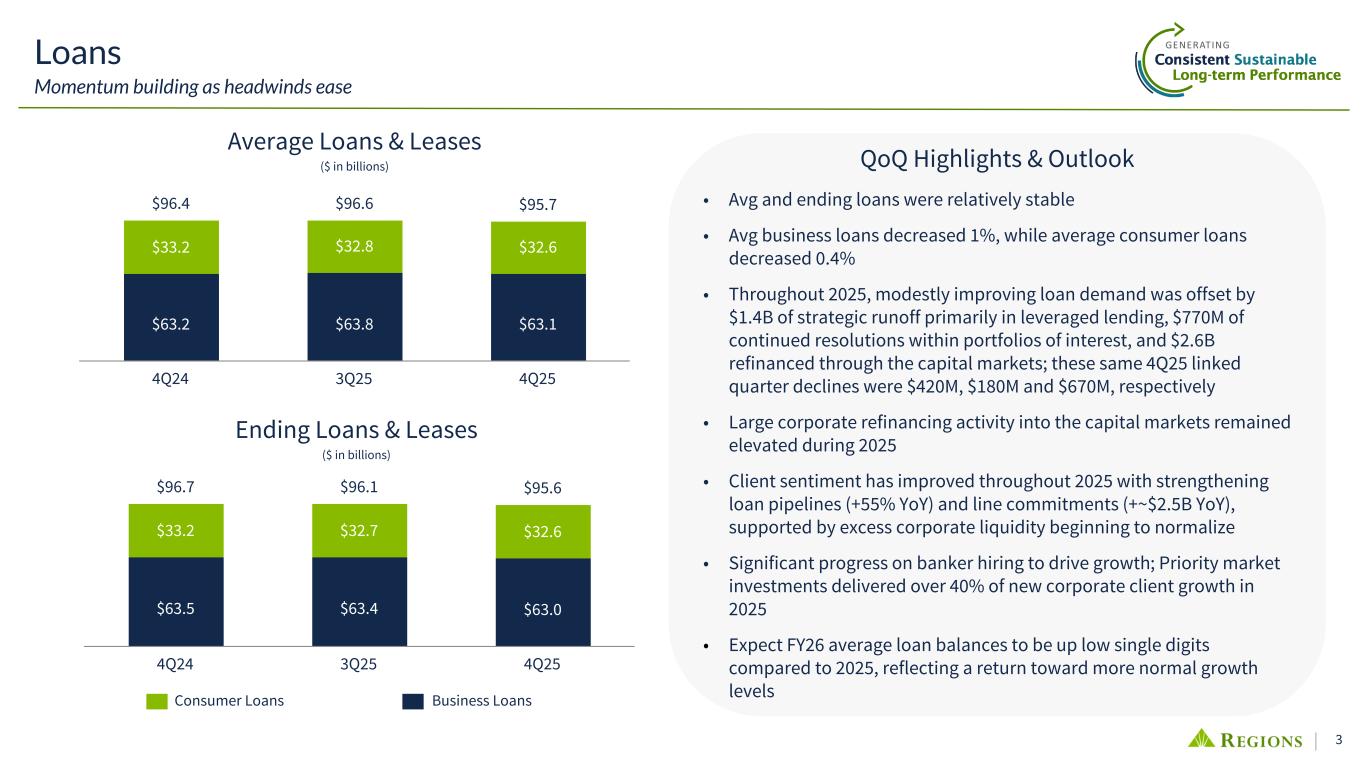
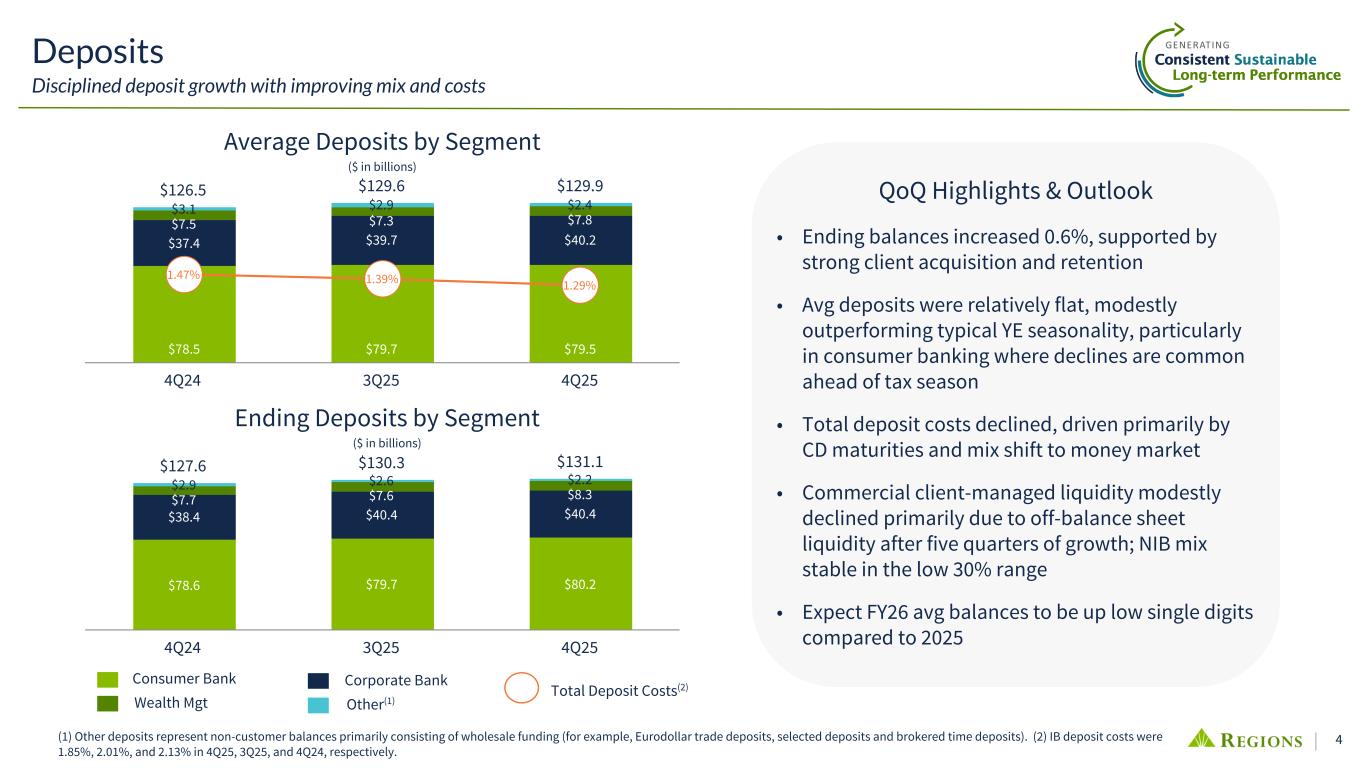
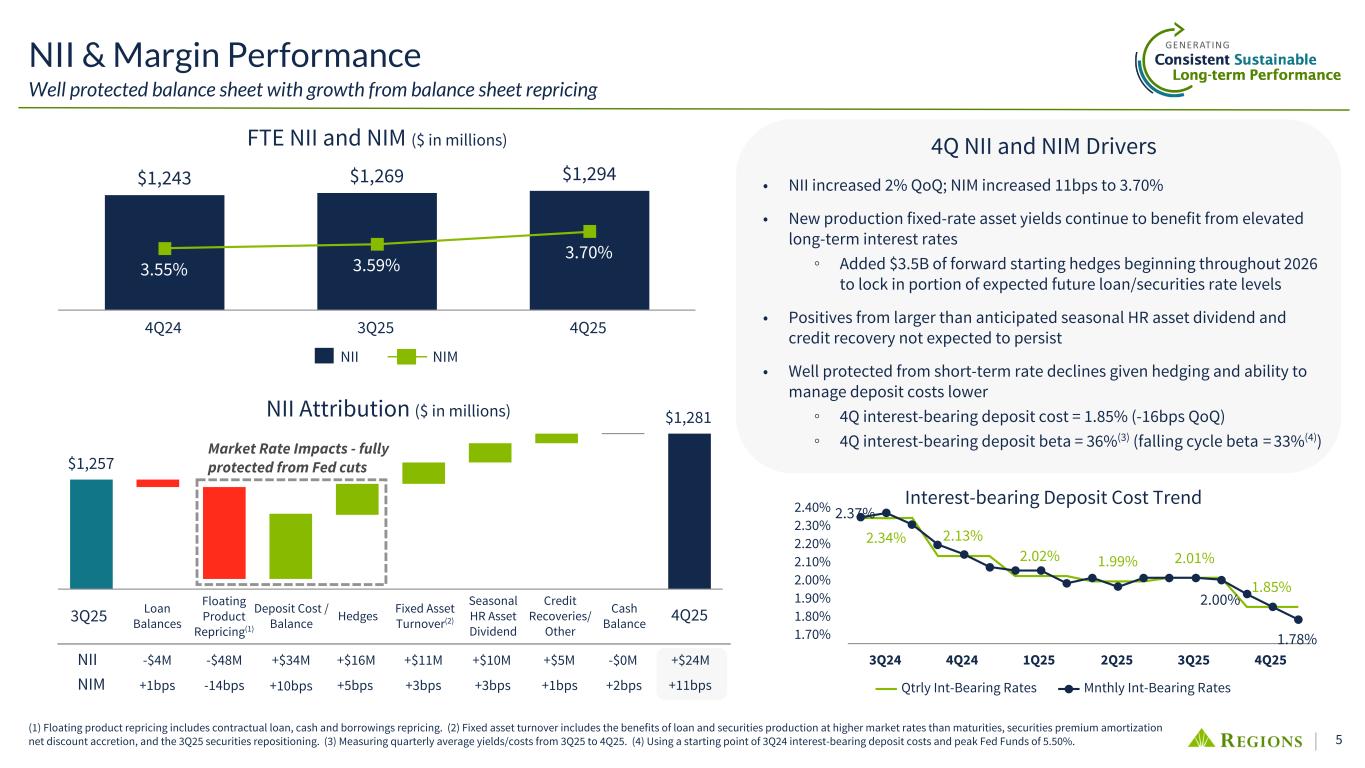
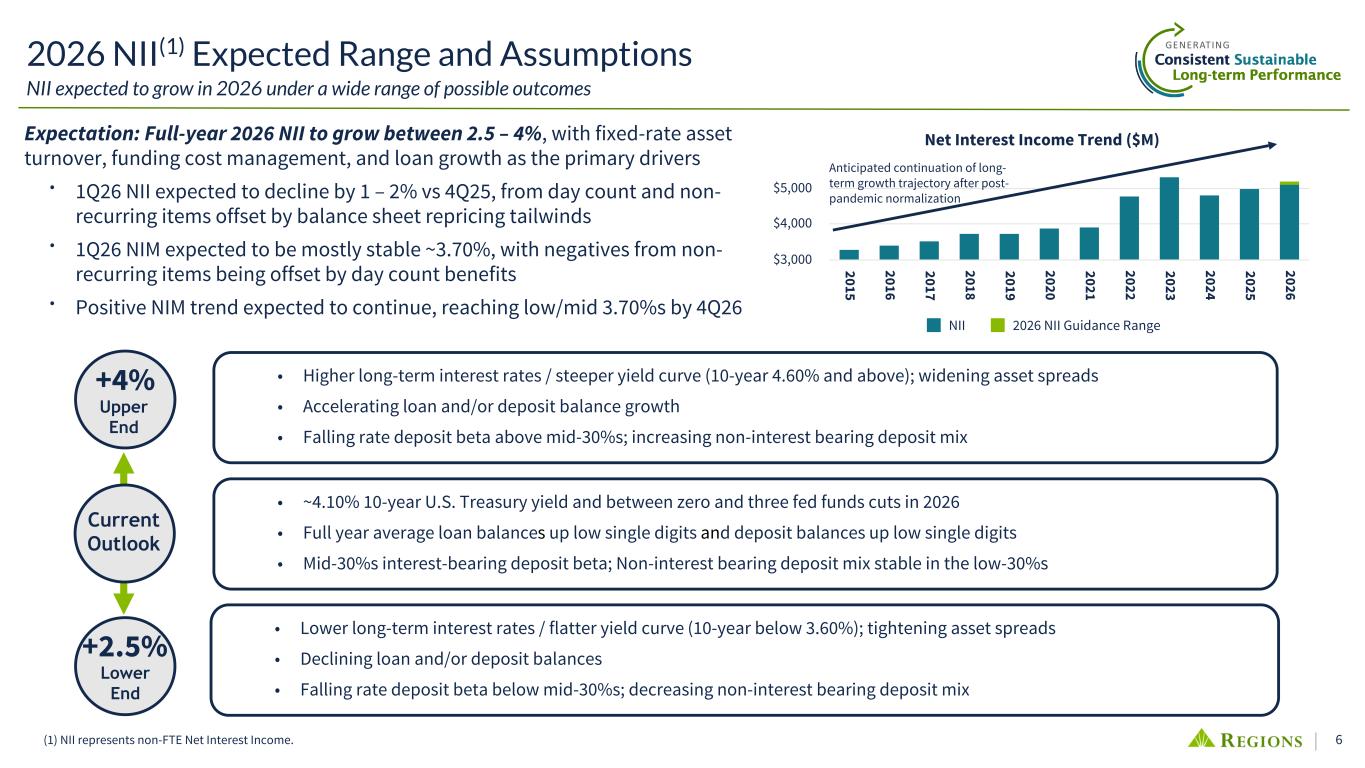
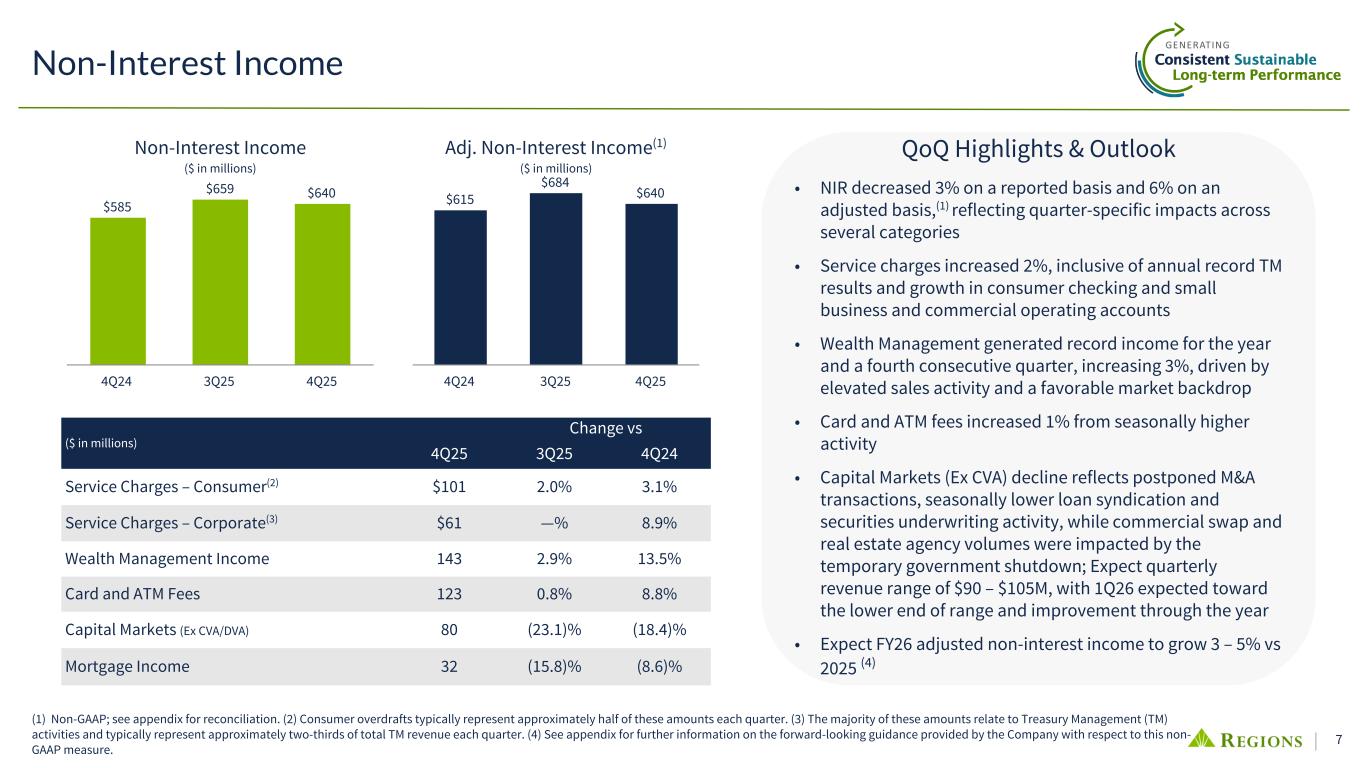
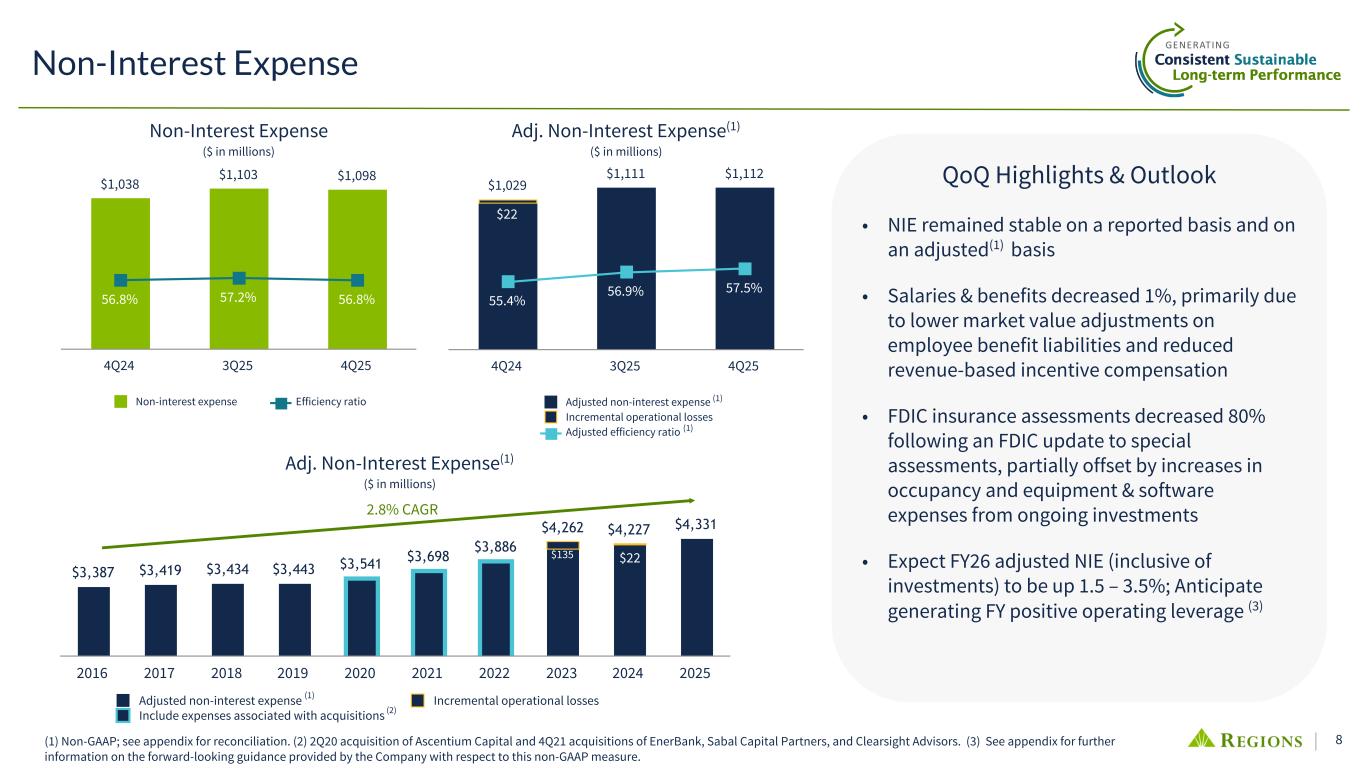
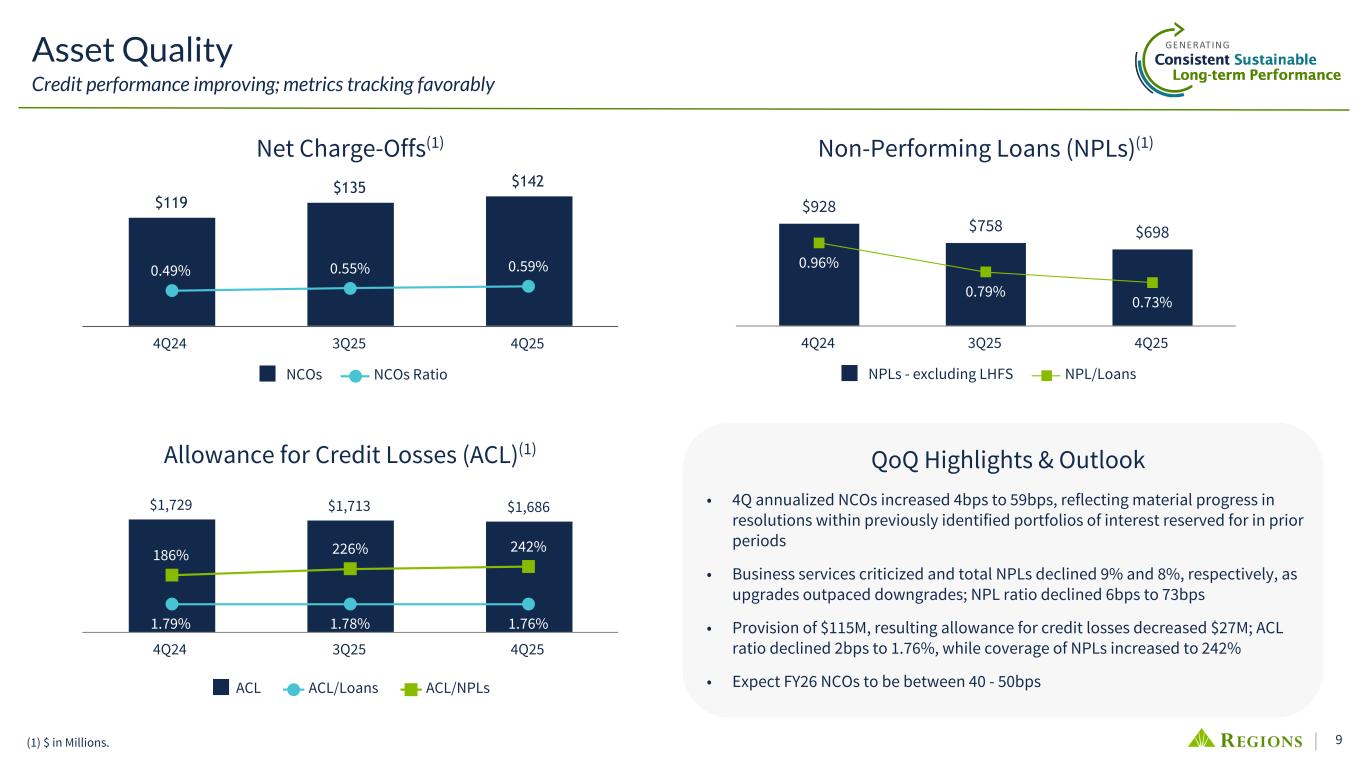
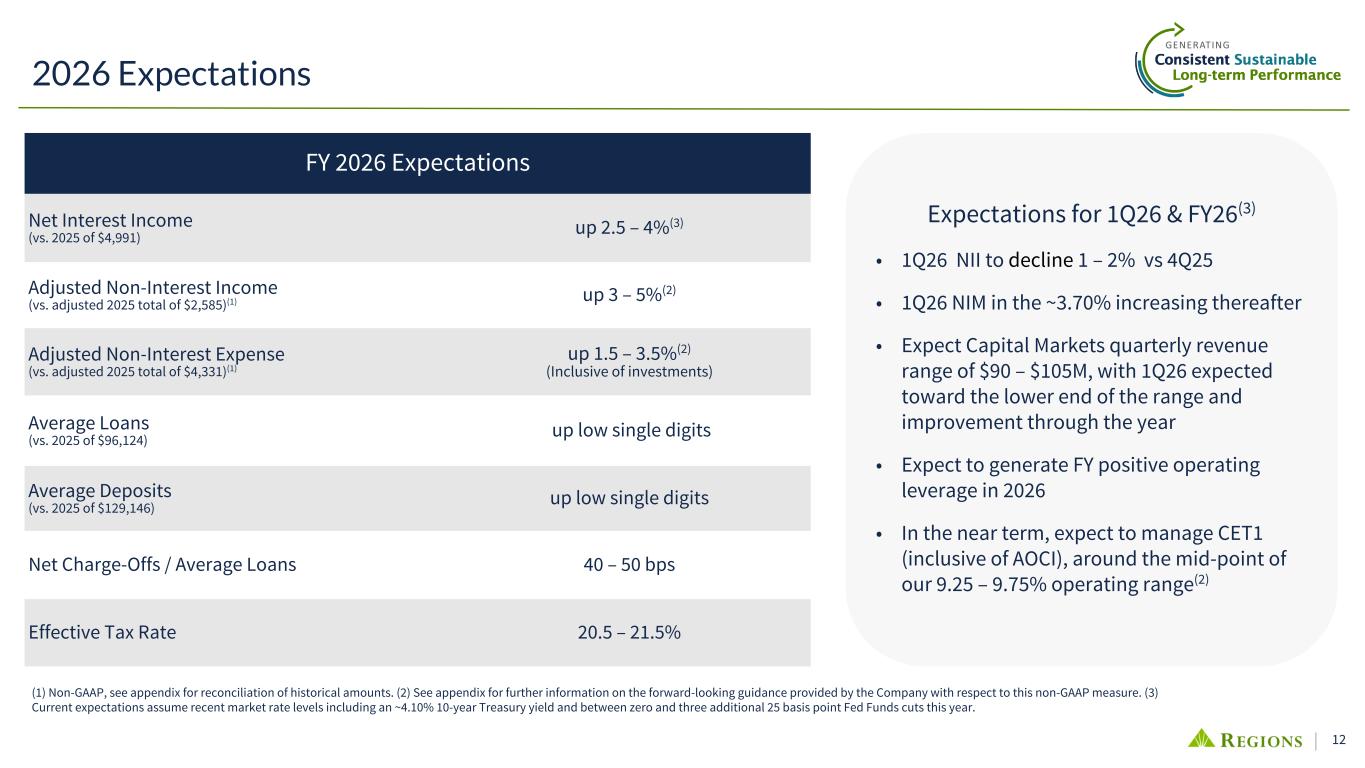
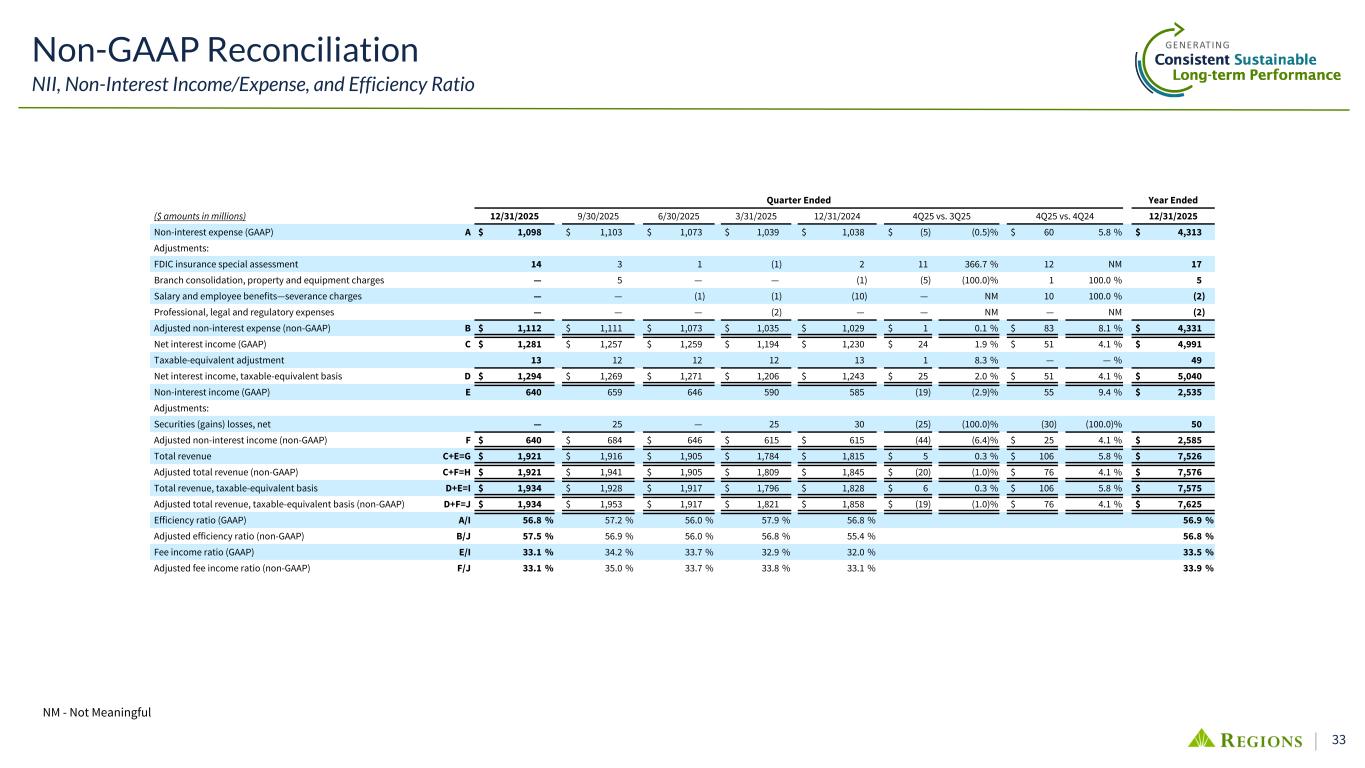
Moving to the balance sheet, let me address an additional fourth quarter items John mentioned. We recorded $26 million of incremental tax expense associated with adjustments to certain 26 to return. It occurred a total of $14 million of incremental expense for EPS by 4 cents. In ending loans were relatively stable versus 2024 and the third quarter. While loan demand has been modestly improving throughout 2025, we experienced over $2 billion in strategic lending and continued resolutions within our portfolios of interest. The good news is that many of these headwinds are now largely behind pipelines and commitments. Our strength and liquidity is beginning to normalize. Taken together, these trends give us confidence to more normal levels and to be up low single digits. Models continue to perform well this quarter. Ending balances were up approximately $800 million for year-end seasonality, particularly in consumer banking, where we normally see declines ahead of tax. Importantly, we achieve this stability while continuing to reduce total deposits. It's continuing to drive a steady dematurities related to money market. In the commercial bank, our liquidity is currently by a decline in off-balance sheet liquidity. Corporate customers are beginning to deploy excess liquidity into business investments, which we expect in 2026 is the upper end of our expected and expected environment. Our neutral interest rate, because the interest-bearing deposit data is 33% turnover in the fourth quarter, as a steep yield curve continues to support term loans and beyond, due to lower, driven by fewer days, continued fixed asset for non-recurring items in the fourth quarter amid 360 expect the margin to be around 3.7 by day count. A continuation of positive trends throughout the year supports a low ticket fee revenue performance during the quarter. Adjusted non-interest income increase by capital markets reflects postponed M&A transactions, and normal seasonality in loan syndication and securities underwriting activity. Real estate capital markets and commercial swap activity was temporary government shutdown. For 2026, we expect capital markets quarterly revenue of $90 to $105 million, trending near the lower end of the range early in the year. Income increased 8% negatively impact a record year in Treasury management and strong growth in consumer checking. In 2026, we expect adjusted non-interest in costs increased 2% in 2020, rose 3% in 2020, equipment software expenses increased 4% in 2020, continuing our core in 1.5, and regarding asset quality, annualized net charge-offs as a percentage of average loans, progress on resolutions, geo declined 6 basis, between 40 and pro conditions continue to improve. we have the opportunity to operate towards the lower end to the capital on liquidity one ratio of ten point eight percent two hundred thirty one remains unchanged compared to made this year and importantly the momentum will carrying into two thousand twenty five headwinds income growth I'll be conducting a
Operator
question-and-answer session if you would like to ask a question please press star one on your telephone keypad a confirmation tone will indicate your Your line is in the question queue. You may press star 2 if you would like to remove your question from the queue. Please hold while we compile the Q&A roster. Thank you. Our first question comes from the line of Ryan Nash with Goldman Sachs. Please proceed with your question.
Hey, good morning, everyone. David, I just wanted to say congratulations on the retirement. You will certainly be missed on these calls, maybe not by me, but I'm assuming by others. I was actually hoping to get a come on now out of you, so I'll take the sports insult. But maybe, you know, to start with loan growth. Last month you guys talked about pipelines being up over 80% and you were growing commitments. Maybe just unpack for us the loan growth guidance. How much do you anticipate coming from C&I, from consumer? And, you know, within the outlook, is there any further runoff baked in or movement into capital markets that's embedded in there?
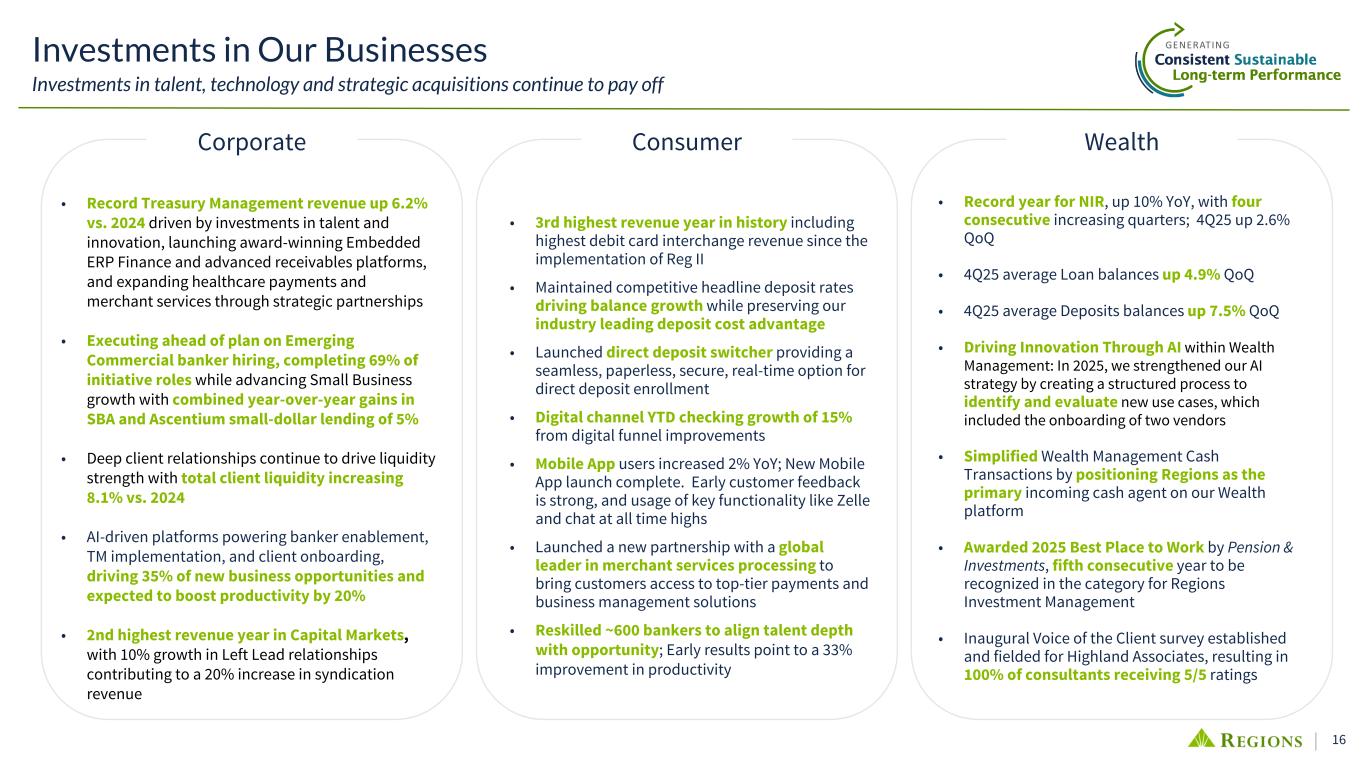
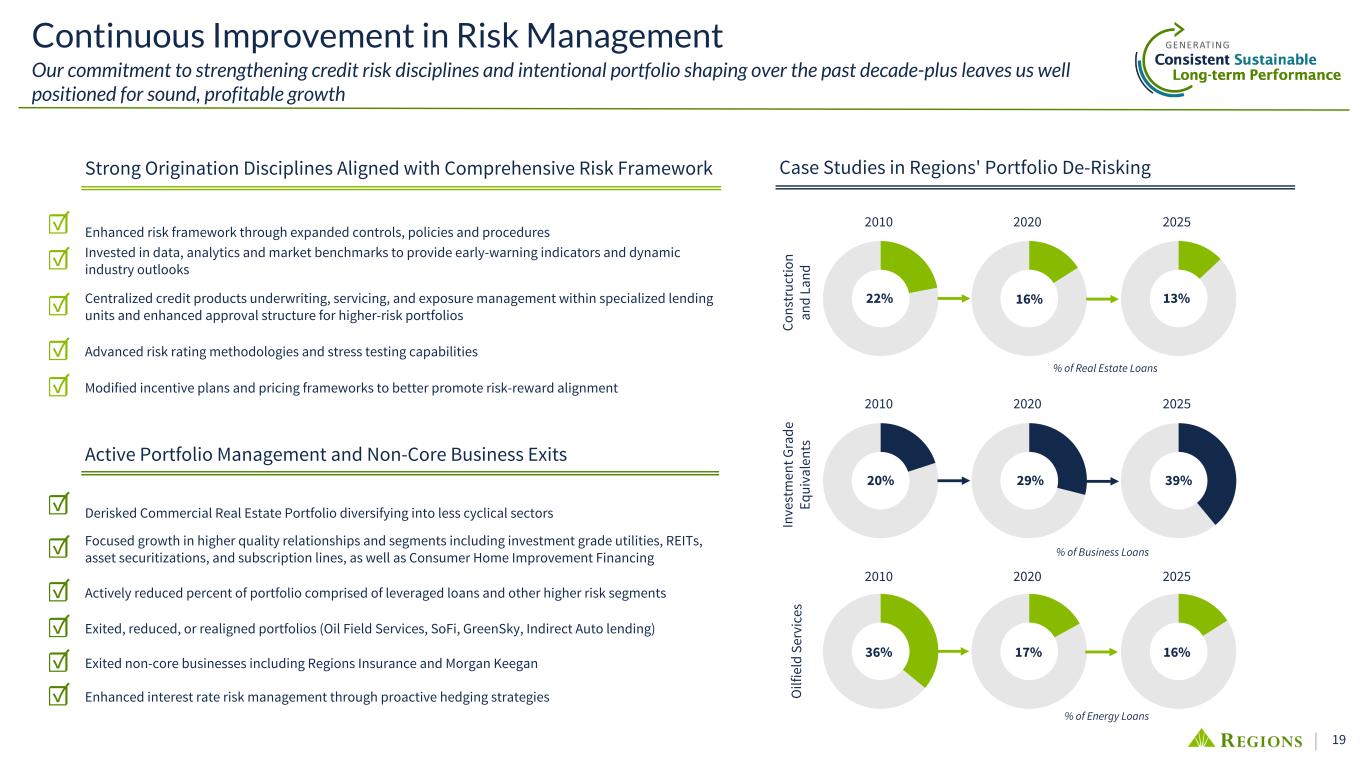
John, thank you for the question. I'd say, first of all, customer sentiment is generally positive, and I think the environment's pretty good, that being commercial customers, I should say. We have seen a nice increase in pipeline activity quarter over quarter, year over year, and and we believe that's a catalyst for growth. We're beginning to see customers use some of their excess liquidity, which we think is also a precursor, obviously, to borrowing and increased line utilization. We've talked about the good markets that we're in. About 40% of our new logos, new customers, came from the new markets that we're in. We're continuing to hire bankers. We've targeted hiring almost 120 bankers over a two-year period. We hired about 50 in 2025, so we're working toward adding those additional bankers. They'll all be or virtually all be in our priority markets, those eight priority markets where we think we have real opportunity. We're adding small business bankers in our branches that's separate from those 120 commercial bankers that we want to add, so we believe those activities really set the foundation for growth. We're leaning into our expertise. We have some really strong specialized industry groups, particularly in energy and healthcare, power utilities, where we think we're going to continue to see expansionary activities. And we really like our real estate banking team and all the capital markets products that we have to go with that. And we think position us to grow on the wholesale side of the business. So, while we're lower single-digit loan growth, I think we feel good about how we're positioned We've seen nice commitment growth and, again, pipeline activity is positive. Now, on the consumer side, I would say customers are still in really good shape from our perspective. Activity is still good. While we don't expect a lot of growth out of our consumer business, I expect that we'll see some, but the primary driver will be our commercial banking activities and leaning into the strength of our franchise, both our core markets and our growth markets, our priority markets where we have opportunities. The final question you had was related to runoff. We think we've worked through most of the portfolio shaping activities that have been underway over the last 12 to 18 months, and so don't believe that would be a headwind as it has been, particularly through 2025.
Gotcha. Maybe as my follow-up, so, John, you know, the banks over the last 10 years have been focused on improving returns, and it's obviously resulted in you guys having peer-leading returns, and, you know, the environment now feels like the markets are much more focused on growth, And, you know, you're obviously taking steps with a lot of the hiring that you guys are doing. But maybe just talk a little bit about how you're thinking about the tradeoff between growth and returns at this point. And do you foresee that a lot of this hiring that you're doing is going to result in an uptick in growth over time so that you guys are going to be growing more in line with peers? How do you think about that tradeoff over the medium term?
Well, I'd say first and foremost, we're focused on capital allocation, on risk-adjusted returns, on ensuring that we're delivering top quartile returns on tangible common equity. That's our focus. That was our commitment back to ourselves and to the market in 2014, 2015, and I think I think that focus has allowed us to continue to shape our business in a way that we are performing at the top of our peer group from a return on tangible common equity perspective. And as a result, our shareholders are benefiting as a result of that. And I would say that as we think about growth, we've historically said we want to grow with the economy plus a little. And that reflects the good markets that we're in. And I think that will, volatility that had characterized our franchise back in the 2000s and early 2000s in particular, and I guess all through the 2000s. And I think we've generally done that. And in return, we need to make sure that we're sound first, we're profitable second, and that we're growing third. And we think we can do all those things.
David, you know, get yourself in trouble. Great markets with the hires that John mentioned, and we think we can grow.
We're trying to let you get our feeds on your last call, David, but I appreciate the call.
Operator
The next question comes from the line of Scott Seabrook with Piper Sandler. Please receive your question.
Good morning, everyone. Thank you for taking the question. David, I was hoping you could maybe help to kind of unpack the fourth quarter capital markets performance and outlook. You know, the postponed M&A transaction is definitely understandable given the shutdown, but you had also, in the release, noticed a lower syndication and securities underwriting activity that kind of feels like the year will start on the slower end but pick up from there. So just curious about any comments about, you know, pipeline, why it projects or leaps back up after the first quarter, et cetera.
Yeah, we feel good about capital markets in total. Loan syndications have a little bit of seasonality there in the fourth quarter. Came in a bit weaker than we had hoped, but we believe that could pick up in 2026. We'll have a little bit of a slow start in the first quarter, but it'll pick up, and we believe that guidance that we've given you is pretty good. You know, M&A activity, by its nature, is a bit episodic. We do have a lot in the pipeline that just didn't get closed in the fourth quarter. We expect that to get closed in the first half of the year. And so we think capital markets, it had its second best year in its history. It just had a, you know, it just didn't have the fourth quarter where we wanted it to be, so we think we're going to rebound and feel very confident that we're going to get that up on a run rate and the guidance we're giving you.
I would just add, and capital markets related activities, we're adding a couple bankers to that business and we think that will be a catalyst for some additional revenue, improving interest rate environment helps as well. Another good year for capital markets and we should see nice growth over 2025 performance. Perfect.
And then, so the deposit data performance, you know, it sounds like it's going very well and can still ultimately outpace your expectations. Just maybe some additional thoughts on pricing trends, what you're seeing competitively and especially how they move from here if we get another couple of rate cuts throughout 2016.
So that last part of your question is important. We want to remain competitive, but we also have to acknowledge where the market's going. We had a pretty big CD maturity quarter, as we told you at the last conference we were at in the fourth quarter that helped propel that 36 basis point improvement over beta for the quarter, 33% on accumulative. We think, and our guidance is really centered around the mid 30% change, and so we think If you look at the first quarter, we'll have another $3.5 billion in CDE maturities. We've got another $5 billion in the second quarter. It's a pretty big quarter there. So being reactive, we've had nice reactivity from our corporate banking group and our consumer banking group and the wealth group to react to what's going on in the marketplace to watch what the Fed's doing, but also to stay competitive in the markets that are.
Terrific. And, David, just congratulations on your retirement. We'll certainly miss you on these calls and elsewhere. Thank you, Scott. Appreciate it.
Operator
Next question comes from the line of Gerard Cassidy with RBC. Please proceed with your question.
Good morning, David. Good morning. David, congratulations. You're leaving big shoes to fill. Good luck in the future endeavors.
Thank you, Gerard. Appreciate it.
John and David, can you share with us, you mentioned in the slide, I think it was slide three, on the loans, you know, about the downsizing of the portfolio, and you specifically pointed out about $2.6 billion of loans in 2025 were refinanced through the capital markets. Can you share with us, what's the attraction that the customers are seeing? Is it lower rates, easier terms. What's the real driver of that going into the capital markets?
Gerard, most of that activity is in investment-grade credits within our real estate corporate banking business, so REITs, within the energy portfolio and financial services, insurance companies that we bank. And so the cost of capital was lower. They could borrow more cheaply, terms were potentially better. It's an activity that does occur on an annual basis. We see, particularly in those three industries, customers enter the capital markets and raise some capital, and that activity occurred this year as well. Probably a little earlier than it does sometimes.
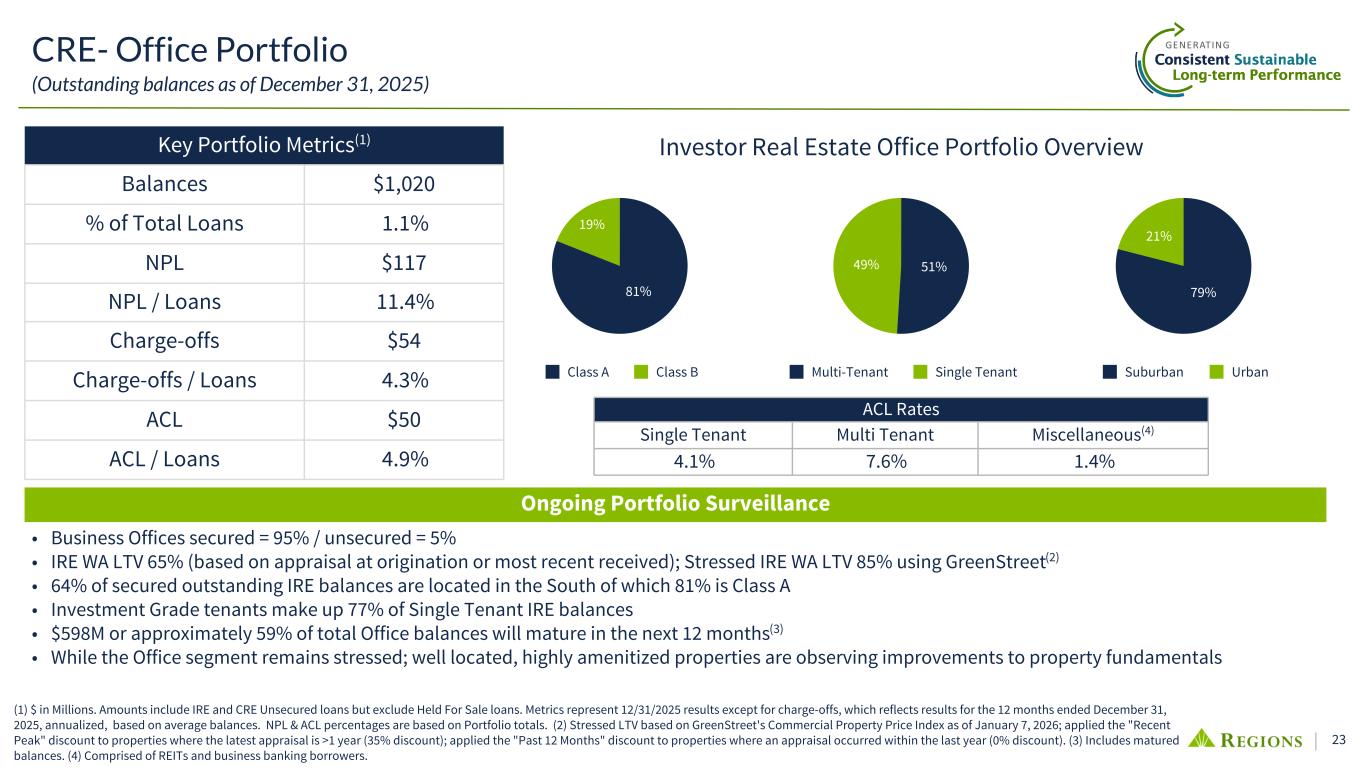
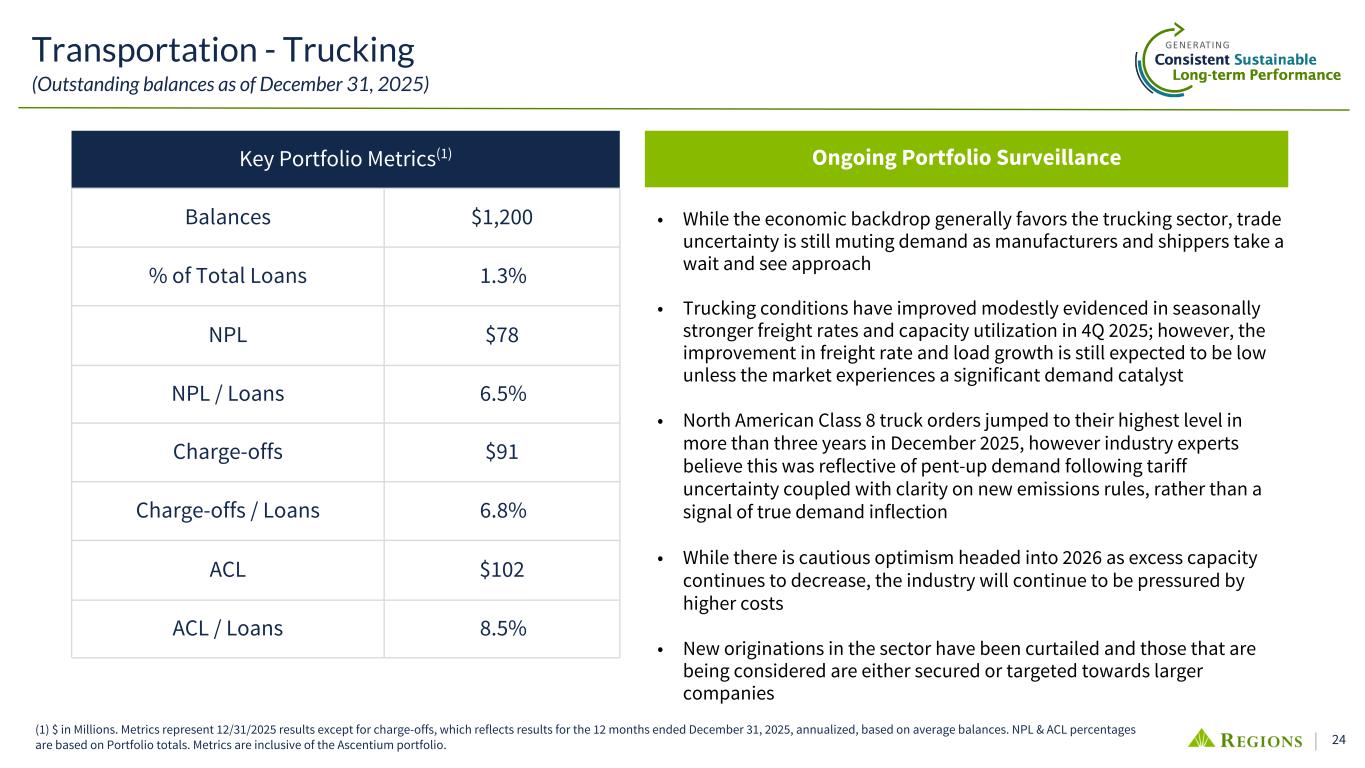
Oftentimes, within the REIC portfolio, particularly it's the third quarter of the year but we did see fair amount activity um in 2025. was it more pronounced john in 25 than years past that you can recall seems to be yeah it seemed to have been because the market was not open for a while and then when it did open we did see a lot of activity got it and then just following up on credit quality obviously in credits in good shape You guys have identified, you know, the higher-risk portfolios of office, commercial, real estate, and trucking and transportation. Any color on, you know, the trends you mentioned that the backdrop's getting better economically for trucking. What are you guys seeing in those higher-risk portfolios as we look into 26?
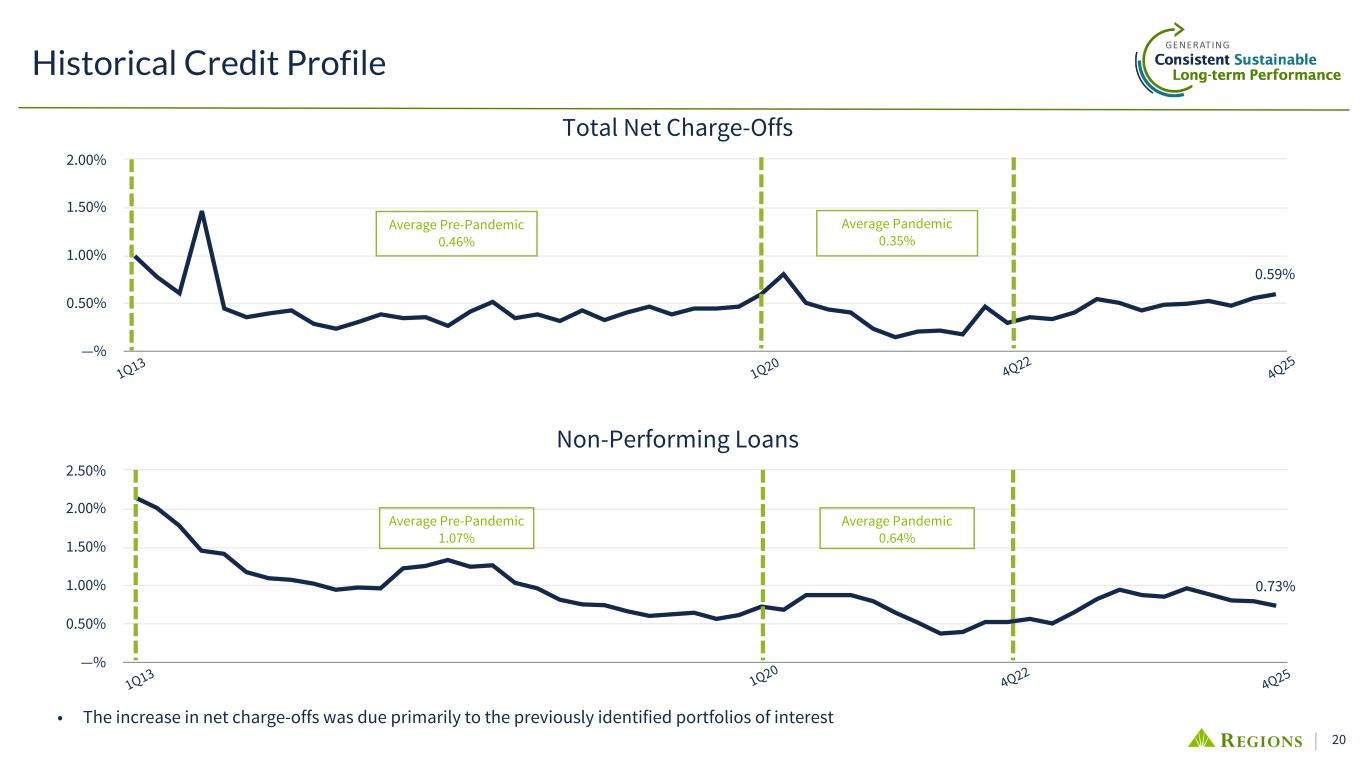
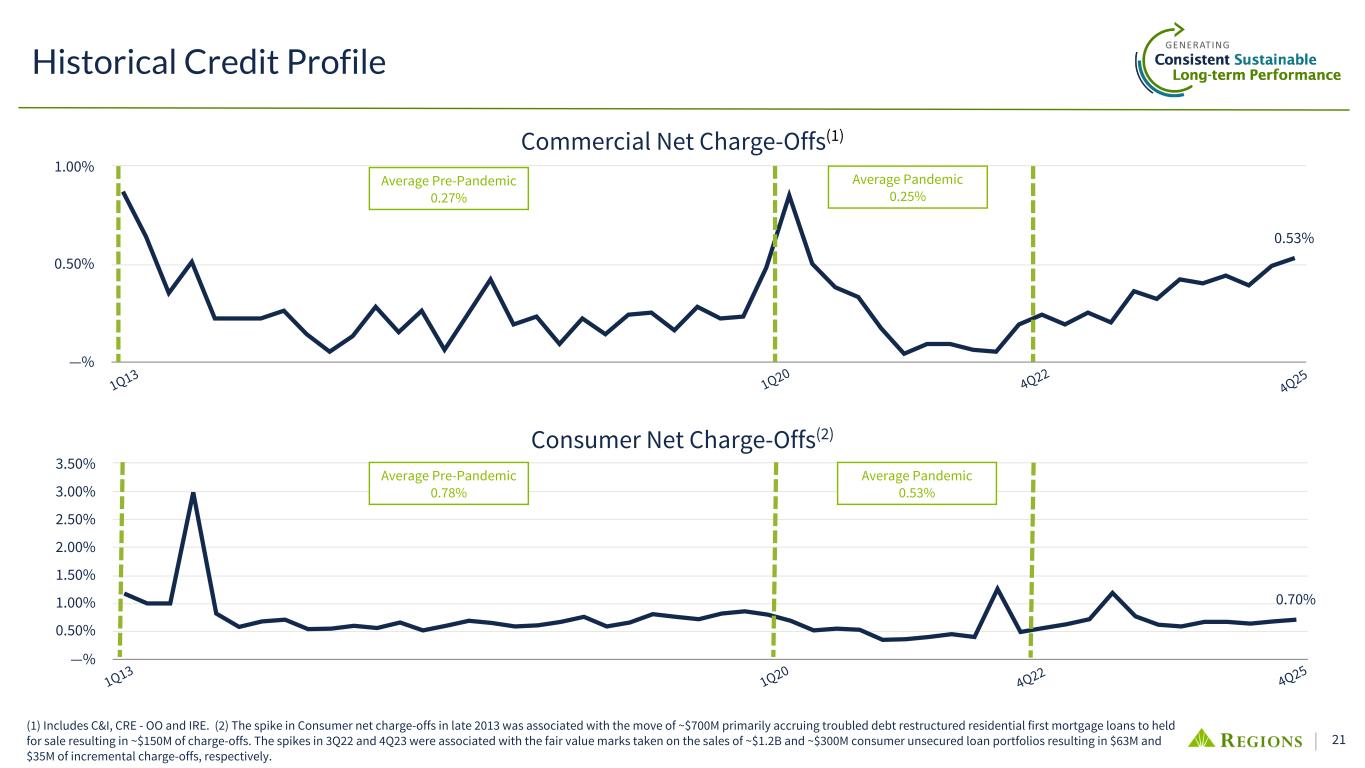
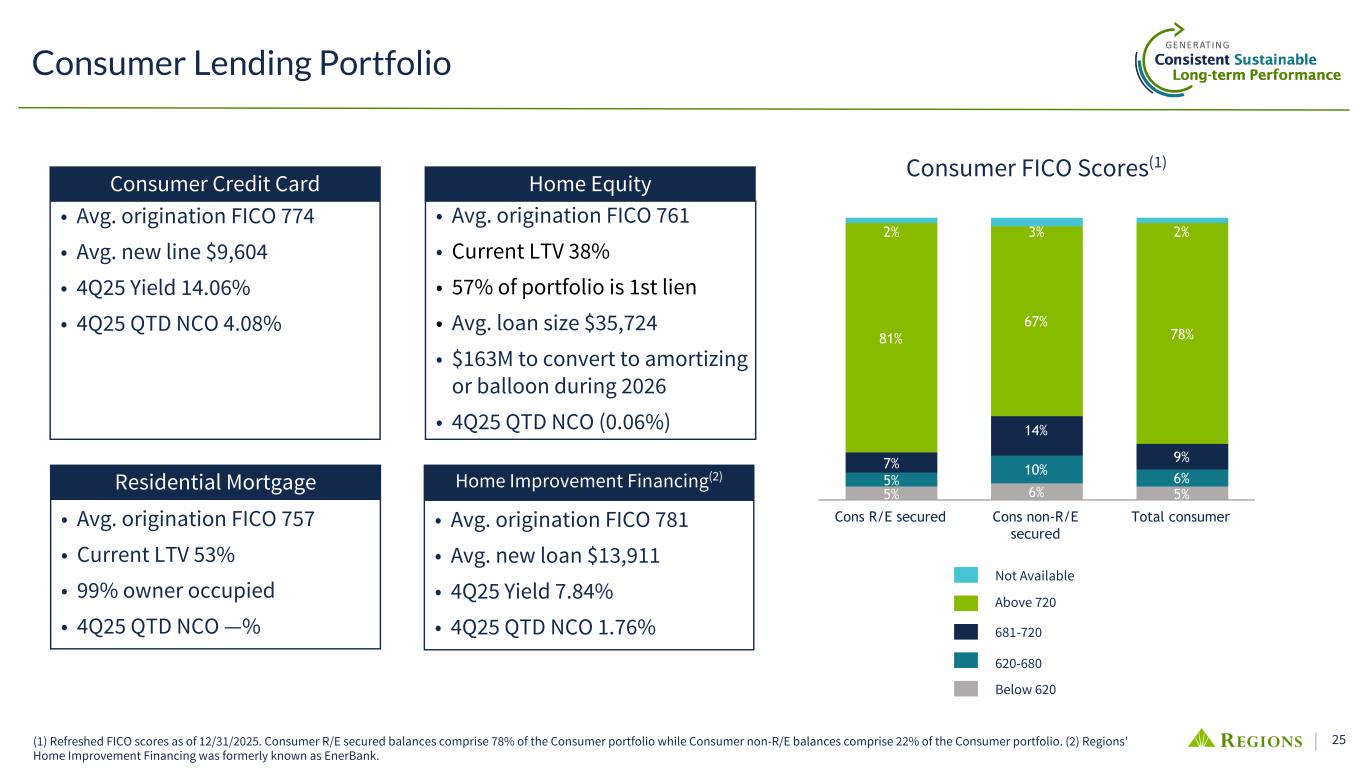
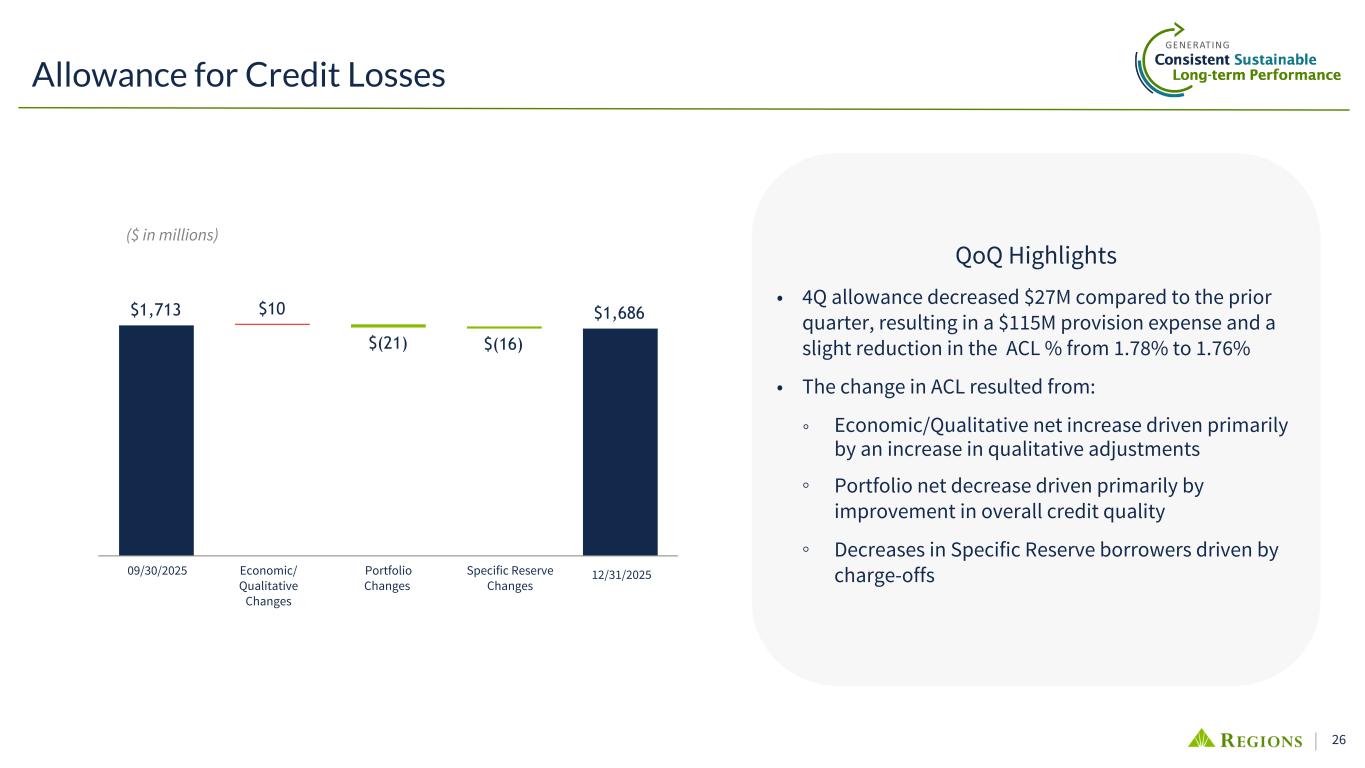
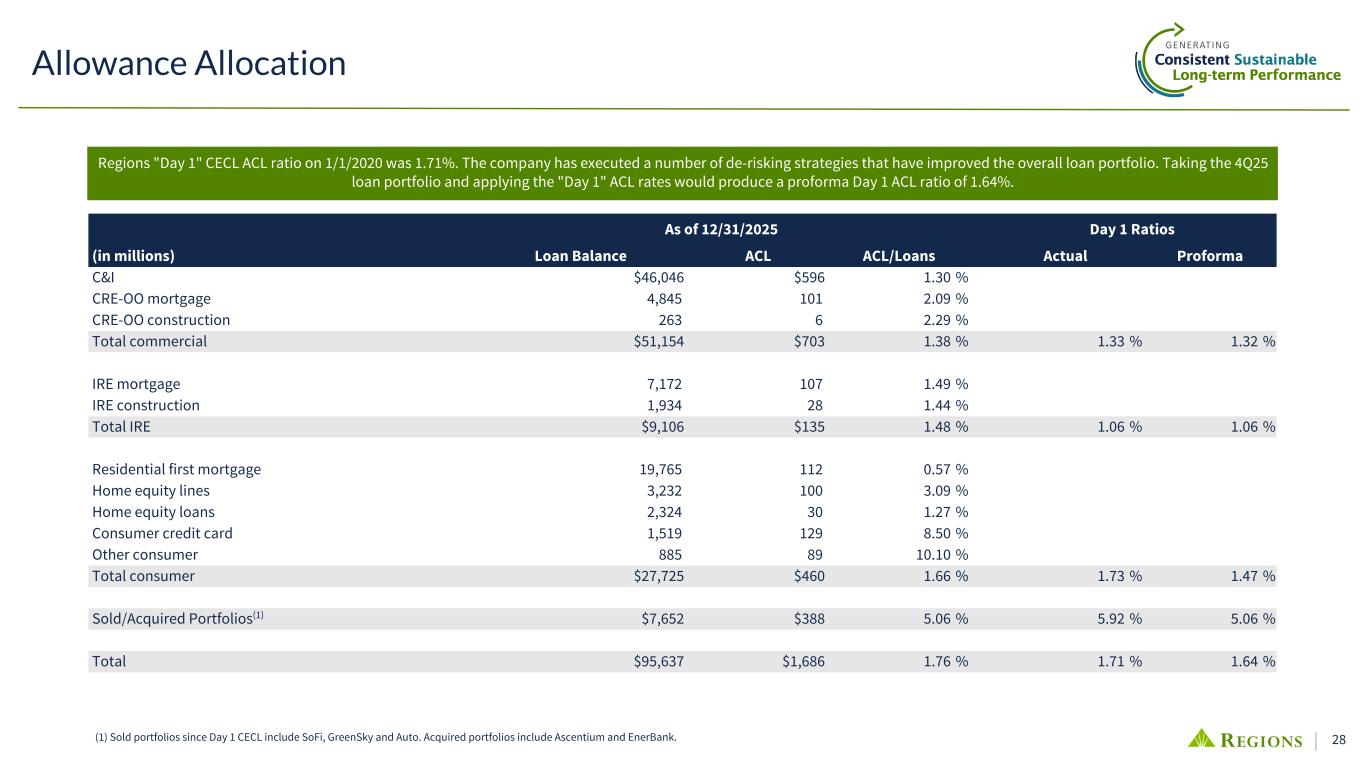
Yeah, well, first of all, I'd say, to your point, credit quality or the deterioration in credit quality peaked a couple quarters ago. we've seen four quarters of improvement in non-performing loans down from 96 basis points to 73. Criticized loans down 32 percent over a four-quarter period. Charge-offs, which is a trailing indicator, reached a high point this quarter at 59 basis points. We expect that obviously to come down. We're guiding the 40 to 50 basis points. industries like forest products, some construction related activity or building materials, industry is still struggling a little bit. But in general, I would say we continue to see, as reflected in the metrics in our own portfolio, continued improvement and so are optimistic about 2026 and beyond. George, I'll add, so we're sitting with an allowance for loan loss.
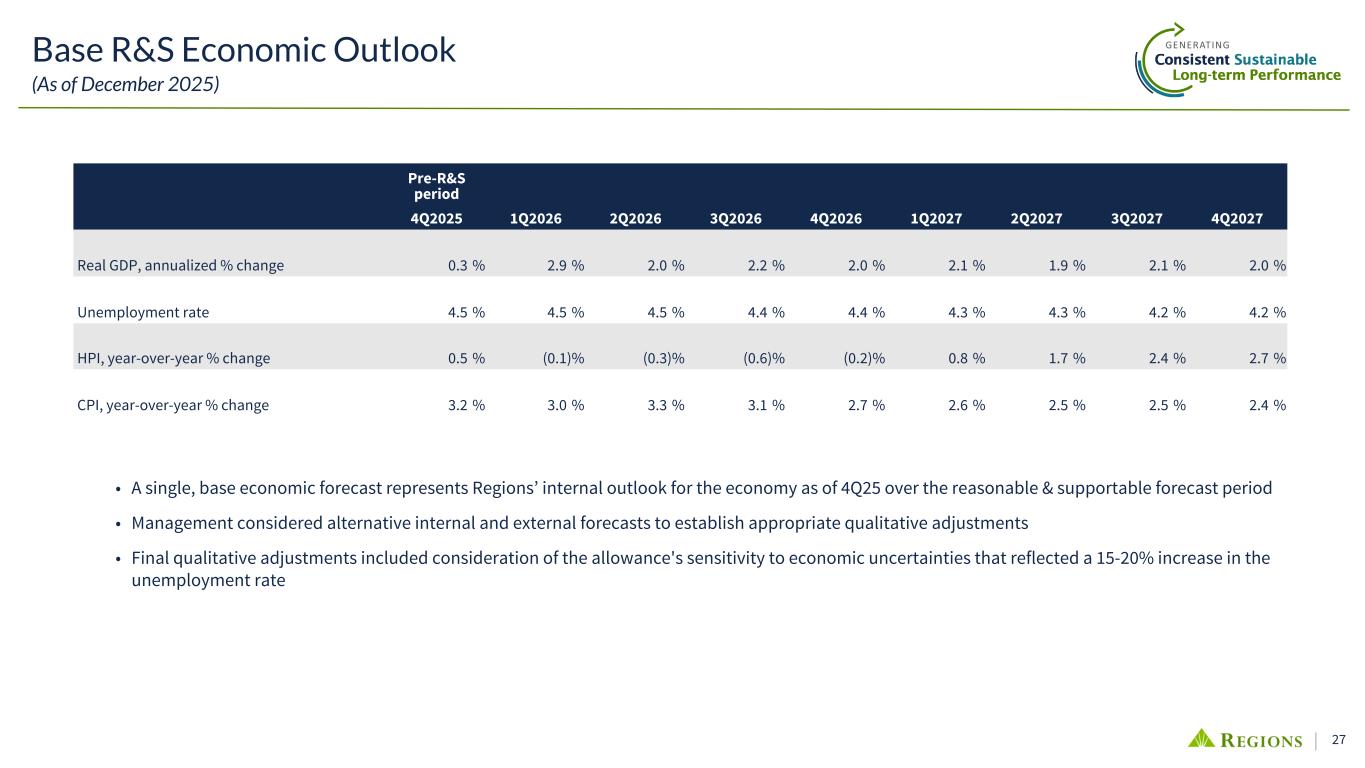
CESA was when an environment is pretty benign. We can debate what that means in terms of overtime. You should expect people to get back to a normalized environment. That 176 on two basis points.
Operator
Next question comes from the line of John Pencari with Evercore. Please proceed with your question.
Morning, David. Morning. David, you're a legend. Best of luck. We will miss you. And apparently other banks are going to miss you, too. I've been hearing from a number of other executives is just saying how much they're going to miss teams of conferences and everything. So, and Emil, welcome. We look forward to working with you.
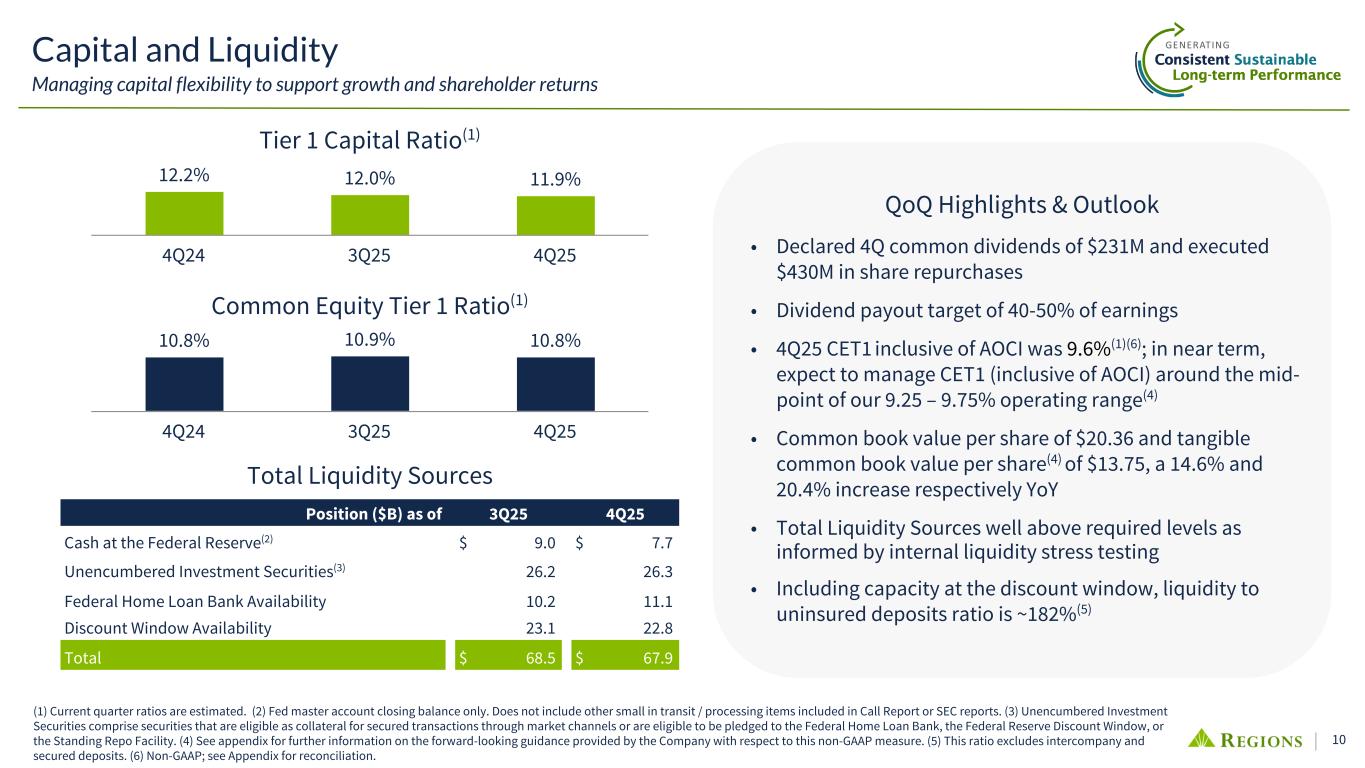
So just a question on the capital front. Just given the CP1 to 10.8, you did the $430 million in buybacks in the fourth quarter. I mean, can you just kind of frame how you're thinking about the pace of buybacks as you look at the capital need for organic? You talked about loan growth, you know, generally improving and some of the runoff slowing. So how do you balance that in terms of the pace of buybacks? Do you think it's reasonable as you look at 2016?
Sure, John. This is Neil. I'll take that. So we look at every quarter we generate about 40 basis points of capital, and we'll pay a dividend about 18 basis points of that. To your point, beyond that, our number one focus is to invest back into our business through good loan growth. When we see that, we're definitely going to fund that with capital. When we don't see that, we're going to step in and buy back shares like we saw us do this So the $430 million is really a testament to what we were seeing in terms of loans coming onto the balance sheet. We saw an opportunity early in the quarter in particular when the stock price was down a bit and stepped in. Invest in loan growth and when we see that good quality loan growth, we're going to step in there and generate and invest capital.
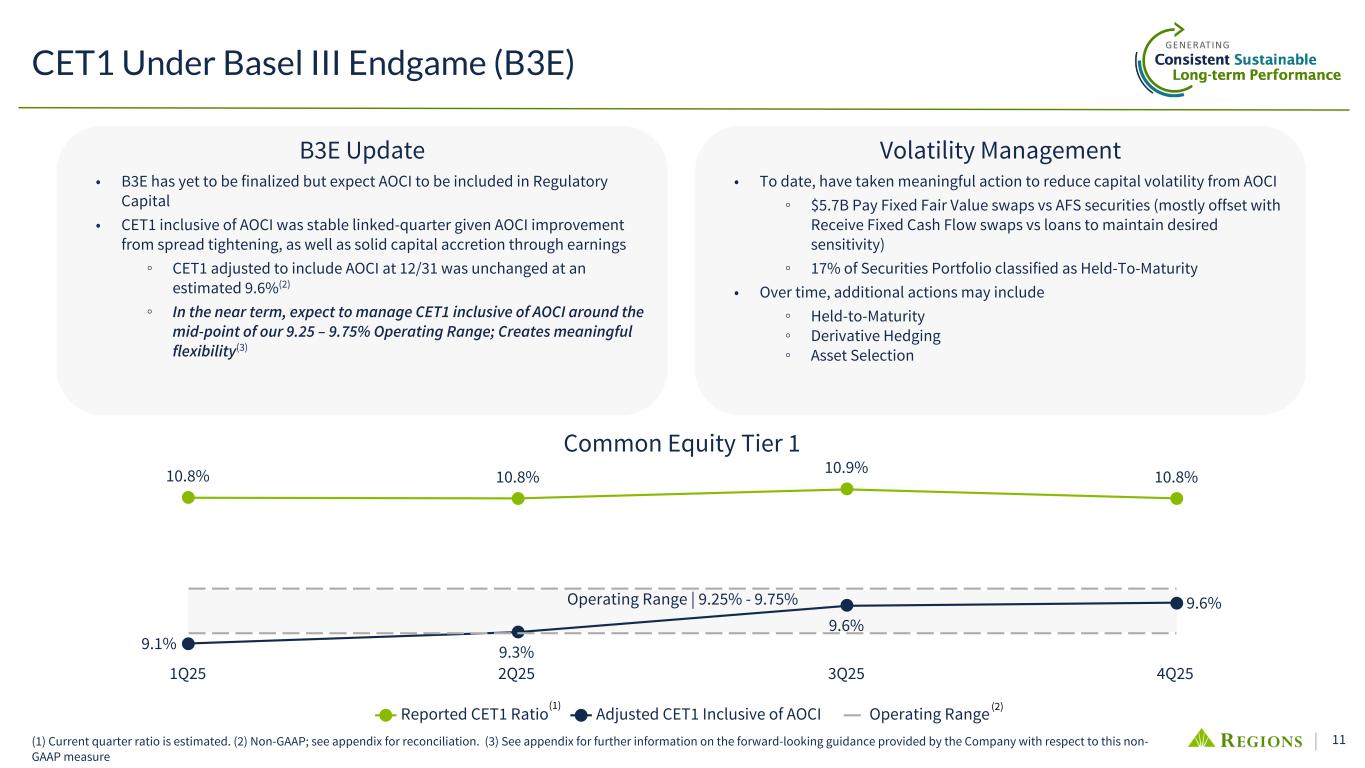
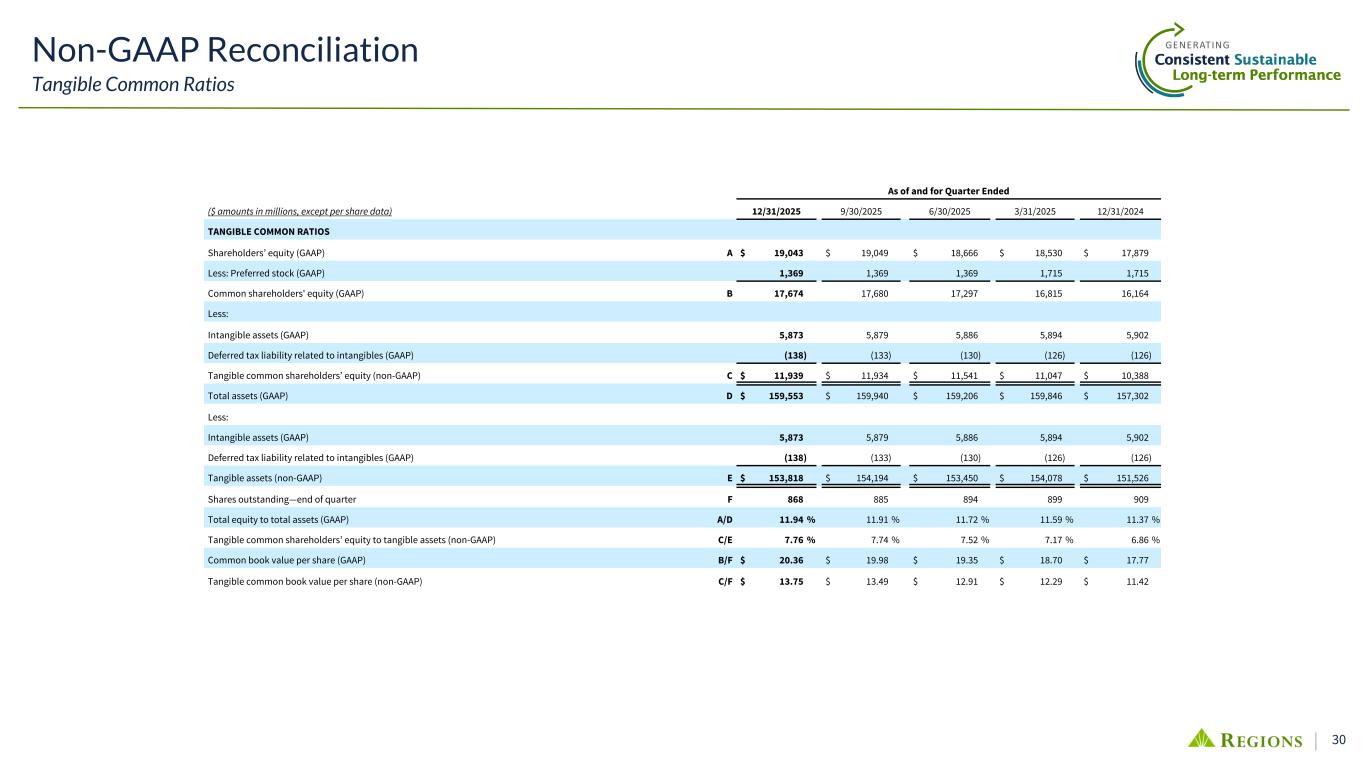
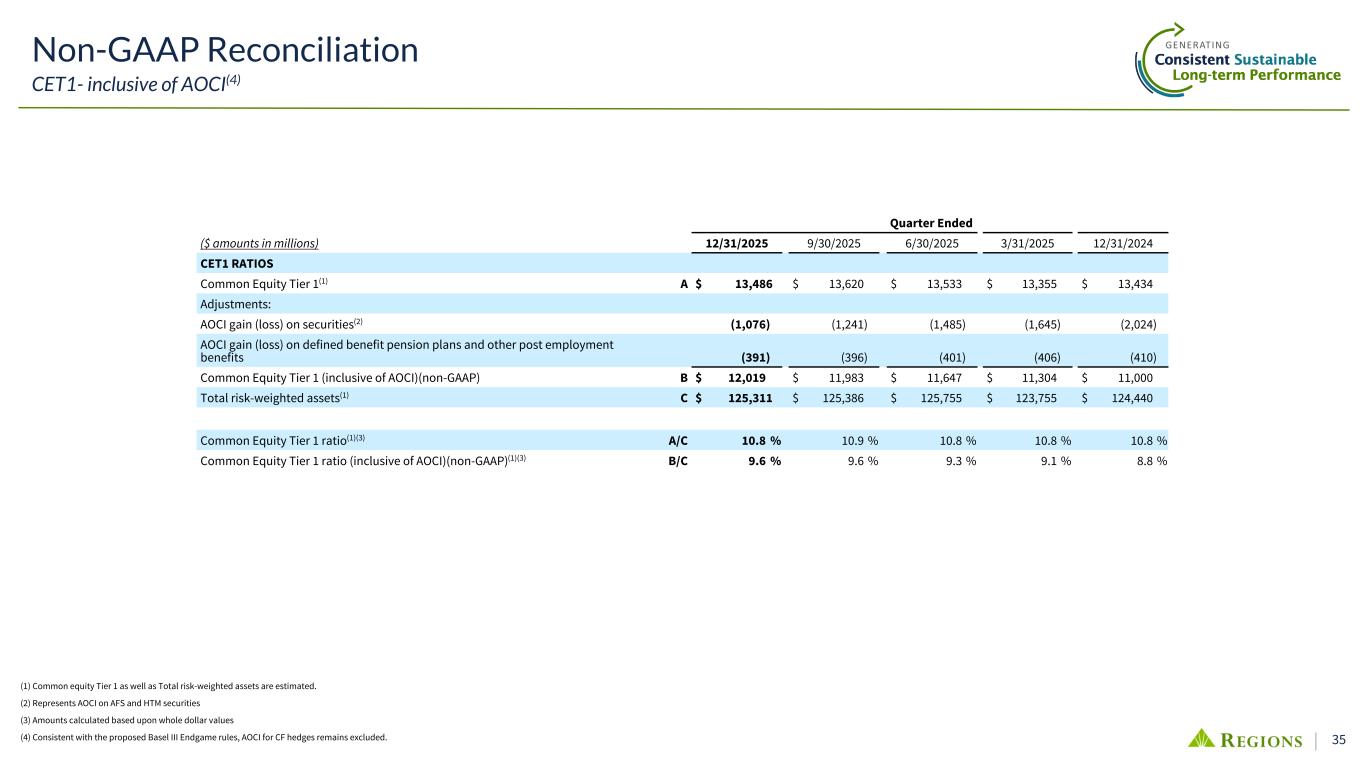
So we're at 9.6% on an adjusted CET1, adjusted for AOCI. Our range is 925 to 975, so we're right on top of that, have a little extra. And we're going to do exactly what Neal said, use it for loans and then buy it back if it's not there, if the loan growth is not there.
Well, thanks for that. And then separately, I guess you just give us your updated thoughts around M&A potential, a whole bank M&A, just get everything, obviously, because we know that there's a potential, you know, need for scale in certain businesses, certain markets, obviously, that, you know, you could argue is needed, you know, here. And then lastly, you know, just, I guess, the M&A window closed. How do you view it? What's your updated thoughts on that front?
Yeah, well, maybe I'll ask the last part first. The window clearly is open, but I don't think decision-making of any sort should be driven by whether the window is open or closed. I mean, ultimately, it ought to be about whether or not a transaction is in the best interest of the bank's shareholders. It's unchanged. We are in the marketplace. We do not suffer from fear of missing out at this point. We're going to continue to operate our business, execute our plan, transformation of our core deposit system and all that goes with that over the next 15 to 18 months and just continue to do what we've been doing.
Operator
Our next question comes from the line of Peter Winter with DA Davidson. Please proceed with your question.
Good morning. Thanks. Good morning. John, I wanted to ask about, you know, just overall banking. I mean, obviously, it's a very competitive business, but do you see risk of losing market shares as these bigger regional banks are coming into your markets, or is it really an opportunity in taking advantage of some dislocation?
Well, we think it's an opportunity. We, again, are in really good markets, core markets where we've been for 125, 150, in some instances 175 years, we have really strong brand, we have very good market share bankers that are well known in their communities and do a really good job taking care of our customers and we have an opportunity to grow in those markets and we are doing that. Separately, we're in growth markets. We talk about our eight priority markets where we have a chance to grow and last year about About 40 percent, as I said earlier, of our new commercial banking relationships were one in those markets. And so, you know, I view it as an opportunity to continue to grow. We're going to focus on our customers, on providing unique ideas and solutions to help them grow their businesses, whether they be businesses or consumers. We're going to take care of our customers, and I think we'll have an opportunity to grow our business and regardless of what the conditions are in the markets that we operate.
And then can you talk about where you are in the process of the modernization of the platform and maybe highlight some of the benefits from this initiative versus competitors?
We have worked through all the very difficult integration work and we've now entered the user testing phase, and that will go on for likely the next two plus quarters. We should, sometime in the third quarter, move to production and a pilot phase where we'll begin with a small cohort of customers piloting the system to ensure that it does everything that we believe it will do, and that will lead us to beginning a conversion of our customer base in early 2017, assuming everything continues to go as planned. Been really happy with the progress we're making. Team's doing a great job. It is a super complex and challenging effort, but we have been, as I said, really pleased with the effort and activity and the progress that we're making. To your question about the benefits to us, we think that will give us flexibility as where new products are ambition to be sound in that the system will be very contemporary in nature. We're not customizing any aspect of it, so we can continue to update the system as the vendor provides updates, and that will be super helpful to us. It also, I think, provide a really great experience, an omnichannel experience to our customers, and we think that that will be really, really important to convert, cleansing all your data, organizing your data in a way that we think there are a lot of benefits.
And, David, I'll add my congratulations to retirement. It's truly been very enjoyable working with you over these years.
Operator
Our next question comes from the line of Christopher Spahr with Wells Fargo. Please receive your questions.
Good morning. Thanks for taking the call. So my question is regarding the expense outlook and just looking at the headcount increase, the competition increase, a large regional bank basically kind of threw down the gauntlet earlier today talking about how they're kind of expanding to growth markets. And I understand that you're going to kind of defend your market share or try to grow that, but I'm just wondering, like, you know, how are you going to be able to keep costs kind of with inflation where it is and with higher headcount? And then the follow-up will be on the tech initiative and the increase in tech spend. I get it, where you are, but then you see kind of manage headcount lower through attrition. I'm just wondering your ability to do that and the timeline for that as well. Thank you.
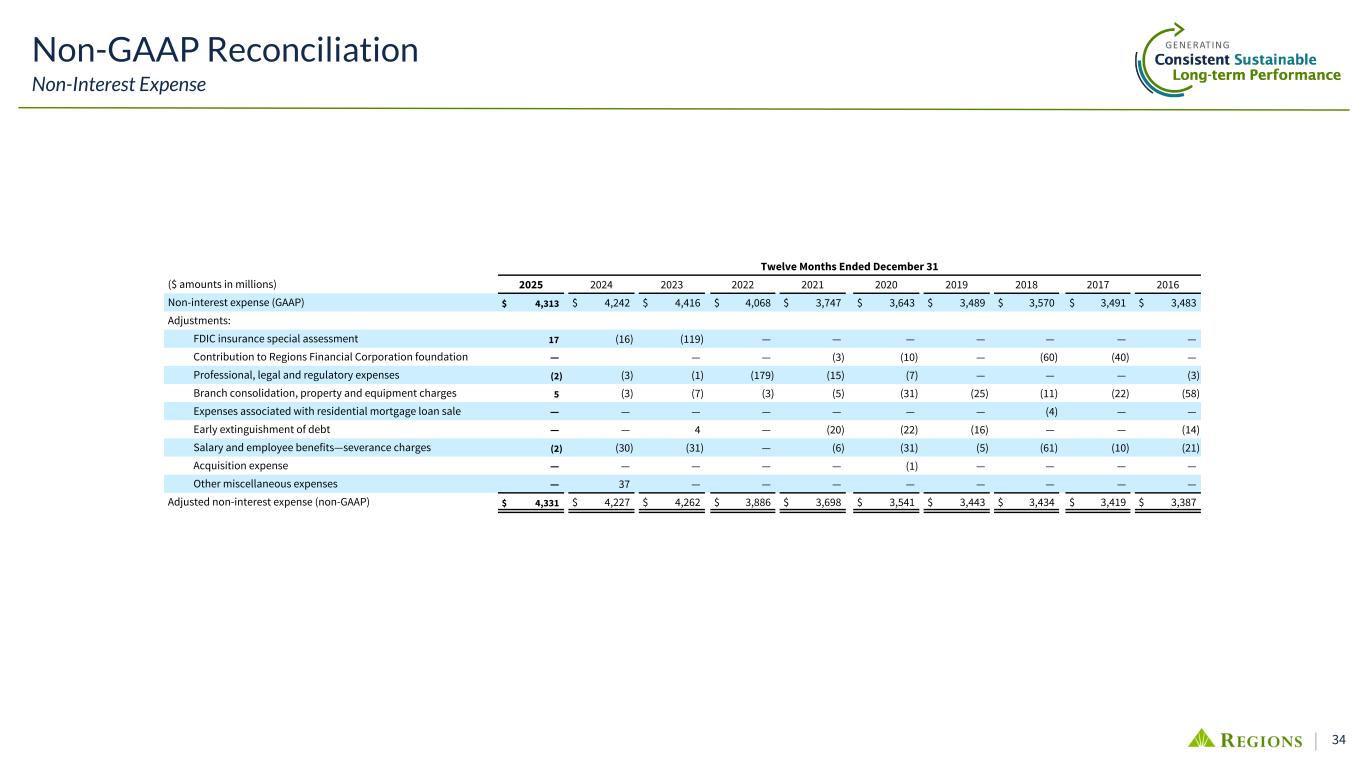
Yeah, thanks for the question. This is Anil. So it's an important question and something that we've been focused on for going back 10 years. There's always been important places where we need to invest in our business, whether it's in risk management, whether it's in security. And of course, growing our bankers is something that we've been very focused on over the past couple of years. We always have to find ways to fund that growth, and over the past ten years, you can see in our slide deck, our compound annual growth rate for expenses is 2.8 percent. So it's incumbent upon us every day to make sure we're making the right investments to grow revenue, making the right investments in technology, but also find ways to fund those investments. That's been a critical part of our history. It's something really important to us in our expense guide for the next year, and it's evident in our commitment to positive operating leverage. So it's something we've seen before, and it's something that we continue to execute day in and day out.
Operator
Our next question comes from the line of David Chavarini with Jefferies. Pleased to see with your question.
Hi, thanks. So I had a follow-up on loan growth and the pace of hiring. So you mentioned about hiring 120 bankers over two years. You did 50 in 2025. I'm curious, you know, how does this pace compare to the prior, say, three to five-year trend, and do you expect incremental hiring above this pace as you take advantage of the M&A disruption?
Yeah, so it would be a bit of an uptick in hiring, I would say, over the previous, I think your time frame was three years and reflects our – double the pace, I would say, reflects our commitment to, again, growing primarily in these primary markets where – or priority markets where we see opportunity. With respect to incremental hiring, one of our expectations of our leaders in our markets is that they're constantly recruiting and identifying who the best bankers are in the markets that they operate in. And so to the extent that we find an opportunity to hire a banker or a team of bankers who are recognized in their markets as being really good at what they do, and we think they'd be a great addition to the region's team, I expect our teams will recruit them to come to work for us, whether they're included in the 120 targeted bankers or not. So we're actively looking for bankers all the time who can provide great service to our customers and be additive to our teams.
Great, thanks for that. And as we think about the guide of low single digit for 2026. As the headwinds subside, it sounds like borrower sentiment is improving. Pipelines are up significantly. You're mostly through the runoff. Is this low single digit this year kind of a step function to mid single digit looking out to 2027?
I think that's reasonable to assume. We're not, we haven't committed to that yet. Dana won't let me provide any guidance beyond 2026, But I think you can expect momentum to continue to – we expect momentum to continue to build in our business, particularly as we're recruiting more talent and we're benefiting from the opportunities that are in our markets.
Great. Thanks for that. And, David, congrats on your retirement. Thank you. I appreciate it.
Operator
Our next question comes from the line of Ibrahim Poonawala with Bank of America. Please proceed with your question.
Good morning. Hey, good morning. I guess just one, a couple of follow-up questions. One, on the systems conversion, John and David, I'm not sure if you mentioned when this will all be completed, and in the meantime, does it restrict your ability to do something? I heard your comments around M&A earlier, but if you wanted to, does it sort of restrict that flexibility in the meantime or not?
We expect to be completed toward the latter part of 2027, and I would say, technically, it does not restrict our ability to win a transaction. Practically, it would be very challenging, we believe. So, that is a factor, and certainly in how we think about how we're positioned relative to.
Got it. And just one follow-up on the loan growth front. And when we think about just the tariff uncertainty and maybe the Supreme Court's going to rule on this next week, do you think that may materially change sort of sentiment among your customers when they think about borrowing and investing, or do you think they have enough clarity today to kind of move forward with expected plans?
We think they have enough clarity. I don't hear and don't talk with many customers who are overly focused on that topic now.
Got it. Anil, congratulations, and David, all the best. Look forward to seeing you soon.
Thank you. Thank you so much. Appreciate it.
Operator
Our next question comes from the line of Betsy Grasik with Morgan Stanley. Please proceed with your question.
Good morning. Hi, good morning. David, I'll throw in my comments, too. Thank you so much for the time and insights over the years and I hope that wherever retirement takes you you have a fantastic and enjoyable time thank you Betsy I really appreciate it and Anil look forward to working with you I do just have a two short follow-ups one is just on the net interest margin as you discussed way earlier in the call you know starting you know coming in in 1q similar to where we are today and then dipping down a bit and then you know ending the year roughly where we are today if I have that right I'm just wondering what is the dip down a function of and how low does it go during that pressure point yeah I think
so first off we need a level set where we finish so we had about four basis points of nim in there through things that won't that we are counting on repeating interest recoveries being one in the HR asset dividend which was unusually high. We always have a little bit of that. Doesn't mean we won't have an interest recovery. We just don't count on it. So that's four basis points. So we start with 366. We think we'll finish the first quarter at 370 and it'll inch up from there throughout the year and maybe we get a few more points on top of that. Somewhere between the low 370s and the mid 370s perhaps. And that's assuming, you see our assumption is that we have that mid-30% beta expectation in our loan growth and low single digits I think would be important and you know and we have we don't have any big changes in the in the 10 year in particular as we get repricing fixed asset repricing benefits okay great thank you and then on the John you talked about the tech spend going from 9 to 11 percent of res to 10 to 12 and that that offset would be headcount, and I'm just wondering, is that expected to be managed in a way that the tech investment spend and the headcount offset each other in each quarter, or should we expect any
kind of expense ratio changes as you're going through this? Which sounds like normal force, but you tell me.
Yeah. Bets, we don't have any big initiatives planned. Again, as I think Anil pointed out, one of the, we believe, strengths of the company is how effectively we've managed our expenses over the last 10 plus years and so we're always looking for opportunities to improve. There are areas that are probably obvious to you where there we believe there's opportunity for improvement and use of technology which will result in a reallocation of headcount more than likely into places where we have a chance to support growth. So we'll manage Over time, again, as the opportunities develop, it won't be part of a broad, one-time initiative.
Betsy, that comment was meant to be a very broad comment. It was not to be a backhanded way of saying we're going to have volatility in our quarterly expense structure because of it. So don't read that.
Sounds good. Thank you. Appreciate it.
Operator
Our next question comes from the line of Chris McGrady with KBW. Please proceed with your question.
Good morning. Oh, good morning. Hey, good morning. I'm interested in your trends in consumer checking account growth. That's been a big focus for the larger banks this quarter and the number of accounts are With your exceptional retail deposit base, can you just talk about trends in new account Yep.
We're seeing nice growth in consumer checking accounts. Once again, our focus is on a core consumer checking customer, one that is going to have a direct deposit with us, is going to actively use their debit card and use their checking account. That is our history. That is the source of our very loyal, low-cost deposit base, and that's what we're continuing to focus on growing. We have seen a nice increase in digital originations. So as we have developed our digital capabilities, our mobile banking platform has continued to improve, and we're seeing additional enhancements to our growth initiatives as a result of have a direct deposit with us for us to count on a, you know, a new, oh, yeah, well, I should say also we just introduced a new capability allows a customer to pretty easily move their direct deposit from a competitor to regions, which has resulted in, I think, a nice increased some uptick in activity.
Great. And just a finer point on the tech question, the 10 to 12, is that a kind of a one-year catch-up, or is that kind of a new level set, and then you've been at 9 to 11 for a bit Yeah, we'd say that's a new level set.
We've been running at about 11, so the upper end of that 9 to 11 range, so we've shifted Thank you very much.
Operator
Our next question comes from the line of Erica Najarian with UBS. Please proceed with your question. Good morning. Thank you so much. Good morning. Actually, most of my questions have been asked and answered, but maybe just one for Anil, since you're on the line. You know, could you give us a sense of when you take over and fill these very large shoes that David has left for you, what would you tell investors your sort of top three priorities these are as you take on the role?
Yeah, first, it's great to step in to the role with the stability that we have. You know, we have a great strategic plan that John has outlined and the board's approved, and it's critical for us to continue to execute that. It's nice to come in when you're performing very well. It's incumbent upon us to continue to do that, and David has built a phenomenal team in finance, great partnerships with our businesses, and that is job number one, two, and three, is to continue on the great path we've been on, execute our plan, and to continue to deliver.
Operator
And, David, you'll be missed, but I'm sure investors won't miss you smoking them on the golf course, and it's scary to think that you're actually potentially going to get better and lower your handicap.
I'm going to work on my footing.
Operator
So congratulations and welcome again, Anil. Thank you very much. Our final question comes to the line of Matt O'Connor with Deutsche Bank. Please proceed with your question.
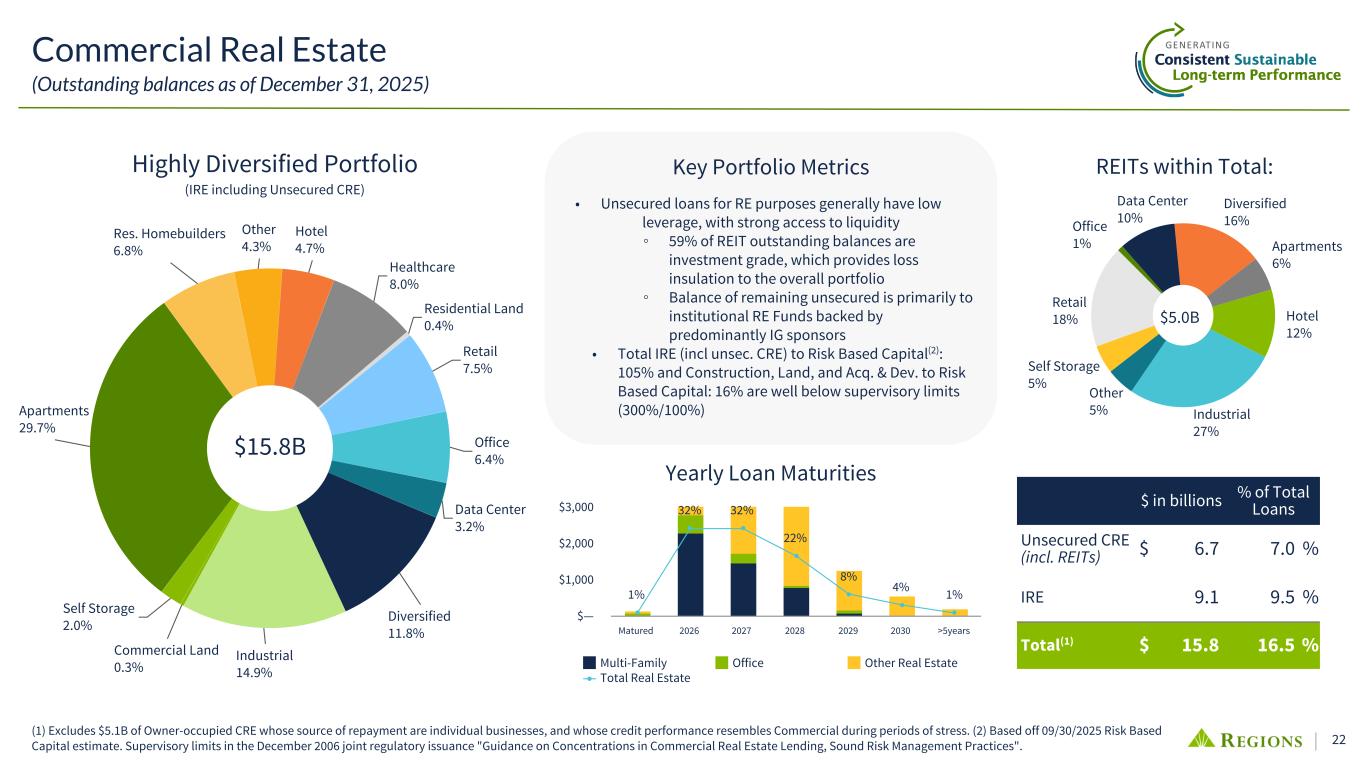
Good morning, Matt. I was hoping you guys to talk about your leverage for the recovery in commercial real estate. Obviously, there's the credit aspect of it. You've been pretty clear about being past the worst there and being well-reserved for remaining office losses. But as you think about from a loan volume perspective, obviously, we're seeing industry loans in fact. It does seem like there's more and more momentum building. So how do you think about that leverage? You do have a good slide in there showing a lot of maturities coming the next couple of years, which is the case for the industry. So is that upside risk as we think about growing loans overall, or is there a risk that more of the CRE loans get refried away from you in the expected?
Yeah, I mean, we've, so we've been very successful, you know, when things mature to being able to refinance those. The rate environment is helping a bit more on growth in that space, and in particular in multifamily because we've been able to, you know, as rates have come down, the math is starting to work. So before the rates came down, we were demanding more of a down payment to make the math work for us, but that didn't happen with the developers. So now it's coming into equilibrium. We're seeing demand for the for multifamily we're seeing more opportunity there and yes we had de-risk commercial real estate over the years but that is not constraining our ability to grow when we get paid for the risk that we take and so hopefully we'll have the opportunity to grow over time I just add Matt we business that we will
continue to invest in we'll continue to see it grow and and it will be an Okay, thank you very much. Thank you. Okay, that's all our call today. Thank you very much for your participation and your support of Regents. We appreciate it. And everybody, congratulations. I'll add my congratulations to David Turner. He's done a great job for us here. He's been a really important member of our leadership team. We will miss him and his sense of humor but are excited about Anil and his filling the role as CFO. So thank you again for your participation. All the best.
Operator
Today's teleconference. You may disconnect your lines at this time.