Operator
Good morning and welcome to the Renaissance Corporation 2026 First Quarter Earnings Conference Call and Webcast. All participants will be in listen-only mode. Should you need assistance, please signal a conference specialist by pressing star then zero on your telephone keypad. After today's presentation, there will be an opportunity to ask questions. To ask a question, you may press star then one on your telephone keypad. To withdraw your question, please press star then 2. Please note this event is being recorded. I would now like to turn the conference over to Kelly Hutchison, Executive Vice President and Chief Accounting Officer with Renaissance Corporation. Please go ahead.
Good morning, and thank you for joining us for Renaissance Corporation's quarterly webcast and conference call. Participating in the call today are members of Renaissance Executive Management Team. Before we begin, please note that many of our comments during this call will be forward-looking statements which involve risk and uncertainty. There are many factors that could cause actual results to differ materially from the anticipated results or other expectations expressed in the forward-looking statements. Such factors include, but are not limited to, changes in the mix and cost of our funding sources, interest rate fluctuation, regulatory changes, portfolio performance, and other factors discussed in our recent filings with the Securities and Exchange Commission including our recently filed earnings release which has been posted to our corporate site www.renaissance.com at the press releases link under the news and market data tab we undertake no obligation and we specifically disclaim any obligation to update or revise forward-looking statements to reflect changed assumptions the occurrence of unanticipated events or changes to future operating results over time. In addition, some of the financial measures that we may discuss this morning are non-GAAP financial measures. A reconciliation of the non-GAAP measures to the most comparable GAAP measures can be found in our earnings release. And now, I will turn the call over to our President and Chief Executive Officer, Kevin Chapman.
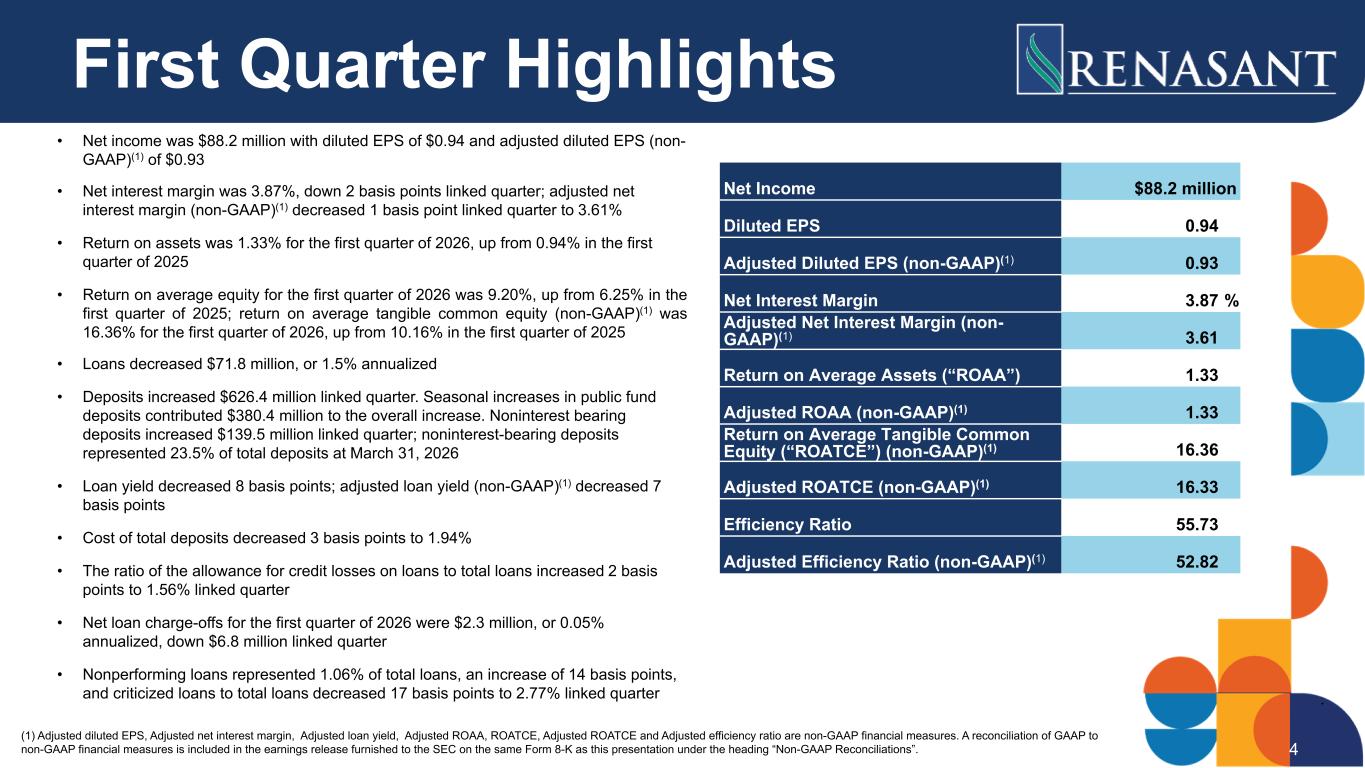
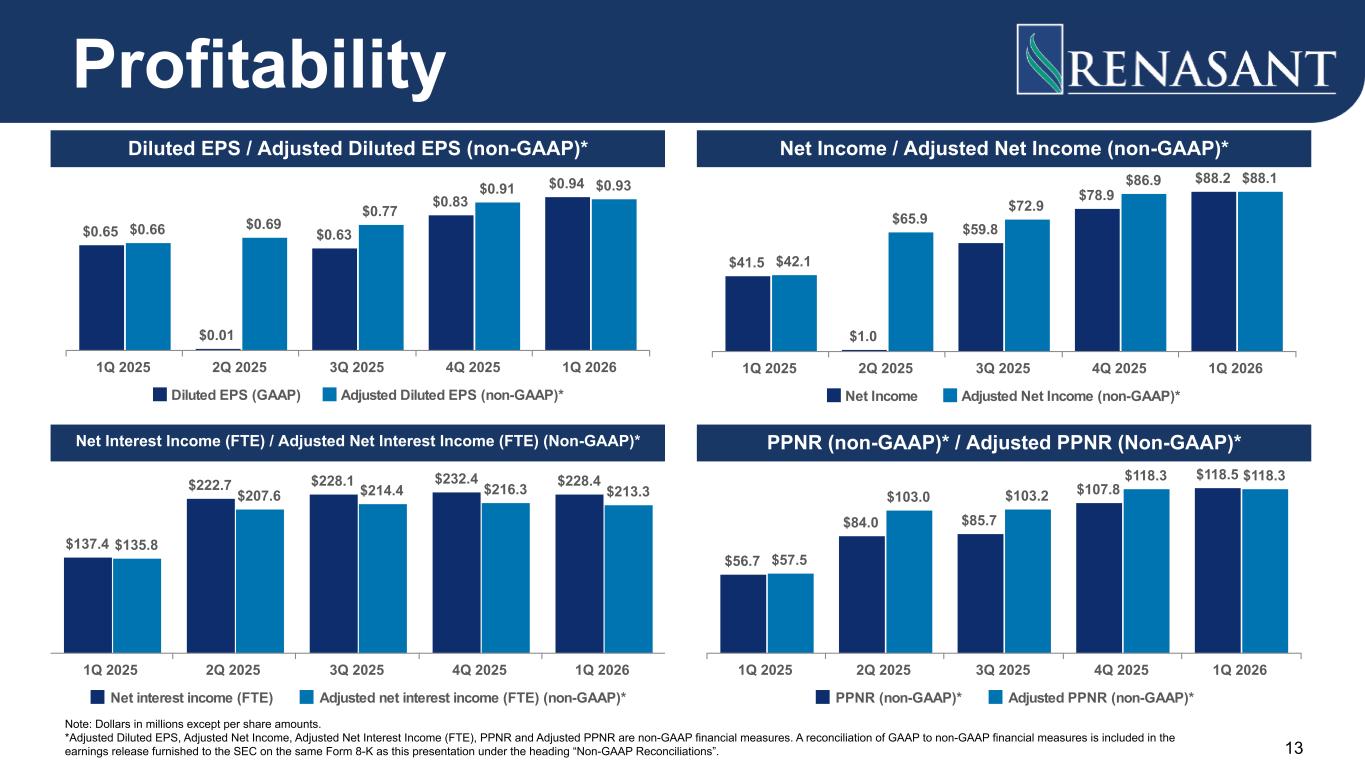
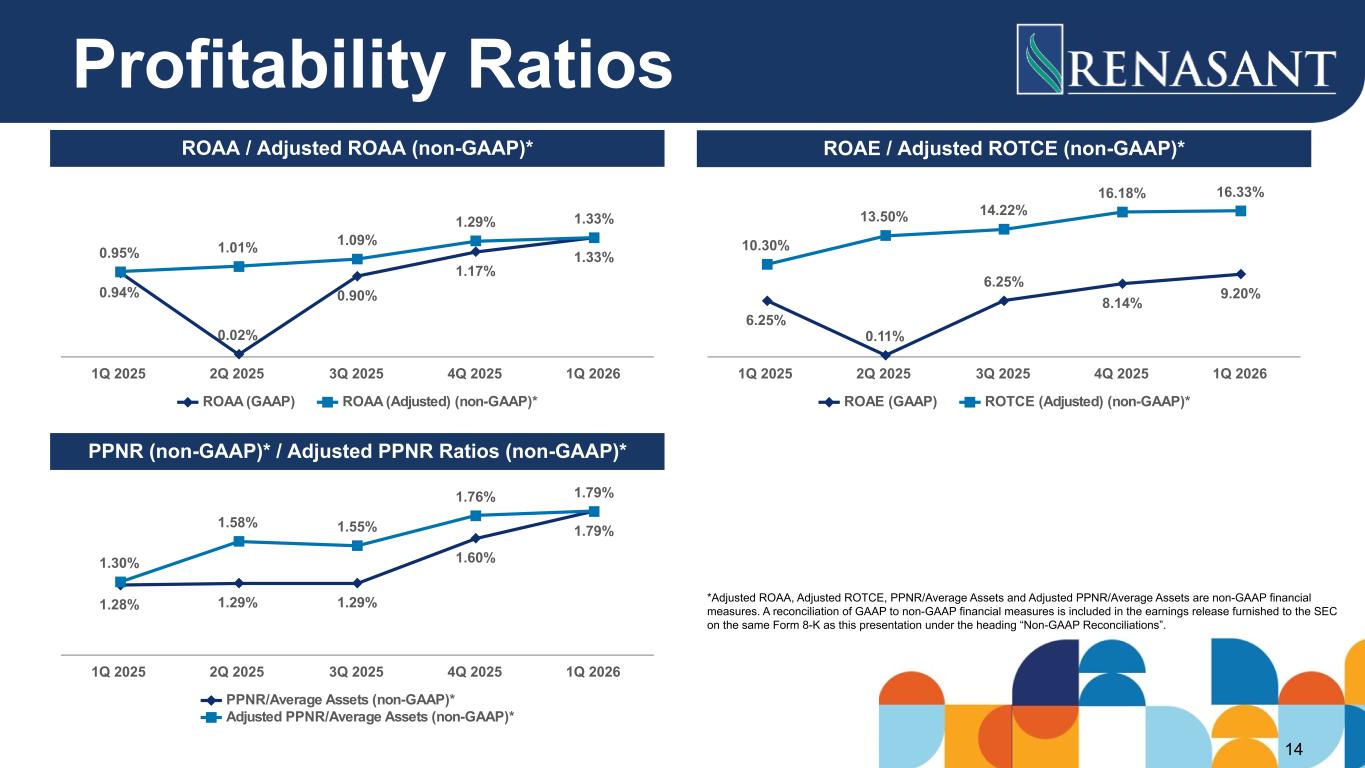
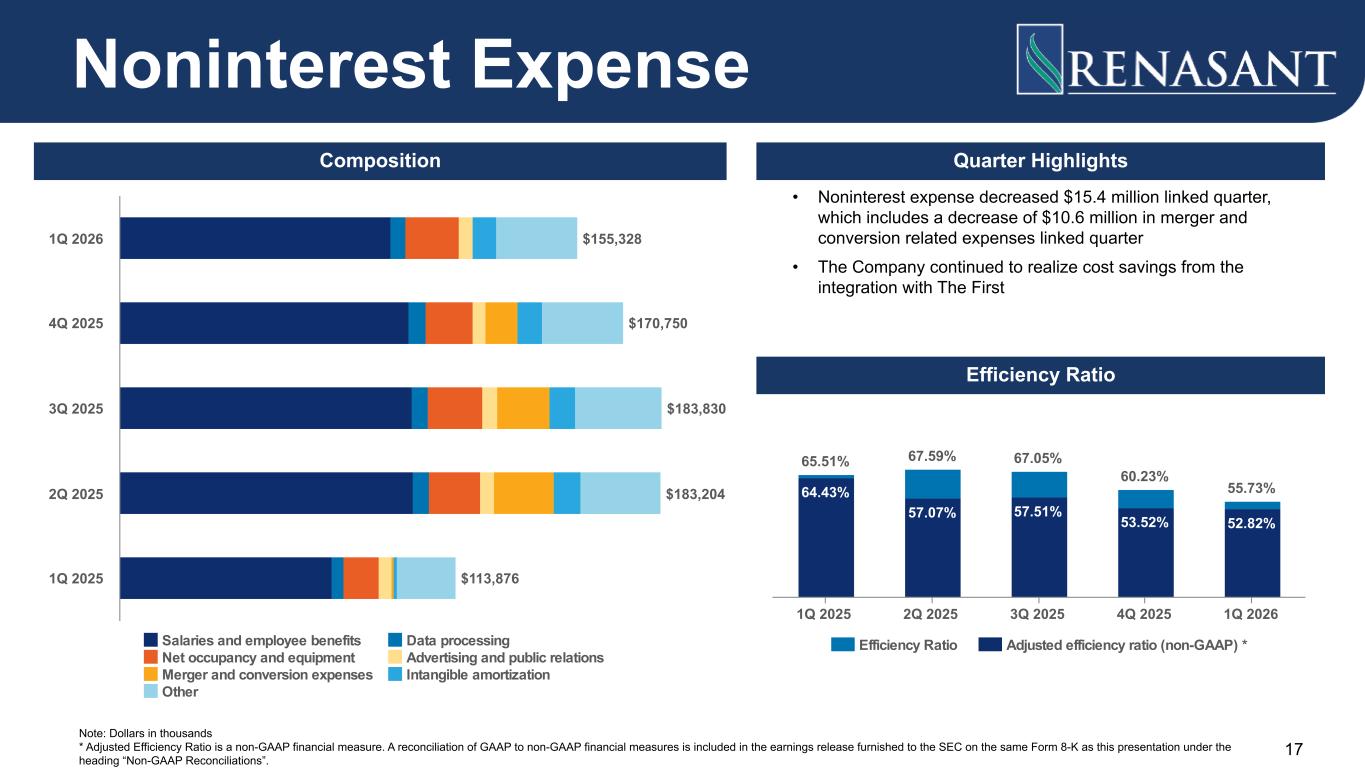
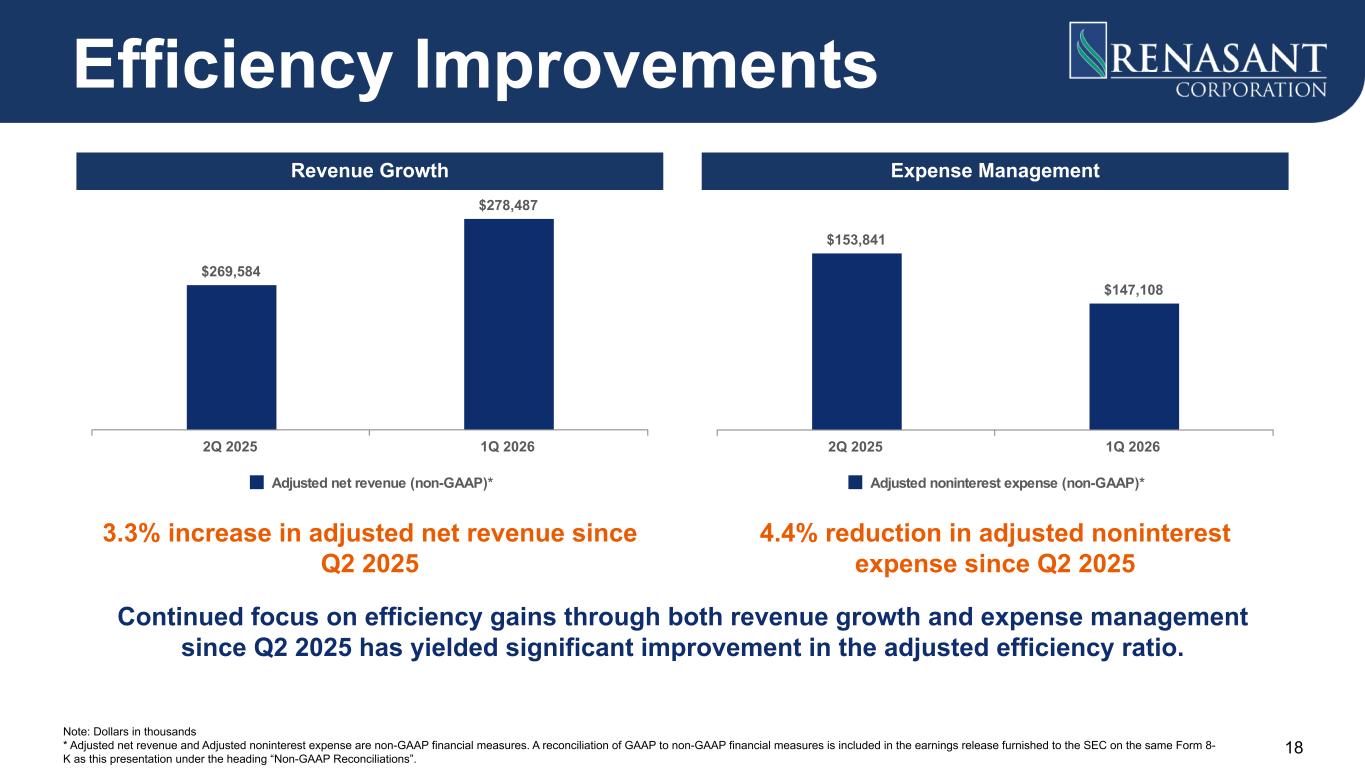
Thank you, Kelly, and good morning. Two years ago, we challenged ourselves by setting aspirational goals to improve our financial performance. At that time, we targeted the first quarter of 2026 as a key measuring stick that would show the financial benefits of our work. Frankly, the strong results for the first quarter exceed our goals. Adjusted earnings per share were 93 cents in the first quarter, representing a 41% increase year over year. For the quarter, adjusted return on assets grew from 95 basis points in 2025 to 133 basis points in 2026. Our adjusted return on tangible equity grew from 10.3% to 16.3%. And last of all, the efficiency ratio improved from 65.5% to 55.7%. I am extremely proud of our team's accomplishments to remain customer-centric while we went through our largest merger, conversion, and integration. As we move forward, the Renaissance team is engaged and focused on the priorities for our company to continue to grow customer relationships and hiring talented bankers. I will now turn the call over to Jim to give more details on the financial results.
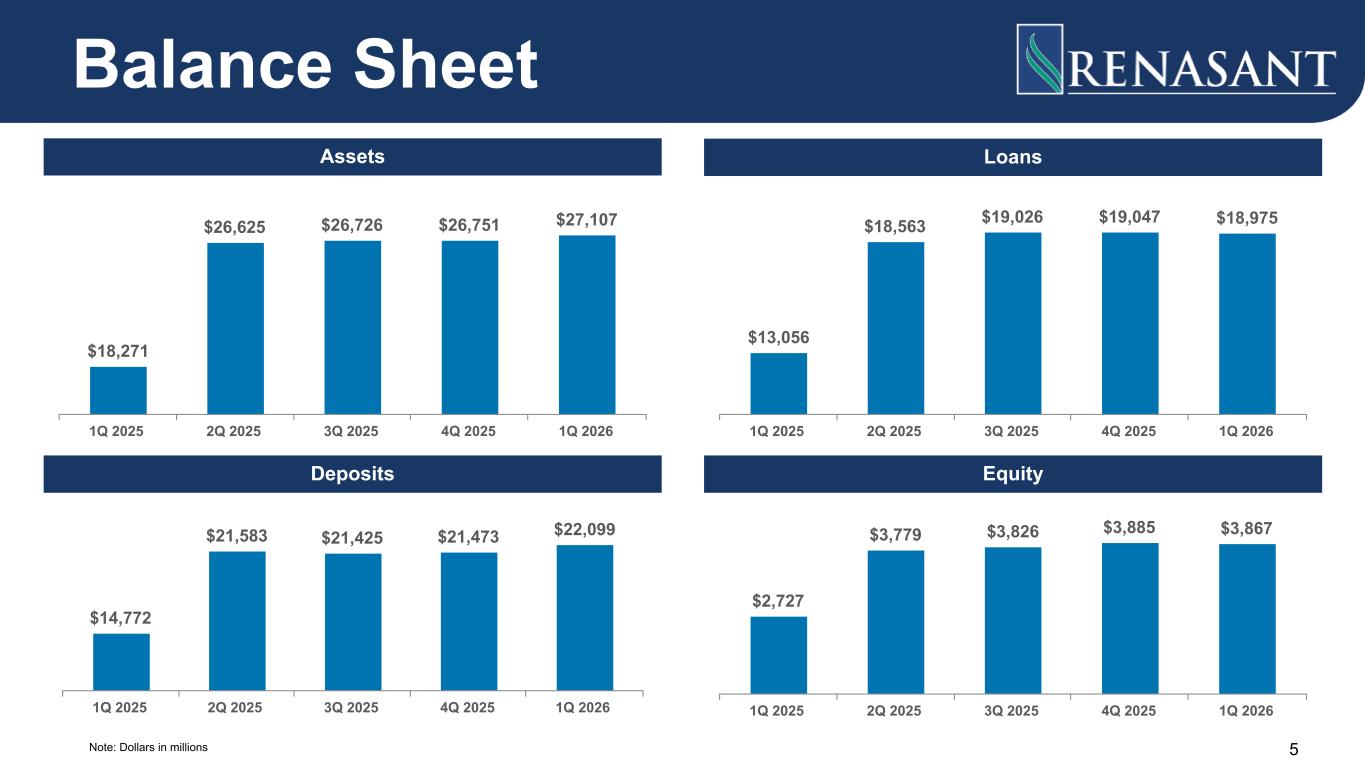
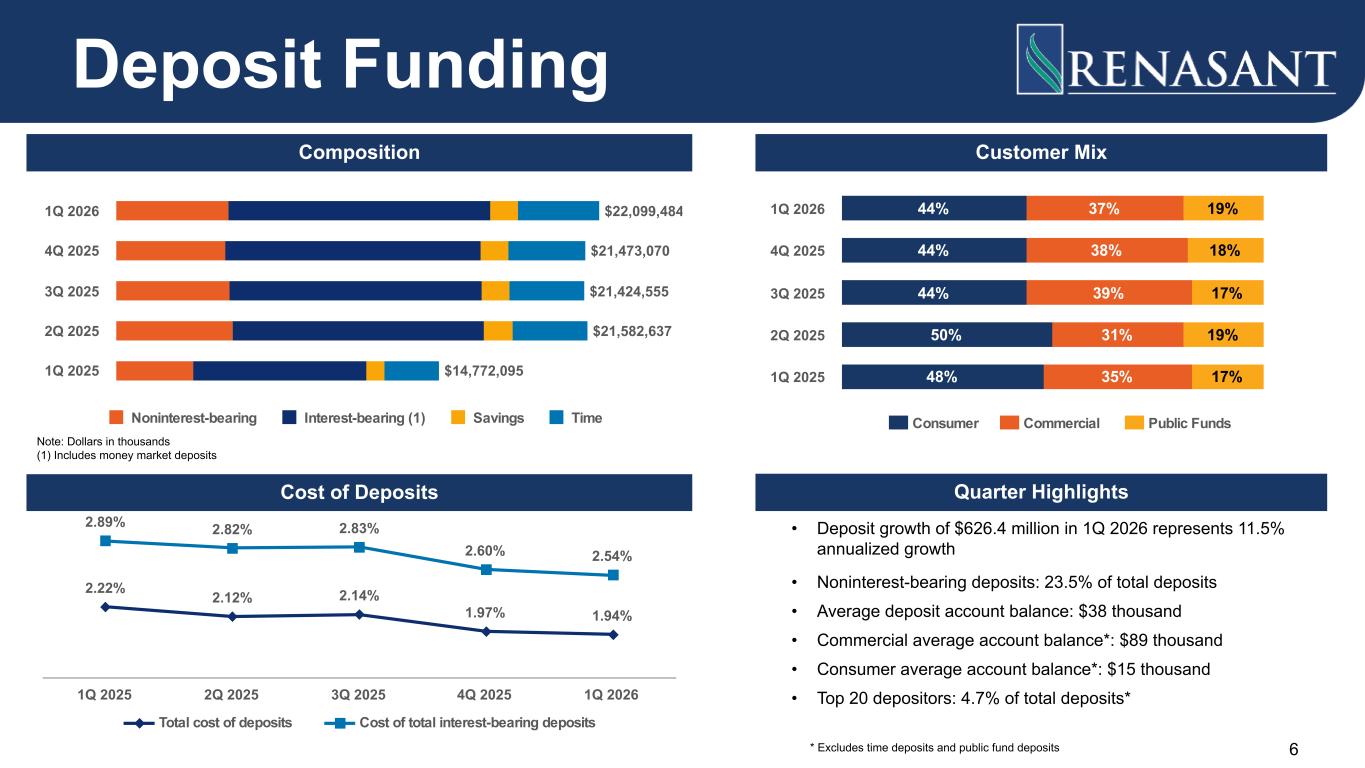
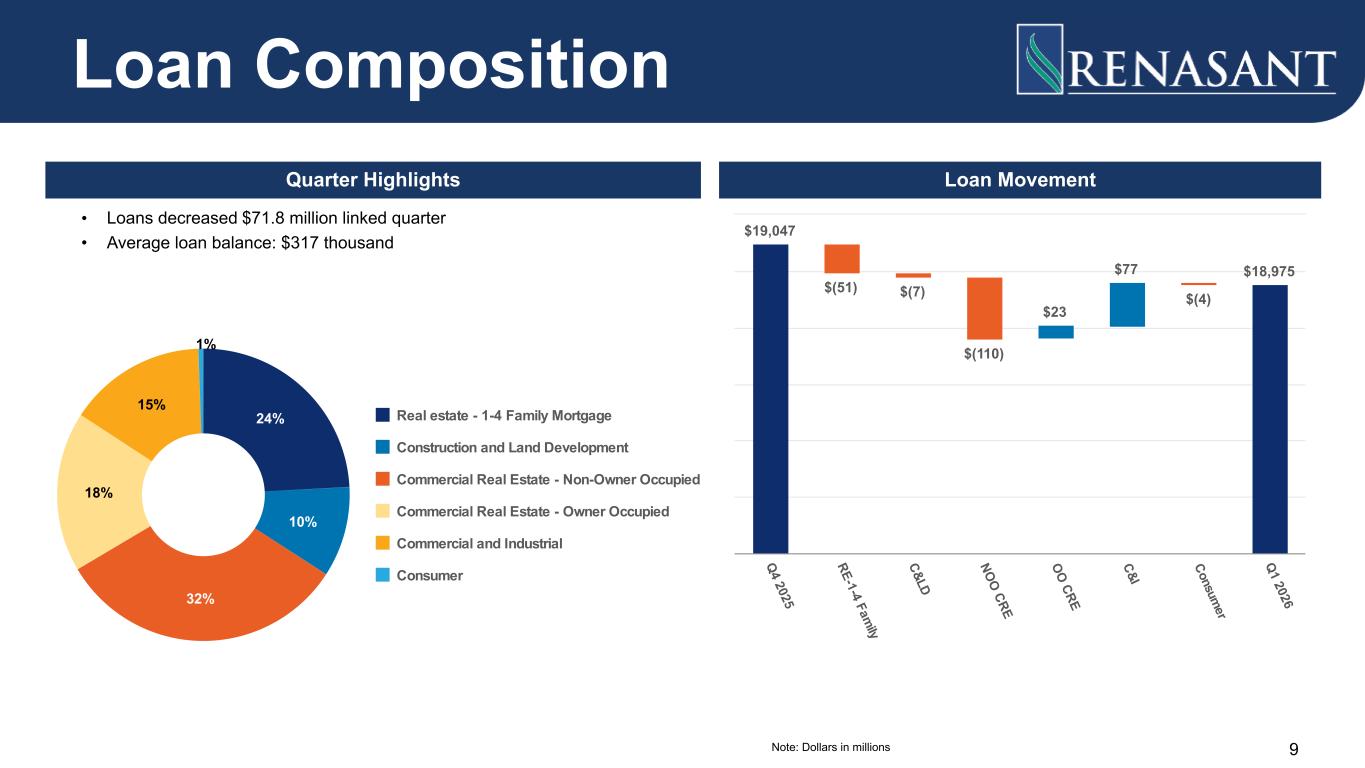
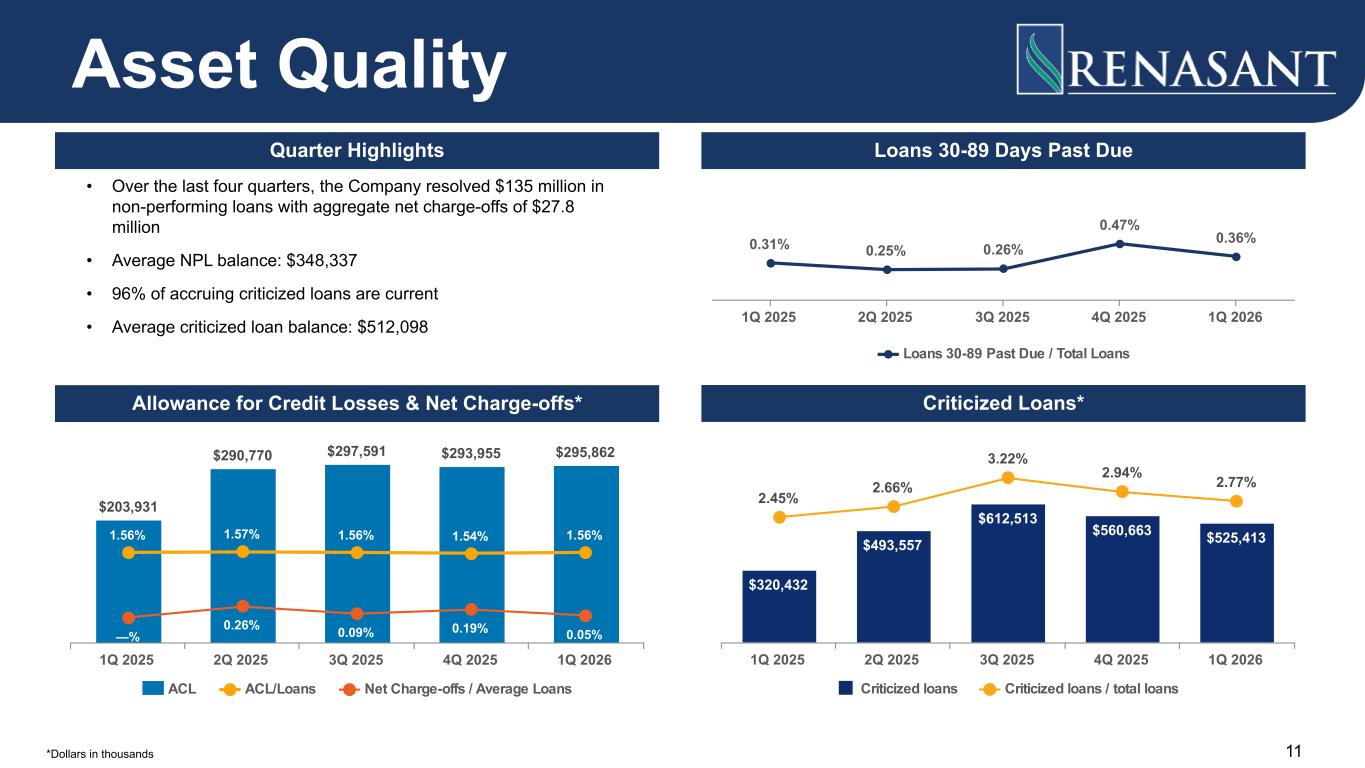
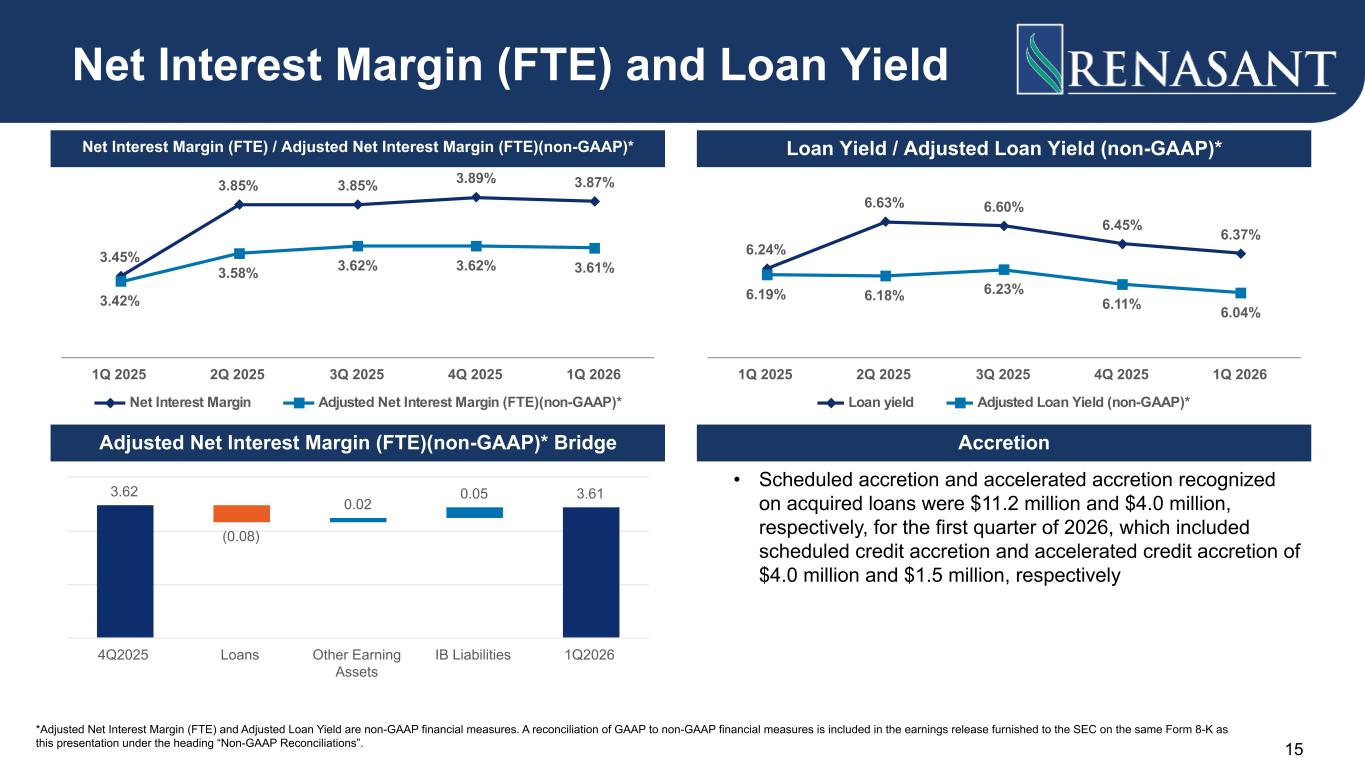
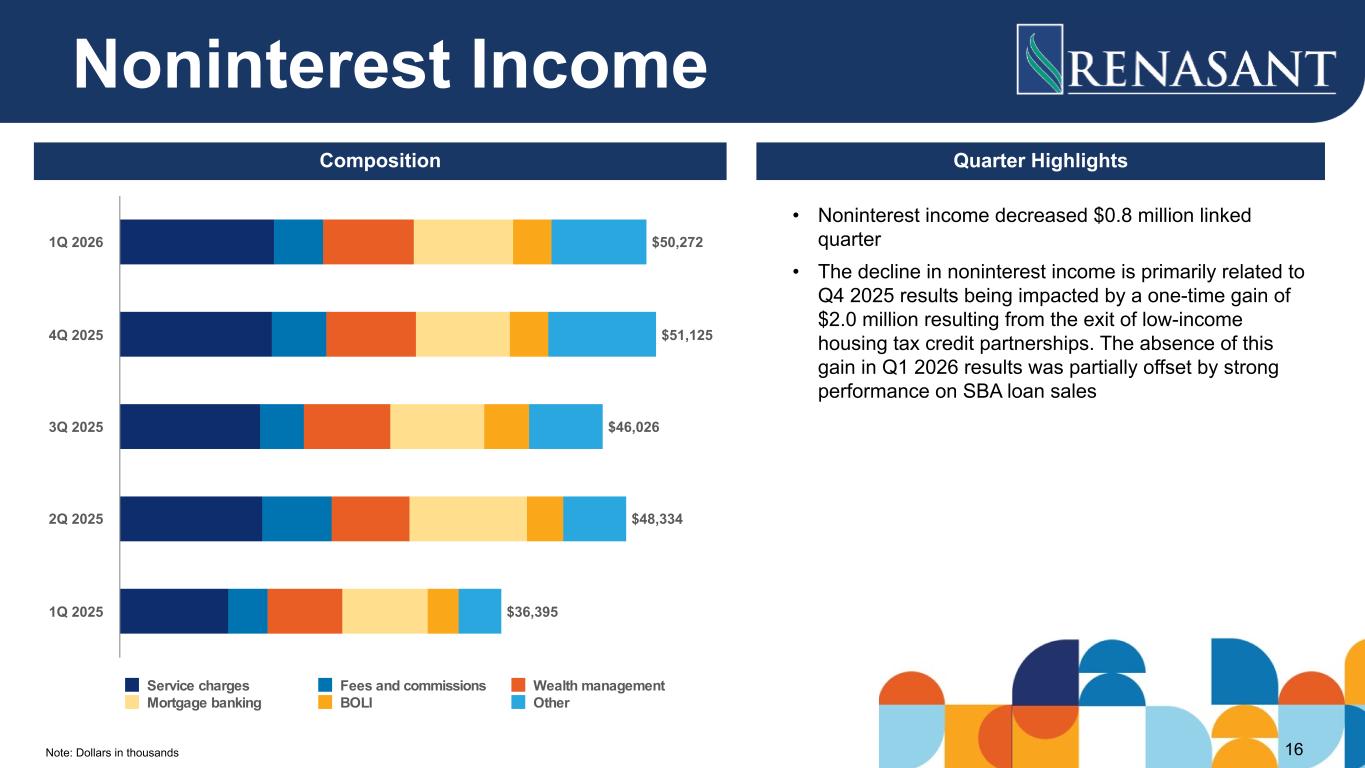
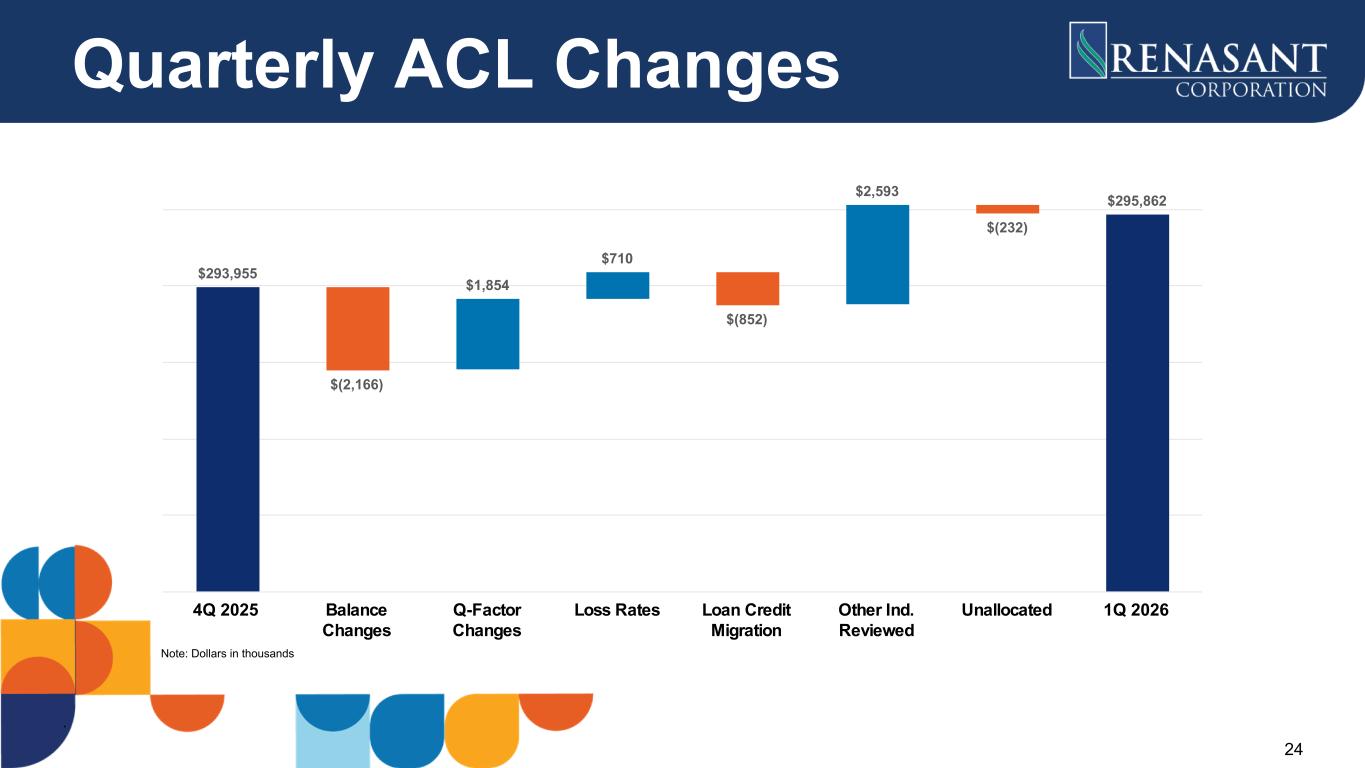
Thank you, Kevin, and good morning. Looking at the balance sheet, loans were down $71.8 million on a linked quarter basis, or 1.5% annualized. Deposits were up $626.4 million from the fourth quarter, or 11.8% annualized. Reported net interest margin decreased two basis points to 3.87%, while adjusted margin decreased one basis point to 3.61% on a linked quarter basis. Our adjusted total cost of deposits decreased 3 basis points to 1.94%, while our adjusted loan yields decreased 7 basis points to 6.04%. From a capital standpoint, all regulatory capital ratios remain in excess of required minimums to be considered well capitalized. We recorded a credit loss provision on loans of $8.1 million, comprised of $4.2 million for funded loans and $3.9 million for unfunded commitments. Net charge-offs were $2.3 million, and the ACL, as a percentage of total loans, increased two basis points, quarter-over-quarter, to 1.56%. Turning to the income statement, our adjusted pre-provision net revenue was $118.3 million. Net interest income decreased $3.8 million quarter over quarter. Non-interest income was $50.3 million in the first quarter, a late quarter decrease of $0.9 million. The decline in non-interest income is primarily related to the recognition in the fourth quarter of a one-time gain of $2 million resulting from the exit of low-income housing tax credit partnerships. The absence of this gain in the first quarter was partially offset by strong performance on SBA loan sales. Non-interest expense was $155.3 million for the first quarter. Excluding merger and conversion expenses of $10.6 million in the fourth quarter, this is a late quarter decrease of $4.9 million. I will now turn the call back over to Kevin.
Thank you, Jim. We believe that Reneson is uniquely positioned to capitalize on organic growth opportunities. We appreciate your interest in Reneson and look forward to further discussing our results with you this morning. I will now turn the call over to the operator for questions.
Operator
Thank you. We will now begin the question and answer session. To ask a question, you may press star than one on your telephone keypad. If you're using a speakerphone, please pick up your handset before pressing the keys. If at any time your question has been addressed and you'd like to withdraw your question, please press star then 2. At this time, we will pause momentarily to assemble our roster. The first question comes from Michael Rose with Raymond James. Please go ahead.
Hey, good morning, guys. Thanks for taking my questions. Just wanted to start on expenses. Obviously, you know, a lot of hard work has been done on the first cost savings, you know, and the step down was maybe a little bit better than I think you guys had talked about, you know, last quarter. You know, maybe, Kevin, if you can just give us kind of an update on, you know, where the merger cost savings stand. I would assume that you've got most of them at this point, but wanted to see if there's anything left. left. Maybe you can also talk about kind of the reduction in employee headcount that you've had and, you know, if we can, you know, kind of assume that, you know, that there'd be a little bit of growth off of this 155, you know, rate that we saw in the first quarter. Just trying to get, you know, kind of a near-term outlook. Thanks.
Michael, it's Jim. I'll start, and I'm sure kevin will add some color but we're really pleased with what's happening in that in that line item and we we it's been a focus as you know for the company for for a number of years and we started to see the uh you know real progress beginning call it 18 months ago even before we started to see the benefits from the merger with the first we could see it start to bend down so that's that's been a focus and remains a focus in terms of uh where we go from here i mean as you point out we We hit our goals with respect to expense saves from the first, so very pleased with that. I don't see a lot of savings associated with the merger from this point on. I think we realize most of those expense saves. That's not to say that we can't do more just as a company as a whole, but I think expense saves that are truly related to the merger are pretty much in this run rate. Looking forward, I guess there are a couple things. So we will have merit increases, obviously, in the second quarter, and there's a day count factor as we look to Q2 and beyond. But I think we do have those things which will cause expenses to drift up moderately. The other variable, and this is probably something Kevin should speak to, but we have seen and are seeing opportunities to hire. As you know, there's a lot of dislocation going on in the marketplace. And so we have seen that already and expect to see more of it. I would say that's the part of the picture on NIE that will be a little hard to predict. And, Kevin, please add to that.
Thank you, Jim. And, Michael, good morning. I'll just add, you mentioned about the headcount. So if you go back to June of 24, which we announced the merger with the 1st in July, but if you look at just our combined FTEs, we were just shy of 3,400 employees. If you just take us plus them, that's what our FTEs were. At 331, that number will be about 2,950. So we've carved out 420 employees over that time period. Not all of them were due to the cost saves or the merger. Prior to that, Renaissance was highly focused on accountability and ensuring that we had the right team for what we wanted the goals to be. So I agree with Jim that our cost save number we've achieved, but the accountability measures and the requirements to be higher performing at Renaissance haven't changed. And so we'll continue to focus on that, find incremental ways to improve costs, to reallocate expenses, to higher-performing endeavors. That effort will not change, but that didn't occur because of the first. That was happening long before that. Jim also mentioned the new hires. I think one thing that is hidden in the focus on expenses that we've had over the past couple of quarters is the hiring we've been doing. The cost saves and the expenses where they land today, that includes new hires that we've been making all along the past several quarters. In Q1, we hired 18 revenue producers. In Q4, we hired six. And in Q3 of last year, we hired nine. So if you look at the real cost saves associated with the merger, associated with accountability measures, it's much deeper than optically what we're showing in the numbers. But we're extremely excited about the hiring opportunities we have, the market dislocation. That is giving us the opportunity to have conversations with extremely talented bankers all throughout the Southeast. And I think we've said it in the past, you know, we kind of grade out, you grade out your employees, A, B, C, D, and F. I think we've said this, that we will always hire A-rated talent when they're available. and maybe I'll say it a little bit more pointedly, we won't flinch at the opportunity to hire A-rated talent. And we're seeing that opportunity all around us right now.
That's great, Tyler. So I'm not trying to pin you down, but just as a starting point, it sounds like with the puts and takes, maybe a couple million bucks higher in the second quarter is what we could expect, or is that fair? Just trying to better appreciate, you know, kind of a starting run rate with the, you know, the seasonality aspects.
I would say this, that from Q1, probably a low single-digit percent increase, and that factors in some of the hiring Kevin's talking about, but that's the variable that's hard to predict because, as Kevin points out, we see opportunities to be opportunistic, and we intend to pursue those.
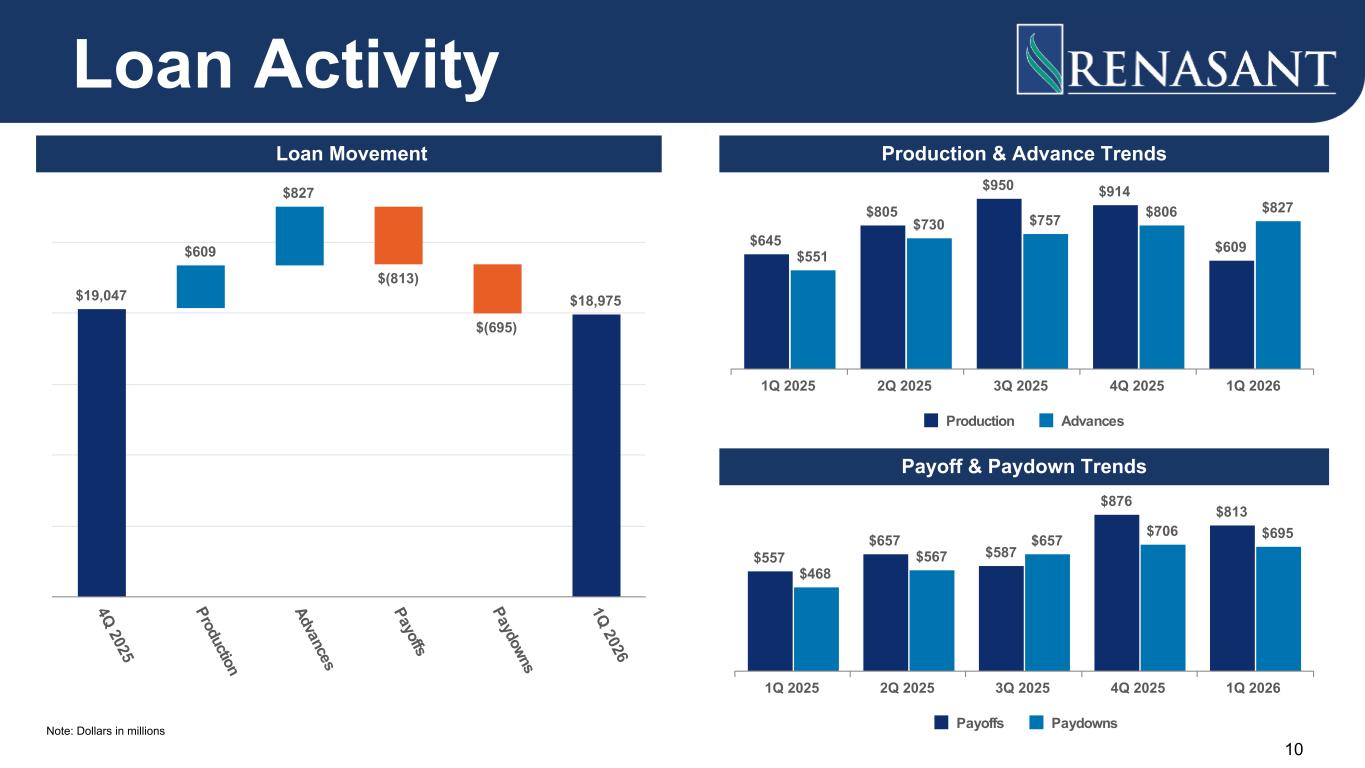
So that's the piece that, Michael, is a little tough to forecast, but at its base, I would give you that that um day count and merit you know is probably call it i don't know um low single digits and then we'll see what uh comes from the hiring which will add to that perfect um appreciate that uh jim um maybe just as a follow-up um you know i think the the the one thing you point to this quarter is just um you know the the loan contraction i think you guys did a good job kind of you know laying that out um it does it does look like the the production was down maybe a little bit more than I think maybe some of us would have expected in down year over year as well, despite the addition of the first. Maybe you can just, you know, maybe update, you know, loan growth expectations from here. I think last quarter, you kind of talked about, you know, mid-single digits for the year. That could be a little tough just given, you know, the starting point, but just any puts and takes, and then, you know, maybe what paydowns would look like? Thanks.
Yeah, so look, we recognize, you know, long growth was slightly down, but it has not changed our outlook for our growth profile. We think we are squarely a mid-single digit grower. Michael, when I listen to conversations, I get feedback from our team. They're active and engaged. If you break down Q1, let's just break it down into the three months of Q1. January and February, we had good growth. In March, that growth evaporated on us a little bit. And I think two things caused that. One was some macro events. We saw some of our pipeline and some opportunities get pushed into Q3. Right now, at the beginning of the quarter, our pipeline is up 30% from where it was at the beginning of the year. So I think some of it is our pipeline got pushed just with some macro events. The other thing is that we saw some very aggressive pricing in terms on some incumbent banks that were being aggressive to retain customers. And so that's the two things that really kind of led to the slight decrease in our loan growth in Q1. But we think one of those corrects with that pipeline being pushed into Q2 and then also So we'll just continue to operate in a very competitive environment and make decisions that's best for renaissance. And in some cases we may try to match terms, in other cases we may not. But in talking with our team, we still have confidence that over the course of a longer period of time, not just one quarter, but over several quarters, we are a mid-single digit grower.
All right. So it sounds like you're reaffirming the outlook for the year. I'll step back.
Operator
Thank you. The next question comes from Catherine Mueller with KBW. Please go ahead.
Great to see you reaffirmed the mid-single-digit growth outlook. The deposit growth was really strong this quarter. Can you talk about if any of that was seasonal or should pull back and kind of how you're thinking about deposit growth relative to loan growth for the year? And maybe with the deposits, what you're seeing on incremental deposit costs as well. Thanks.
Catherine, good morning. This is Jim. So the first quarter was a good quarter. Good morning. The first quarter was a good quarter in terms of deposit growth, and there was some seasonality to it, and much of that would be on the public fund side. As you know, we felt some of those tailwinds the latter half of last year in terms of public fund outflows. that reversed itself in q1 so a meaningful we call it 50 or 60 percent of the growth that we saw in q1 came from public funds and the balance was was uh just core uh deposit growth and as we look forward i would say we you know we'll have some seasonality here in in april you know tax season Plus, we'll start to see some of those public inflows moderate as we go throughout the year, and they'll trend downward. So our outlook overall, though, for the year is that we've got mid-single-digit growth in deposits. That's the goal, and that's what we're focused on in terms of growing core deposits in that mid-single-digit range. We want to try to have that growth be roughly parallel with the loan growth, and that's still our outlook for the year.
Catherine, I may just add to that, that we recognize that public funds are creating some noise. But if you kind of look through that and just tying this back to the market disruption, we've seen an uptick in the month of April in new account openings on deposits. And it's a marked improvement. I'll just give you one data point that I learned this morning. Over the last four days, we've opened up 340 deposit accounts. Normal trend line in 2025 is that we're probably opening a couple of hundred accounts per month. And over the last four days, we've opened up over 300. So I think that's just an interesting point of data. It will ultimately show up in the numbers. But, again, I think it also speaks to how our team is responding throughout our markets and meeting needs of customers who may be uncertain at this moment, providing certainty to them. But I think that's an interesting data point that as we get into Q2 and Q3, we'll see how it plays out with balance sheet growth.
Yeah, that's great. And then maybe just thinking about average earning asset growth, it looks like the bond book increased this quarter, and maybe that was to replace some of the slowness of the loan growth this quarter, and that's temporary. but do you expect to continue to grow security that's missed through the year, or do you think the back half of the year is really more geared towards loan growth and the bond book will be a little bit more flat?
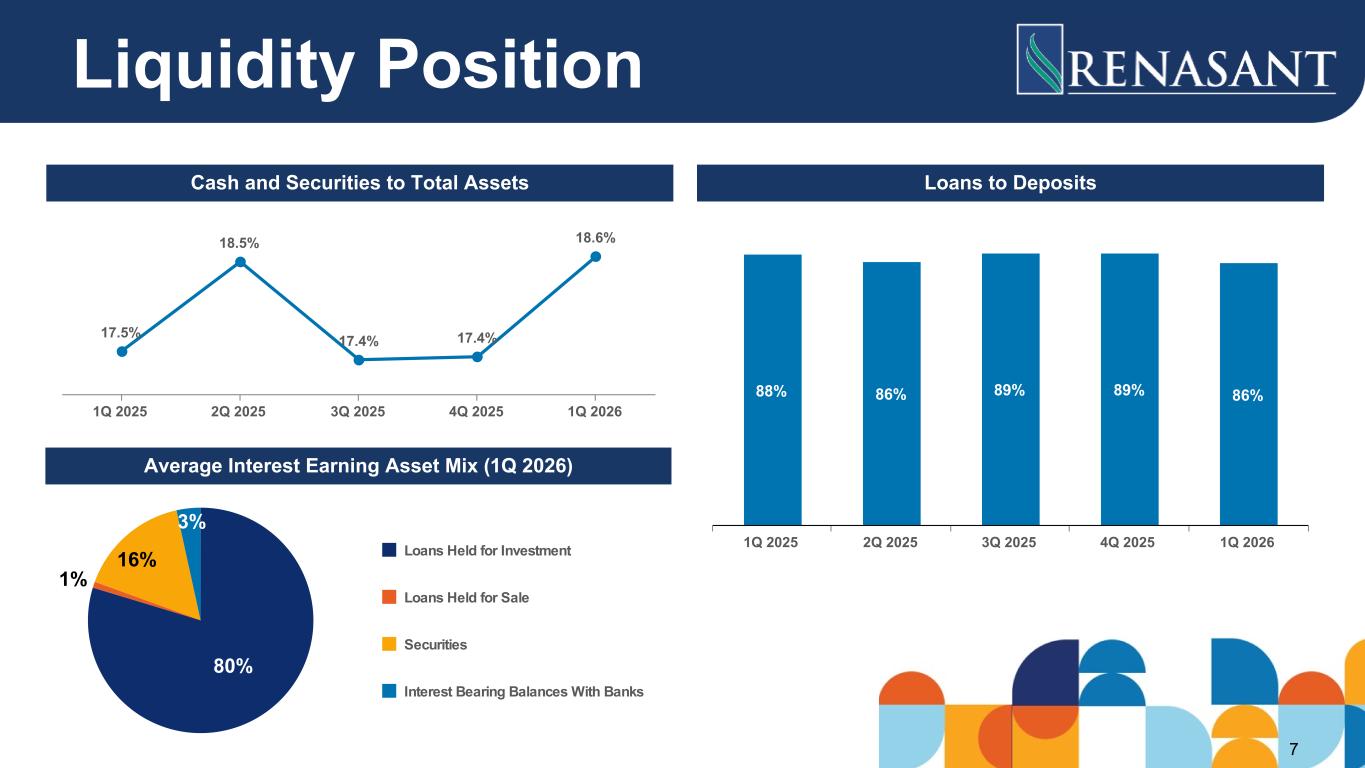
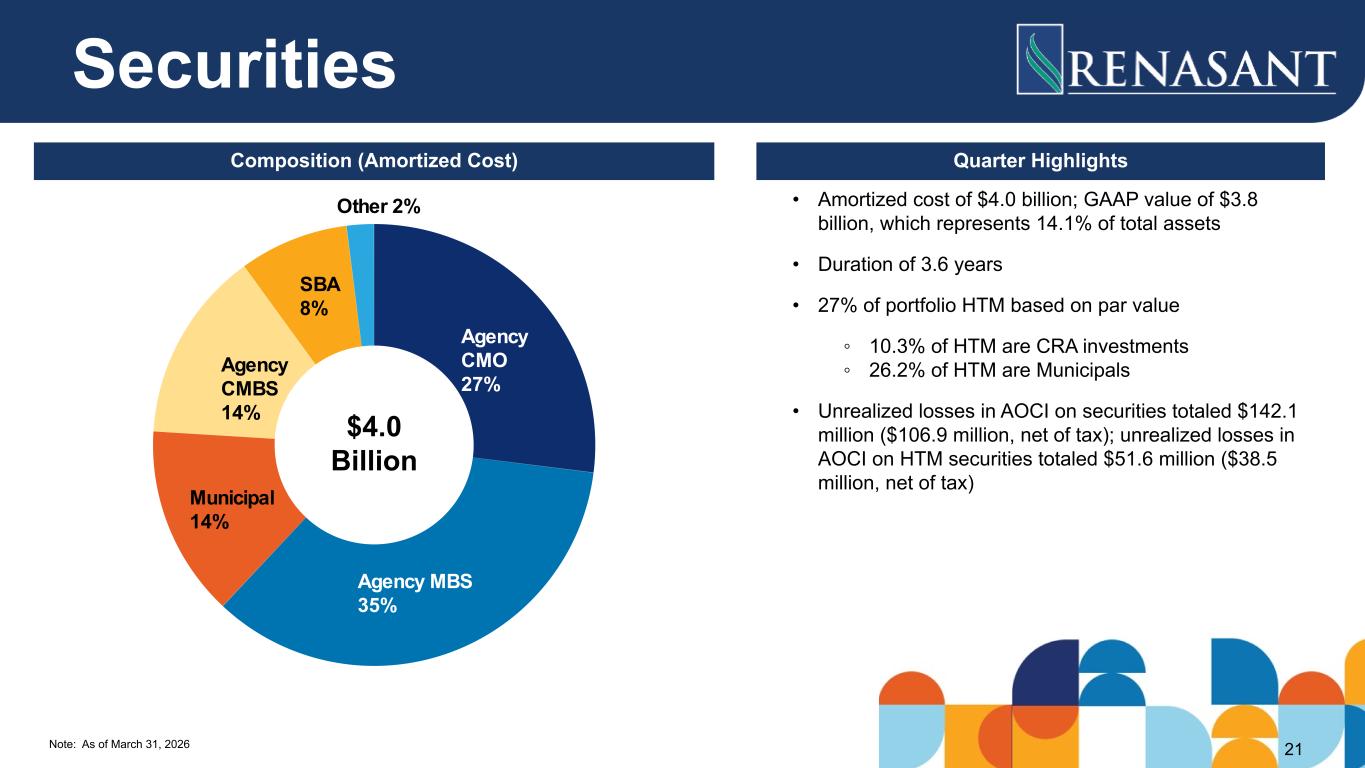
I mean, that's the outlook we would hope for, because as you point out, we didn't have quite the loan growth that we anticipated, and that was some of the reason you saw the growth in the bond book. So I think as we go through the course of the year, we've got, I think, you know, our securities portfolio is roughly $4 billion plus or minus, and that's comfortably a billion dollars above where we feel comfortable. So there's plenty of capacity there to fund loan growth, and we would expect and hope that probably that securities portfolio starts to trend downward as we have that loan growth. And, of course, some of that will depend on what we see on the deposit side. But you're correct to point out that was a function of a couple things, just the strong deposit growth we had and the lower-than-average loan growth in Q1.
Great. Thank you. Great quarter, guys.
Operator
Thank you, Catherine. The next question comes from Matt Olney with Stevens. Please go ahead.
Hey, thanks. Good morning. Wanted to follow up on the net interest margin discussion. I think last time we talked on the call, We talked about the margin being relatively flattish for the year with the expectation of a few rate cuts. So we'd love to hear just updated thoughts on the net interest margin, you know, absent any rate cuts and any kind of sensitivity you have if the Fed does cut from here. Thanks.
Good morning, Matt. And our guidance is really unchanged in the margin. Our current forecast does not have any rate cuts in it. And even though I think, as you point out, I think we had two cuts in our prior call or in the model when we had the fourth quarter call, it really doesn't change that much, the outlook for NIM. So I think the outlook from here is stable in that core NIM. If we get a couple of cuts, I don't know that that really influences it very much. So I think it's sort of steady as she goes on core NEM for the balance of 26.
Okay, appreciate that, Jim. And then I guess just following up on that, deposit costs look great this quarter. Move that down a little bit more. Any more opportunities on, I guess, the overall funding side for improvement from what we saw in the first quarter?
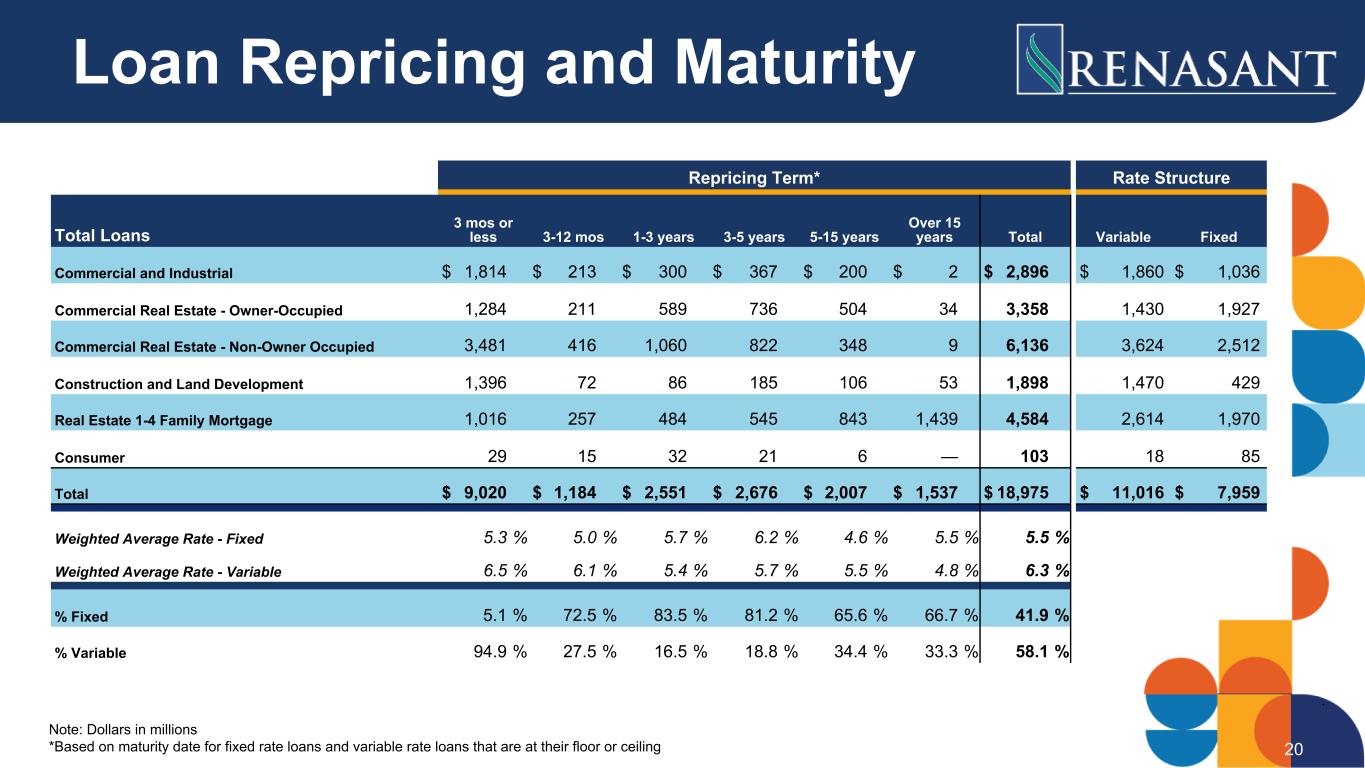
I would say not much, Matt. I mean, I think we've exhausted much of what we're going to see in terms of repricing opportunities in the deposit. We still do have on the left-hand side, we've got loans maturing, I think, you know, I think we've got a billion, two or three over the next 12 months or like at five or 5.1%. So that represents some repricing, you know, benefit, but not so much, we don't see so much on the deposit side.
Okay, great. Thank you, guys. Thank you, Matt.
Operator
The next question comes from Dave Bishop with Hovde Group. Please go ahead.
Hey, good morning, gentlemen. Hey, Kevin, I'm curious. You talked about the hiring opportunities within the market. Are there any specific niches or segments that maybe you're not in that are enticing you here? Are these sort of the tried-and-true commercial C&I bankers that you're going to be targeting?
Yeah, so really not so much, you know, niches per se, but what we are seeing is the opportunity to build out some outside of what you mentioned, kind of your traditional commercial bankers or bankers in a specific market. What we are seeing is the ability to kind of more develop or fully develop and mature some business lines that we already have, whether it's some of our secured lending conversations that we're having there or in the case of a line of business like wealth management. We're seeing opportunity there, which just gives us – we already have some of these throughout our footprint. This has just given us the ability to get more depth and reach in some of those business lines, but not necessarily looking to add a new vertical in a lending unit. It's really just being able to more mature and put more bench strength within already lines of businesses or some of our established secured lending lines. And, again, that's just outside of your traditional C&I or your market-specific banking team. And so I would just say that opportunity is all throughout. That opportunity for conversations and hiring is all throughout. There's also just with the disruption and how we overlay with the disruption. I think we've shared this in past conversations, but we created an internal map just overlays our footprint with the markets that are going through disruption. And we overlay nicely with that. But to quantify the opportunity, there's over $90 billion in deposits that are currently going through a transformational merger. And, again, not that we're going to pick up, and I'm not saying we're going to pick up $90 billion, but it just shows you the level of disruption that's happening. We also firmly believe there's going to continue to be M&A in the southeast, and that disruption just gets more loud. And to be in a position where Renasant is today, to be converted, to be merged, to be integrated, And to be focused on customers and employees, that's a very good place to be right now in a world of disruption. Stability is a great place to be in a world of disruption. And so I think that's what gives us an opportunity and a little bit of an edge at the moment. But specifically to your question, we're having conversations with people that bring sticky business and sticky revenue. and that will enhance and complement what we do.
Great. One follow-up, I saw the buyback, the aggressiveness there. Just curious, holistically, is there sort of any, you know, targeted CCE regulatory capital ratio that sort of govern how aggressive you're going to be?
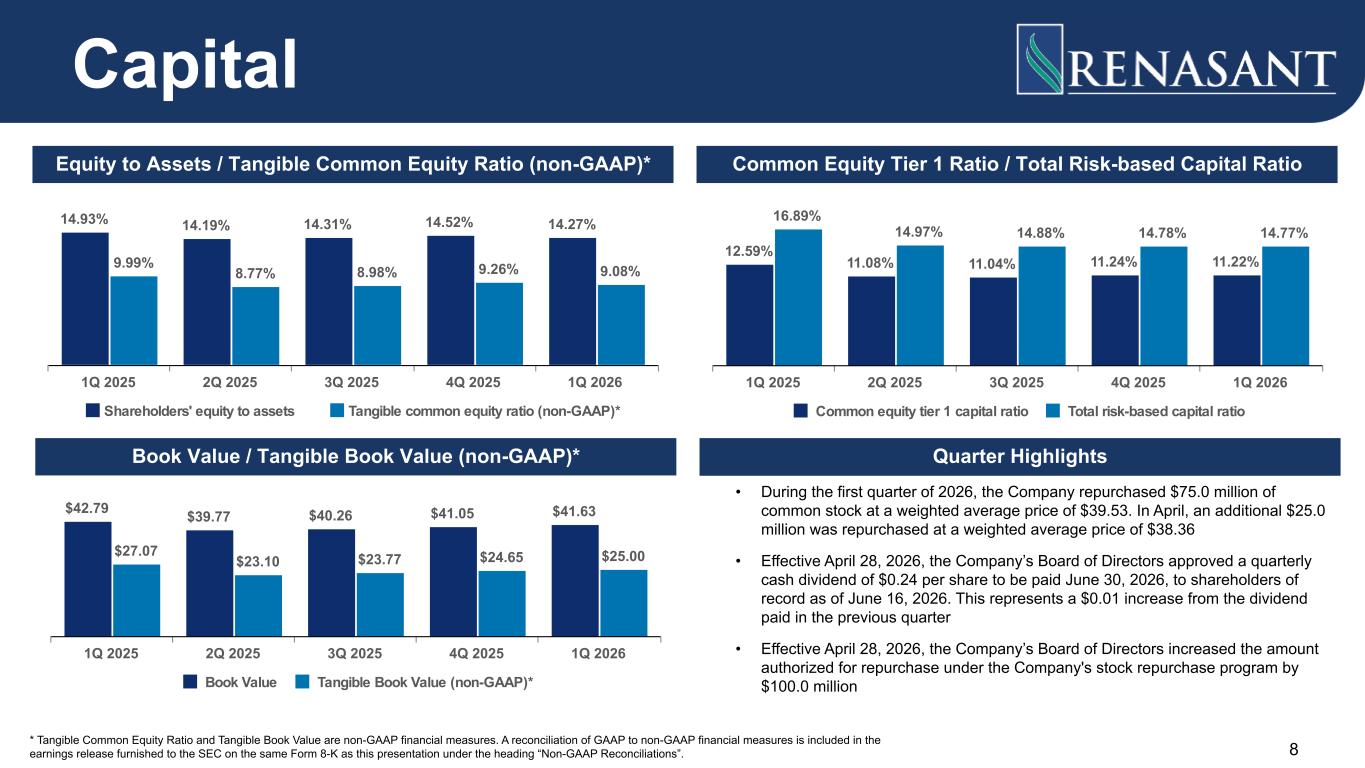
Thanks, Dave. This is Jim. Yes, I think our outlook there is similar to what we talked about in the Q4 call. So if we pick CET1 as a ratio to 0.2, we started the year at roughly 11.25%, plus or minus percent. And I think our desired outcome would be to roughly finish somewhere in that range at year end. And so balance sheet growth will play a role in that. But our expectation is obviously take care of whatever balance sheet growth comes our way and make sure we capitalize that, but then continue to lean into buybacks. So as you saw, we were active in Q1, and we continued that activity in early Q2. And so our goal is to continue to avail ourselves of buybacks. of buybacks we were very optimistic about our performance outlook as a company and so we like the opportunity to invest in our stock and bearing in mind those sort of capital guardrails our goal is to continue to to take advantage of opportunities to buy back our stock very appreciate the color the next question the next question comes from steven scouton with piper sandler please go ahead Yeah, thanks, guys.
Maybe a little bit following up on that line of questioning, but just wondering how aggressive you would see yourselves being in this macro environment, kind of the level of cautiousness versus what you've described as kind of the opportunity set before you and a mindset of, you know, always wanting to hire good talent, a talent when it's out there, just kind of how you balance that as you look ahead to the rest of this year.
Yeah, so one great question, and I'm going to talk very holistic with you because I think it speaks to our capital plan, right? So this is a long-term plan, and if you look at what we've been doing over the last couple of quarters, we've been fully enacting this capital plan. And that plan starts with a strong balance sheet, strong capital ratios, strong allowance for loan loss. and we try to think in terms of optionality and being best positioned in a variety of scenarios. And so we believe we are well positioned to be opportunistic to deploy capital for future hiring and have capital allocated for future growth. If things get bad from a macro level, I think if we start looking at the stability of a balance sheet or the strength of a holding company, the cash on hand at a holding company or in a stress scenario, with allowance, we're going to screen out very well in that draconian scenario as well. So we can be – we are well positioned to be opportunistic in a good environment or defensive in a bad environment. And that's a great place to be in a world of uncertainty where the whole world can change in the matters of minutes with a tweet. That's really where we feel like we need to be right now. And, but if you look at where we are from a return on tangible common equity or return on tier one capital, being at 16% gives us a lot of optionality. It gives us the ability to pay roughly a 30% dividend payout ratio. It gives us the ability to stockpile capital for future growth. And then it gives us the ability to have some extra capital to either stockpile for future M&A, stockpile for future hires in their growth, or look at the option of buying back in the form of a stock buyback. So I'm giving you a very roundabout answer to say with where we've gotten the profitability of the company, particularly from a return on Tier 1 capital, return on tangible common equity, that gives us a lot of optionality to choose which way we want to lean based on how we see hiring or performance of the stock or M&A or just simply be defensive. We feel like we are well positioned to have that option in our control as opposed to being behind as the environment changes, and it could change rapidly.
Yeah, that's great color, Kevin. I appreciate the idea of the optionality there. I guess one follow-up for me, and I think you somewhat answered it when you talked about your internal mapping of the dislocation, but as you think about the concentration of new hires, would you say it's been more about where those opportunities just exist currently based on dislocation, or has there been any incremental effort to kind of deepen the newer markets that you entered into from the first? Just kind of wondering where those hires are concentrated, if at all.
Yeah, so they're really higher. They're really concentrated in markets, in new markets we've entered or markets where we don't necessarily have the market share that we want to have. So I'll just take, for example, North Mississippi. We've done some selective hiring, but what we've mainly done there is our teams have been focused on customer acquisition as opposed to talent acquisition just because of the overlap. In other areas, in other markets, it's given us the opportunity to build bench strength. And also, there's certain parts of our company, we can't have enough employees. It always feels like we're a player or two behind in those areas, and this has given us the opportunity to get a player or two ahead in those areas and just build bench strength and take pressure off of our current employees. They do a great job, but just give them some additional support. Steven, the other thing we're doing is taking the opportunity to pick up back office talent. Right now, our back office, we have tremendous talent in our back office. This gives us the ability to build bench strength and also increase our time horizon, extend our runway, and have the potential to grow to higher levels than maybe we currently are contemplating. By adding that staff today, it will give us that runway and optionality to become a bigger bank without immediately meeting a growing pain as we do that. So, we're being very selective, but I would say that most of it is targeted in either new markets where we want to build out additional footprint and market share, or very selective places where we're just adding talent to provide more bench strength.
Great. Very helpful. Congrats on a great start to the year.
Appreciate it. Thank you, Stephen.
Operator
Again, if you have a question, please press star, then 1. The next question comes from Janet Lee with TD Cowan. Please go ahead.
You've already touched on it, and I understand that payoffs and paydowns you can never really predict precisely, but is it realistic to assume that your CRE loans are going to just continue to decline from here on and a lot of your growth will be coming from C&I, or do you have a line of sight into we're at the low point on CRE and things are likely to improve in the second half of 2026?
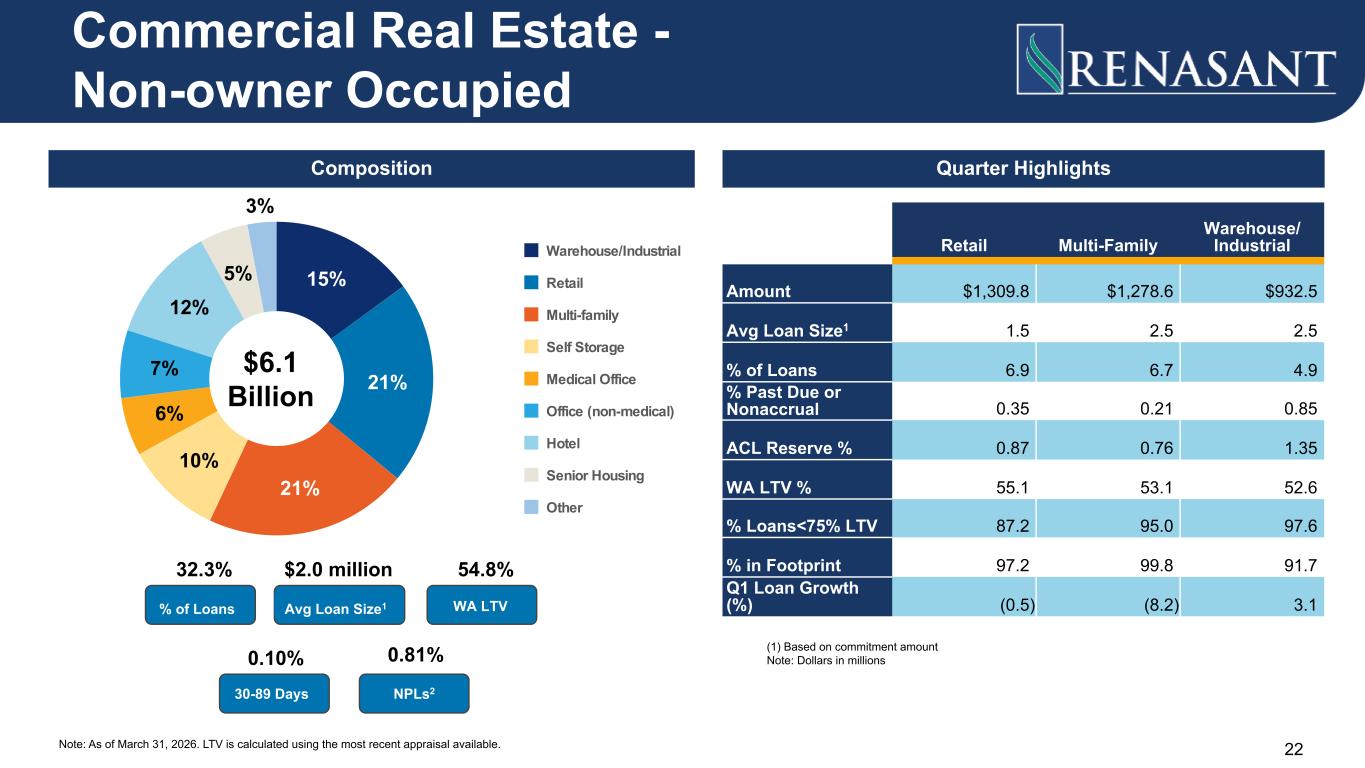
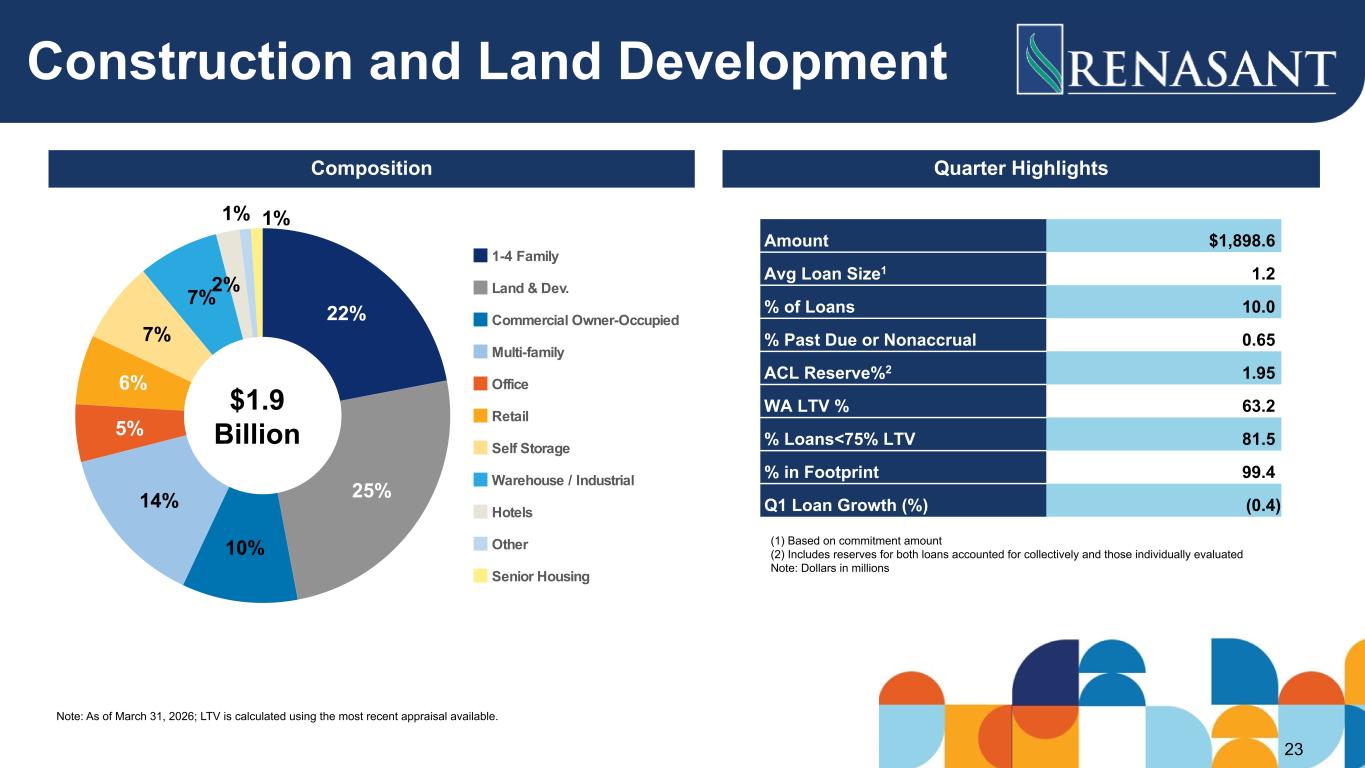
Janet, good morning. This is David Meredith. So I guess we'll look at it a few different ways. One, I would say CRE is not an area we intend to shrink. We continue to have a great deal of focus in our commercial real estate business. We've got some great lines of business that continue to pursue just commercial real estate, so it's a dedicated effort we have. I think obviously there's a lot of noise in commercial real estate. We've had the expectation for an increased level of payoffs for some time based on interest rates and the aging of some properties, and so there's going to be a certain level of rotation or volatility in that commercial real estate space as some of them pay off, but we continue to look at new opportunities and continue to be aggressive in that space. When we look at increasing commitments over the last couple of quarters, we have an increased level of commitment in our construction book. Obviously, with the level of equity going into construction projects, it may be six to nine months before you start to see fundings, but we are growing our commitment levels in those areas, and we've done those for the past couple of quarters as well. But what we will continue to see is based on the interest rate environment, We'll continue to see just some rotation of loans as they've matured and just the normal course of business for commercial real estate opportunities. They're going to either sell the asset, they're going to go to the private debt market, look for private placement, long-term rates, things that aren't traditionally a bank-type financing vehicle. So we'll continue to see some volatility in that space, but it's definitely an area we're still continuing to pursuing as a high level of our growth strategy, along with, as we've seen, increased levels of C&I. As you pointed out, we invested in those lines of business, the factoring, the asset-based lending, the corporate C&I effort, so we continue to focus there. But it's a broad-based commercial real estate, C&I. We're not being specific in any one area.
Got it. Thank you for that. And it looks like the second quarter fee income, there was some strong performance on the SBA loan sales. Where do you see the most upside in terms of fee income opportunities? It looks like there are some different puts and takes within the specific line items within fee, but overall it's been growing pretty nicely. but how should we think about the pace of your fee income growth from here?
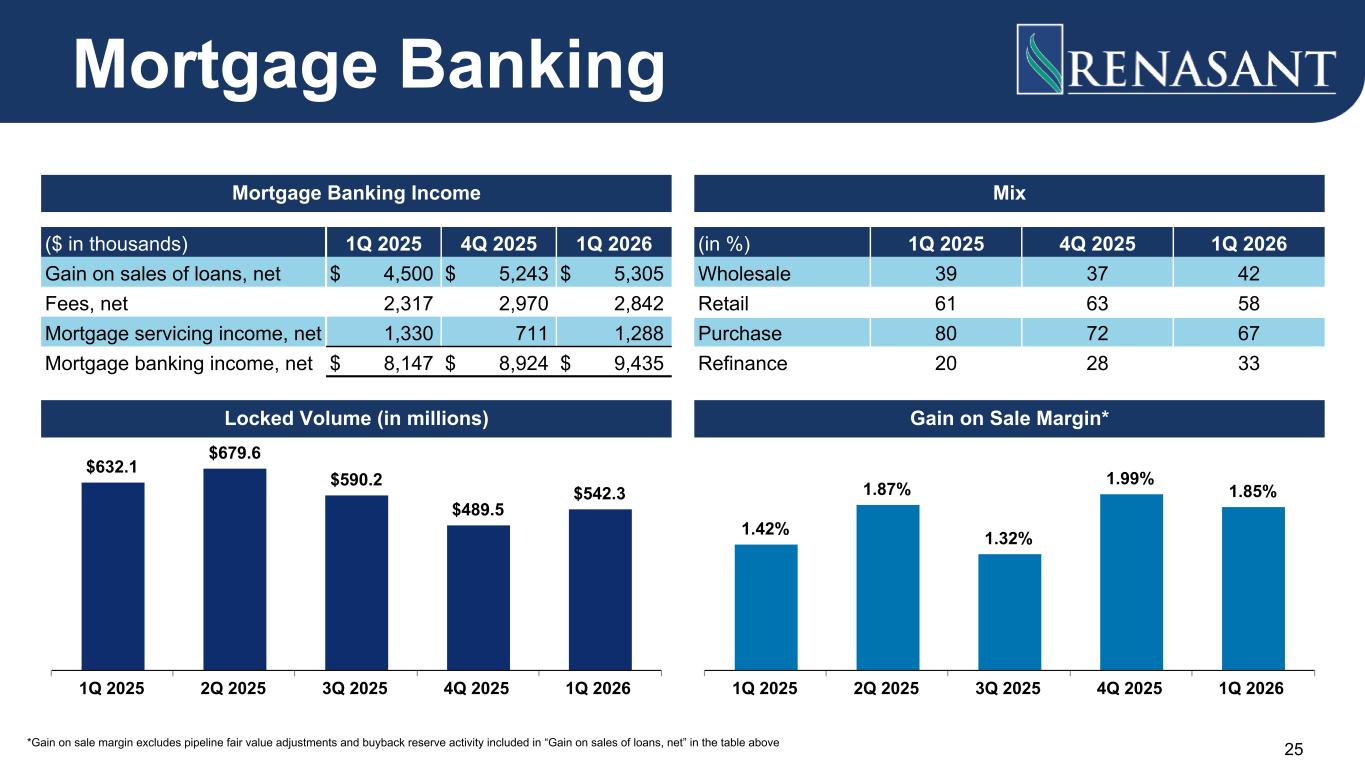
Good morning, Janet. This is Jim Mabry. I would say, as you mentioned SBA, there are a couple areas that have done really well, and our outlook for the balance of the year would be, I think, you know, there are some puts and takes, but generally the first quarter is a pretty good jumping off point. I would think there's a chance for some modest improvement there. but I think it's a good run rate to think about. Mortgage had a good quarter in Q1. It was up a bit from fourth quarter. SBA was good. We didn't see, and this relates to some of the commentary about loan production, we didn't have the capital markets performance that we typically do in Q1. So I think as we start to see that production fall through and become loan growth would expect the capital markets would exhibit, you know, higher levels of fee income. So, and I guess lastly, I would say wealth is an area that's been very steady. I do think that that holds promise as we look forward for, you know, solid single-digit, mid-single-digit growth and potentially better down the road. We're putting a lot of effort and energy into of that area, and I think with the things we're doing just internally with legacy renaissance and then some of the things that are going on around us in terms of dislocation, I see that as an area that, you know, will do well in coming years.
Janet, I may just add to that, just some of the hiring we've done, we've enhanced the wealth management. You'll start to see that revenue lift. As we get, as we start to exit Q2 and get into Q3 and Q4, I do want to take the opportunity to talk about mortgage. Mortgage was an interesting quarter, particularly if you go back to February. February, prior to kind of the macro Middle East conflict events and the subsequent rates rising, the 30-year rate had gotten down to a five-handle on a conventional mortgage, and our pipeline popped. We saw immediate, and it really just kind of spoke to how we've built mortgage with the retooling of the production we've added. And as rates cooperate, that pipeline, the revenue, it immediately shows up. And so, again, I know we're not in a position where, you know, rates are cooperating with mortgage. They'll continue to slug it out, continue to be profitable. But when rates cooperate, mortgage will, you will see almost an immediate impact from mortgage. You kind of see that a little bit in Q1 because of what happened with rates in February. And so, again, we wait for the day that we don't have to apologize for mortgage and for being in the mortgage industry. But we continue to be well positioned and invest in that arm of our company and feel like we're really well positioned if rates ever cooperate with us.
Operator
And we have a follow-up from Dave Bishop with Hovey Group. Please go ahead.
Yeah, just a quick follow-up on credit. You know, trends look fairly well-behaved. Looks like there's a little bit of inflow on the non-accrual side. Just maybe some color there. And then, Kevin, maybe holistically, you know, like, you know, speaking in the past, I know you guys have always taken pride in the reserves alone, sort of like, you know, you know, building a rainy day fund there. Do you think that the ACL alone sort of sits in the mid-150s range as you go through the year? Do you think there's a little bit of a bleed if things improve from a macroeconomic perspective?
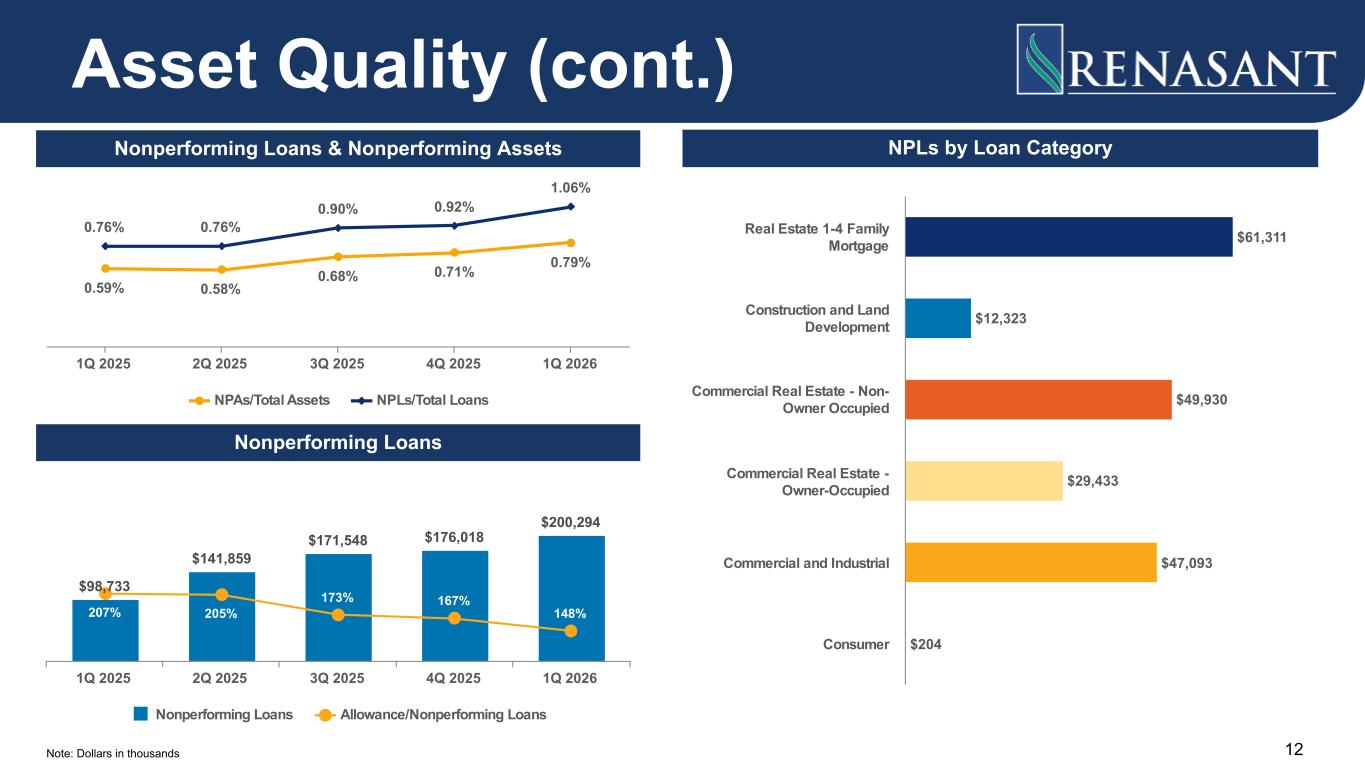
David, good morning. David Meredith. On the NPL question, we did see a little bit of an inflow in Q2, and that number has increased somewhat over the last couple of quarters. And that increase has kind of been broad-based. There's nothing in particular. If we look at Q2, we had about a $24 million increase. So we'll say that was about $69 million of new NPLs on a $45 million outflow. So we continue to resolve our NPL loans. But the inflow was centered in really a few larger dollar transactions, about $7 million in CRE, $19 million in CNI, and then a little bit of construction and development. and really it was centered in just a handful of loans that we believe were in a position to work out. You know, our composition of our NPL book continues to be somewhat consistent quarter over quarter. There's not any one area that I would say it's concentrated in from an asset type or a geography. You know, our average NPL size is small. I will say when we look at our kind of our general asset quality, you know, we see some positives, you know, our 30- to 89-day numbers continue to be low, so we're like, within the breadth of our portfolio, we don't see a broader level of losses. I also will say our charge-offs in Q4, as you saw, were only five basis points, and consistently, you know, it was in our deck over the last 12 months, we resolved a high level of NPLs with minimal charge-offs, and so we feel comfortable that our underwriting, that we're structuring loans properly as we continue to resolve those problems. So it's something we'll continue to work through. We continue to have processes in place to identify loans early so we can resolve them quickly and mitigate any loss that's out there. So a lot of positives, 38-9-day, charge-offs, criticized classifieds came down, and we'll just continue to work through our NPLs.
And, Dave, I'll just add on the allowance. Look, I think as we look around, credit quality is stable, but one thing that really probably just concerns us, and this goes back to when we built the allowance back to 2020, was just all the volatility and uncertainty that's out there that's putting strain on either consumers or commercial businesses' cash flows. And so don't think that the macro concerns have alleviated yet. You know, just take what happened in March with energy costs. All you have to do is go fill up your car, and you saw a 30% to 40% increase in 30 days of what it costs just to fill up your car. And we think that ultimately that's got to catch up with people in some way and their cash flows. And so just continue to keep what we think is an appropriate level of allowance, just given the uncertainty. And as we have clear pictures from a macro level, at that point in time, we'll reevaluate the sufficiency of the allowance. But right now, I just think there's enough macro uncertainty. Even though it may not be showing up quantitatively in our credit quality numbers, there is enough uncertainty out there to keep the level of reserve where it is.
Operator
Thank you. Thank you. This concludes our question and answer session. I would like to turn the conference back over to Kevin Chapman, President and CEO, for any closing remarks.
I appreciate that. And thank you to all of those that have joined us this morning. We appreciate your interest in the company and look forward to meeting with you throughout the quarter.
Operator
The conference has now concluded. Thank you for attending today's presentation. You may now disconnect.