Operator
Greetings and welcome to the Simulation Plus Incorporated Second Quarter Fiscal Year 2026 Financial Results Conference Call. At this time, all participants are in a listen-only mode. A question and answer session will follow in the formal presentation. If anyone should require operator assistance during the conference, please press star zero on your telephone keypad. And please note that this conference is being recorded. It is now my pleasure to turn the conference over to Lisa Fortuna. Thank you. You may begin.
Good afternoon, everyone. Welcome to the Simulations Plus Second Quarter Fiscal Year 2026 Financial Results Conference Call. With me today are Sean O'Connor, Chief Executive Officer, and Will Frederick, Chief Financial Officer of Simulations Plus. Please note that we updated our quarterly earnings presentation, which will serve as a supplement to today's prepared remarks. You can access the presentation on our Investor Relations website at simulations-plus.com. After management's commentary, we will open the call for questions. As a reminder, the information discussed today may include forward-looking statements that involve risks and uncertainties. Words like believe, expect, and anticipate refer to our best estimates as of this call, and actual featured results could differ significantly from these statements. Further information on the company's risk factors is contained in the company's quarterly and annual reports and filed with the Securities and Exchange Commission. In the remarks or responses to questions, management may mention some non-GAAP financial measures. Reconciliations of these non-GAAP financial measures to the most directly comparable GAAP measures are available in the most recent earnings release available on the company's website. Please refer to the reconciliation tables and the accompanying materials for additional information. With that, I'll turn the call over to Sean O'Connor. Please go ahead.
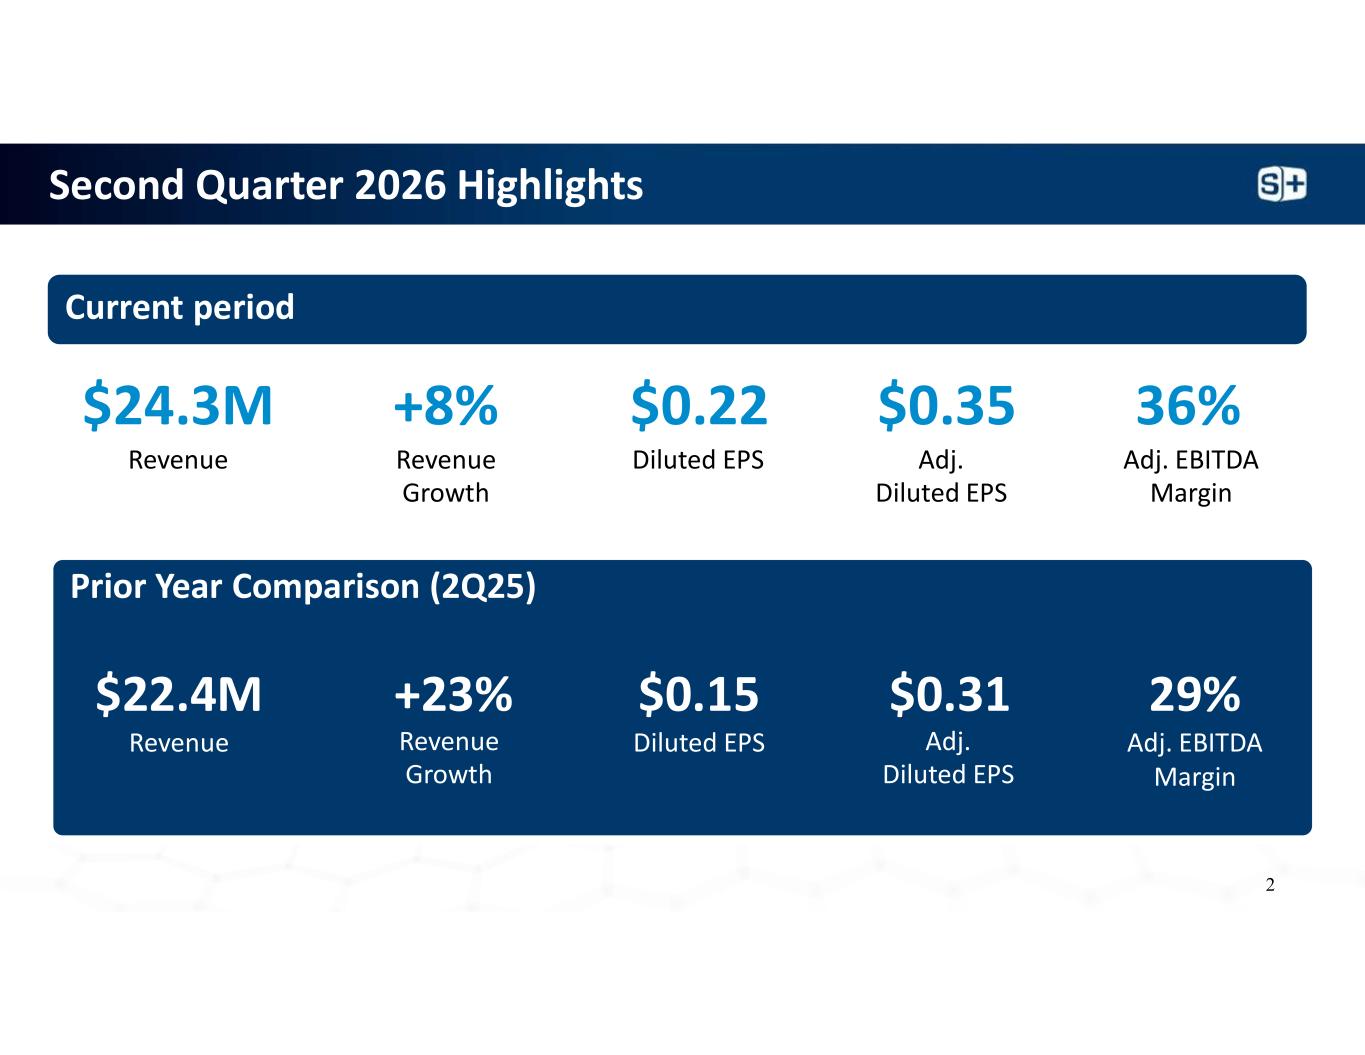
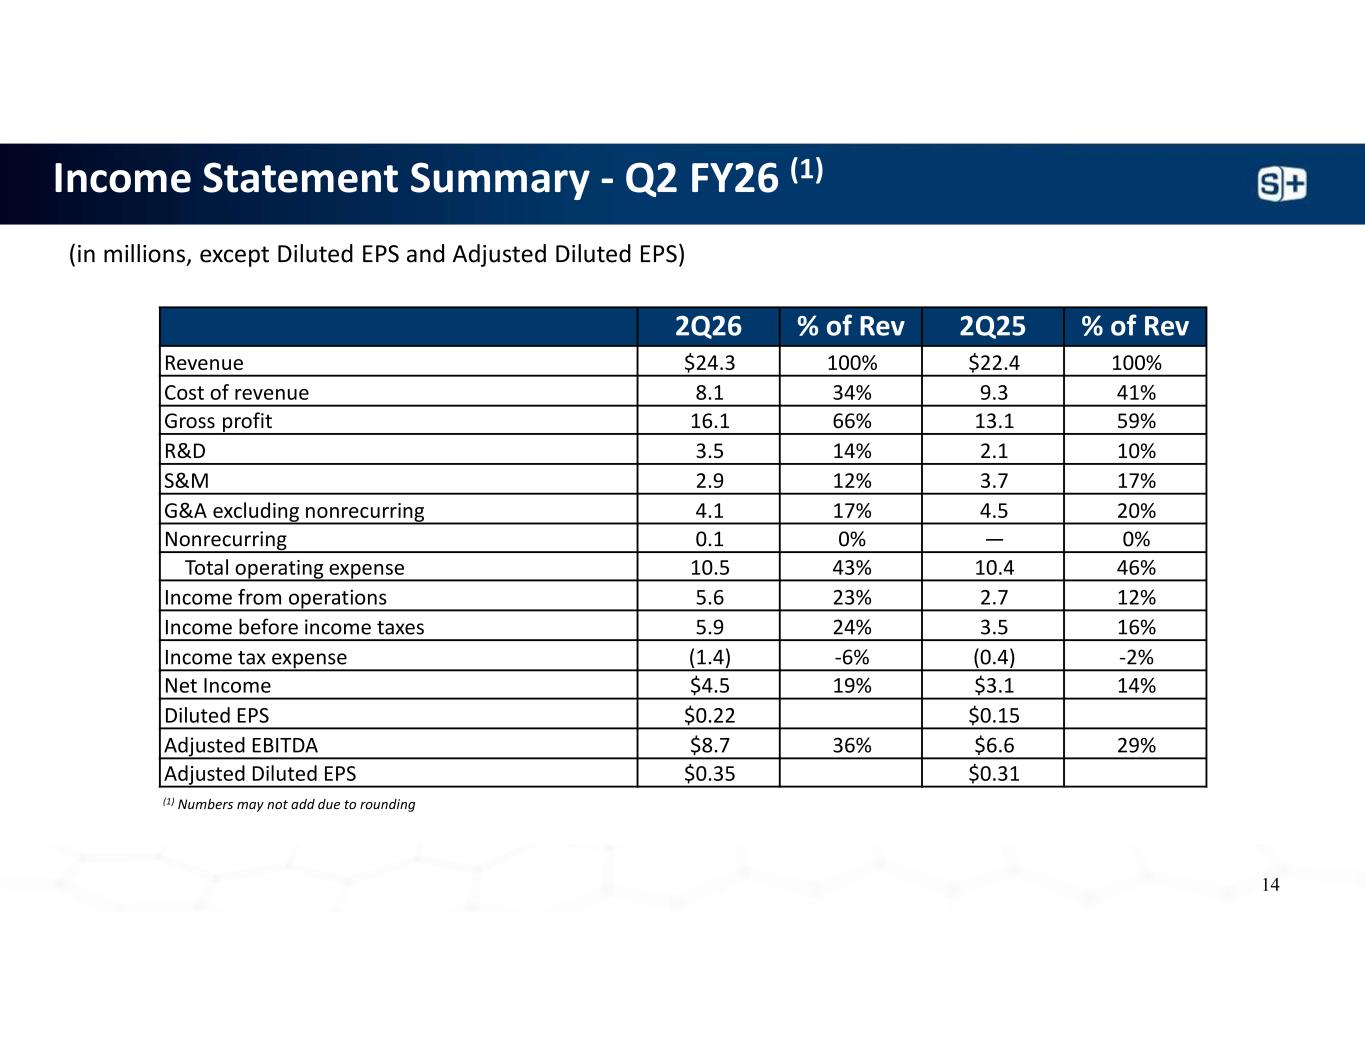
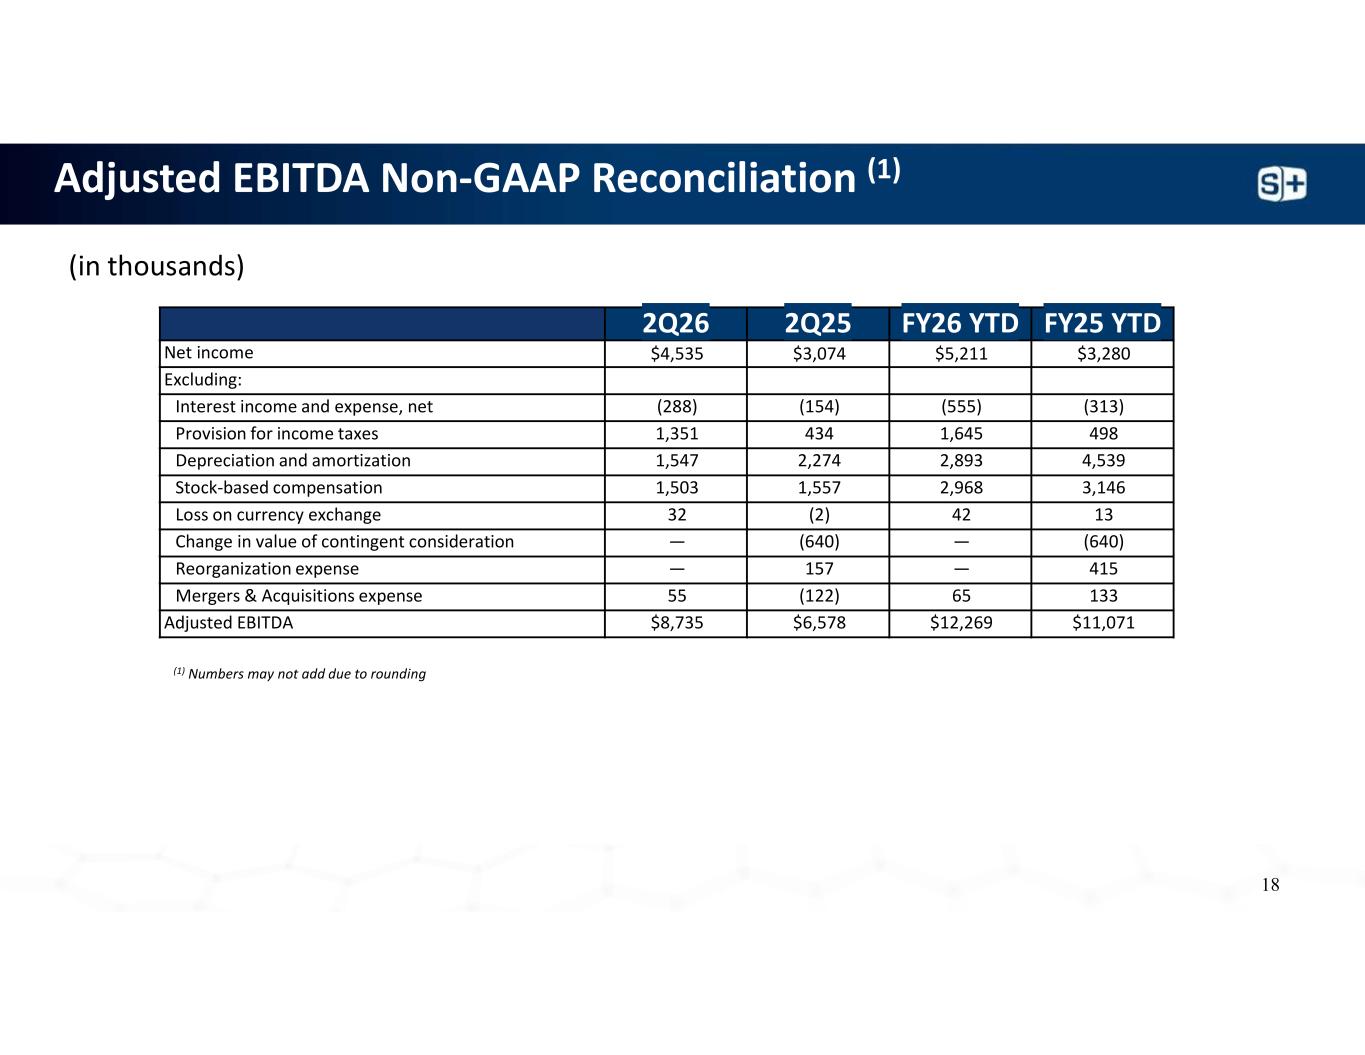
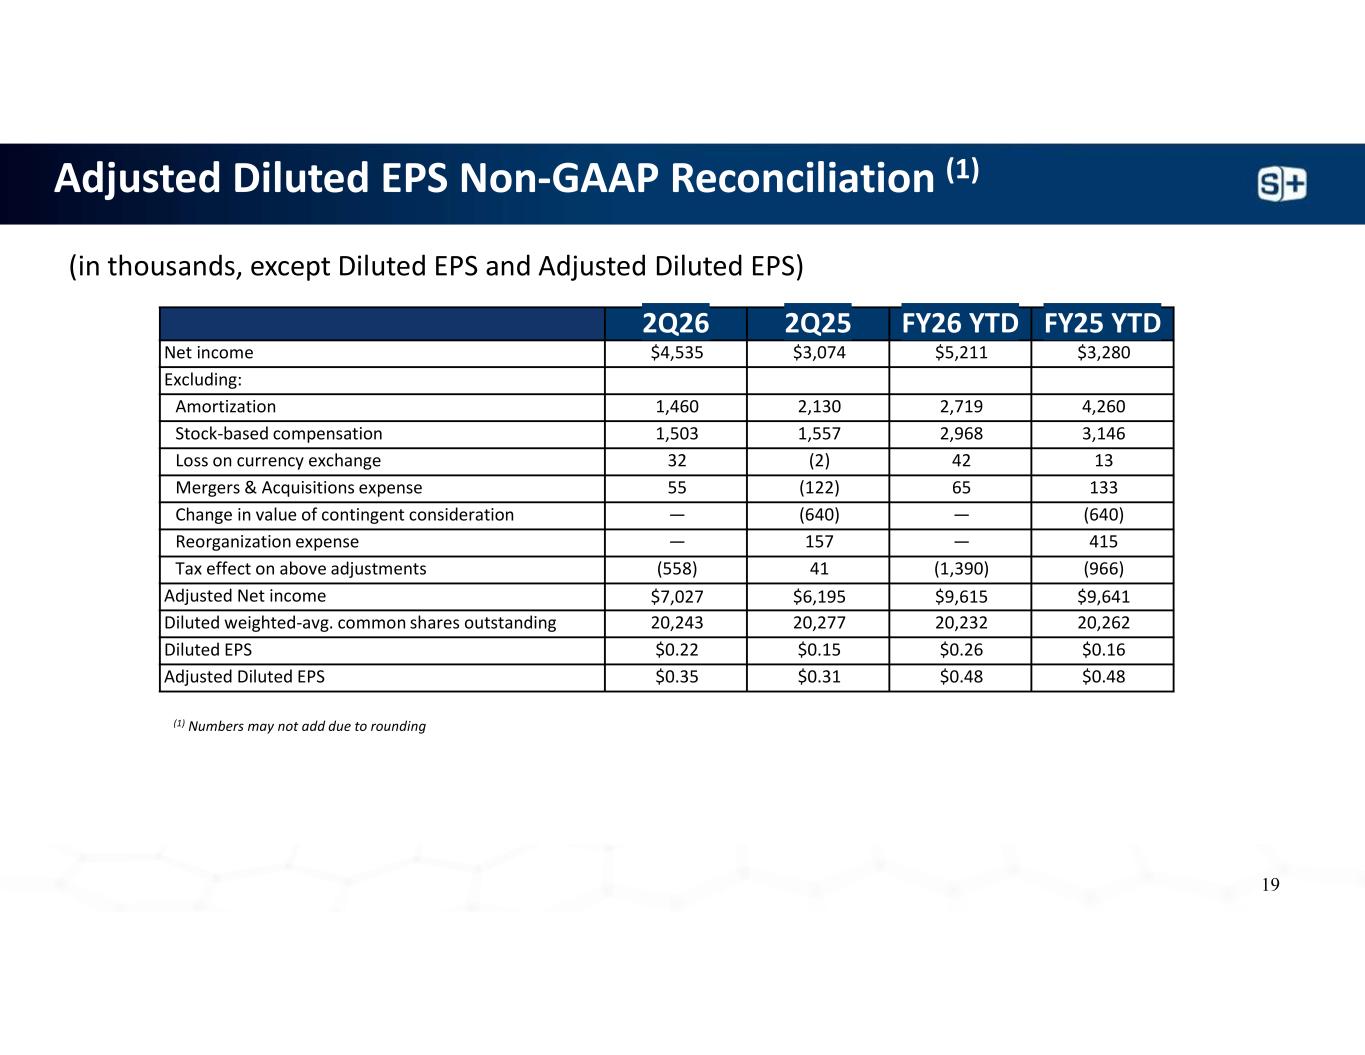
Thank you, and welcome, everyone. We exceeded the top-line guidance that we communicated to you last quarter and delivered $24.3 million in revenue during second quarter with growth in both our software and service segments. Adjusted EBITDA was $8.7 million, reflecting a 36% margin, and adjusted diluted EPS was $0.35, in line with our internal expectations. Turning to the macro environment, we continue to see encouraging market conditions globally, supported by ongoing Most Favored Nation pricing agreements, easing tariff concerns, and a more supportive funding environment for our customers. On the regulatory front, the new approaches, methodologies, or NAMS, guidance issued late last year was further clarified with an additional update last month. Against this backdrop, we're seeing a pickup in client spending, reflected in solid software renewal rates, increased new logo activity, and strengthened service bookings. Overall, we're pleased with our first half fiscal 2026 performance and encouraged by the momentum that it is building across the business. Next, I want to address the broader discussion around artificial intelligence and its impact on software companies, including our own. Over the past quarter, AI-related competitive concerns have weighed on valuations across most software-based business models, and biosimulation has not been entirely immune to that sentiment. That said, we believe it's important to separate short-term market perception from long-term fundamentals. From our perspective, ongoing advances in AI are a net positive for biosimulation. AI is accelerating the industry's transition toward data-driven drug development workflows and, importantly, enhancing the value of trusted and validated scientific engines rather than replacing them. We have been an early adopter of AI for decades, beginning with the introduction of AdMet Predictor in the late 1990s, and we continue to lead in its practical application today. Beyond using machine learning for property prediction or to improve software development efficiency, we are embedding AI across our product roadmap, improving compute performance, interoperability between scientific engines, data management and curation, automation of repetitive modeling tasks, and making our tools more accessible across organizations. While certain software models may face disruption from AI, we believe the core value of our scientific engines, including property predictions, PBPK, PKPD, and QSP modeling functionality and science, remain strong and durable. These capabilities are built on decades of scientific investment, deep domain expertise, validated methodologies, and integration into customer workflows and regulated environments. In contrast to black box approaches, our solutions are trusted, auditable, and difficult to replicate. That is why we have long been the preferred choice for commercial drug developers, even during a period of significant investment in AI-driven discovery companies and a number of open-source applications. At our Investor Day in January, we outlined a roadmap focused on further leveraging AI across our ecosystem, and we continue to make solid progress executing against that plan. Just a few weeks ago, we announced strategic collaboration programs with three large pharmaceutical companies to advance AI workflows across the drug development life site. The close collaboration between Simulations Plus and leading pharmaceutical organizations will provide direct insight into how AI will be integrated into real-world environments, informing product direction, workflow standardization, and future commercial models. The programs will utilize Simulations Plus' major software platforms, including Gasper Plus, Monolix Suite, AdMet Predictor, and Failures. Participating companies will integrate our internally developed AI agents directly into model-informed drug development workflows, Enabling natural language interaction, automation of data processing, coordination of simulations across multiple modeling engines, and generation of interoperable outputs from complex multi-step pipelines. These programs represent an important step in moving us and our partners beyond experimentation and into practical implementation as we advance our software and services into a unified modeling ecosystem. Finally, it's important to emphasize that our customers are not looking to replace biosimulation engines. Instead, they are looking to enhance their data, using AI to improve efficiency, broaden deployment, and accelerate drug discovery and development. Furthermore, cost benefits accrue at any point that Simulations Plus can help us simplify and shorten the drug development process or mitigate costly miscalculations. This approach aligns closely with our strategy to be a key partner in our client's AI journey and supports our long-term growth plans.
With that, I'll turn the call over to Will.
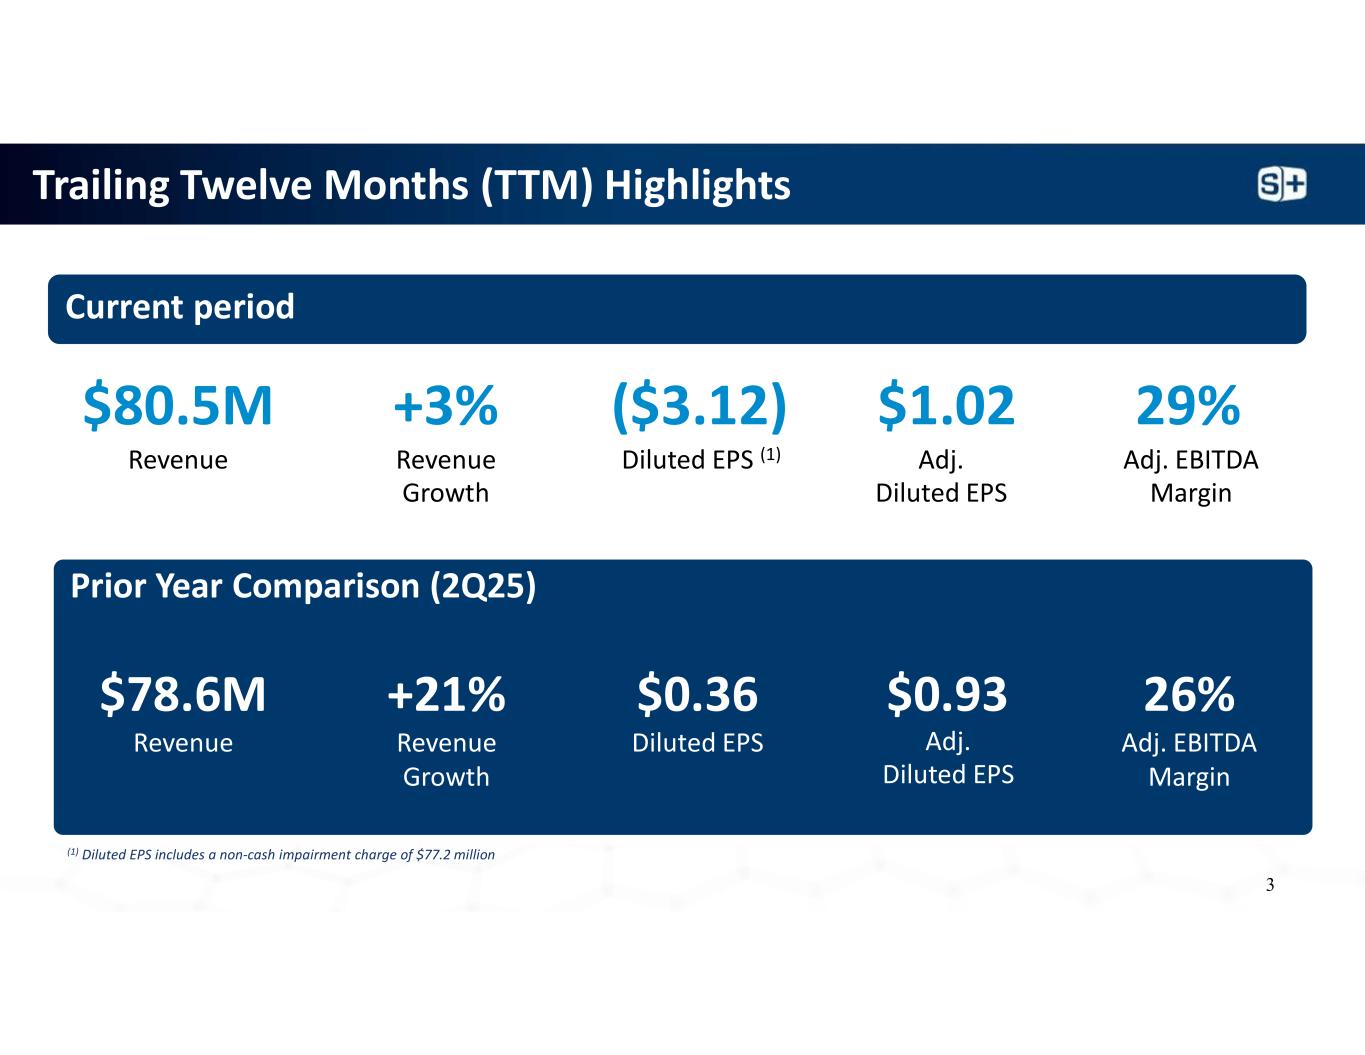
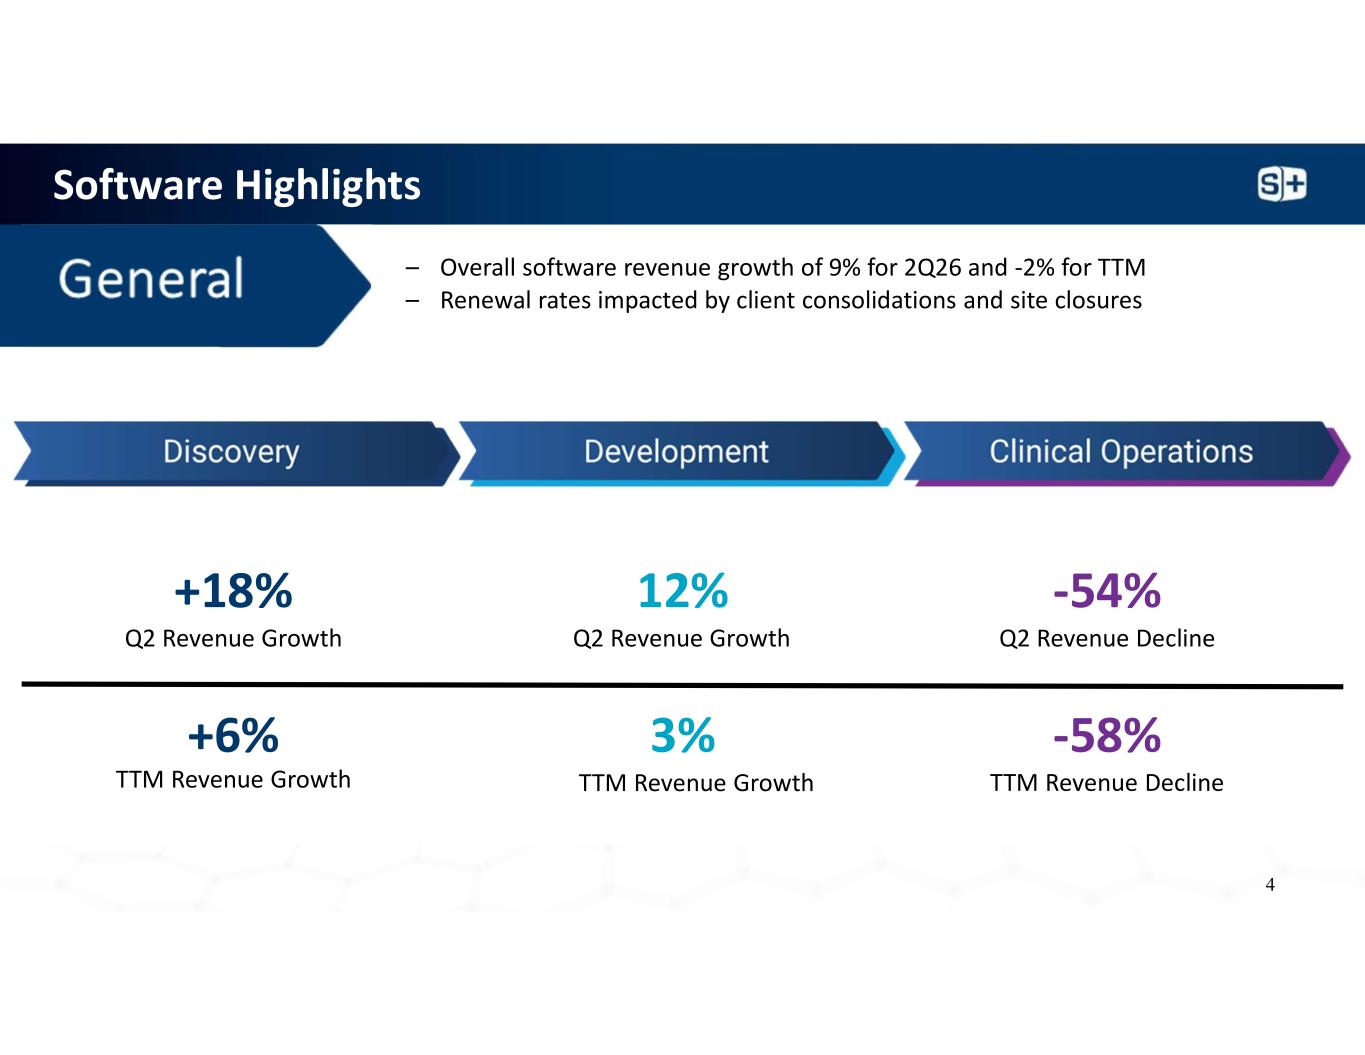
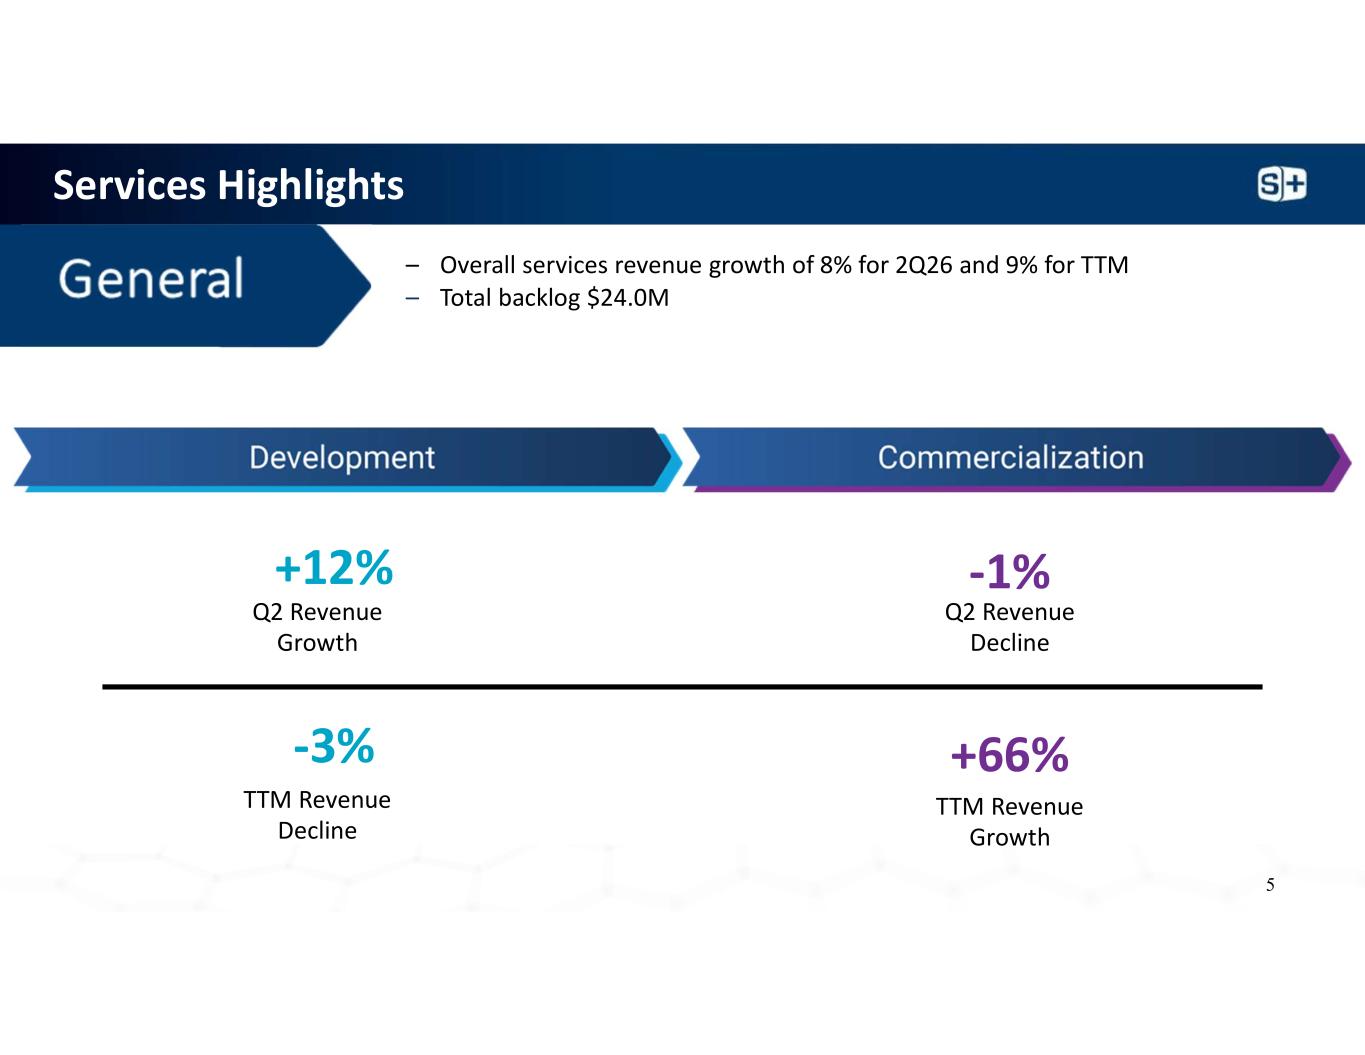
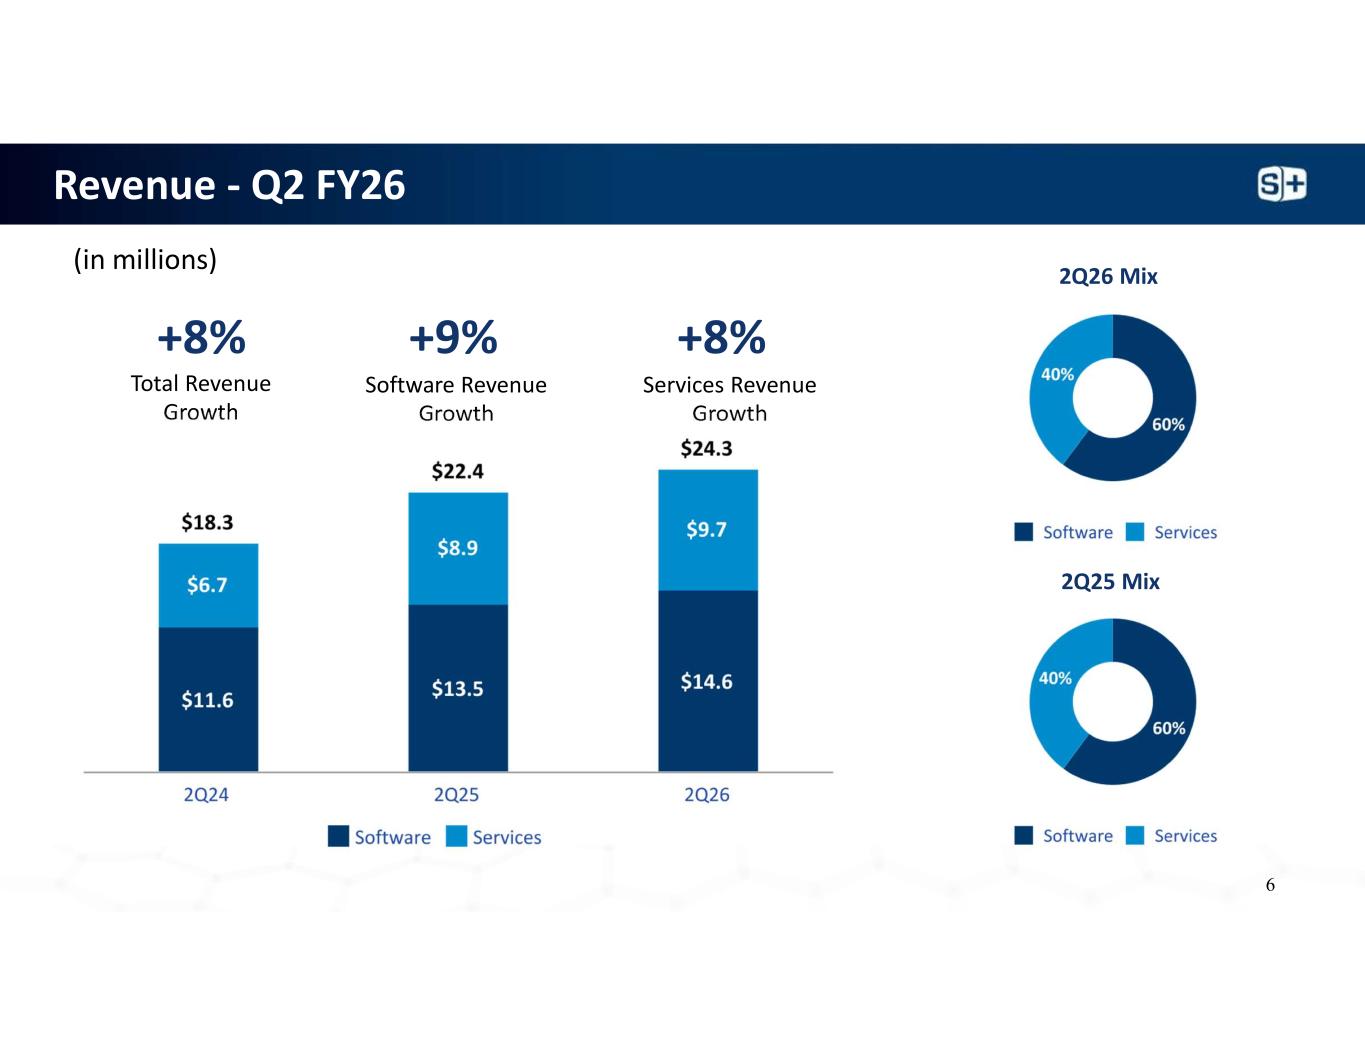
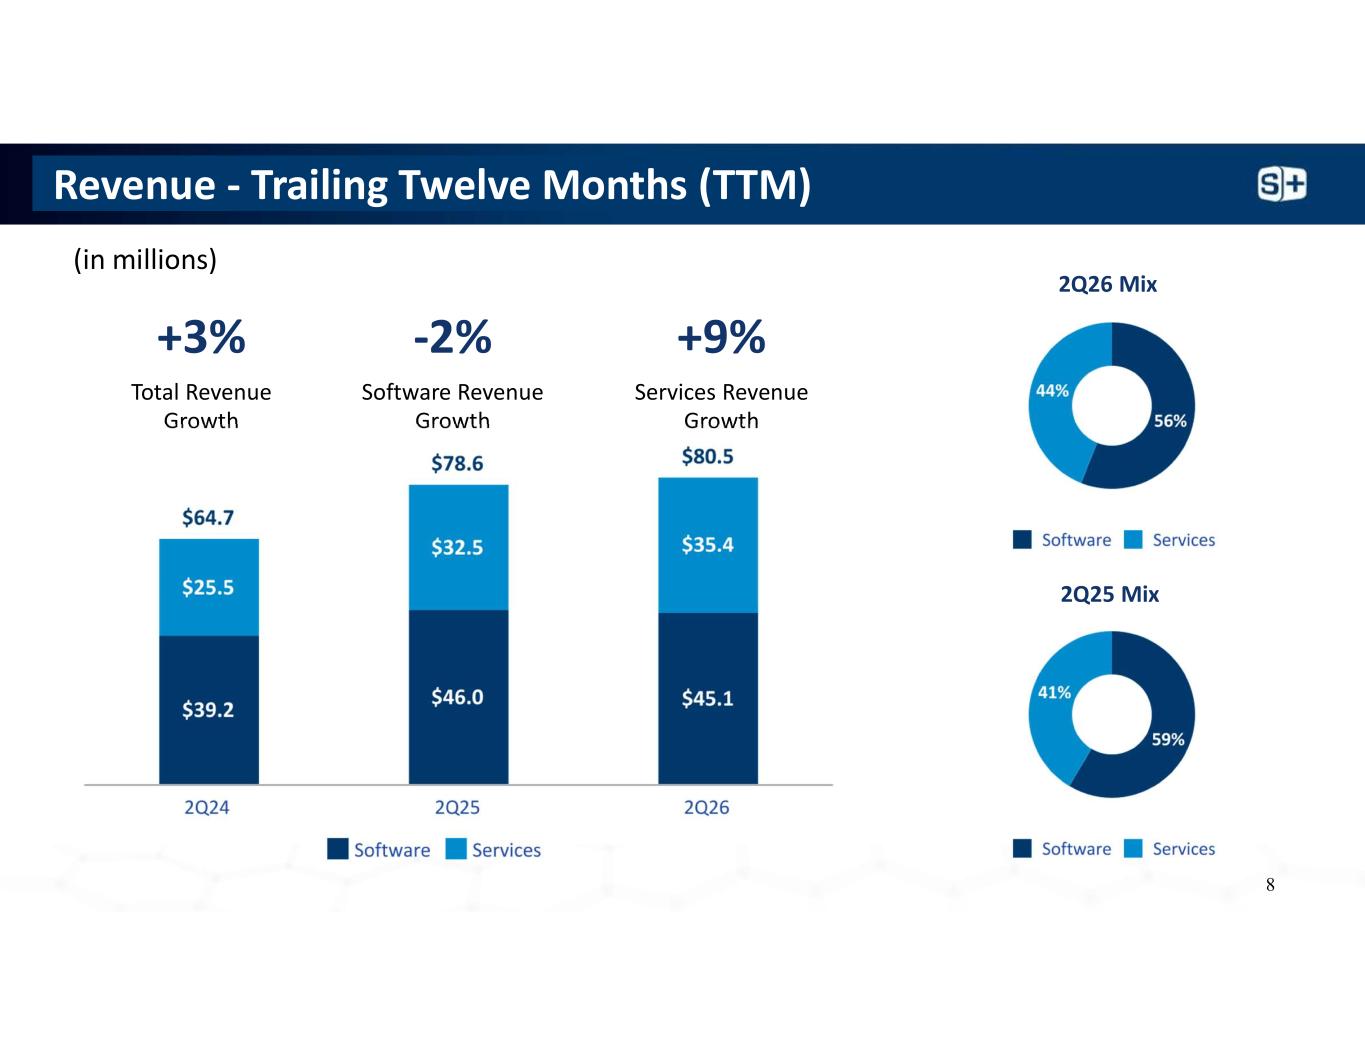
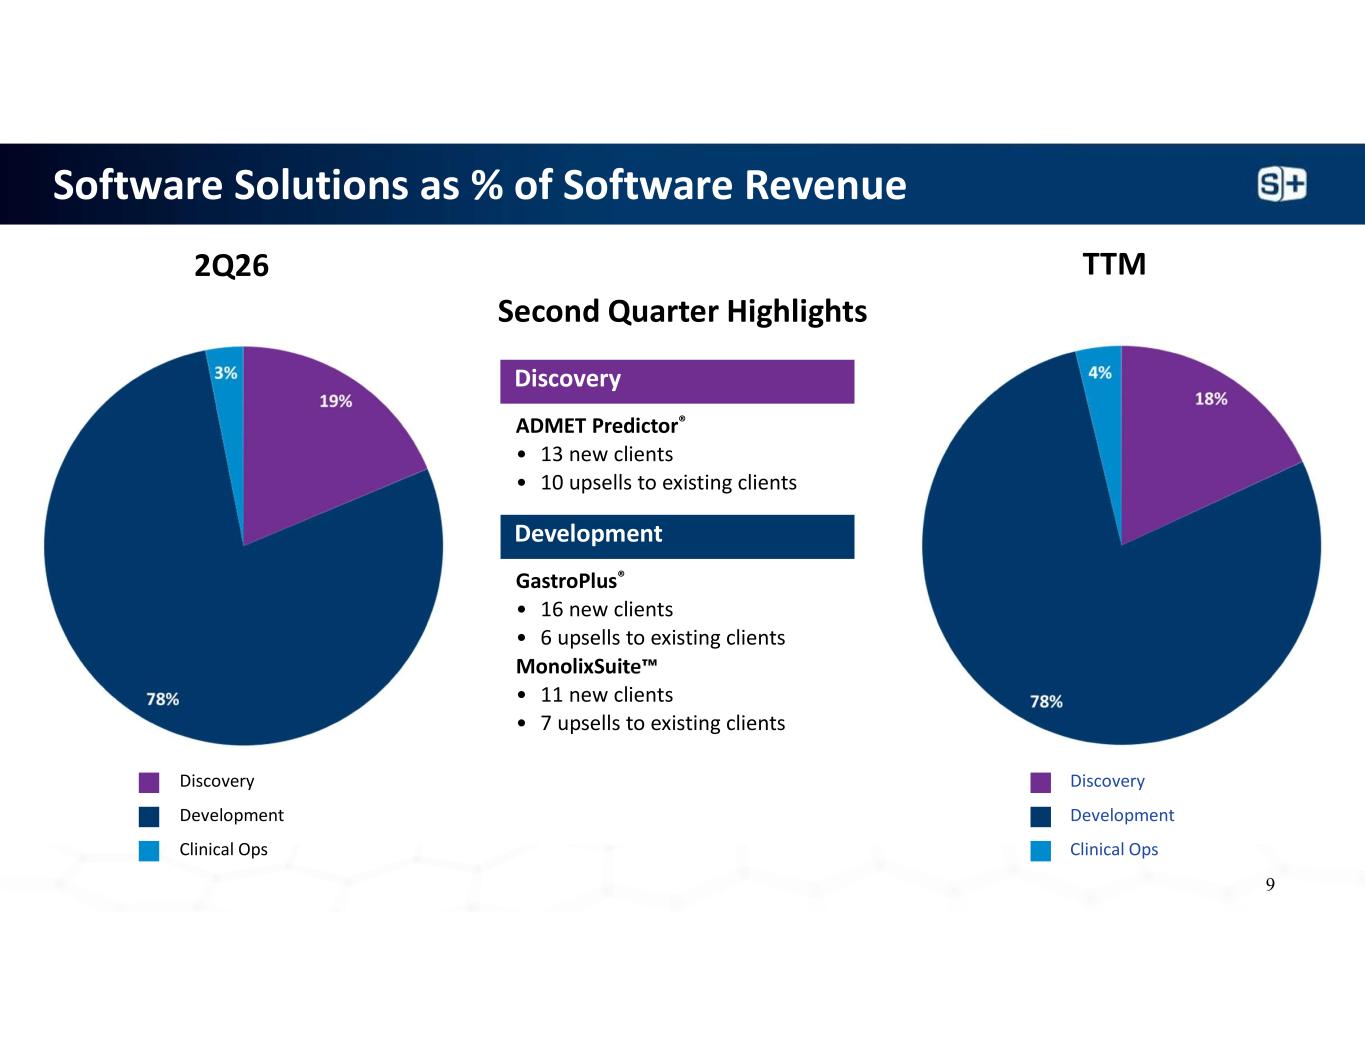
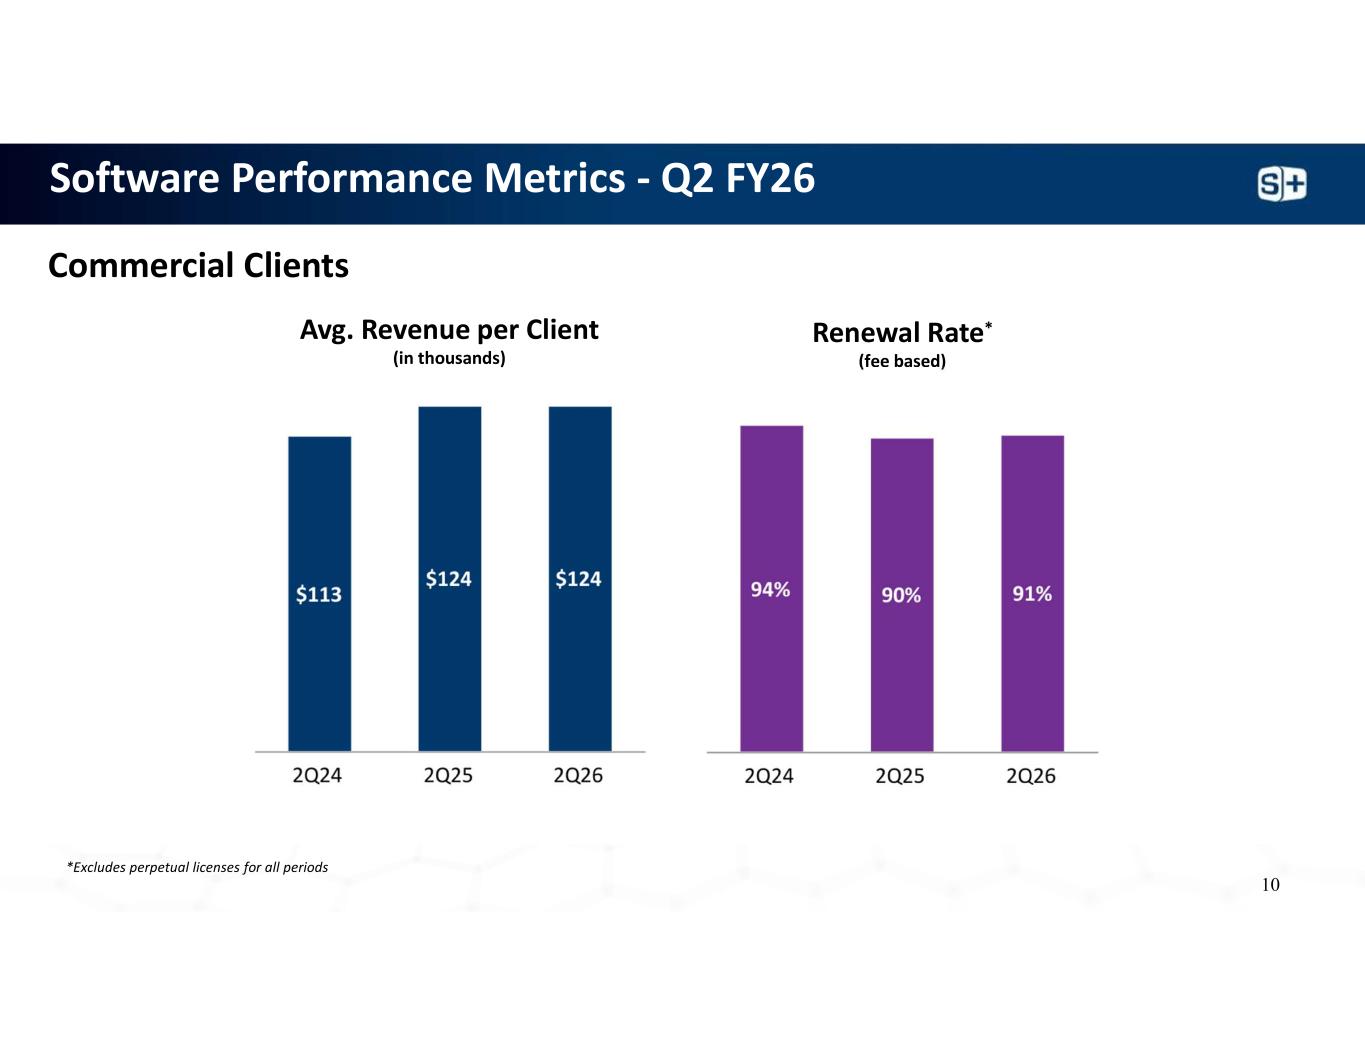
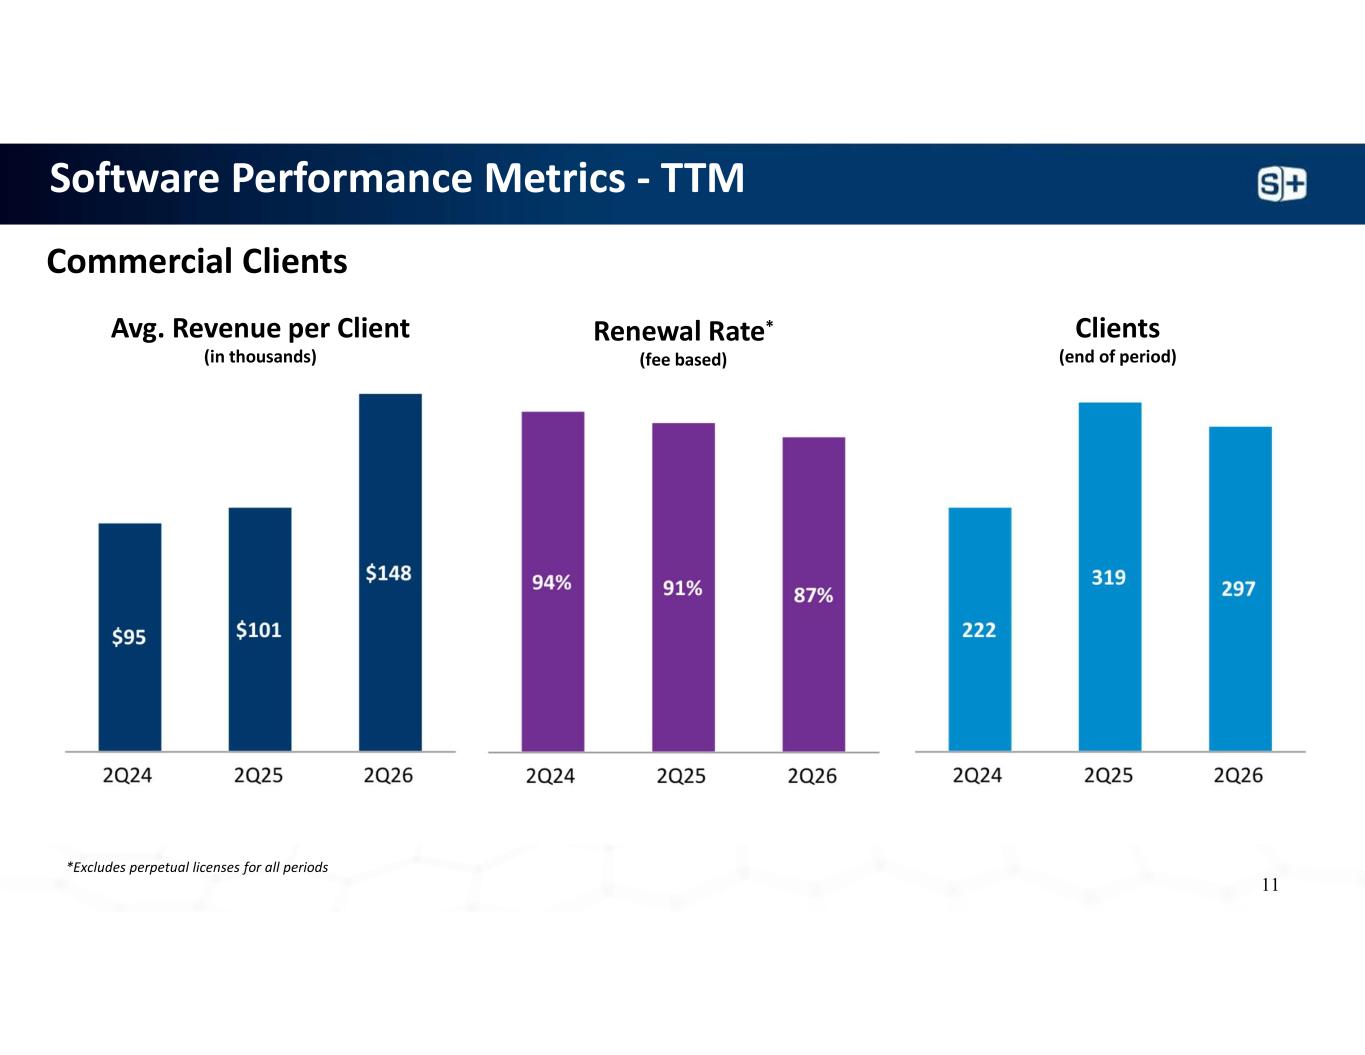
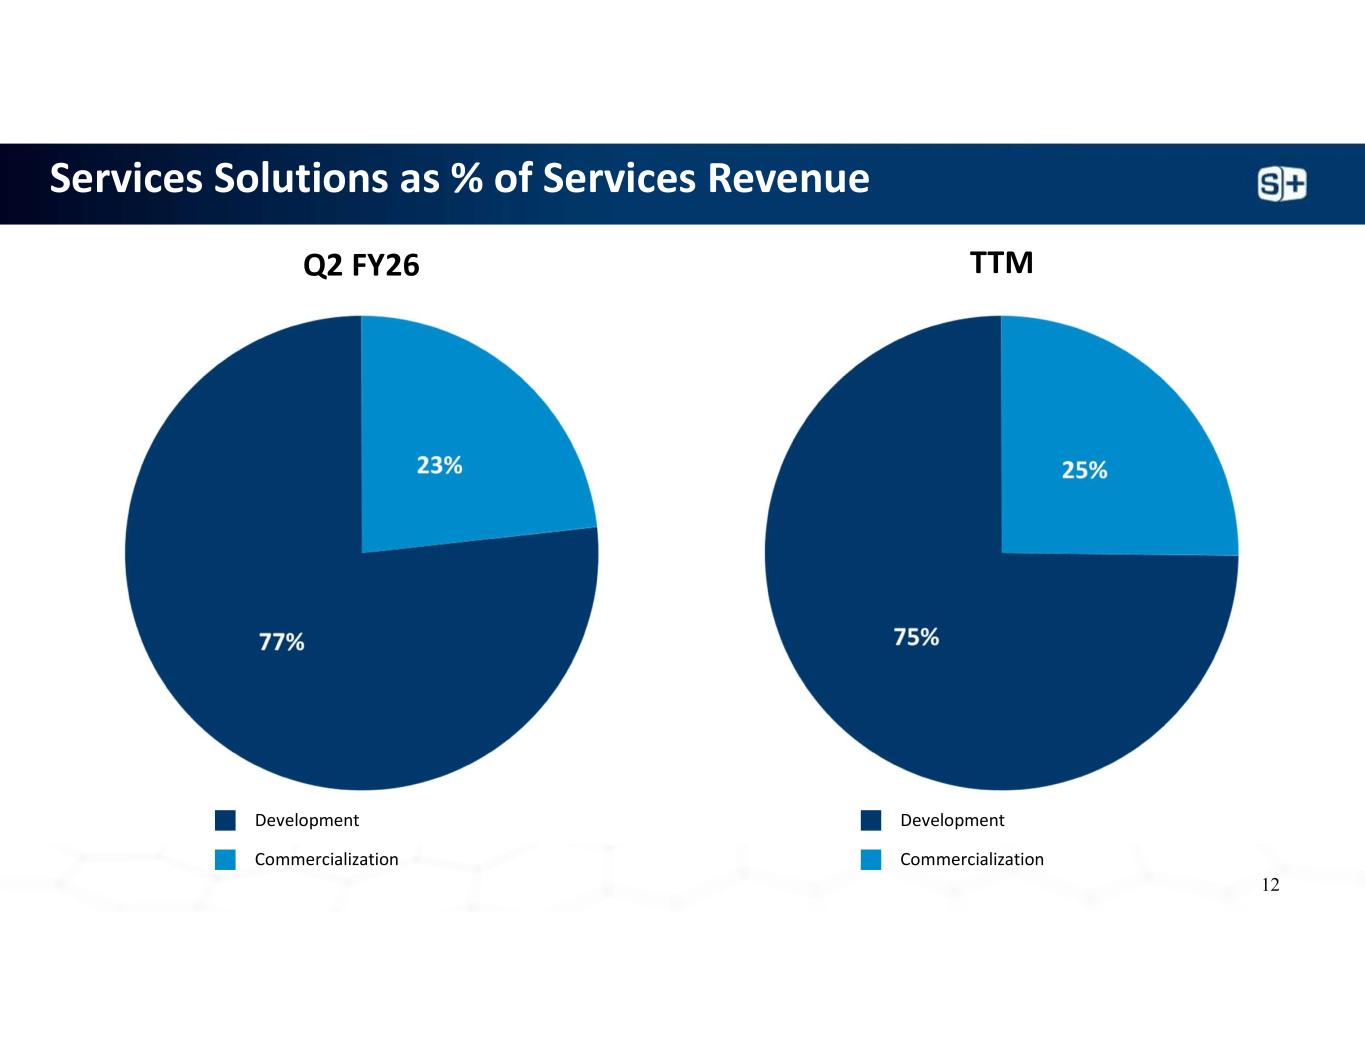
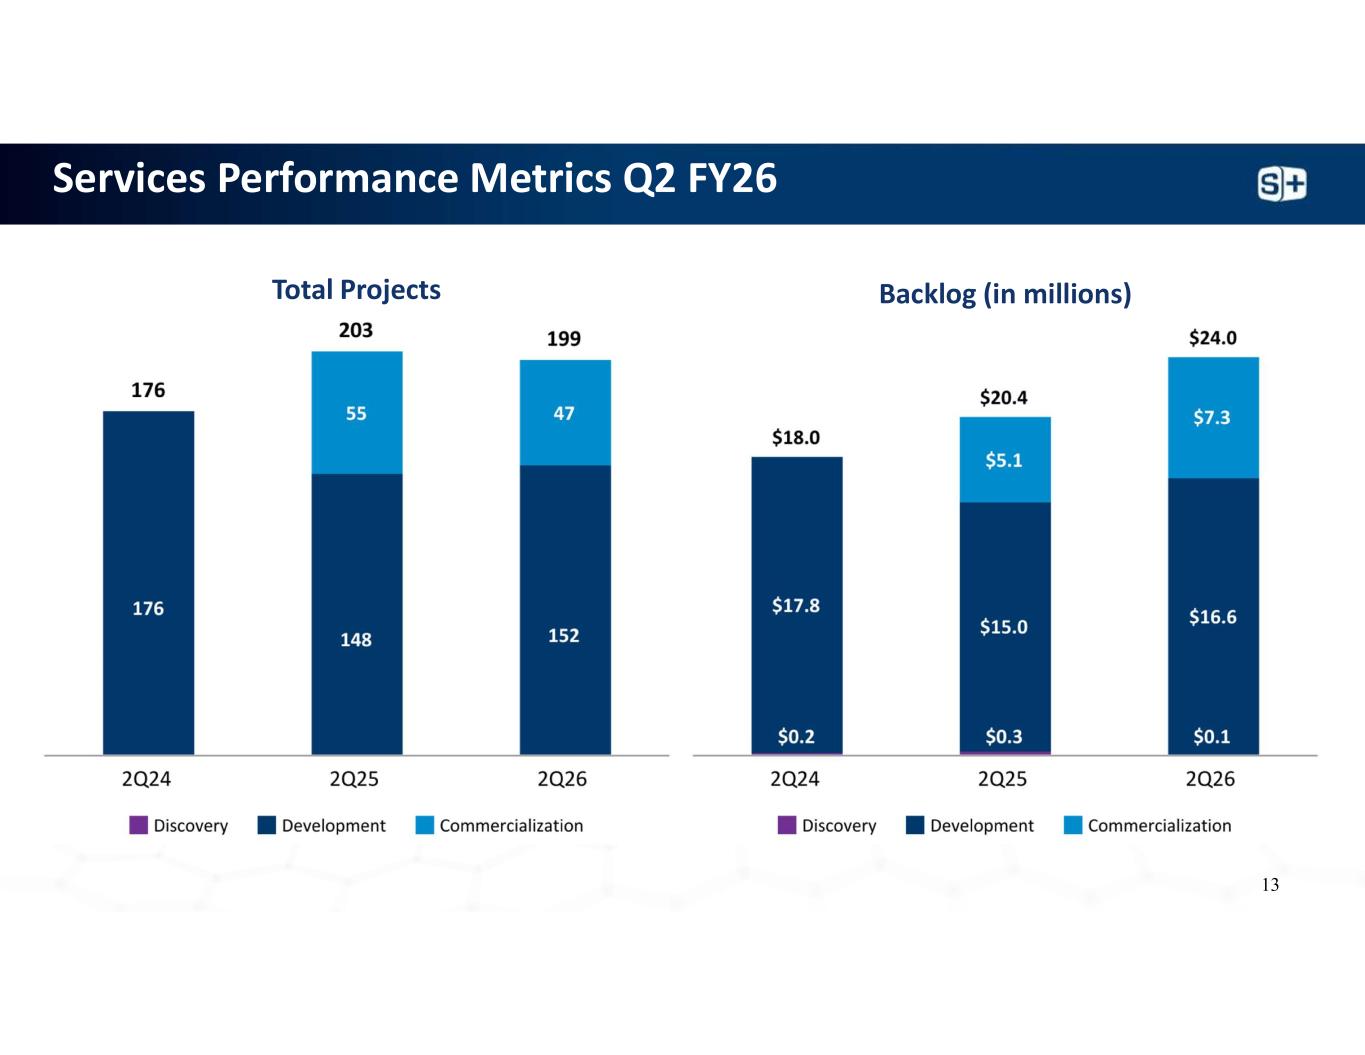
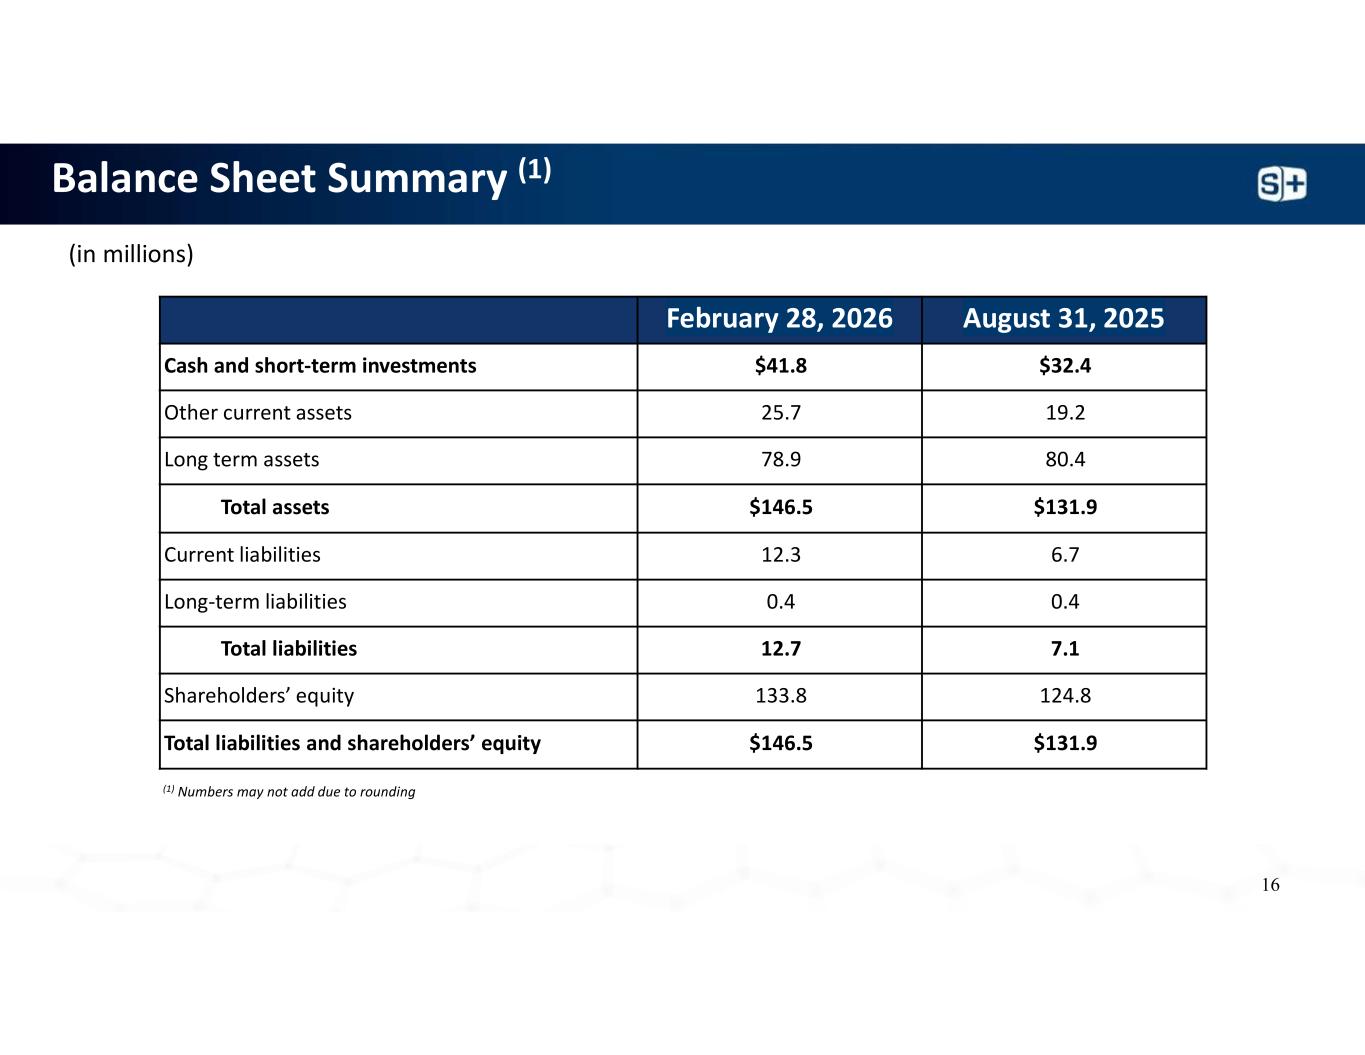
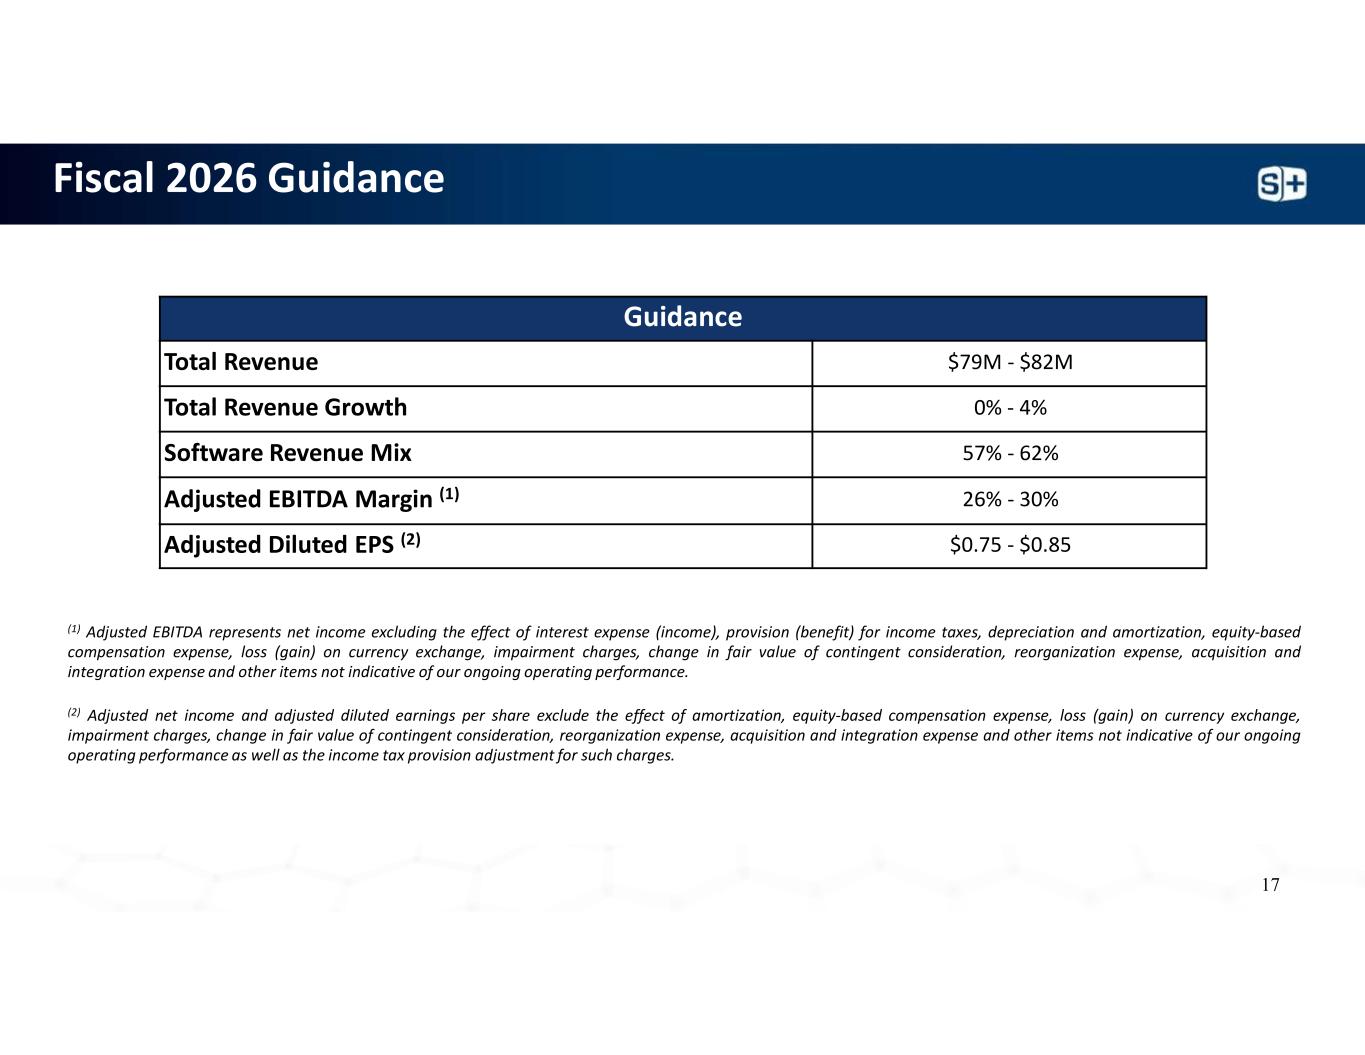
Thank you, Sean. To recap our second quarter performance, total revenue increased 8% to $24.3 million. Software revenue increased 9%, representing 60% of total revenue. and services revenue increased 8%, representing 40% of total revenue. Turning to software highlights for the quarter, discovery revenue, primarily from AdMet Predictor, increased 19% for the quarter and 6% for the trailing 12-month period. The contribution as a percentage of total software revenue was 19% during the quarter and 18% for the trailing 12 months. Development revenue, primarily from GastroPlus and Monolix Suite, increased 12% for the quarter and 3% for the trailing 12-month period. The contribution was 78% of total software revenue for both the quarter and the trailing 12 months. Clinical operations revenue, primarily from proficiency, declined 54% for the quarter and 58% for the trailing 12-month period. The contribution during the quarter was 3% of total software revenue and 3% for the trailing 12 months. We ended the quarter with 297 commercial clients, achieving an average revenue per client of $124,000 and a 91% renewal rate for the quarter. On a trailing 12-month basis, we achieved average revenue per client of $148,000 and our renewal rate was 87%. While we've seen a decline in software renewal rates, it's worth diving a bit deeper into the patterns we've seen. For top 20 pharma clients, we've historically had 100% logo retention. For $1 billion plus pharma, defined as companies generating over $1 billion in global revenue, we've seen 90% logo retention. Churn has predominantly been with other commercial pharma, defined as biopharma companies with at least one approved product and less than $1 billion in revenue, and pre-commercial biotech, defined as biotech companies without an approved therapy. This is consistent with historically more episodic versus recurring demand as pipelines progress with the challenging early-stage biopharma market backdrop over the last few years. Our top 25 customers represent about 46% of overall software revenue, and these customers are highly stable with 100% logo retention and 90% plus gross revenue retention. As we continue to assess software renewal rates and advance our sales team reorganization from product-focused selling to a regional, account-based model centered on deepening client relationships, we plan to provide increased visibility into software retention and cross-sell expansion opportunities. For example, in fiscal 2025, we saw the following from clients with software revenue greater than $100,000. 50% purchased two software products, 23% purchased three software products, and 15% purchased four or more products. We believe this creates meaningful cross-sell and upside opportunities as reflected in the continued growth of average software revenue per client. We look forward to providing additional insight into these performance metrics over time. Turning to services highlights for the quarter, development services, which includes our biosimulation services, increased 12% for the quarter and declined 3% for the trailing 12-month period. The contribution during the quarter was 77% of total services revenue and 75% for the trailing 12 months. Commercialization services, which includes our MedCom services, declined 1% for the quarter and increased 66% for the trailing 12-month period. The contribution during the quarter was 23% of total services revenue and 25% for the trailing 12 months. Total services projects worked on during the quarter were 199, and ending backlog increased 18% to 24 million from 20.4 million last year. Overall, we have a healthy pipeline of services projects. Total gross margin for the second quarter was 66%, with software gross margin of 89% and services gross margin of 33%. On a comparative basis, total gross margin for the prior period was 59%, with software gross margin of 81%, and services gross margin of 25%. The increase in software gross margin was primarily driven by increased software-related revenue, particularly from development and discovery solutions, and lower software-related costs, largely reflecting reduced amortization expense following the impairment charge in the third quarter of fiscal 2025. Other income was $0.3 million for the quarter compared to $0.8 million last year. The prior year amount included the gain on the change in fair value of contingent consideration related to the Immunetrics holdback liability. Income tax expense was $1.4 million compared to $0.4 million last year, and our effective tax rate was 23% compared to 12% last year. The increase in the tax rate is primarily due to the result of favorable, discrete item in the prior year that did not recur in the current year, a less favorable jurisdictional mix of earnings between the U.S. and France, increased unfavorable global intangible low-taxed income, or GILTI, impacts driven by higher French taxable income, and a lower foreign-derived Intangible Income, or FIDI, benefit. In addition, certain items affecting the current year effective tax rate relate to accelerated deductions elected under the One Big Beautiful Bill Act. These deductions are expected to be favorable to cash flows as they accelerate the timing of tax benefits and reduce near-term cash tax payments. As a result, we now expect our effective tax rate for fiscal 2026 to be between 23 to 25 percent as compared to our previous expectation of 12 to 14 percent. Moving to our balance sheet, we ended the quarter with $41.8 million in cash and short-term investments. We remain well capitalized with no debt and strong free cash flow as we continue to execute our growth and innovation strategy. Our guidance for fiscal 2026 remains relatively unchanged from what we previously provided. Total revenue between $79 to $82 million. Year-over-year revenue growth between 0 to 4%. Software mix between 57 to 62%. adjusted EBITDA margin between 26% to 30%. Adjusted diluted earnings per share is now expected to range between $0.75 to $0.85, which reflects the change in our effective tax rate we just discussed. For the third quarter of 2026, we anticipate revenue to be between $20 to $22 million, adjusted EBITDA margin of 27 to 33 percent, and adjusted diluted EPS between 20 to 27 cents. I will now turn the call back to Sean. Thank you, Will.
As I mentioned before, we're pleased with our first app performance and remain excited about the opportunities ahead. Simulations Plus is transitioning from a set of innovative modeling tools into an integrated AI-driven biosimulation ecosystem, supporting the full drug development lifecycle, from discovery through commercialization. Our core purpose remains unchanged, empowering our clients to deliver safer, more effective therapies through science-driven innovation. What's accelerating is how we execute against that mission. By combining our validated scientific engines with enhanced cloud capabilities, AI-powered workflows, and a coordinated roadmap, we're delivering greater speed, consistency, and interoperability to our clients. Thank you for joining the call today. And with that, we'll open the call for questions.
Operator
Thank you. And with that, we will now be conducting a question and answer session. If you would like to ask a question, please press star 1 on your telephone keypad. The confirmation tone will indicate that your line is in the question queue. You may press star 2 to remove yourself from the queue. For any participants using speaker equipment, it may be necessary to pick up the handset before pressing the star keys. One moment while we poll for questions. And our first question comes from the line of Matt Hewitt with Craig Column.
Please proceed with your question. good afternoon and thanks for taking the questions obviously it's it's nice to hear we're starting to see some positive impact from the changes that we started to see last fall but maybe first up i was hoping we could dig in a little bit on the three large pharma customers that you announced here a couple weeks ago kind of coming in and adopting the you know the four major platforms could you walk through exactly how that's going to work what you know what does that what do those contracts look like? Is it cross-selling that's already occurring? Just any more color there I think would be helpful.
Yeah, we announced a few weeks ago the collaborations with three large pharma accounts.
Those collaborations have been underway for a longer period of time. These are not new relationships beginning. They've been involved in our product roadmap development for some time prior to our unveiling of it at the investor day meeting in January. Each of the collaborations has a little bit different focus across the scientific engines, but they cover collectively all of our scientific engines. Collaboration is one of working together to ensure that we've got good visibility to their needs, their workflows internal to their organization so that we can match the development of the AI capabilities to meet their needs and fit into their environments. It's good to have two or three of these relationships so that not every company is unique as to how they're deploying their efforts on the AI side. So it allows us to develop our solutions in a way that can be tailored to different needs across the pharma companies. So we're engaging with them on a product development basis. There has been some financial component to at least one of the relationships already. The financial relationship going forward with each of the parties is in discussion right now as to what the long-term takedown across the technology platform will be. Very important, similar to what we've done. Big engines have been developed in a series of collaborations with our clients, with regulatory bodies. It's what's made them on target in terms of the needs of drug development. And good to see that that's continuing through our AI developments today.
That's super helpful. And then maybe a follow-up question. You noted you're having some success with cross-selling already. And you also mentioned that, you know, during the quarter you won some new logos. I'm just curious, are those new logos customers that maybe hadn't adopted your software services before? Are these competitive conversions like you're winning business or taking share? Just any other color there would be helpful as well. Thank you.
As new logos, non-existing customers that are taking down solutions for the first time so they're new to us in terms of the competitive situation in terms of their selection of our product we have to anecdotally go through each and every one and as will described in terms of the stability of of our client base that the you know certainly the large top 20 as well as the billion dollar large pharma companies new logo opportunities you know are going to be at the lower end of the environment or size of clients so those customers you know can be clients that are just an initially, starting up internal capabilities for biosimulation. But in some cases, they may be moving from competitive.
Got it. Thank you. Thank you.
Operator
And our next question comes from the line of Constantine Dates with Citizen. Please proceed with question.
Thanks. Just a couple questions here. First, noticed a large sequential uptick in the commercial portion of the services backlog. And just wanted to get a sense for maybe the proficiency pipeline in both software and services, size of deals that you're seeing, and then any seasonality we should consider as we think about that business over the back half of the year.
Sure. The backlog is, as a reminder, entirely service revenue-based. So that's driven 75% of our service businesses. In the development space, 25% is in the medcommunications space, that revenue, service revenue stream that came to us through the acquisition of proficiency. We started to see a good pipeline activity and closure as we exited 25% and saw a good delivery in terms of service revenue in the first quarter. and that's continued into the second quarter here. So that side of our business is learned quite nicely right now. Turning to the proficiency question, all the backwards leverage off of the service, the medcommunications service business through the halfway points of the year is up nicely. They had a very good first quarter. Their second quarter growth was not as high on a percentage basis, but a good contribution. And certainly, cumulatively, through the midpoint of the year, they're performing quite nicely. On the software side, that performance has gone as anticipated. To recall, beginning of 25, post-acquisition of proficiency, their first couple of quarters delivered good revenue. clinical trial after 25 certainly brought that run rate of software revenue contribution down. That's continued into the first half of the year. It's stabilized at a good sort of point, if you will, and reasonable growth.
Great. And then just appreciate the added color on some of the product update. I think you said 50% of your customers have two or more and some other metrics around that. I guess when you think about upsell, Sean, where's the biggest opportunity? Is it getting single product customers to two? Is it getting some of the two product customers to three? Just how should we think about sort of, you know, progress in that metric over time and what's feasible?
Yeah, it's an opportunity exists at all of those levels. Taking a client from one to two and two to three and beyond we historically have seen you know good linkage between advent predictor and gastro plus often our two product test customers might start with those two obviously the monolix product that came to us through acquisition point five years ago now is a nice complement in the PKPV space for our clients to reach out and bring on board. And we've seen, you know, over the last number of years, very strong growth in our revenue from the Monolix PKPV platform. So opportunity exists across all the machinations there in terms of which products. And I think, you know, the opportunity here is for that to accelerate driven by A, our reorganization of our business development organization from sellers, if you will, of each of the point solutions independently, so to speak, or quoted by product to an environment in which we are geographically and named account organized with quotas that people carry that are quotas for our clients as opposed to quotas for specific products. I think that focus will help in terms of our cross. Secondly, the development and delivery of our ecosystem, as we've described, that enhances the interoperability across these scientific engines tremendously. And as well, putting it into the cloud offers more opportunity for the smaller and medium-sized entities out there to gain access. So that may be a new logo opportunity, but that new logo opportunity then rolls into cross-selling opportunities. So from both an organizational and our sales approach perspective as well as our product roadmap, I think we are very focused on the opportunity certainly is quite large there.
Operator
And our next question comes from the line of Max Smock to William Blair. Please proceed with your question.
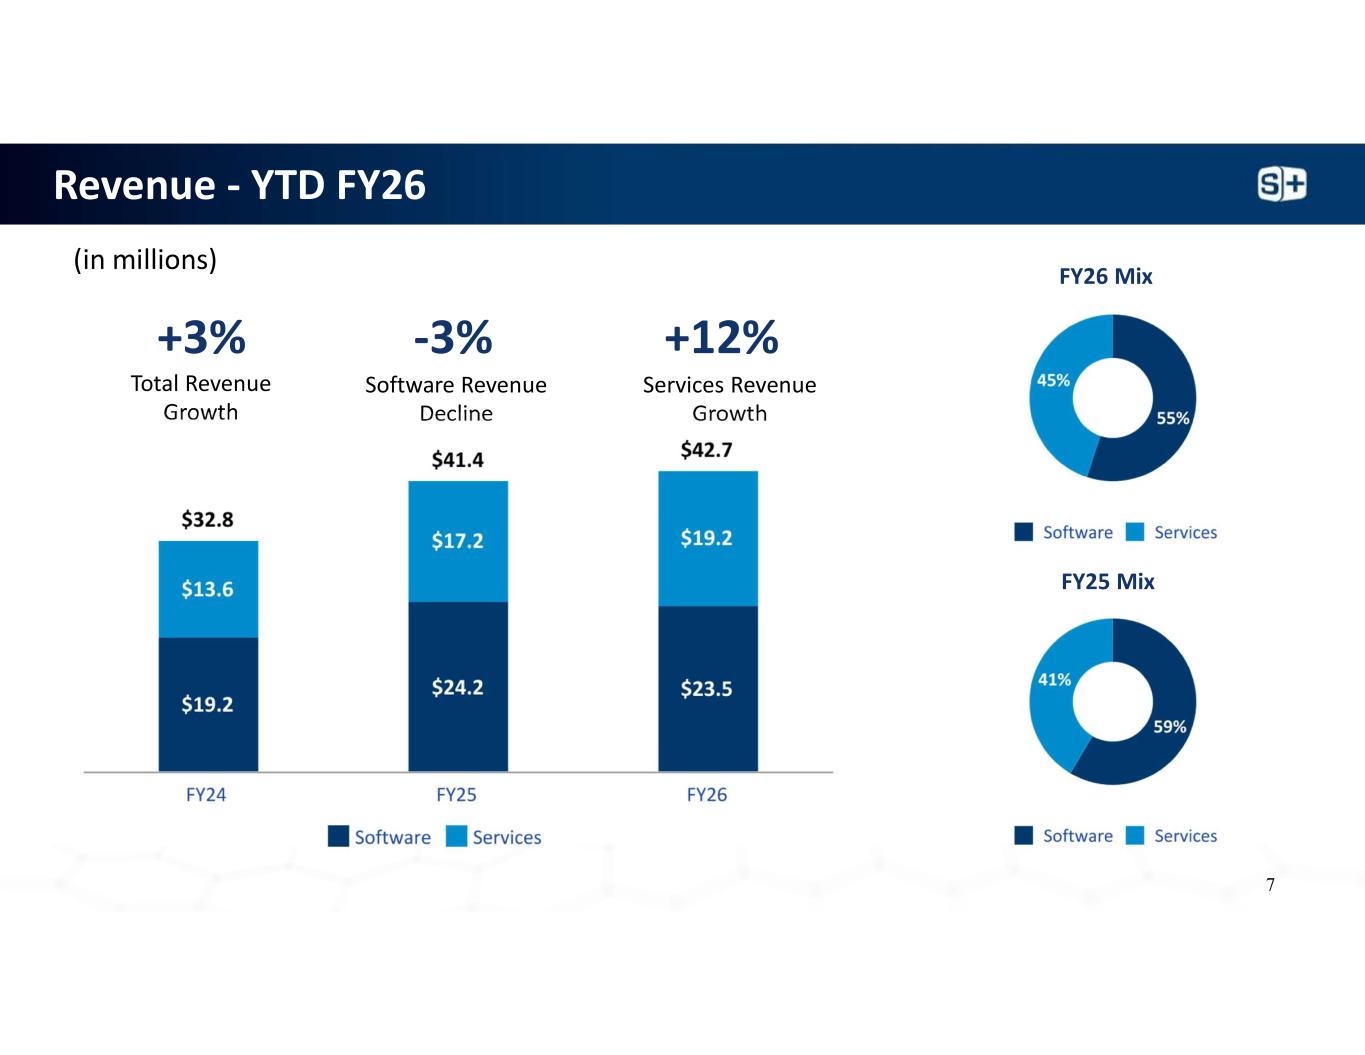
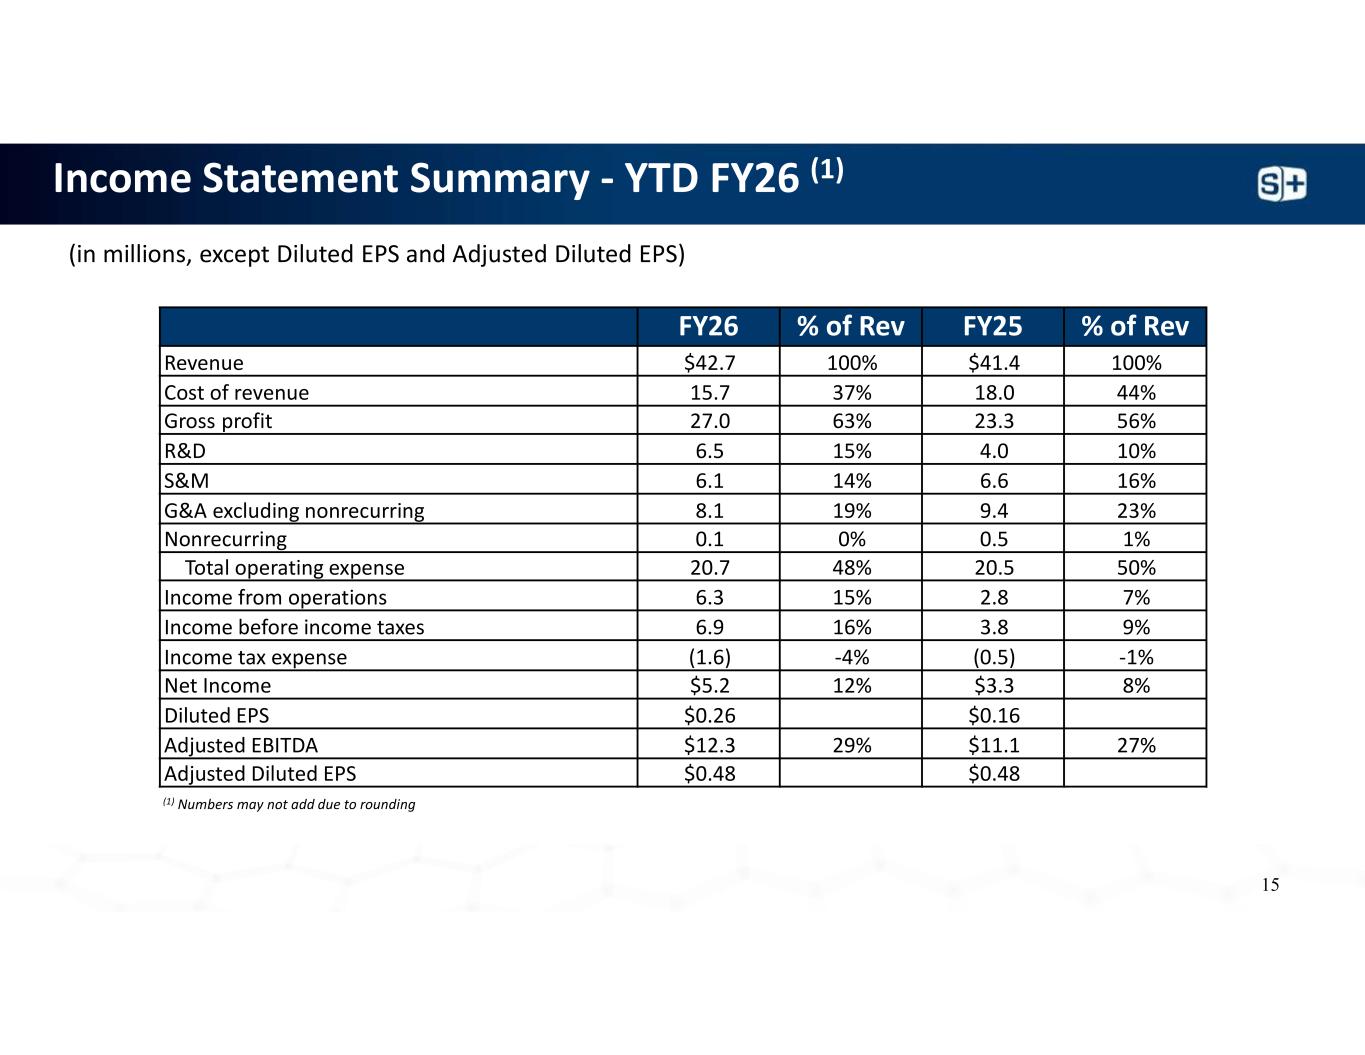
Sean, I will. Thanks for taking our questions. I'm wondering if you could discuss where you're at right now, halfway through the year relative to your expectations when you gave your initial guide at the end of last year. Just trying to get a sense for the level of conservatism that's embedded in the guide in light of, you know, your bullish macro commentary and the growing interest in NAMS. Just kind of looking at the numbers, you know, revenue up 3% in 1H, but I think guidance implies basically flat revenue in the second half off of what looks like easier comp. So if you can just maybe level set and help us understand the thought process behind not taking up the guide on the back of the really strong results we saw here in the second quarter.
Sure, Max. Not a surprising question. You know, we, you know, each quarter, each opportunity we report, take a look at the guidance opportunity to adjust as warranted. You know, I think we're operating still in an environment that fragile might be a reasonable term to use. We see a lot of momentum, good spending in part of our clients, but we've got macro issues in terms of global politics, as well as the more specific farmer-related scenarios that could raise their head. And so a cautious approach to this, based upon our experience over the last 24 months, drives us pretty strongly here. That being said, yeah, the momentum seems to be building a bit. We've delivered quite nicely in the first couple of quarters here, and certainly it puts us moving into the back half of the year with greater confidence in terms of the guidance that we've got out there, but a relatively cautious approach in terms of let's not take a one or two quarter.
Yeah, that's really helpful. Thank you, Sean. And maybe just following up on that, particularly your comment around, you know, the fragile environment. You know, it's probably hard to tell to some extent, but just wondering, you know, if you can bifurcate a little bit between the momentum you're seeing, whether, you know, how much of that's coming from just an overall recovery in the macro environment and biopharma spend more broadly versus how much of that recovery do you think is more a function of just increasing interest and growing adoption of NAMS specifically?
You know, I'd say broadly. I mean, when we say NAMS, some people might jump and say, boy, is that the animal testing announcement? And I would say the momentum built here is certainly that's on the horizon, but it's a horizon still a couple of years out. So in general, the support for biosimulation for in silico methodologies for AI is strong broadly from the regulatory perspective I think our clients shifted in 25 to a AI investment strategy which was partnership with other that shift is now causing them to take a look at internal implementation of AI I think there's a lot of momentum building out of those endeavors, certainly in that environment. I think it's pretty broad-based, but, you know, we operate in it.
Thank you for taking our questions.
Operator
Thank you. And our next question comes from the line of Jeff Garo. Stevens, please proceed with your question.
Yeah, good afternoon. Thanks for taking the questions. I want to ask a little bit more on cross-selling. You just kind of hit the macro versus micro part of that topic, but I was hoping you could dive up a little bit further on evaluating your progress to reach multiple buyers within your clients' organizations, getting kind of beyond the modeling department with these clients.
That's a good question, Jeff. Getting as much of your targeted budget as you can as an objective, but also looking for other pockets of budget within our clients has always been something that has been at the forefront here. Our efforts in terms of the proficiency acquisition opened up our reach into clinical trial operation budgets. And so that is certainly presents more TAM at a macro level and specifically a network into another part of our client organizations and new budget dollars. I'd say the most predominant one, again, is in the arena of the AI budget within our clients. And I think in that regard to the collaborations that we've announced. Those collaborations have served well our ability to leverage our very strong modeling and simulation relationships, leverage that into relationship builds with the AI leaders within those collaborative clients, building that relationship and, in fact, opportunity for the funding of our ecosystem and our AI functionality to be sourced outside the traditional modeling and simulation budget. And I think that bodes well. And when I step back and look at it and sort of estimate the growth of modeling and simulation budgets, you really need to open up your eyes and see that that growth is incremental when you look at the AI budgets alongside the modeling and simulation budgets. And certainly the AI spend, those budgets in our clients, is broad-based across the full continuum from patient recruitment to all kinds of investments of AI that a pharma company may be making. But a portion of that AI budget is in the biosimulation space. for budget growth and modeling and simulation. We see the traditional momentum picking up there, but the icing on the cake, a very thick icing.
I appreciate all those comments.
And probably a nice segue to the other question I wanted to ask on AI monetization. You said that we should have low to minimal expectations for AI monetization this year. You mentioned that discussions are really still ongoing on the economic model with your collaborative partners that you recently announced, but still want to ask just kind of what timing is on when AI monetization starts to show in the P&L how we should think about the pacing of those discussions. and maybe just more broadly what we can look to as potential proof points that AI is generating incremental value outside from the likely aid that it will provide to renewal and retention efforts?
Yeah, good question. That discussions are underway with those collaborators, which will, just as they are proving the path forward on the technology development, they will prove the path forward in terms of monetization. And I'd say at this stage that the recognition of the value of the incremental technology is very visible and accepted on the part of our clients. And so the groundwork, if you will, in terms of value and monetization is there. The mechanics of how that rolls out is where the discussions lie right now. We've certainly not anticipated in fiscal year 26 significant contribution from this arena at all in our guidance per se. And, you know, it inevitably is also tied to commercial delivery of this technology. So, you know, I would look out to this.
Great. Thanks for taking the questions. Thank you.
Operator
And our next question comes from the line. I know David Larson with VTIG. Please proceed with your question.
Hi. Are any of the sort of large AI companies clients of yours, like Google DeepMind comes to mind, or any of these other organizations?
I mean, yeah, the historical direct discovery, primarily AI entities, recursions, feedmines, benevolent AIs of the world. Yeah, generally, it's not 100% coverage, but a good percentage of those are licensing some footprint of our software, yes.
So you're generating revenue from the AI market already supporting these AI organizations, And I would imagine they need SLP because of your data dictionaries, because of the training of your scientists, because of all of the data and models that you've built over the past decades, that they can then search that.
Is that right? well ultimately they they have you know evolved into drug development companies uh they are all uh you know for the most part in discovery some have you know reached early clinical status with a program or two um and uh you know so uh historically to date primarily the opportunity our discovery platform is admit predictor um so it's i've met predictor and its utility in terms of property prediction is what is of value to them now as they move into the clinic. The scientific engines of GastroPlus and Monolex and Baileys become candidates for their use in the clinical development.
Okay, great. Thanks very much. I'll hop back in the queue.
Operator
Thank you. And our next question comes from the line of Brendan Smith with TD Calum. Please proceed with your question. Thanks for taking the questions, guys.
Maybe first, just on some of the services metrics that you show, I think it's on slide 13, if I'm not mistaken, I just want to make sure I'm understanding correctly, I guess how should we think about kind of the relative decline, albeit pretty minimal, in total projects year-over-year versus the increase in backlogs there specifically? Is that kind of a function more of the types of projects you're moving into, the customers themselves, or I guess are there any other dynamics at play there?
Yeah, you know, a number of projects can, you know, evolve over time. We can have, you know, projects that are consuming a good percentage of our staff in a particular quarter and other quarters where we're working on smaller medium-sized projects and whatnot so that can kind of ebb and flow quite a bit. The backlog growth is nice getting back to prior year levels here in terms of our total backlog and it's good measurement in terms of our pipeline on service as it's closing ahead of actual performance of those projects.
Okay, got it. Super helpful. And then maybe a second one, just looking at kind of slide nine, I think where you had the comparison of FQ2 versus trailing 12 months and just looking at the breakdown of software solutions as a percent of software revs. I mean, it looks pretty stable over the last year, but I guess I'm just wondering if you expect any meaningful shifts in that segment breakdown of the next 12 months, kind of as some of these new, you know, rollouts and, you know, broader sector interest starts to evolve. And I guess if not, with maybe just underpinning some of those assumptions, presumably, I guess, based on your recent conversation. Thanks.
The assumption, I'm underpinned, I'm sorry, but just to clarify the assumption in terms of software and service mix, is that what you're referring to?
Actually, just within the software. I guess what I'm really asking is, you know, it looks like the kind of relative breakdown of which software solutions you have over the last year is pretty consistent with what we saw in Q2. I'm just curious if you're expecting any shift in that just between kind of discovery, development, clinical ops over the next year, just kind of given the, you know, push to get new logos signed and kind of expanding within kind of the sector interest into the space.
Yeah, okay. I understand that. Yeah, you know, clearly our development solutions of Monolix and the Castro Plus are the key drivers in terms of our software revenue with AdMet Predictor contributed the proficiency training platform providing contribution but the smallest piece of the pie there you know the cross-selling opportunities would you know support both somewhat in the admin predictor and gastroplus space, but significantly in terms of monolix, seeing more of the largest pharma plus top 20 clients take on monolix as their preferred platform in the PKPV space. That slice could grow its content in terms of percentage growth than the other solutions for the last couple of three years. So seeing it grow would not surprise me. New logos, you know, often the starting point there is going to be either GastroPlus or Monolix, if it's a development company, if it's a pre-product biotech company. They're in discovery, probably. I think we've seen some stability.
Okay, got it. Yep, makes a lot of sense. Thanks, guys.
Operator
Thank you. And with that, there are no further questions at this time. I'd like to turn the call back over to Sean O'Connor for any closing remarks.
Over the next few months, we've got a number of investor conferences, including the RBC Global Healthcare Conference, Craig Halen Conference, TD Calen, Fifth Annual Tools and Diagnostic Revolution, and the Citizens Medical Devices and Healthcare Services Forum. Hope we can see many of you there. Otherwise, I appreciate the opportunity to deliver this quarter's results to you. I look forward to speaking again next quarter. Take care, everyone.
Operator
And with that, ladies and gentlemen, this does conclude today's teleconference. We thank you for your participation, and you may not disconnect your lines, and have a wonderful day.