
Suncor Energy Inc 6-K, filed May 9, 2023
Suncor Energy Inc (SU)
About this 6-K
Suncor Energy Inc filed this 6-K on May 9, 2023.
FORM 6-K
SECURITIES AND EXCHANGE COMMISSION
WASHINGTON, D.C. 20549
Report of Foreign Private Issuer
Pursuant to Rule 13a - 16 or 15d - 16 of
the Securities Exchange Act of 1934
| For the month of: May 2023 | Commission File Number: 1-12384 |
SUNCOR ENERGY INC.
(Name of registrant)
150 – 6th Avenue S.W.
P.O. Box 2844
Calgary, Alberta
Canada, T2P 3E3
Indicate by check mark whether the registrant files or will file annual reports under cover of Form 20-F or Form 40-F:
| Form 20-F | ¨ | Form 40-F | x |
The Registrant’s Management’s Discussion and Analysis for the first quarter ended March 31, 2023, included as Exhibit 99.1 of this Form 6-K, and the Unaudited Consolidated Financial Statements for the first quarter ended March 31, 2023, included as Exhibit 99.2 of this Form 6-K, are each incorporated by reference into and as an exhibit to, as applicable, the Registrant’s Registration Statements under the Securities Act of 1933: Form S-8 (File No. 333-87604), Form S-8 (File No. 333-112234), Form S-8 (File No. 333-118648), Form S-8 (File No. 333-124415), Form S-8 (File No. 333-149532), Form S-8 (File No. 333-161021), Form S-8 (File No. 333-161029) and Form F-10 (File No. 333-265216).
SIGNATURES
Pursuant to the requirements of the Securities Exchange Act of 1934, the registrant has duly caused this report to be signed on its behalf by the undersigned, thereunto duly authorized.
| SUNCOR ENERGY INC. | |||
| Date: | By: | ||
| May 8, 2023 |
“Shawn Poirier” | ||
| Shawn Poirier Assistant Corporate Secretary | |||
EXHIBIT INDEX
| | | | | | 8 | | | |
| | | | | | 9 | | | |
| | | | | | 10 | | | |
| | | | | | 15 | | | |
| | | | | | 26 | | | |
| | | | | | 27 | | | |
| | | | | | 29 | | | |
| | | | | | 32 | | | |
| | | | | | 34 | | | |
| | | | | | 35 | | | |
| | | | | | 42 | | | |
| | | | | | 43 | | |
| | | | |
Three months ended
March 31 |
| |||||||||
| |
($ millions)
|
| |
2023
|
| |
2022
|
| ||||||
| | Earnings (loss) before income taxes | | | | | | | | | | | | | |
|
|
||||||||||||||
| |
Oil Sands
|
| | |
|
1 477
|
| | | | | 2 309 | | |
|
|
||||||||||||||
| |
Exploration and Production
|
| | |
|
375
|
| | | | | 645 | | |
|
|
||||||||||||||
| |
Refining and Marketing
|
| | |
|
993
|
| | | | | 1 417 | | |
|
|
||||||||||||||
| |
Corporate and Eliminations
|
| | |
|
(131)
|
| | | | | (523) | | |
|
|
||||||||||||||
| | Income tax expense | | | |
|
(662)
|
| | | | | (899) | | |
| | Net earnings | | | |
|
2 052
|
| | | | | 2 949 | | |
| | Adjusted operating earnings (loss)(1) | | | | | | | | | | | | | |
|
|
||||||||||||||
| |
Oil Sands
|
| | |
|
1 490
|
| | | | | 2 256 | | |
|
|
||||||||||||||
| |
Exploration and Production
|
| | |
|
375
|
| | | | | 645 | | |
|
|
||||||||||||||
| |
Refining and Marketing
|
| | |
|
998
|
| | | | | 1 395 | | |
|
|
||||||||||||||
| |
Corporate and Eliminations
|
| | |
|
(430)
|
| | | | | (669) | | |
|
|
||||||||||||||
| |
Income tax expense included in adjusted operating earnings
|
| | |
|
(624)
|
| | | | | (872) | | |
| | Total | | | |
|
1 809
|
| | | | | 2 755 | | |
| | Adjusted funds from (used in) operations(1) | | | | | | | | | | | | | |
|
|
||||||||||||||
| |
Oil Sands
|
| | |
|
2 588
|
| | | | | 3 414 | | |
|
|
||||||||||||||
| |
Exploration and Production
|
| | |
|
491
|
| | | | | 724 | | |
|
|
||||||||||||||
| |
Refining and Marketing
|
| | |
|
1 194
|
| | | | | 1 597 | | |
|
|
||||||||||||||
| |
Corporate and Eliminations
|
| | |
|
(533)
|
| | | | | (665) | | |
|
|
||||||||||||||
| |
Current income tax expense
|
| | |
|
(738)
|
| | | | | (976) | | |
| | Total | | | |
|
3 002
|
| | | | | 4 094 | | |
| |
Change in non-cash working capital
|
| | |
|
(1 963)
|
| | | | | (1 022) | | |
|
|
||||||||||||||
| | Cash flow provided by operating activities | | | |
|
1 039
|
| | | | | 3 072 | | |
| | Capital and exploration expenditures(2)(3) | | | | | | | | | | | | | |
|
|
||||||||||||||
| |
Asset sustainment and maintenance
|
| | |
|
590
|
| | | | | 512 | | |
|
|
||||||||||||||
| |
Economic investment
|
| | |
|
438
|
| | | | | 462 | | |
| |
Total
|
| | | | 1 028 | | | | |
|
974
|
| |
| | | | |
Three months ended
March 31 |
| |||||||||
| |
($ millions)
|
| |
2023
|
| |
2022
|
| ||||||
| | Free funds flow(1) | | | |
|
1 916
|
| | | | | 3 083 | | |
| | | | |
Three months ended
March 31 |
| |||||||||
| | | | |
2023
|
| |
2022
|
| ||||||
| | Production volumes | | | | | | | | | | | | | |
|
|
||||||||||||||
| |
Oil Sands – Upgraded – net SCO and diesel (mbbls/d)
|
| | |
|
497.8
|
| | | | | 515.3 | | |
|
|
||||||||||||||
| |
Oil Sands – Non-upgraded bitumen (mbbls/d)
|
| | |
|
177.3
|
| | | | | 170.4 | | |
| | Total Oil Sands production volumes (mbbls/d) | | | |
|
675.1
|
| | | | | 685.7 | | |
| |
Exploration and Production (mboe/d)
|
| | |
|
67.0
|
| | | | | 80.4 | | |
| | Total (mboe/d) | | | |
|
742.1
|
| | | | | 766.1 | | |
| | Refinery utilization (%) | | | |
|
79
|
| | | | | 94 | | |
|
|
||||||||||||||
| | Refinery crude oil processed (mbbls/d) | | | |
|
367.7
|
| | | | | 436.5 | | |
| | | | |
Three months ended
March 31 |
| |||||||||
| |
($ millions)
|
| |
2023
|
| |
2022
|
| ||||||
| | Net earnings | | | |
|
2 052
|
| | | | | 2 949 | | |
|
|
||||||||||||||
| |
Unrealized foreign exchange loss (gain) on U.S. dollar denominated debt
|
| | |
|
3
|
| | | | | (146) | | |
|
|
||||||||||||||
| |
Unrealized loss (gain) on risk management activities
|
| | |
|
18
|
| | | | | (75) | | |
|
|
||||||||||||||
| |
Gain on significant disposal
|
| | |
|
(302)
|
| | | | | — | | |
|
|
||||||||||||||
| |
Income tax expense on adjusted operating earnings adjustments
|
| | |
|
38
|
| | | | | 27 | | |
| | Adjusted operating earnings(1) | | | |
|
1 809
|
| | | | | 2 755 | | |

| | | | |
Three months ended
March 31 |
| |||||||||
| |
($ millions)
|
| |
2023
|
| |
2022
|
| ||||||
| | Operations, selling and corporate costs | | | |
|
2 726
|
| | | | | 2 333 | | |
|
|
||||||||||||||
| | Commodities | | | |
|
551
|
| | | | | 498 | | |
|
|
||||||||||||||
| | Share-based compensation and other(1) | | | |
|
147
|
| | | | | 257 | | |
| | Total operating, selling and general expenses | | | |
|
3 424
|
| | | | | 3 088 | | |
| | | | | | | |
Average for the
three months ended March 31 |
| |||||||||
| | | | | | | |
2023
|
| |
2022
|
| ||||||
| | WTI crude oil at Cushing | | |
US$/bbl
|
| | |
|
76.10
|
| | | | | 94.40 | | |
|
|
|||||||||||||||||
| | Dated Brent crude | | |
US$/bbl
|
| | |
|
81.25
|
| | | | | 101.50 | | |
|
|
|||||||||||||||||
| | Dated Brent/Maya crude oil FOB price differential | | |
US$/bbl
|
| | |
|
18.40
|
| | | | | 14.30 | | |
|
|
|||||||||||||||||
| | MSW at Edmonton | | |
Cdn$/bbl
|
| | |
|
99.05
|
| | | | | 115.75 | | |
|
|
|||||||||||||||||
| | WCS at Hardisty | | |
US$/bbl
|
| | |
|
51.35
|
| | | | | 79.80 | | |
|
|
|||||||||||||||||
| | WTI-WCS light/heavy differential | | |
US$/bbl
|
| | |
|
(24.75)
|
| | | | | (14.60) | | |
|
|
|||||||||||||||||
| | SYN-WTI differential | | |
US$/bbl
|
| | |
|
2.10
|
| | | | | (1.30) | | |
|
|
|||||||||||||||||
| | Condensate at Edmonton | | |
US$/bbl
|
| | |
|
79.85
|
| | | | | 96.15 | | |
|
|
|||||||||||||||||
| | Natural gas (Alberta spot) at AECO | | |
Cdn$/GJ
|
| | |
|
3.05
|
| | | | | 4.50 | | |
|
|
|||||||||||||||||
| | Alberta Power Pool Price | | |
Cdn$/MWh
|
| | |
|
142.00
|
| | | | | 90.00 | | |
|
|
|||||||||||||||||
| | New York Harbor 2-1-1 crack(1) | | |
US$/bbl
|
| | |
|
36.70
|
| | | | | 28.25 | | |
|
|
|||||||||||||||||
| | Chicago 2-1-1 crack(1) | | |
US$/bbl
|
| | |
|
31.55
|
| | | | | 20.20 | | |
|
|
|||||||||||||||||
| | Portland 2-1-1 crack(1) | | |
US$/bbl
|
| | |
|
37.40
|
| | | | | 33.80 | | |
|
|
|||||||||||||||||
| | Gulf Coast 2-1-1 crack(1) | | |
US$/bbl
|
| | |
|
37.65
|
| | | | | 26.80 | | |
|
|
|||||||||||||||||
| | U.S. Renewable Volume Obligation | | |
US$/bbl
|
| | |
|
8.20
|
| | | | | 6.45 | | |
|
|
|||||||||||||||||
| | Exchange rate | | |
US$/Cdn$
|
| | |
|
0.74
|
| | | | | 0.79 | | |
|
|
|||||||||||||||||
| | Exchange rate (end of period) | | |
US$/Cdn$
|
| | |
|
0.74
|
| | | | | 0.80 | | |
| | | | |
Three months ended
March 31 |
| |||||||||
| |
($ millions)
|
| |
2023
|
| |
2022
|
| ||||||
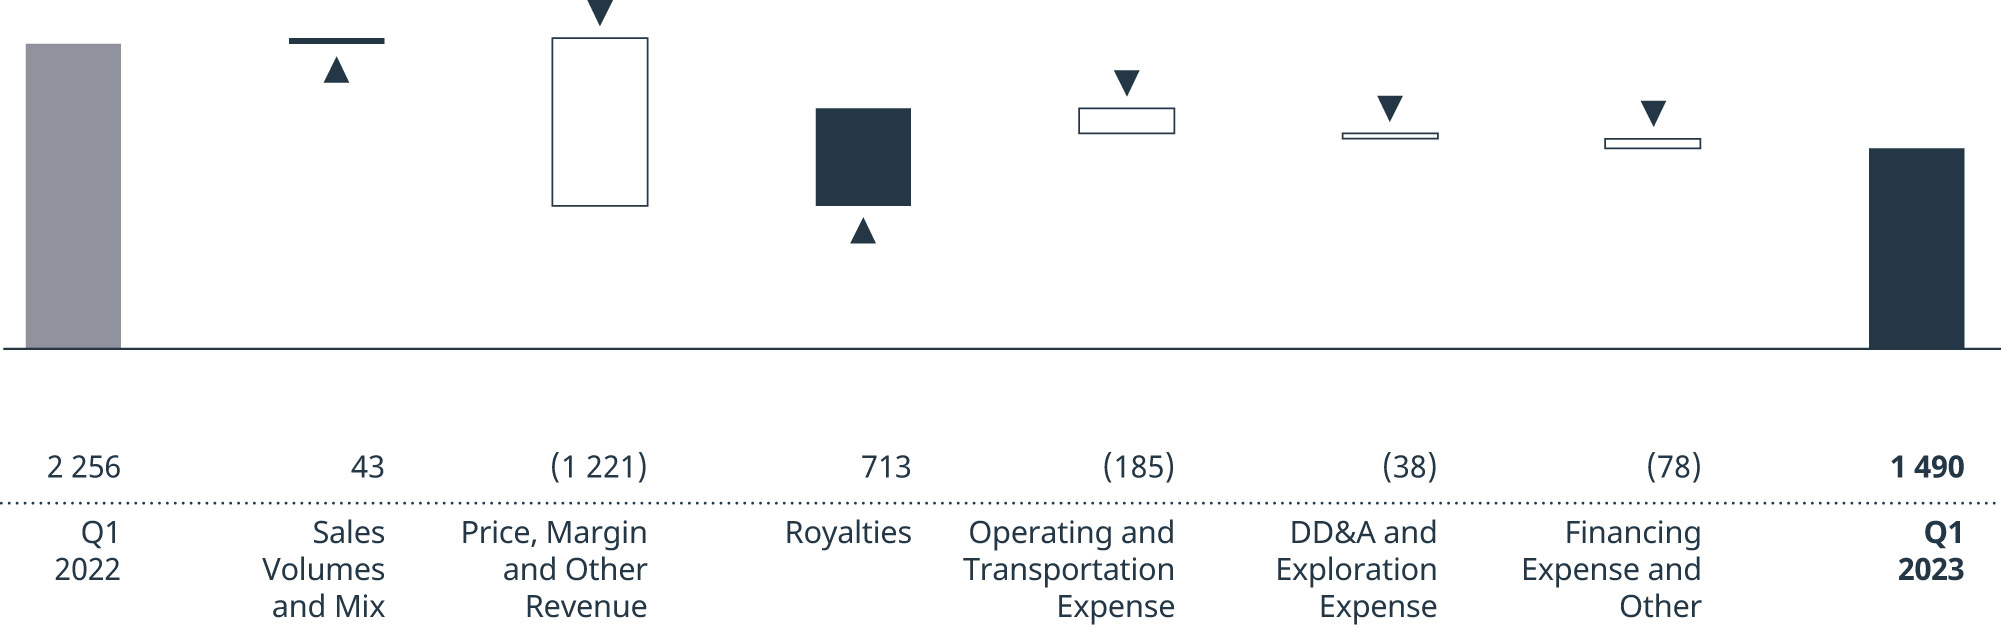
| | Operating revenues | | | |
|
6 067
|
| | | | | 7 470 | | |
|
|
||||||||||||||
| | Less: Royalties | | | |
|
(272)
|
| | | | | (985) | | |
| | Operating revenues, net of royalties | | | |
|
5 795
|
| | | | | 6 485 | | |
| | Earnings before income taxes | | | |
|
1 477
|
| | | | | 2 309 | | |
| | Adjusted for: | | | | | | | | | | | | | |
|
|
||||||||||||||
| |
Unrealized loss (gain) on risk management activities
|
| | |
|
13
|
| | | | | (53) | | |
| | Adjusted operating earnings(1) | | | |
|
1 490
|
| | | | | 2 256 | | |
| | Adjusted funds from operations(1) | | | |
|
2 588
|
| | | | | 3 414 | | |
| | | | |
Three months ended
March 31 |
| |||||||||
| |
(mbbls/d)
|
| |
2023
|
| |
2022
|
| ||||||
| | Total Oil Sands bitumen production | | | |
|
811.3
|
| | | | | 827.7 | | |
| |
SCO and diesel production(2)
|
| | |
|
517.6
|
| | | | | 531.1 | | |
|
|
||||||||||||||
| |
Internally consumed diesel and internal transfers(3)(4)
|
| | |
|
(19.8)
|
| | | | | (15.8) | | |
| | Upgraded production – net SCO and diesel | | | |
|
497.8
|
| | | | | 515.3 | | |
| |
Bitumen production
|
| | |
|
189.8
|
| | | | | 173.6 | | |
|
|
||||||||||||||
| |
Internal bitumen transfers(4)(5)
|
| | |
|
(12.5)
|
| | | | | (3.2) | | |
| | Non-upgraded bitumen production | | | |
|
177.3
|
| | | | | 170.4 | | |
| | Total Oil Sands production | | | |
|
675.1
|
| | | | | 685.7 | | |
| | | | |
Three months ended
March 31 |
| |||||||||
| |
(mbbls/d)
|
| |
2023
|
| |
2022
|
| ||||||
| | Upgraded – net SCO and diesel | | | |
|
504.0
|
| | | | | 517.7 | | |
|
|
||||||||||||||
| | Non-upgraded bitumen | | | |
|
174.1
|
| | | | | 153.7 | | |
| | Total | | | |
|
678.1
|
| | | | | 671.4 | | |
| |
Net of transportation costs, but before royalties
|
| |
Three months ended
March 31 |
| |||||||||
| |
($/bbl)
|
| |
2023
|
| |
2022
|
| ||||||
| | Upgraded – net SCO and diesel | | | |
|
98.87
|
| | | | | 114.37 | | |
|
|
||||||||||||||
| | Non-upgraded bitumen | | | |
|
51.50
|
| | | | | 96.49 | | |
|
|
||||||||||||||
| | Average crude | | | |
|
86.71
|
| | | | | 110.27 | | |
|
|
||||||||||||||
| | Average crude, relative to WTI | | | |
|
(16.18)
|
| | | | | (9.24) | | |
| | | | |
Three months ended
March 31 |
| |||||||||
| |
($ millions, except as noted)
|
| |
2023
|
| |
2022
|
| ||||||
| | Oil Sands operating, selling and general expense (OS&G)(1) | | | |
|
2 421
|
| | | | | 2 212 | | |
| | Oil Sands operations cash operating costs(2) reconciliation | | | | | | | | | | | | | |
|
|
||||||||||||||
| |
Oil Sands operations OS&G
|
| | |
|
1 372
|
| | | | | 1 312 | | |
|
|
||||||||||||||
| |
Non-production costs(3)
|
| | |
|
(51)
|
| | | | | (92) | | |
|
|
||||||||||||||
| |
Excess power capacity and other(4)
|
| | |
|
(142)
|
| | | | | (109) | | |
| |
Oil Sands operations cash operating costs(2)
|
| | |
|
1 179
|
| | | | | 1 111 | | |
|
|
||||||||||||||
| |
Oil Sands operations production volumes (mbbls/d)
|
| | |
|
442.6
|
| | | | | 430.4 | | |
|
|
||||||||||||||
| |
Oil Sands operations cash operating costs(2) ($/bbl)
|
| | |
|
29.60
|
| | | | | 28.70 | | |
| | Fort Hills cash operating costs(2) reconciliation | | | | | | | | | | | | | |
|
|
||||||||||||||
| |
Fort Hills OS&G
|
| | |
|
349
|
| | | | | 266 | | |
|
|
||||||||||||||
| |
Non-production costs(3)
|
| | |
|
(71)
|
| | | | | (38) | | |
| |
Fort Hills cash operating costs(2)
|
| | |
|
278
|
| | | | | 228 | | |
|
|
||||||||||||||
| |
Fort Hills production volumes (mbbls/d)
|
| | |
|
74.7
|
| | | | | 87.5 | | |
|
|
||||||||||||||
| |
Fort Hills cash operating costs(2) ($/bbl)
|
| | |
|
41.40
|
| | | | | 29.00 | | |
| | Syncrude cash operating costs(2) reconciliation | | | | | | | | | | | | | |
|
|
||||||||||||||
| |
Syncrude OS&G
|
| | |
|
751
|
| | | | | 676 | | |
|
|
||||||||||||||
| |
Non-production costs(3)
|
| | |
|
(62)
|
| | | | | (92) | | |
| |
Syncrude cash operating costs(2)
|
| | |
|
689
|
| | | | | 584 | | |
|
|
||||||||||||||
| |
Syncrude production volumes (mbbls/d)
|
| | |
|
190.1
|
| | | | | 186.8 | | |
|
|
||||||||||||||
| |
Syncrude cash operating costs(2) ($/bbl)
|
| | |
|
40.25
|
| | | | | 34.70 | | |
| | | | |
Three months ended
March 31 |
| |||||||||
| |
($ millions)
|
| |
2023
|
| |
2022
|
| ||||||
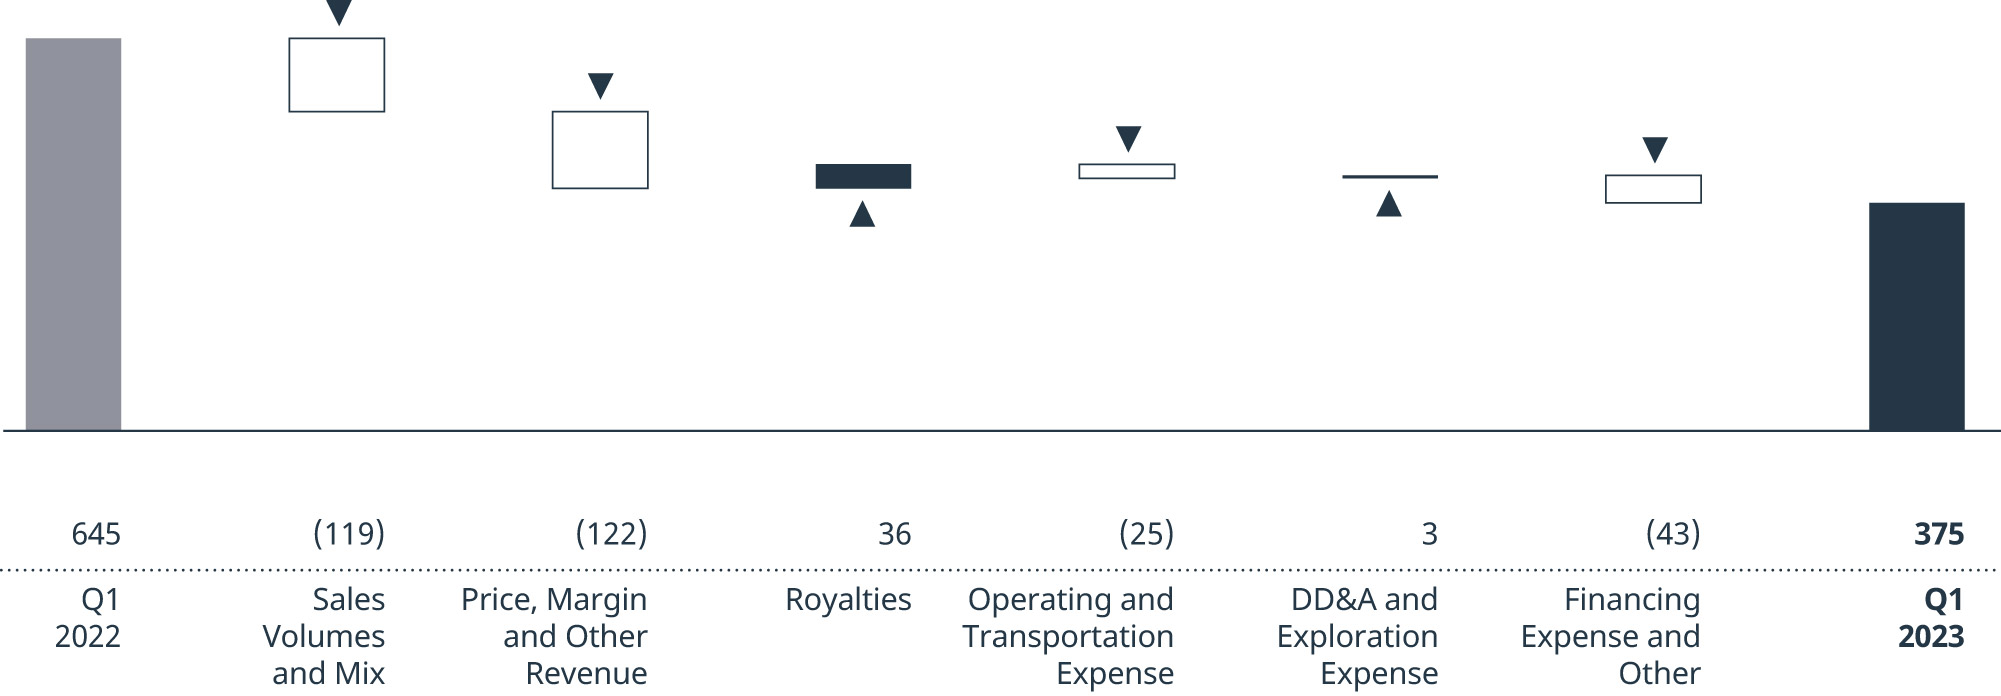
| | Operating revenues(1) | | | |
|
734
|
| | | | | 1 015 | | |
|
|
||||||||||||||
| | Less: Royalties(1) | | | |
|
(86)
|
| | | | | (147) | | |
| | Operating revenues, net of royalties | | | |
|
648
|
| | | | | 868 | | |
| | Earnings before income taxes | | | |
|
375
|
| | | | | 645 | | |
| | Adjusted operating earnings(2) | | | |
|
375
|
| | | | | 645 | | |
| | Adjusted funds from operations(2) | | | |
|
491
|
| | | | | 724 | | |
| | | | |
Three months ended
March 31 |
| |||||||||
| | | | |
2023
|
| |
2022
|
| ||||||
| | E&P Canada (mbbls/d) | | | |
|
46.7
|
| | | | | 51.2 | | |
|
|
||||||||||||||
| | E&P International (mboe/d) | | | |
|
20.3
|
| | | | | 29.2 | | |
| | Total production (mboe/d) | | | |
|
67.0
|
| | | | | 80.4 | | |
| | Total sales volumes (mboe/d) | | | |
|
68.7
|
| | | | | 79.5 | | |
| | | | |
Three months ended
March 31 |
| |||||||||
| |
Net of transportation costs, but before royalties
|
| |
2023
|
| |
2022
|
| ||||||
| | E&P Canada ($/bbl) | | | |
|
101.11
|
| | | | | 122.13 | | |
|
|
||||||||||||||
| | E&P International(2) ($/boe) | | | |
|
113.82
|
| | | | | 113.60 | | |
| | | | |
Three months ended
March 31 |
| |||||||||
| |
($ millions)
|
| |
2023
|
| |
2022
|
| ||||||
| | Operating revenues | | | |
|
7 173
|
| | | | | 7 855 | | |
| | Earnings before income taxes | | | |
|
993
|
| | | | | 1 417 | | |
| | Adjusted for: | | | | | | | | | | | | | |
|
|
||||||||||||||
| |
Unrealized loss (gain) on risk management activities
|
| | |
|
5
|
| | | | | (22) | | |
| | Adjusted operating earnings(1) | | | |
|
998
|
| | | | | 1 395 | | |
| | Adjusted funds from operations(1) | | | |
|
1 194
|
| | | | | 1 597 | | |

| | | | |
Three months ended
March 31 |
| |||||||||
| | | | |
2023
|
| |
2022
|
| ||||||
| | Crude oil processed (mbbls/d) | | | | | | | | | | | | | |
|
|
||||||||||||||
| |
Eastern North America
|
| | |
|
203.9
|
| | | | | 209.6 | | |
|
|
||||||||||||||
| |
Western North America
|
| | |
|
163.8
|
| | | | | 226.9 | | |
| | Total | | | |
|
367.7
|
| | | | | 436.5 | | |
| | Refinery utilization(1) (%) | | | | | | | | | | | | | |
|
|
||||||||||||||
| |
Eastern North America
|
| | |
|
92
|
| | | | | 94 | | |
|
|
||||||||||||||
| |
Western North America
|
| | |
|
67
|
| | | | | 93 | | |
| | Total | | | |
|
79
|
| | | | | 94 | | |
| | Refined product sales (mbbls/d) | | | | | | | | | | | | | |
|
|
||||||||||||||
| |
Gasoline
|
| | |
|
208.3
|
| | | | | 226.2 | | |
|
|
||||||||||||||
| |
Distillate
|
| | |
|
232.7
|
| | | | | 254.3 | | |
|
|
||||||||||||||
| |
Other
|
| | |
|
73.8
|
| | | | | 71.4 | | |
| | Total | | | |
|
514.8
|
| | | | | 551.9 | | |
| |
Refining and marketing gross margin – FIFO(2) ($/bbl)
|
| | |
|
55.45
|
| | | | | 53.20 | | |
|
|
||||||||||||||
| |
Refining and marketing gross margin – LIFO(2) ($/bbl)
|
| | |
|
59.15
|
| | | | | 35.95 | | |
|
|
||||||||||||||
| |
Refining operating expense(2) ($/bbl)
|
| | |
|
8.15
|
| | | | | 6.25 | | |
| | | | |
Three months ended
March 31 |
| |||||||||
| |
($ millions)
|
| |
2023
|
| |
2022
|
| ||||||
| | Loss before income taxes | | | |
|
(131)
|
| | | | | (523) | | |
| | Adjusted for: | | | | | | | | | | | | | |
|
|
||||||||||||||
| |
Unrealized foreign exchange loss (gain) on U.S. dollar denominated debt
|
| | |
|
3
|
| | | | | (146) | | |
|
|
||||||||||||||
| |
Gain on significant disposal
|
| | |
|
(302)
|
| | | | | — | | |
| | Adjusted operating loss(1) | | | |
|
(430)
|
| | | | | (669) | | |
|
|
||||||||||||||
| |
Corporate and Renewables
|
| | |
|
(437)
|
| | | | | (388) | | |
|
|
||||||||||||||
| |
Eliminations – Intersegment profit eliminated
|
| | |
|
7
|
| | | | | (281) | | |
| | Adjusted funds used in operations(1) | | | |
|
(533)
|
| | | | | (665) | | |
| | | | |
Three months ended
March 31 |
| |||||||||
| |
($ millions)
|
| |
2023
|
| |
2022
|
| ||||||
| | Current income tax expense | | | |
|
738
|
| | | | | 976 | | |
|
|
||||||||||||||
| | Deferred income tax recovery | | | |
|
(76)
|
| | | | | (77) | | |
| | Income tax expense included in net earnings | | | |
|
662
|
| | | | | 899 | | |
|
|
||||||||||||||
| | Less: Income tax expense on adjusted operating earnings adjustments | | | |
|
38
|
| | | | | 27 | | |
| | Income tax expense included in adjusted operating earnings | | | |
|
624
|
| | | | | 872 | | |
| | Effective tax rate | | | |
|
24.4%
|
| | | | | 23.4% | | |
| | | | |
Three months ended
March 31 |
| |||||||||
| |
($ millions)
|
| |
2023
|
| |
2022
|
| ||||||
| | Oil Sands | | | |
|
810
|
| | | | | 668 | | |
|
|
||||||||||||||
| | Exploration and Production(1) | | | |
|
138
|
| | | | | 83 | | |
|
|
||||||||||||||
| | Refining and Marketing | | | |
|
125
|
| | | | | 132 | | |
|
|
||||||||||||||
| | Corporate and Eliminations | | | |
|
13
|
| | | | | 128 | | |
| | Total capital and exploration expenditures | | | |
|
1 086
|
| | | | | 1 011 | | |
|
|
||||||||||||||
| | Less: Capitalized interest on debt | | | |
|
(58)
|
| | | | | (37) | | |
| | | | | | | 1 028 | | | | |
|
974
|
| |
| | | | | | | | | | |
Three months ended
March 31, 2023 |
| |||||||||
| |
($ millions)
|
| |
Asset Sustainment and
Maintenance(1) |
| |
Economic
Investment(2) |
| |
Total
|
| |||||||||
| | Oil Sands | | | | | | | | | | | | | | | | | | | |
|
|
||||||||||||||||||||
| |
Oil Sands Base
|
| | |
|
179
|
| | | |
|
123
|
| | | |
|
302
|
| |
|
|
||||||||||||||||||||
| |
In Situ
|
| | |
|
30
|
| | | |
|
96
|
| | | |
|
126
|
| |
|
|
||||||||||||||||||||
| |
Fort Hills
|
| | |
|
90
|
| | | |
|
—
|
| | | |
|
90
|
| |
|
|
||||||||||||||||||||
| |
Syncrude
|
| | |
|
171
|
| | | |
|
69
|
| | | |
|
240
|
| |
|
|
||||||||||||||||||||
| | Exploration and Production(3) | | | | | — | | | | | | 132 | | | | |
|
132
|
| |
|
|
||||||||||||||||||||
| | Refining and Marketing | | | | | 114 | | | | | | 11 | | | | |
|
125
|
| |
|
|
||||||||||||||||||||
| | Corporate and Eliminations | | | | | 6 | | | | | | 7 | | | | |
|
13
|
| |
| | | | | | | 590 | | | | | | 438 | | | | | | 1 028 | | |
| | | | |
Twelve months ended
March 31 |
| |||||||||
| | | | |
2023
|
| |
2022
|
| ||||||
| | Return on capital employed (ROCE)(1)(2) (%) | | | |
|
17.8
|
| | | | | 12.7 | | |
| | Net debt to adjusted funds from operations(1) (times) | | | |
|
0.9
|
| | | | | 1.3 | | |
| | Total debt to total debt plus shareholders’ equity(1) (%) | | | |
|
29.7
|
| | | | | 32.0 | | |
| | Net debt to net debt plus shareholders’ equity(1) (%) | | | |
|
28.2
|
| | | | | 28.7 | | |
| | Net debt to net debt plus shareholders’ equity – excluding leases(1) (%) | | | |
|
23.7
|
| | | | | 24.8 | | |
| | | | |
Three months ended
|
| |||
| |
($ millions)
|
| |
March 31, 2023
|
| |||
| | Total debt(1) – beginning of period | | | |
|
15 619
|
| |
|
|
||||||||
| | Decrease in long-term debt | | | |
|
(5)
|
| |
|
|
||||||||
| | Increase in short-term debt | | | |
|
962
|
| |
|
|
||||||||
| | Increase in lease liability | | | |
|
346
|
| |
|
|
||||||||
| | Lease payments | | | |
|
(82)
|
| |
|
|
||||||||
| | Foreign exchange on debt, and other | | | |
|
2
|
| |
| | Total debt(1) – March 31, 2023 | | | |
|
16 842
|
| |
|
|
||||||||
| | Less: Cash and cash equivalents – March 31, 2023 | | | |
|
1 128
|
| |
| | Net debt(1) – March 31, 2023 | | | |
|
15 714
|
| |
| | | | |
March 31,
|
| |||
| |
(thousands)
|
| |
2023
|
| |||
| |
Common shares
|
| | | | 1 318 367 | | |
|
|
||||||||
| | Common share options – exercisable | | | |
|
18 236
|
| |
|
|
||||||||
| | Common share options – non-exercisable | | | |
|
3 238
|
| |
| | | | |
Three months ended
March 31 |
| |||||||||
| |
($ millions, except as noted)
|
| |
2023
|
| |
2022
|
| ||||||
| | Share repurchase activities (thousands of common shares) | | | |
|
19 936
|
| | | | | 21 698 | | |
|
|
||||||||||||||
| | Weighted average repurchase price per share (dollars per share) | | | |
|
43.85
|
| | | | | 38.12 | | |
|
|
||||||||||||||
| | Share repurchase cost | | | |
|
874
|
| | | | | 827 | | |
| |
Three months ended
($ millions, unless otherwise noted) |
| |
Mar 31
2023 |
| |
Dec 31
2022 |
| |
Sep 30
2022 |
| |
Jun 30
2022 |
| |
Mar 31
2022 |
| |
Dec 31
2021 |
| |
Sep 30
2021 |
| |
Jun 30
2021 |
| ||||||||||||||||||||||||
| | Total production (mboe/d) | | | | | | | | | | | | | | | | | | | | | | | | | | | | | | | | | | | | | | | | | | | | | | | | | |
|
|
||||||||||||||||||||||||||||||||||||||||||||||||||
| |
Oil Sands
|
| | |
|
675.1
|
| | | | | 688.1 | | | | | | 646.0 | | | | | | 641.5 | | | | | | 685.7 | | | | | | 665.9 | | | | | | 605.1 | | | | | | 615.7 | | |
|
|
||||||||||||||||||||||||||||||||||||||||||||||||||
| |
Exploration and Production
|
| | |
|
67.0
|
| | | | | 75.0 | | | | | | 78.1 | | | | | | 78.7 | | | | | | 80.4 | | | | | | 77.4 | | | | | | 93.5 | | | | | | 84.0 | | |
| | | | | |
|
742.1
|
| | | | | 763.1 | | | | | | 724.1 | | | | | | 720.2 | | | | | | 766.1 | | | | | | 743.3 | | | | | | 698.6 | | | | | | 699.7 | | |
| | Revenues and other income | | | | | | | | | | | | | | | | | | | | | | | | | | | | | | | | | | | | | | | | | | | | | | | | | |
|
|
||||||||||||||||||||||||||||||||||||||||||||||||||
| |
Gross revenues(1)
|
| | |
|
12 272
|
| | | | | 14 754 | | | | | | 15 869 | | | | | | 17 815 | | | | | | 14 469 | | | | | | 11 897 | | | | | | 10 758 | | | | | | 9 597 | | |
|
|
||||||||||||||||||||||||||||||||||||||||||||||||||
| |
Royalties
|
| | |
|
(358)
|
| | | | | (834) | | | | | | (925) | | | | | | (1 680) | | | | | | (1 132) | | | | | | (748) | | | | | | (613) | | | | | | (438) | | |
| |
Operating revenues, net of royalties(1)
|
| | |
|
11 914
|
| | | | | 13 920 | | | | | | 14 944 | | | | | | 16 135 | | | | | | 13 337 | | | | | | 11 149 | | | | | | 10 145 | | | | | | 9 159 | | |
|
|
||||||||||||||||||||||||||||||||||||||||||||||||||
| |
Other income (loss)
|
| | |
|
342
|
| | | | | (65) | | | | | | 113 | | | | | | 69 | | | | | | 14 | | | | | | 10 | | | | | | 68 | | | | | | (66) | | |
| | | | | |
|
12 256
|
| | | | | 13 855 | | | | | | 15 057 | | | | | | 16 204 | | | | | | 13 351 | | | | | | 11 159 | | | | | | 10 213 | | | | | | 9 093 | | |
| | Net earnings (loss) | | | |
|
2 052
|
| | | | | 2 741 | | | | | | (609) | | | | | | 3 996 | | | | | | 2 949 | | | | | | 1 553 | | | | | | 877 | | | | | | 868 | | |
|
|
||||||||||||||||||||||||||||||||||||||||||||||||||
| |
Per common share – basic (dollars)
|
| | |
|
1.54
|
| | | | | 2.03 | | | | | | (0.45) | | | | | | 2.84 | | | | | | 2.06 | | | | | | 1.07 | | | | | | 0.59 | | | | | | 0.58 | | |
|
|
||||||||||||||||||||||||||||||||||||||||||||||||||
| |
Per common share – diluted (dollars)
|
| | |
|
1.54
|
| | | | | 2.03 | | | | | | (0.45) | | | | | | 2.83 | | | | | | 2.06 | | | | | | 1.07 | | | | | | 0.59 | | | | | | 0.58 | | |
| | Adjusted operating earnings(2) | | | |
|
1 809
|
| | | | | 2 432 | | | | | | 2 565 | | | | | | 3 814 | | | | | | 2 755 | | | | | | 1 294 | | | | | | 1 043 | | | | | | 722 | | |
|
|
||||||||||||||||||||||||||||||||||||||||||||||||||
| |
Per common share(3)(4) (dollars)
|
| | |
|
1.36
|
| | | | | 1.81 | | | | | | 1.88 | | | | | | 2.71 | | | | | | 1.92 | | | | | | 0.89 | | | | | | 0.71 | | | | | | 0.48 | | |
| | Adjusted funds from operations(2) | | | |
|
3 002
|
| | | | | 4 189 | | | | | | 4 473 | | | | | | 5 345 | | | | | | 4 094 | | | | | | 3 144 | | | | | | 2 641 | | | | | | 2 362 | | |
|
|
||||||||||||||||||||||||||||||||||||||||||||||||||
| |
Per common share(3)(4) (dollars)
|
| | |
|
2.26
|
| | | | | 3.11 | | | | | | 3.28 | | | | | | 3.80 | | | | | | 2.86 | | | | | | 2.17 | | | | | | 1.79 | | | | | | 1.57 | | |
| | Cash flow provided by operating activities | | | |
|
1 039
|
| | | | | 3 924 | | | | | | 4 449 | | | | | | 4 235 | | | | | | 3 072 | | | | | | 2 615 | | | | | | 4 718 | | | | | | 2 086 | | |
|
|
||||||||||||||||||||||||||||||||||||||||||||||||||
| |
Per common share – basic (dollars)
|
| | |
|
0.78
|
| | | | | 2.91 | | | | | | 3.26 | | | | | | 3.01 | | | | | | 2.14 | | | | | | 1.80 | | | | | | 3.19 | | | | | | 1.39 | | |
| | ROCE(3) (%) for the twelve months ended | | | |
|
17.8
|
| | | | | 19.4 | | | | | | 17.5 | | | | | | 19.4 | | | | | | 12.7 | | | | | | 8.6 | | | | | | 4.5 | | | | | | 1.9 | | |
| |
ROCE excluding impairments and impairment reversals(3) (%) for the twelve months ended
|
| | |
|
21.6
|
| | | | | 22.9 | | | | | | 21.0 | | | | | | 18.2 | | | | | | 12.4 | | | | | | 8.2 | | | | | | 4.9 | | | | | | 2.6 | | |
| | Common share information (dollars) | | | | | | | | | | | | | | | | | | | | | | | | | | | | | | | | | | | | | | | | | | | | | | | | | |
|
|
||||||||||||||||||||||||||||||||||||||||||||||||||
| |
Dividend per common share
|
| | |
|
0.52
|
| | | | | 0.52 | | | | | | 0.47 | | | | | | 0.47 | | | | | | 0.42 | | | | | | 0.42 | | | | | | 0.21 | | | | | | 0.21 | | |
|
|
||||||||||||||||||||||||||||||||||||||||||||||||||
| |
Share price at the end of trading
|
| | | | | | | | | | | | | | | | | | | | | | | | | | | | | | | | | | | | | | | | | | | | | | | | |
|
|
||||||||||||||||||||||||||||||||||||||||||||||||||
| |
Toronto Stock Exchange (Cdn$)
|
| | |
|
41.96
|
| | | | | 42.95 | | | | | | 38.90 | | | | | | 45.16 | | | | | | 40.70 | | | | | | 31.65 | | | | | | 26.26 | | | | | | 29.69 | | |
|
|
||||||||||||||||||||||||||||||||||||||||||||||||||
| |
New York Stock Exchange (US$)
|
| | |
|
31.05
|
| | | | | 31.73 | | | | | | 28.15 | | | | | | 35.07 | | | | | | 32.59 | | | | | | 25.03 | | | | | | 20.74 | | | | | | 23.97 | | |
| |
(average for the three months ended)
|
| | | | |
Mar 31
2023 |
| |
Dec 31
2022 |
| |
Sep 30
2022 |
| |
Jun 30
2022 |
| |
Mar 31
2022 |
| |
Dec 31
2021 |
| |
Sep 30
2021 |
| |
Jun 30
2021 |
| ||||||||||||||||||||||||
| | WTI crude oil at Cushing | | | US$/bbl | | | |
|
76.10
|
| | | | | 82.65 | | | | | | 91.65 | | | | | | 108.40 | | | | | | 94.40 | | | | | | 77.15 | | | | | | 70.55 | | | | | | 66.05 | | |
|
|
|||||||||||||||||||||||||||||||||||||||||||||||||||||
| | Dated Brent crude | | | US$/bbl | | | |
|
81.25
|
| | | | | 88.65 | | | | | | 100.95 | | | | | | 113.75 | | | | | | 101.50 | | | | | | 79.70 | | | | | | 73.45 | | | | | | 68.85 | | |
|
|
|||||||||||||||||||||||||||||||||||||||||||||||||||||
| |
Dated Brent/Maya FOB
price differential |
| | US$/bbl | | | |
|
18.40
|
| | | | | 17.70 | | | | | | 17.95 | | | | | | 11.65 | | | | | | 14.30 | | | | | | 8.60 | | | | | | 7.80 | | | | | | 6.20 | | |
|
|
|||||||||||||||||||||||||||||||||||||||||||||||||||||
| | MSW at Edmonton | | | Cdn$/bbl | | | |
|
99.05
|
| | | | | 110.05 | | | | | | 116.85 | | | | | | 137.80 | | | | | | 115.75 | | | | | | 93.25 | | | | | | 83.75 | | | | | | 77.25 | | |
|
|
|||||||||||||||||||||||||||||||||||||||||||||||||||||
| | WCS at Hardisty | | | US$/bbl | | | |
|
51.35
|
| | | | | 57.00 | | | | | | 71.75 | | | | | | 95.60 | | | | | | 79.80 | | | | | | 62.50 | | | | | | 56.95 | | | | | | 54.60 | | |
|
|
|||||||||||||||||||||||||||||||||||||||||||||||||||||
| | WTI-WCS light/heavy differential | | | US$/bbl | | | |
|
(24.75)
|
| | | | | (25.65) | | | | | | (19.90) | | | | | | (12.80) | | | | | | (14.60) | | | | | | (14.65) | | | | | | (13.60) | | | | | | (11.45) | | |
|
|
|||||||||||||||||||||||||||||||||||||||||||||||||||||
| | SYN-WTI (differential) premium | | | US$/bbl | | | |
|
2.10
|
| | | | | 4.15 | | | | | | 8.80 | | | | | | 6.05 | | | | | | (1.30) | | | | | | (1.80) | | | | | | (1.60) | | | | | | 0.35 | | |
|
|
|||||||||||||||||||||||||||||||||||||||||||||||||||||
| | Condensate at Edmonton | | | US$/bbl | | | |
|
79.85
|
| | | | | 83.40 | | | | | | 87.35 | | | | | | 108.35 | | | | | | 96.15 | | | | | | 79.10 | | | | | | 69.20 | | | | | | 66.40 | | |
|
|
|||||||||||||||||||||||||||||||||||||||||||||||||||||
| | Natural gas (Alberta spot) at AECO | | | Cdn$/GJ | | | |
|
3.05
|
| | | | | 4.90 | | | | | | 4.15 | | | | | | 6.90 | | | | | | 4.50 | | | | | | 4.45 | | | | | | 3.40 | | | | | | 2.95 | | |
|
|
|||||||||||||||||||||||||||||||||||||||||||||||||||||
| | Alberta Power Pool Price | | | Cdn$/MWh | | | |
|
142.00
|
| | | | | 213.95 | | | | | | 221.40 | | | | | | 122.45 | | | | | | 90.00 | | | | | | 107.30 | | | | | | 100.35 | | | | | | 104.50 | | |
|
|
|||||||||||||||||||||||||||||||||||||||||||||||||||||
| | New York Harbor 2-1-1 crack(1) | | | US$/bbl | | | |
|
36.70
|
| | | | | 52.75 | | | | | | 46.70 | | | | | | 60.05 | | | | | | 28.25 | | | | | | 20.65 | | | | | | 20.90 | | | | | | 20.35 | | |
|
|
|||||||||||||||||||||||||||||||||||||||||||||||||||||
| | Chicago 2-1-1 crack(1) | | | US$/bbl | | | |
|
31.55
|
| | | | | 39.20 | | | | | | 43.30 | | | | | | 49.40 | | | | | | 20.20 | | | | | | 16.90 | | | | | | 20.45 | | | | | | 20.25 | | |
|
|
|||||||||||||||||||||||||||||||||||||||||||||||||||||
| | Portland 2-1-1 crack(1) | | | US$/bbl | | | |
|
37.40
|
| | | | | 50.70 | | | | | | 57.30 | | | | | | 63.45 | | | | | | 33.80 | | | | | | 25.35 | | | | | | 26.70 | | | | | | 24.55 | | |
|
|
|||||||||||||||||||||||||||||||||||||||||||||||||||||
| | Gulf Coast 2-1-1 crack(1) | | | US$/bbl | | | |
|
37.65
|
| | | | | 40.20 | | | | | | 41.85 | | | | | | 52.55 | | | | | | 26.80 | | | | | | 19.65 | | | | | | 19.55 | | | | | | 18.25 | | |
|
|
|||||||||||||||||||||||||||||||||||||||||||||||||||||
| | U.S. Renewable Volume Obligation | | | US$/bbl | | | |
|
8.20
|
| | | | | 8.55 | | | | | | 8.10 | | | | | | 7.80 | | | | | | 6.45 | | | | | | 6.10 | | | | | | 7.35 | | | | | | 8.15 | | |
|
|
|||||||||||||||||||||||||||||||||||||||||||||||||||||
| | Exchange rate | | | US$/Cdn$ | | | |
|
0.74
|
| | | | | 0.74 | | | | | | 0.77 | | | | | | 0.78 | | | | | | 0.79 | | | | | | 0.79 | | | | | | 0.79 | | | | | | 0.81 | | |
|
|
|||||||||||||||||||||||||||||||||||||||||||||||||||||
| | Exchange rate (end of period) | | | US$/Cdn$ | | | |
|
0.74
|
| | | | | 0.74 | | | | | | 0.73 | | | | | | 0.78 | | | | | | 0.80 | | | | | | 0.79 | | | | | | 0.78 | | | | | | 0.81 | | |
| |
For the twelve months ended March 31
|
| | | | | | | | | | | | | | | | | | |
| |
($ millions, except as noted)
|
| | | | | | | |
2023
|
| |
2022
|
| ||||||
| | Adjustments to net earnings | | | | | | | | | | | | | | | | | | | |
|
|
||||||||||||||||||||
| |
Net earnings
|
| | | | | | | | |
|
8 180
|
| | | | | 6 247 | | |
|
|
||||||||||||||||||||
| |
Add (deduct) after-tax amounts for:
|
| | | | | | | | | | | | | | | | | | |
|
|
||||||||||||||||||||
| |
Unrealized foreign exchange loss (gain) on U.S. dollar denominated debt
|
| | | | | | | | |
|
818
|
| | | | | (57) | | |
|
|
||||||||||||||||||||
| |
Net interest expense
|
| | | | | | | | |
|
633
|
| | | | | 628 | | |
| | Adjusted net earnings(1) | | | | | A | | | | |
|
9 631
|
| | | | | 6 818 | | |
| | Capital employed – beginning of twelve-month period | | | | | | | | | | | | | | | | | | | |
|
|
||||||||||||||||||||
| |
Net debt(2)
|
| | | | | | | | |
|
15 421
|
| | | | | 18 829 | | |
|
|
||||||||||||||||||||
| |
Shareholders’ equity
|
| | | | | | | | |
|
38 274
|
| | | | | 36 325 | | |
| | | | | | | | | | | | | 53 695 | | | | |
|
55 154
|
| |
| | Capital employed – end of twelve-month period | | | | | | | | | | | | | | | | | | | |
|
|
||||||||||||||||||||
| |
Net debt(2)
|
| | | | | | | | |
|
15 714
|
| | | | | 15 421 | | |
|
|
||||||||||||||||||||
| |
Shareholders’ equity
|
| | | | | | | | |
|
39 949
|
| | | | | 38 274 | | |
| | | | | | | | | | | | | 55 663 | | | | |
|
53 695
|
| |
| | Average capital employed | | | | | B | | | | |
|
54 171
|
| | | | | 53 700 | | |
| | ROCE (%)(3) | | | | | A/B | | | | |
|
17.8
|
| | | | | 12.7 | | |
| |
Three months ended March 31
|
| |
Oil Sands
|
| |
Exploration and
Production |
| |
Refining and
Marketing |
| |
Corporate and
Eliminations |
| |
Income
Taxes |
| |
Total
|
| ||||||||||||||||||||||||||||||||||||||||||||||||||||||
| |
($ millions)
|
| |
2023
|
| |
2022
|
| |
2023
|
| |
2022
|
| |
2023
|
| |
2022
|
| |
2023
|
| |
2022
|
| |
2023
|
| |
2022
|
| |
2023
|
| |
2022
|
| ||||||||||||||||||||||||||||||||||||
| |
Earnings (loss) before income taxes
|
| | |
|
1 477
|
| | | | | 2 309 | | | | |
|
375
|
| | | | | 645 | | | | |
|
993
|
| | | | | 1 417 | | | | |
|
(131)
|
| | | | | (523) | | | | |
|
—
|
| | | | | — | | | | |
|
2 714
|
| | | | | 3 848 | | |
|
|
||||||||||||||||||||||||||||||||||||||||||||||||||||||||||||||||||||||||||
| | Adjustments for: | | | | | | | | | | | | | | | | | | | | | | | | | | | | | | | | | | | | | | | | | | | | | | | | | | | | | | | | | | | | | | | | | | | | | | | — | | |
|
|
||||||||||||||||||||||||||||||||||||||||||||||||||||||||||||||||||||||||||
| |
Depreciation, depletion, amortization and impairment
|
| | |
|
1 138
|
| | | | | 1 105 | | | | |
|
127
|
| | | | | 129 | | | | |
|
220
|
| | | | | 212 | | | | |
|
31
|
| | | | | 25 | | | | |
|
—
|
| | | | | — | | | | |
|
1 516
|
| | | | | 1 471 | | |
|
|
||||||||||||||||||||||||||||||||||||||||||||||||||||||||||||||||||||||||||
| |
Accretion
|
| | |
|
114
|
| | | | | 63 | | | | |
|
17
|
| | | | | 14 | | | | |
|
2
|
| | | | | 1 | | | | |
|
—
|
| | | | | — | | | | |
|
—
|
| | | | | — | | | | |
|
133
|
| | | | | 78 | | |
|
|
||||||||||||||||||||||||||||||||||||||||||||||||||||||||||||||||||||||||||
| |
Unrealized foreign exchange loss
(gain) on U.S. dollar denominated debt |
| | |
|
—
|
| | | | | — | | | | |
|
—
|
| | | | | — | | | | |
|
—
|
| | | | | — | | | | |
|
3
|
| | | | | (146) | | | | |
|
—
|
| | | | | — | | | | |
|
3
|
| | | | | (146) | | |
|
|
||||||||||||||||||||||||||||||||||||||||||||||||||||||||||||||||||||||||||
| |
Change in fair value of financial instruments and trading inventory
|
| | |
|
27
|
| | | | | (21) | | | | |
|
(25)
|
| | | | | (17) | | | | |
|
28
|
| | | | | (36) | | | | |
|
—
|
| | | | | — | | | | |
|
—
|
| | | | | — | | | | |
|
30
|
| | | | | (74) | | |
|
|
||||||||||||||||||||||||||||||||||||||||||||||||||||||||||||||||||||||||||
| |
(Gain) loss on disposal of assets
|
| | |
|
—
|
| | | | | (2) | | | | |
|
(1)
|
| | | | | — | | | | |
|
(11)
|
| | | | | — | | | | |
|
(302)
|
| | | | | — | | | | |
|
—
|
| | | | | — | | | | |
|
(314)
|
| | | | | (2) | | |
|
|
||||||||||||||||||||||||||||||||||||||||||||||||||||||||||||||||||||||||||
| |
Share-based compensation
|
| | |
|
(60)
|
| | | | | 28 | | | | |
|
1
|
| | | | | (1) | | | | |
|
(27)
|
| | | | | 5 | | | | |
|
(117)
|
| | | | | 24 | | | | |
|
—
|
| | | | | — | | | | |
|
(203)
|
| | | | | 56 | | |
|
|
||||||||||||||||||||||||||||||||||||||||||||||||||||||||||||||||||||||||||
| |
Settlement of decommissioning and restoration liabilities
|
| | |
|
(124)
|
| | | | | (88) | | | | |
|
(2)
|
| | | | | — | | | | |
|
(7)
|
| | | | | (2) | | | | |
|
—
|
| | | | | (1) | | | | |
|
—
|
| | | | | — | | | | |
|
(133)
|
| | | | | (91) | | |
|
|
||||||||||||||||||||||||||||||||||||||||||||||||||||||||||||||||||||||||||
| |
Other
|
| | |
|
16
|
| | | | | 20 | | | | |
|
(1)
|
| | | | | (46) | | | | |
|
(4)
|
| | | | | — | | | | |
|
(17)
|
| | | | | (44) | | | | |
|
—
|
| | | | | — | | | | |
|
(6)
|
| | | | | (70) | | |
|
|
||||||||||||||||||||||||||||||||||||||||||||||||||||||||||||||||||||||||||
| |
Current income tax expense
|
| | |
|
—
|
| | | | | — | | | | |
|
—
|
| | | | | — | | | | |
|
—
|
| | | | | — | | | | |
|
—
|
| | | | | — | | | | |
|
(738)
|
| | | | | (976) | | | | |
|
(738)
|
| | | | | (976) | | |
| |
Adjusted funds from (used in) operations
|
| | |
|
2 588
|
| | | | | 3 414 | | | | |
|
491
|
| | | | | 724 | | | | |
|
1 194
|
| | | | | 1 597 | | | | |
|
(533)
|
| | | | | (665) | | | | |
|
(738)
|
| | | | | (976) | | | | |
|
3 002
|
| | | | | 4 094 | | |
|
|
||||||||||||||||||||||||||||||||||||||||||||||||||||||||||||||||||||||||||
| |
Change in non-cash working capital
|
| | | | | | | | | | | | | | | | | | | | | | | | | | | | | | | | | | | | | | | | | | | | | | | | | | | | | | | | | | | | | | |
|
(1 963)
|
| | | | | (1 022) | | |
| |
Cash flow provided by operating activities
|
| | | | | | | | | | | | | | | | | | | | | | | | | | | | | | | | | | | | | | | | | | | | | | | | | | | | | | | | | | | | | | |
|
1 039
|
| | | | | 3 072 | | |
| | | | |
Three months ended
March 31 |
| |||||||||
| |
($ millions)
|
| |
2023
|
| |
2022
|
| ||||||
| | Cash flow provided by operating activities | | | |
|
1 039
|
| | | | | 3 072 | | |
|
|
||||||||||||||
| | (Add) deduct change in non-cash working capital | | | |
|
(1 963)
|
| | | | | (1 022) | | |
| | Adjusted funds from operations | | | |
|
3 002
|
| | | | | 4 094 | | |
|
|
||||||||||||||
| | Less capital expenditures including capitalized interest(1) | | | |
|
(1 086)
|
| | | | | (1 011) | | |
| | Free funds flow | | | |
|
1 916
|
| | | | | 3 083 | | |
| | | | |
Three months ended
March 31 |
| |||||||||
| |
($ millions, except as noted)
|
| |
2023
|
| |
2022
|
| ||||||
| | Refining and marketing gross margin reconciliation | | | | | | | | | | | | | |
|
|
||||||||||||||
| |
Operating revenues
|
| | |
|
7 173
|
| | | | | 7 855 | | |
|
|
||||||||||||||
| |
Purchases of crude oil and products
|
| | |
|
(5 354)
|
| | | | | (5 482) | | |
| | | | | | | 1 819 | | | | |
|
2 373
|
| |
|
|
||||||||||||||
| |
Other (loss) income
|
| | |
|
156
|
| | | | | (110) | | |
|
|
||||||||||||||
| |
Non-refining and marketing margin
|
| | |
|
(2)
|
| | | | | (13) | | |
| |
Refining and marketing gross margin – FIFO
|
| | |
|
1 973
|
| | | | | 2 250 | | |
|
|
||||||||||||||
| |
Refinery production(1) (mbbls)
|
| | |
|
35 583
|
| | | | | 42 311 | | |
| |
Refining and marketing gross margin – FIFO ($/bbl)
|
| | |
|
55.45
|
| | | | | 53.20 | | |
| |
FIFO and risk management activities adjustment
|
| | |
|
131
|
| | | | | (729) | | |
| |
Refining and marketing gross margin – LIFO
|
| | |
|
2 104
|
| | | | | 1 521 | | |
| |
Refining and marketing gross margin – LIFO ($/bbl)
|
| | |
|
59.15
|
| | | | | 35.95 | | |
| | Refining operating expense reconciliation | | | | | | | | | | | | | |
|
|
||||||||||||||
| |
Operating, selling and general expense
|
| | |
|
650
|
| | | | | 559 | | |
|
|
||||||||||||||
| |
Non-refining costs
|
| | |
|
(360)
|
| | | | | (294) | | |
| |
Refining operating expense
|
| | |
|
290
|
| | | | | 265 | | |
|
|
||||||||||||||
| |
Refinery production(1) (mbbls)
|
| | |
|
35 583
|
| | | | | 42 311 | | |
| |
Refining operating expense ($/bbl)
|
| | |
|
8.15
|
| | | | | 6.25 | | |
| | | | |
March 31
|
| |
December 31
|
| ||||||
| |
($ millions, except as noted)
|
| |
2023
|
| |
2022
|
| ||||||
| |
Short-term debt
|
| | |
|
3 776
|
| | | | | 2 807 | | |
|
|
||||||||||||||
| |
Current portion of long-term debt
|
| | |
|
—
|
| | | | | — | | |
|
|
||||||||||||||
| |
Current portion of long-term lease liabilities
|
| | |
|
357
|
| | | | | 317 | | |
|
|
||||||||||||||
| |
Long-term debt
|
| | |
|
9 791
|
| | | | | 9 800 | | |
|
|
||||||||||||||
| |
Long-term lease liabilities
|
| | |
|
2 918
|
| | | | | 2 695 | | |
| | Total debt | | | |
|
16 842
|
| | | | | 15 619 | | |
|
|
||||||||||||||
| |
Less: Cash and cash equivalents
|
| | |
|
1 128
|
| | | | | 1 980 | | |
| | Net debt | | | |
|
15 714
|
| | | | | 13 639 | | |
|
|
||||||||||||||
| | Shareholders’ equity | | | |
|
39 949
|
| | | | | 39 367 | | |
| | Total debt plus shareholders’ equity | | | |
|
56 791
|
| | | | | 54 986 | | |
| | Total debt to total debt plus shareholders’ equity (%) | | | |
|
29.7
|
| | | | | 28.4 | | |
| | Net debt to net debt plus shareholders’ equity (%) | | | |
|
28.2
|
| | | | | 25.7 | | |
| | Net debt to net debt plus shareholders’ equity – excluding leases (%) | | | |
|
23.7
|
| | | | | 21.3 | | |
| |
For the quarter ended
|
| |
March 31, 2023
|
| |
March 31, 2022
|
| ||||||||||||||||||||||||||||||||||||||||||
| |
($ millions, except as noted)
|
| |
Non-
Upgraded Bitumen |
| |
Upgraded –
Net SCO and Diesel |
| |
Average
Crude |
| |
Oil
Sands Segment |
| |
Non-
Upgraded Bitumen |
| |
Upgraded –
Net SCO and Diesel |
| |
Average
Crude |
| |
Oil
Sands Segment |
| ||||||||||||||||||||||||
| |
Operating revenues, net of royalties
|
| | |
|
1 174
|
| | | |
|
4 621
|
| | | |
|
5 795
|
| | | |
|
5 795
|
| | | | | 1 571 | | | | | | 4 914 | | | | | | 6 485 | | | | | | 6 485 | | |
|
|
||||||||||||||||||||||||||||||||||||||||||||||||||
| | Add: Royalties | | | |
|
61
|
| | | |
|
211
|
| | | |
|
272
|
| | | |
|
272
|
| | | | | 211 | | | | | | 774 | | | | | | 985 | | | | | | 985 | | |
| | Operating revenues | | | |
|
1 235
|
| | | |
|
4 832
|
| | | |
|
6 067
|
| | | |
|
6 067
|
| | | | | 1 782 | | | | | | 5 688 | | | | | | 7 470 | | | | | | 7 470 | | |
|
|
||||||||||||||||||||||||||||||||||||||||||||||||||
| |
Other (loss) income
|
| | |
|
124
|
| | | |
|
(9)
|
| | | |
|
115
|
| | | |
|
115
|
| | | | | (37) | | | | | | 44 | | | | | | 7 | | | | | | 7 | | |
|
|
||||||||||||||||||||||||||||||||||||||||||||||||||
| |
Purchases of crude oil and products
|
| | |
|
(337)
|
| | | |
|
(71)
|
| | | |
|
(408)
|
| | | |
|
(408)
|
| | | | | (390) | | | | | | (63) | | | | | | (453) | | | | | | (453) | | |
|
|
||||||||||||||||||||||||||||||||||||||||||||||||||
| |
Gross realization adjustment(1)
|
| | |
|
(105)
|
| | | |
|
(108)
|
| | | |
|
(213)
|
| | | | | | | | | | | 67 | | | | | | (136) | | | | | | (69) | | | | | | | | |
| | Gross realization | | | |
|
917
|
| | | |
|
4 644
|
| | | |
|
5 561
|
| | | | | | | | | | | 1 422 | | | | | | 5 533 | | | | | | 6 955 | | | | | | | | |
| | Transportation and distribution | | | |
|
(109)
|
| | | |
|
(161)
|
| | | |
|
(270)
|
| | | |
|
(270)
|
| | | | | (87) | | | | | | (206) | | | | | | (293) | | | | | | (293) | | |
| | Price realization | | | |
|
808
|
| | | |
|
4 483
|
| | | |
|
5 291
|
| | | | | | | | | | | 1 335 | | | | | | 5 327 | | | | | | 6 662 | | | | | | | | |
| | Sales volumes (mbbls) | | | |
|
15 668
|
| | | |
|
45 361
|
| | | |
|
61 029
|
| | | | | | | | | | | 13 830 | | | | | | 46 592 | | | | | | 60 422 | | | | | | | | |
| | Price realization per barrel | | | |
|
51.50
|
| | | |
|
98.87
|
| | | |
|
86.71
|
| | | | | | | | | | | 96.49 | | | | | | 114.37 | | | | | | 110.27 | | | | | | | | |
| |
For the quarter ended
|
| |
March 31, 2023
|
| |
March 31, 2022
|
| ||||||||||||||||||||||||||||||||||||||||||
| |
($ millions, except as noted)
|
| |
E&P
International |
| |
E&P
Canada |
| |
Other(1)(2)
|
| |
E&P
Segment |
| |
E&P
International |
| |
E&P
Canada |
| |
Other(1)(2)
|
| |
E&P
Segment |
| ||||||||||||||||||||||||
| | Operating revenues, net of royalties | | | |
|
184
|
| | | |
|
407
|
| | | |
|
57
|
| | | |
|
648
|
| | | | | 272 | | | | | | 476 | | | | | | 120 | | | | | | 868 | | |
|
|
||||||||||||||||||||||||||||||||||||||||||||||||||
| | Add: Royalties | | | |
|
—
|
| | | |
|
51
|
| | | |
|
35
|
| | | |
|
86
|
| | | | | — | | | | | | 87 | | | | | | 60 | | | | | | 147 | | |
| | Operating revenues | | | |
|
184
|
| | | |
|
458
|
| | | |
|
92
|
| | | |
|
734
|
| | | | | 272 | | | | | | 563 | | | | | | 180 | | | | | | 1 015 | | |
|
|
||||||||||||||||||||||||||||||||||||||||||||||||||
| | Transportation and distribution | | | |
|
(5)
|
| | | |
|
(14)
|
| | | |
|
(2)
|
| | | |
|
(21)
|
| | | | | (6) | | | | | | (17) | | | | | | — | | | | | | (23) | | |
| | Price realization | | | |
|
179
|
| | | |
|
444
|
| | | |
|
90
|
| | | | | | | | | | | 266 | | | | | | 546 | | | | | | 180 | | | | | | | | |
| | Sales volumes (mbbls) | | | |
|
1 574
|
| | | |
|
4 389
|
| | | | | | | | | | | | | | | | | 2 336 | | | | | | 4 460 | | | | | | | | | | | | | | |
| | Price realization per barrel | | | |
|
113.82
|
| | | |
|
101.11
|
| | | | | | | | | | | | | | | | | 113.60 | | | | | | 122.13 | | | | | | | | | | | | | | |
|
Measurement
|
| |
Places and Currencies
|
| ||||||
| bbl | | | barrel | | | U.S. | | | United States | |
| bbls/d | | | barrels per day | | | U.K. | | | United Kingdom | |
| mbbls/d | | | thousands of barrels per day | | | | | | | |
| | | | | | |
$ or Cdn$
|
| | Canadian dollars | |
| boe | | | barrels of oil equivalent | | | US$ | | | United States dollars | |
| boe/d | | | barrels of oil equivalent per day | | | | | | | |
| mboe | | | thousands of barrels of oil equivalent | | | | | | | |
| mboe/d | | | thousands of barrels of oil equivalent per day | | |
Financial and Business Environment
|
| |||
| | | | | | | Q1 | | | Three months ended March 31 | |
| GJ | | | Gigajoule | | | DD&A | | | Depreciation, depletion and amortization | |
| | | | | | | WTI | | | West Texas Intermediate | |
| mcf | | | thousands of cubic feet of natural gas | | | WCS | | | Western Canadian Select | |
| mcfe | | | thousands of cubic feet of natural gas equivalent | | | SCO | | | Synthetic crude oil | |
| | | | | | | SYN | | | Synthetic crude oil benchmark | |
| MW | | | megawatts | | | MSW | | | Mixed Sweet Blend | |
| MWh | | | megawatts per hour | | | NYMEX | | | New York Mercantile Exchange | |
| | | | | | | YTD | | | Year to date | |
| | | | |
Three months ended
March 31 |
| |||||||||
| |
($ millions)
|
| |
2023
|
| |
2022
|
| ||||||
| | Revenues and Other Income | | | | | | | | | | | | | |
|
|
||||||||||||||
| |
Gross revenues (note 3)
|
| | |
|
12 272
|
| | | | | 14 469 | | |
|
|
||||||||||||||
| |
Less: royalties (note 3)
|
| | |
|
(358)
|
| | | | | (1 132) | | |
|
|
||||||||||||||
| |
Other income (note 4)
|
| | |
|
342
|
| | | | | 14 | | |
| | | | | | | 12 256 | | | | |
|
13 351
|
| |
| | Expenses | | | | | | | | | | | | | |
|
|
||||||||||||||
| |
Purchases of crude oil and products
|
| | |
|
4 069
|
| | | | | 4 352 | | |
|
|
||||||||||||||
| |
Operating, selling and general
|
| | |
|
3 424
|
| | | | | 3 088 | | |
|
|
||||||||||||||
| |
Transportation and distribution
|
| | |
|
391
|
| | | | | 370 | | |
|
|
||||||||||||||
| |
Depreciation, depletion, amortization and impairment
|
| | |
|
1 516
|
| | | | | 1 471 | | |
|
|
||||||||||||||
| |
Exploration
|
| | |
|
42
|
| | | | | 39 | | |
|
|
||||||||||||||
| |
Gain on disposal of assets (note 10)
|
| | |
|
(314)
|
| | | | | (2) | | |
|
|
||||||||||||||
| |
Financing expenses (note 6)
|
| | |
|
414
|
| | | | | 185 | | |
| | | | | | | 9 542 | | | | |
|
9 503
|
| |
| | Earnings before Income Taxes | | | | | 2 714 | | | | |
|
3 848
|
| |
| | Income Tax Expense (Recovery) | | | | | | | | | | | | | |
|
|
||||||||||||||
| |
Current
|
| | |
|
738
|
| | | | | 976 | | |
|
|
||||||||||||||
| |
Deferred
|
| | |
|
(76)
|
| | | | | (77) | | |
| | | | | | | 662 | | | | |
|
899
|
| |
| | Net Earnings | | | | | 2 052 | | | | |
|
2 949
|
| |
| | Other Comprehensive Income | | | | | | | | | | | | | |
|
|
||||||||||||||
| |
Items That May be Subsequently Reclassified to Earnings:
|
| | | | | | | | | | | | |
|
|
||||||||||||||
| |
Foreign currency translation adjustment
|
| | |
|
52
|
| | | | | (56) | | |
|
|
||||||||||||||
| |
Items That Will Not be Reclassified to Earnings:
|
| | | | | | | | | | | | |
|
|
||||||||||||||
| |
Actuarial gain on employee retirement benefit plans, net of income taxes
|
| | |
|
42
|
| | | | | 392 | | |
| | Other Comprehensive Income | | | | | 94 | | | | |
|
336
|
| |
| | Total Comprehensive Income | | | | | 2 146 | | | | |
|
3 285
|
| |
| | Per Common Share (dollars) (note 7) | | | | | | | | | | | | | |
|
|
||||||||||||||
| |
Net earnings – basic and diluted
|
| | |
|
1.54
|
| | | | | 2.06 | | |
|
|
||||||||||||||
| | Cash dividends | | | |
|
0.52
|
| | | | | 0.42 | | |
| |
($ millions)
|
| |
March 31
2023 |
| |
December 31
2022 |
| ||||||
| | Assets | | | | | | | | | | | | | |
|
|
||||||||||||||
| |
Current assets
|
| | | | | | | | | | | | |
|
|
||||||||||||||
| |
Cash and cash equivalents
|
| | |
|
1 128
|
| | | | | 1 980 | | |
|
|
||||||||||||||
| |
Accounts receivable
|
| | | | 6 435 | | | | |
|
6 068
|
| |
|
|
||||||||||||||
| |
Inventories
|
| | |
|
5 230
|
| | | | | 5 058 | | |
|
|
||||||||||||||
| |
Income taxes receivable
|
| | |
|
293
|
| | | | | 244 | | |
|
|
||||||||||||||
| |
Assets held for sale (note 11)
|
| | |
|
799
|
| | | | | 1 186 | | |
| |
Total current assets
|
| | |
|
13 885
|
| | | | | 14 536 | | |
|
|
||||||||||||||
| |
Property, plant and equipment, net
|
| | |
|
63 448
|
| | | | | 62 654 | | |
|
|
||||||||||||||
| |
Exploration and evaluation
|
| | |
|
1 995
|
| | | | | 1 995 | | |
|
|
||||||||||||||
| |
Other assets
|
| | |
|
1 779
|
| | | | | 1 766 | | |
|
|
||||||||||||||
| |
Goodwill and other intangible assets
|
| | |
|
3 565
|
| | | | | 3 586 | | |
|
|
||||||||||||||
| |
Deferred income taxes
|
| | |
|
84
|
| | | | | 81 | | |
| |
Total assets
|
| | |
|
84 756
|
| | | | | 84 618 | | |
| | Liabilities and Shareholders’ Equity | | | | | | | | | | | | | |
|
|
||||||||||||||
| |
Current liabilities
|
| | | | | | | | | | | | |
|
|
||||||||||||||
| |
Short-term debt
|
| | |
|
3 776
|
| | | | | 2 807 | | |
|
|
||||||||||||||
| |
Current portion of long-term lease liabilities
|
| | |
|
357
|
| | | | | 317 | | |
|
|
||||||||||||||
| |
Accounts payable and accrued liabilities
|
| | | | 7 283 | | | | |
|
8 167
|
| |
|
|
||||||||||||||
| |
Current portion of provisions
|
| | |
|
588
|
| | | | | 564 | | |
|
|
||||||||||||||
| |
Income taxes payable
|
| | |
|
193
|
| | | | | 484 | | |
|
|
||||||||||||||
| |
Liabilities associated with assets held for sale (note 11)
|
| | |
|
340
|
| | | | | 530 | | |
| |
Total current liabilities
|
| | | | 12 537 | | | | |
|
12 869
|
| |
|
|
||||||||||||||
| |
Long-term debt (note 6)
|
| | |
|
9 791
|
| | | | | 9 800 | | |
|
|
||||||||||||||
| |
Long-term lease liabilities
|
| | |
|
2 918
|
| | | | | 2 695 | | |
|
|
||||||||||||||
| |
Other long-term liabilities
|
| | |
|
1 244
|
| | | | | 1 642 | | |
|
|
||||||||||||||
| |
Provisions
|
| | |
|
9 886
|
| | | | | 9 800 | | |
|
|
||||||||||||||
| |
Deferred income taxes
|
| | |
|
8 431
|
| | | | | 8 445 | | |
|
|
||||||||||||||
| |
Equity
|
| | |
|
39 949
|
| | | | | 39 367 | | |
| |
Total liabilities and shareholders’ equity
|
| | |
|
84 756
|
| | | | | 84 618 | | |
| |
($ millions)
|
| |
Share
Capital |
| |
Contributed
Surplus |
| |
Accumulated
Other Comprehensive Income |
| |
Retained
Earnings |
| |
Total
|
| | |
Number of
Common Shares (thousands) |
| ||||||||||||||||||
| | At December 31, 2021 | | | | | 23 650 | | | | | | 612 | | | | | | 814 | | | | | | 11 538 | | | | | | 36 614 | | | | | | | 1 441 251 | | |
| | Net earnings | | | | | — | | | | | | — | | | | | | — | | | | | | 2 949 | | | | | | 2 949 | | | | | | | — | | |
|
|
|||||||||||||||||||||||||||||||||||||||
| | Foreign currency translation adjustment | | | | | — | | | | | | — | | | | | | (56) | | | | | | — | | | | | | (56) | | | | | | | — | | |
|
|
|||||||||||||||||||||||||||||||||||||||
| |
Actuarial gain on employee retirement benefit
plans, net of income taxes of $123 |
| | | | — | | | | | | — | | | | | | — | | | | | | 392 | | | | | | 392 | | | | | | | — | | |
| | Total comprehensive (loss) income | | | | | — | | | | | | — | | | | | | (56) | | | | | | 3 341 | | | | | | 3 285 | | | | | | | — | | |
|
|
|||||||||||||||||||||||||||||||||||||||
| | Issued under share option plans | | | | | 91 | | | | | | (11) | | | | | | — | | | | | | — | | | | | | 80 | | | | | | | 2 612 | | |
|
|
|||||||||||||||||||||||||||||||||||||||
| |
Repurchase of common shares for cancellation
(note 8) |
| | | | (358) | | | | | | — | | | | | | — | | | | | | (469) | | | | | | (827) | | | | | | | (21 698) | | |
|
|
|||||||||||||||||||||||||||||||||||||||
| |
Change in liability for share repurchase commitment
|
| | | | (89) | | | | | | — | | | | | | — | | | | | | (196) | | | | | | (285) | | | | | | | — | | |
|
|
|||||||||||||||||||||||||||||||||||||||
| | Share-based compensation | | | | | — | | | | | | 8 | | | | | | — | | | | | | — | | | | | | 8 | | | | | | | — | | |
|
|
|||||||||||||||||||||||||||||||||||||||
| | Dividends paid on common shares | | | | | — | | | | | | — | | | | | | — | | | | | | (601) | | | | | | (601) | | | | | | | — | | |
| | At March 31, 2022 | | | | | 23 294 | | | | | | 609 | | | | | | 758 | | | | | | 13 613 | | | | | | 38 274 | | | | | | | 1 422 165 | | |
| | At December 31, 2022 | | | | | 22 257 | | | | | | 571 | | | | | | 974 | | | | | | 15 565 | | | | | | 39 367 | | | | | | | 1 337 471 | | |
| |
Net earnings
|
| | | | — | | | | | | — | | | | | | — | | | | | | 2 052 | | | | | | 2 052 | | | | | | | — | | |
|
|
|||||||||||||||||||||||||||||||||||||||
| | Foreign currency translation adjustment | | | |
|
—
|
| | | |
|
—
|
| | | |
|
52
|
| | | |
|
—
|
| | | |
|
52
|
| | | | |
|
—
|
| |
|
|
|||||||||||||||||||||||||||||||||||||||
| |
Actuarial gain on employee retirement benefit
plans, net of income taxes of $12 |
| | |
|
—
|
| | | |
|
—
|
| | | |
|
—
|
| | | |
|
42
|
| | | |
|
42
|
| | | | |
|
—
|
| |
| |
Total comprehensive income
|
| | | | — | | | | | | — | | | | | | 52 | | | | | | 2 094 | | | | | | 2 146 | | | | | | | — | | |
|
|
|||||||||||||||||||||||||||||||||||||||
| | Issued under share option plans | | | |
|
35
|
| | | |
|
1
|
| | | |
|
—
|
| | | |
|
—
|
| | | |
|
36
|
| | | | |
|
832
|
| |
|
|
|||||||||||||||||||||||||||||||||||||||
| |
Repurchase of common shares for cancellation
(note 8) |
| | |
|
(334)
|
| | | |
|
—
|
| | | |
|
—
|
| | | |
|
(540)
|
| | | |
|
(874)
|
| | | | |
|
(19 936)
|
| |
|
|
|||||||||||||||||||||||||||||||||||||||
| |
Change in liability for share repurchase commitment (note 8)
|
| | |
|
(20)
|
| | | |
|
—
|
| | | |
|
—
|
| | | |
|
(21)
|
| | | |
|
(41)
|
| | | | |
|
—
|
| |
|
|
|||||||||||||||||||||||||||||||||||||||
| | Share-based compensation | | | |
|
—
|
| | | |
|
5
|
| | | |
|
—
|
| | | |
|
—
|
| | | |
|
5
|
| | | | |
|
—
|
| |
|
|
|||||||||||||||||||||||||||||||||||||||
| | Dividends paid on common shares | | | |
|
—
|
| | | |
|
—
|
| | | |
|
—
|
| | | |
|
(690)
|
| | | |
|
(690)
|
| | | | |
|
—
|
| |
| | At March 31, 2023 | | | | | 21 938 | | | | | | 577 | | | | | | 1 026 | | | | | | 16 408 | | | | | | 39 949 | | | | | | | 1 318 367 | | |
| |
Three months ended March 31
|
| |
Oil Sands
|
| |
Exploration and
Production |
| |
Refining and
Marketing |
| |
Corporate and
Eliminations |
| |
Total
|
| |||||||||||||||||||||||||||||||||||||||||||||
| |
($ millions)
|
| |
2023
|
| |
2022
|
| |
2023
|
| |
2022
|
| |
2023
|
| |
2022
|
| |
2023
|
| |
2022
|
| |
2023
|
| |
2022
|
| ||||||||||||||||||||||||||||||
| | Revenues and Other Income | | | | | | | | | | | | | | | | | | | | | | | | | | | | | | | | | | | | | | | | | | | | | | | | | | | | | | | | | | | | | |
|
|
||||||||||||||||||||||||||||||||||||||||||||||||||||||||||||||
| | Gross revenues(1) | | | |
|
4 384
|
| | | | | 5 622 | | | | |
|
734
|
| | | | | 1 015 | | | | |
|
7 156
|
| | | | | 7 823 | | | | |
|
(2)
|
| | | | | 9 | | | | |
|
12 272
|
| | | | | 14 469 | | |
|
|
||||||||||||||||||||||||||||||||||||||||||||||||||||||||||||||
| | Intersegment revenues(1) | | | |
|
1 683
|
| | | | | 1 848 | | | | |
|
—
|
| | | | | — | | | | |
|
17
|
| | | | | 32 | | | | |
|
(1 700)
|
| | | | | (1 880) | | | | |
|
—
|
| | | | | — | | |
|
|
||||||||||||||||||||||||||||||||||||||||||||||||||||||||||||||
| | Less: Royalties | | | |
|
(272)
|
| | | | | (985) | | | | |
|
(86)
|
| | | | | (147) | | | | |
|
—
|
| | | | | — | | | | |
|
—
|
| | | | | — | | | | |
|
(358)
|
| | | | | (1 132) | | |
| | Operating revenues, net of royalties | | | |
|
5 795
|
| | | | | 6 485 | | | | |
|
648
|
| | | | | 868 | | | | |
|
7 173
|
| | | | | 7 855 | | | | |
|
(1 702)
|
| | | | | (1 871) | | | | |
|
11 914
|
| | | | | 13 337 | | |
|
|
||||||||||||||||||||||||||||||||||||||||||||||||||||||||||||||
| | Other income (loss) | | | |
|
115
|
| | | | | 7 | | | | |
|
32
|
| | | | | 68 | | | | |
|
156
|
| | | | | (110) | | | | |
|
39
|
| | | | | 49 | | | | |
|
342
|
| | | | | 14 | | |
| | | | | | | 5 910 | | | | |
|
6 492
|
| | | | | 680 | | | | |
|
936
|
| | | | | 7 329 | | | | |
|
7 745
|
| | | | | (1 663) | | | | |
|
(1 822)
|
| | | | | 12 256 | | | | |
|
13 351
|
| |
| | Expenses | | | | | | | | | | | | | | | | | | | | | | | | | | | | | | | | | | | | | | | | | | | | | | | | | | | | | | | | | | | | | |
|
|
||||||||||||||||||||||||||||||||||||||||||||||||||||||||||||||
| |
Purchases of crude oil and products(1)
|
| | |
|
408
|
| | | | | 453 | | | | |
|
—
|
| | | | | — | | | | |
|
5 354
|
| | | | | 5 482 | | | | |
|
(1 693)
|
| | | | | (1 583) | | | | |
|
4 069
|
| | | | | 4 352 | | |
|
|
||||||||||||||||||||||||||||||||||||||||||||||||||||||||||||||
| | Operating, selling and general | | | |
|
2 421
|
| | | | | 2 212 | | | | |
|
133
|
| | | | | 108 | | | | |
|
650
|
| | | | | 559 | | | | |
|
220
|
| | | | | 209 | | | | |
|
3 424
|
| | | | | 3 088 | | |
|
|
||||||||||||||||||||||||||||||||||||||||||||||||||||||||||||||
| | Transportation and distribution | | | |
|
270
|
| | | | | 293 | | | | |
|
21
|
| | | | | 23 | | | | |
|
109
|
| | | | | 63 | | | | |
|
(9)
|
| | | | | (9) | | | | |
|
391
|
| | | | | 370 | | |
|
|
||||||||||||||||||||||||||||||||||||||||||||||||||||||||||||||
| | Depreciation, depletion, amortization and impairment | | | |
|
1 138
|
| | | | | 1 105 | | | | |
|
127
|
| | | | | 129 | | | | |
|
220
|
| | | | | 212 | | | | |
|
31
|
| | | | | 25 | | | | |
|
1 516
|
| | | | | 1 471 | | |
|
|
||||||||||||||||||||||||||||||||||||||||||||||||||||||||||||||
| | Exploration | | | |
|
35
|
| | | | | 31 | | | | |
|
7
|
| | | | | 8 | | | | |
|
—
|
| | | | | — | | | | |
|
—
|
| | | | | — | | | | |
|
42
|
| | | | | 39 | | |
|
|
||||||||||||||||||||||||||||||||||||||||||||||||||||||||||||||
| | Gain on disposal of assets | | | |
|
—
|
| | | | | (2) | | | | |
|
(1)
|
| | | | | — | | | | |
|
(11)
|
| | | | | — | | | | |
|
(302)
|
| | | | | — | | | | |
|
(314)
|
| | | | | (2) | | |
|
|
||||||||||||||||||||||||||||||||||||||||||||||||||||||||||||||
| | Financing expenses | | | |
|
161
|
| | | | | 91 | | | | |
|
18
|
| | | | | 23 | | | | |
|
14
|
| | | | | 12 | | | | |
|
221
|
| | | | | 59 | | | | |
|
414
|
| | | | | 185 | | |
| | | | | | | 4 433 | | | | |
|
4 183
|
| | | | | 305 | | | | |
|
291
|
| | | | | 6 336 | | | | |
|
6 328
|
| | | | | (1 532) | | | | |
|
(1 299)
|
| | | | | 9 542 | | | | |
|
9 503
|
| |
| |
Earnings (Loss) before Income Taxes
|
| | |
|
1 477
|
| | | | | 2 309 | | | | |
|
375
|
| | | | | 645 | | | | |
|
993
|
| | | | | 1 417 | | | | |
|
(131)
|
| | | | | (523) | | | | |
|
2 714
|
| | | | | 3 848 | | |
|
|
||||||||||||||||||||||||||||||||||||||||||||||||||||||||||||||
| | Income Tax Expense (Recovery) | | | | | | | | | | | | | | | | | | | | | | | | | | | | | | | | | | | | | | | | | | | | | | | | | | | | | | | | | | | | | |
|
|
||||||||||||||||||||||||||||||||||||||||||||||||||||||||||||||
| | Current | | | |
|
—
|
| | | | | — | | | | |
|
—
|
| | | | | — | | | | |
|
—
|
| | | | | — | | | | |
|
—
|
| | | | | — | | | | |
|
738
|
| | | | | 976 | | |
|
|
||||||||||||||||||||||||||||||||||||||||||||||||||||||||||||||
| | Deferred | | | |
|
—
|
| | | | | — | | | | |
|
—
|
| | | | | — | | | | |
|
—
|
| | | | | — | | | | |
|
—
|
| | | | | — | | | | |
|
(76)
|
| | | | | (77) | | |
| | | | | | | — | | | | |
|
—
|
| | | | | — | | | | |
|
—
|
| | | | | — | | | | |
|
—
|
| | | | | — | | | | |
|
—
|
| | | | | 662 | | | | |
|
899
|
| |
| | Net Earnings | | | | | — | | | | |
|
—
|
| | | | | — | | | | |
|
—
|
| | | | | — | | | | |
|
—
|
| | | | | — | | | | |
|
—
|
| | | | | 2 052 | | | | |
|
2 949
|
| |
| |
Capital and Exploration Expenditures(2)
|
| | | | 810 | | | | |
|
668
|
| | | | | 138 | | | | |
|
83
|
| | | | | 125 | | | | |
|
132
|
| | | | | 13 | | | | |
|
128
|
| | | | | 1 086 | | | | |
|
1 011
|
| |
| |
Three months ended March 31
|
| |
2023
|
| |
2022
|
| ||||||||||||||||||||||||||||||
| |
($ millions)
|
| |
North America
|
| |
International
|
| |
Total
|
| |
North America
|
| |
International
|
| |
Total
|
| ||||||||||||||||||
| | Oil Sands | | | | | | | | | | | | | | | | | | | | | | | | | | | | | | | | | | | | | |
|
|
||||||||||||||||||||||||||||||||||||||
| |
Synthetic crude oil and diesel(1)
|
| | |
|
4 832
|
| | | |
|
—
|
| | | |
|
4 832
|
| | | | | 5 688 | | | | | | — | | | | | | 5 688 | | |
|
|
||||||||||||||||||||||||||||||||||||||
| |
Bitumen
|
| | |
|
1 235
|
| | | |
|
—
|
| | | |
|
1 235
|
| | | | | 1 782 | | | | | | — | | | | | | 1 782 | | |
| | | | | | | 6 067 | | | | | | — | | | | | | 6 067 | | | | |
|
7 470
|
| | | |
|
—
|
| | | |
|
7 470
|
| |
| | Exploration and Production | | | | | | | | | | | | | | | | | | | | | | | | | | | | | | | | | | | | | |
|
|
||||||||||||||||||||||||||||||||||||||
| |
Crude oil and natural gas liquids
|
| | |
|
458
|
| | | |
|
271
|
| | | |
|
729
|
| | | | | 563 | | | | | | 443 | | | | | | 1 006 | | |
|
|
||||||||||||||||||||||||||||||||||||||
| |
Natural gas
|
| | |
|
—
|
| | | |
|
5
|
| | | |
|
5
|
| | | | | — | | | | | | 9 | | | | | | 9 | | |
| | | | | |
|
458
|
| | | |
|
276
|
| | | |
|
734
|
| | | | | 563 | | | | | | 452 | | | | | | 1 015 | | |
| | Refining and Marketing | | | | | | | | | | | | | | | | | | | | | | | | | | | | | | | | | | | | | |
|
|
||||||||||||||||||||||||||||||||||||||
| |
Gasoline
|
| | |
|
2 818
|
| | | |
|
—
|
| | | |
|
2 818
|
| | | | | 3 033 | | | | | | — | | | | | | 3 033 | | |
|
|
||||||||||||||||||||||||||||||||||||||
| |
Distillate
|
| | |
|
3 786
|
| | | |
|
—
|
| | | |
|
3 786
|
| | | | | 3 845 | | | | | | — | | | | | | 3 845 | | |
|
|
||||||||||||||||||||||||||||||||||||||
| |
Other
|
| | |
|
569
|
| | | |
|
—
|
| | | |
|
569
|
| | | | | 977 | | | | | | — | | | | | | 977 | | |
| | | | | | | 7 173 | | | | | | — | | | | | | 7 173 | | | | |
|
7 855
|
| | | |
|
—
|
| | | |
|
7 855
|
| |
| | Corporate and Eliminations(1) | | | | | | | | | | | | | | | | | | | | | | | | | | | | | | | | | | | | | |
| | | | | | | (1 702) | | | | | | — | | | | | | (1 702) | | | | |
|
(1 871)
|
| | | |
|
—
|
| | | |
|
(1 871)
|
| |
| |
Total Revenue from Contracts with Customers
|
| | | | 11 996 | | | | | | 276 | | | | | | 12 272 | | | | |
|
14 017
|
| | | |
|
452
|
| | | |
|
14 469
|
| |
| | | | |
Three months ended
March 31 |
| |||||||||
| |
($ millions)
|
| |
2023
|
| |
2022
|
| ||||||
| | Energy trading and risk management | | | |
|
279
|
| | | | | (93) | | |
|
|
||||||||||||||
| | Investment and interest income | | | |
|
59
|
| | | | | 32 | | |
|
|
||||||||||||||
| | Other(1) | | | |
|
4
|
| | | | | 75 | | |
| | | | | | | 342 | | | | |
|
14
|
| |
| | | | |
Three months ended
March 31 |
| |||||||||
| |
($ millions)
|
| |
2023
|
| |
2022
|
| ||||||
| | Equity-settled plans | | | |
|
5
|
| | | | | 8 | | |
|
|
||||||||||||||
| | Cash-settled plans | | | |
|
96
|
| | | | | 198 | | |
| | | | | | | 101 | | | | |
|
206
|
| |
| | | | |
Three months ended
March 31 |
| |||||||||
| |
($ millions)
|
| |
2023
|
| |
2022
|
| ||||||
| | Interest on debt | | | |
|
197
|
| | | | | 195 | | |
|
|
||||||||||||||
| | Interest on lease liabilities | | | |
|
46
|
| | | | | 39 | | |
|
|
||||||||||||||
| | Capitalized interest | | | |
|
(58)
|
| | | | | (37) | | |
| |
Interest expense
|
| | |
|
185
|
| | | | | 197 | | |
|
|
||||||||||||||
| |
Interest on partnership liability
|
| | |
|
12
|
| | | | | 13 | | |
|
|
||||||||||||||
| |
Interest on pension and other post-retirement benefits
|
| | |
|
6
|
| | | | | 10 | | |
|
|
||||||||||||||
| |
Accretion
|
| | |
|
133
|
| | | | | 78 | | |
|
|
||||||||||||||
| |
Foreign exchange loss (gain) on U.S. dollar denominated debt
|
| | |
|
3
|
| | | | | (146) | | |
|
|
||||||||||||||
| |
Operational foreign exchange and other
|
| | |
|
75
|
| | | | | 33 | | |
| | | | | | | 414 | | | | |
|
185
|
| |
| | | | |
Three months ended
March 31 |
| |||||||||
| |
($ millions)
|
| |
2023
|
| |
2022
|
| ||||||
| | Net earnings | | | |
|
2 052
|
| | | | | 2 949 | | |
| | (millions of common shares) | | | | | | | | | | | | | |
| | Weighted average number of common shares | | | |
|
1 329
|
| | | | | 1 433 | | |
|
|
||||||||||||||
| | Dilutive securities: | | | | | | | | | | | | | |
|
|
||||||||||||||
| |
Effect of share options
|
| | |
|
2
|
| | | | | 2 | | |
| | Weighted average number of diluted common shares | | | |
|
1 331
|
| | | | | 1 435 | | |
| | (dollars per common share) | | | | | | | | | | | | | |
| | Basic and diluted earnings per share | | | |
|
1.54
|
| | | | | 2.06 | | |
| | | | |
Three months ended
March 31 |
| |||||||||
| |
($ millions, except as noted)
|
| |
2023
|
| |
2022
|
| ||||||
| | Share repurchase activities (thousands of common shares) | | | | | | | | | | | | | |
|
|
||||||||||||||
| |
Shares repurchased
|
| | |
|
19 936
|
| | | | | 21 698 | | |
| | Amounts charged to: | | | | | | | | | | | | | |
|
|
||||||||||||||
| |
Share capital
|
| | |
|
334
|
| | | | | 358 | | |
|
|
||||||||||||||
| |
Retained earnings
|
| | |
|
540
|
| | | | | 469 | | |
| | Share repurchase cost | | | |
|
874
|
| | | | | 827 | | |
| |
($ millions)
|
| |
March 31
2023 |
| |
December 31
2022 |
| ||||||
| | Amounts charged to: | | | | | | | | | | | | | |
|
|
||||||||||||||
| |
Share capital
|
| | |
|
156
|
| | | | | 136 | | |
|
|
||||||||||||||
| |
Retained earnings
|
| | |
|
235
|
| | | | | 214 | | |
| | Liability for share purchase commitment | | | |
|
391
|
| | | | | 350 | | |
| |
($ millions)
|
| |
Total
|
| |||
| | Fair value outstanding at December 31, 2022 | | | | | (65) | | |
|
|
||||||||
| |
Cash settlements – received during the year
|
| | | | (101) | | |
|
|
||||||||
| |
Changes in fair value recognized in earnings during the year
|
| | | | 62 | | |
| | Fair value outstanding at March 31, 2023 | | | | | (104) | | |
| |
($ millions)
|
| |
Level 1
|
| |
Level 2
|
| |
Level 3
|
| |
Total Fair Value
|
| ||||||||||||
| | Accounts receivable | | | | | 45 | | | | | | 45 | | | | | | — | | | | | | 90 | | |
|
|
||||||||||||||||||||||||||
| | Accounts payable | | | | | (138) | | | | | | (56) | | | | | | — | | | | | | (194) | | |
| | | | | | | (93) | | | | | | (11) | | | | | | — | | | | | | (104) | | |
| |
($ millions)
|
| | | | | | |
| | Accounts receivable | | | | | 35 | | |
|
|
||||||||
| | Inventory | | | | | 37 | | |
|
|
||||||||
| | Property, plant and equipment | | | | | 1 149 | | |
|
|
||||||||
| | Other assets(1) | | | | | 6 | | |
| | Total assets acquired | | | | | 1 227 | | |
| | Accounts payable and accrued liabilities | | | | | (102) | | |
|
|
||||||||
| | Lease liabilities | | | | | (284) | | |
|
|
||||||||
| | Decommissioning provision | | | | | (83) | | |
|
|
||||||||
| | Deferred income taxes | | | | | (46) | | |
| | Total liabilities assumed | | | | | (515) | | |
| | Net assets acquired | | | | | 712 | | |
EXHIBIT 99.3
Certification of the President and Chief Executive Officer
CERTIFICATION
I, Richard Kruger, certify that:
| 1. | I have reviewed this quarterly report for the fiscal quarter ended March 31, 2023 of Suncor Energy Inc.; |
| 2. | Based on my knowledge, this report does not contain any untrue statement of a material fact or omit to state a material fact necessary to make the statements made, in light of the circumstances under which such statements were made, not misleading with respect to the period covered by this report; |
| 3. | Based on my knowledge, the financial statements, and other financial information included in this report, fairly present in all material respects the financial condition, results of operations and cash flows of the issuer as of, and for, the periods presented in this report; |
| 4. | The issuer's other certifying officer and I are responsible for establishing and maintaining disclosure controls and procedures (as defined in Exchange Act Rules 13a-15(e) and 15d-15(e)) and internal control over financial reporting (as defined in Exchange Act Rules 13a – 15(f) and 15d – 15(f)) for the issuer and have: |
| (a) | Designed such disclosure controls and procedures, or caused such disclosure controls and procedures to be designed under our supervision, to ensure that material information relating to the issuer, including its consolidated subsidiaries, is made known to us by others within those entities, particularly during the period in which this report is being prepared; |
| (b) | Designed such internal control over financial reporting, or caused such internal control over financial reporting to be designed under our supervision, to provide reasonable assurance regarding the reliability of financial reporting and the preparation of financial statements for external purposes in accordance with generally accepted accounting principles; |
| (c) | Evaluated the effectiveness of the issuer's disclosure controls and procedures and presented in this report our conclusions about the effectiveness of the disclosure controls and procedures, as of the end of the period covered by this report based on such evaluation; and |
| (d) | Disclosed in this report any change in the issuer’s internal control over financial reporting that occurred during the issuer's most recent fiscal quarter that has materially affected, or is reasonably likely to materially affect, the issuer’s internal control over financial reporting; and |
| 5. | The issuer's other certifying officer and I have disclosed, based on our most recent evaluation of internal control over financial reporting, to the issuer's auditors and the audit committee of the issuer's board of directors (or persons performing the equivalent functions): |
| (a) | All significant deficiencies and material weaknesses in the design or operation of internal control over financial reporting which are reasonably likely to adversely affect the issuer's ability to record, process, summarize and report financial information; and |
| (b) | Any fraud, whether or not material, that involves management or other employees who have a significant role in the issuer's internal control over financial reporting. |
| DATE: | May 8, 2023 | “Richard Kruger” | |
| Richard Kruger | |||
| President and Chief Executive Officer | |||
EXHIBIT 99.4
Certification of the Chief Financial Officer
CERTIFICATION
I, Alister Cowan, certify that:
| 1. | I have reviewed this quarterly report for the fiscal quarter ended March 31, 2023 of Suncor Energy Inc.; |
| 2. | Based on my knowledge, this report does not contain any untrue statement of a material fact or omit to state a material fact necessary to make the statements made, in light of the circumstances under which such statements were made, not misleading with respect to the period covered by this report; |
| 3. | Based on my knowledge, the financial statements, and other financial information included in this report, fairly present in all material respects the financial condition, results of operations and cash flows of the issuer as of, and for, the periods presented in this report; |
| 4. | The issuer's other certifying officer and I are responsible for establishing and maintaining disclosure controls and procedures (as defined in Exchange Act Rules 13a-15(e) and 15d-15(e)) and internal control over financial reporting (as defined in Exchange Act Rules 13a – 15(f) and 15d – 15(f)) for the issuer and have: |
| (a) | Designed such disclosure controls and procedures, or caused such disclosure controls and procedures to be designed under our supervision, to ensure that material information relating to the issuer, including its consolidated subsidiaries, is made known to us by others within those entities, particularly during the period in which this report is being prepared; |
| (b) | Designed such internal control over financial reporting, or caused such internal control over financial reporting to be designed under our supervision, to provide reasonable assurance regarding the reliability of financial reporting and the preparation of financial statements for external purposes in accordance with generally accepted accounting principles; |
| (c) | Evaluated the effectiveness of the issuer's disclosure controls and procedures and presented in this report our conclusions about the effectiveness of the disclosure controls and procedures, as of the end of the period covered by this report based on such evaluation; and |
| (d) | Disclosed in this report any change in the issuer’s internal control over financial reporting that occurred during the issuer's most recent fiscal quarter that has materially affected, or is reasonably likely to materially affect, the issuer’s internal control over financial reporting; and |
| 5. | The issuer's other certifying officer and I have disclosed, based on our most recent evaluation of internal control over financial reporting, to the issuer's auditors and the audit committee of the issuer's board of directors (or persons performing the equivalent functions): |
| (a) | All significant deficiencies and material weaknesses in the design or operation of internal control over financial reporting which are reasonably likely to adversely affect the issuer's ability to record, process, summarize and report financial information; and |
| (b) | Any fraud, whether or not material, that involves management or other employees who have a significant role in the issuer's internal control over financial reporting. |
| DATE: | May 8, 2023 | “Alister Cowan” | |
| Alister Cowan | |||
| Chief Financial Officer | |||