Operator
Good day, and thank you for standing by. Welcome to the Valley National Bancorp First Quarter 2026 Earnings Conference Call. At this time, all participants are in a listening mode. After the speaker's presentation, there will be a question and answer session. To ask a question during the session, you will need to press star 11 on your telephone. You will then hear an automated message advising your hand is raised. To withdraw your question, please press star 11 again. Please be advised that today's conference is being recorded. I would now like to hand the conference over to your speaker today, Andrew Giannetti, investor relations. Please go ahead.
Good morning, and welcome to Valley's first quarter 2026 earnings conference call. I am joined today by CEO Ira Robbins and CFO Travis Land. Our quarterly earnings release and supporting documents are available at valley.com. Reconciliations of any non-GAAP measures mentioned on the call can be found in today's earnings release and presentation. Please also note slide 2 of our earnings presentation and remember that comments made today may include forward-looking statements about Valley National Bancorp and the banking industry. For more information on these forward-looking statements and associated risk factors, please refer to our SEC filings, including forms 8K, 10Q, and 10K. With that, I'll turn the call over to Ira Robbins.
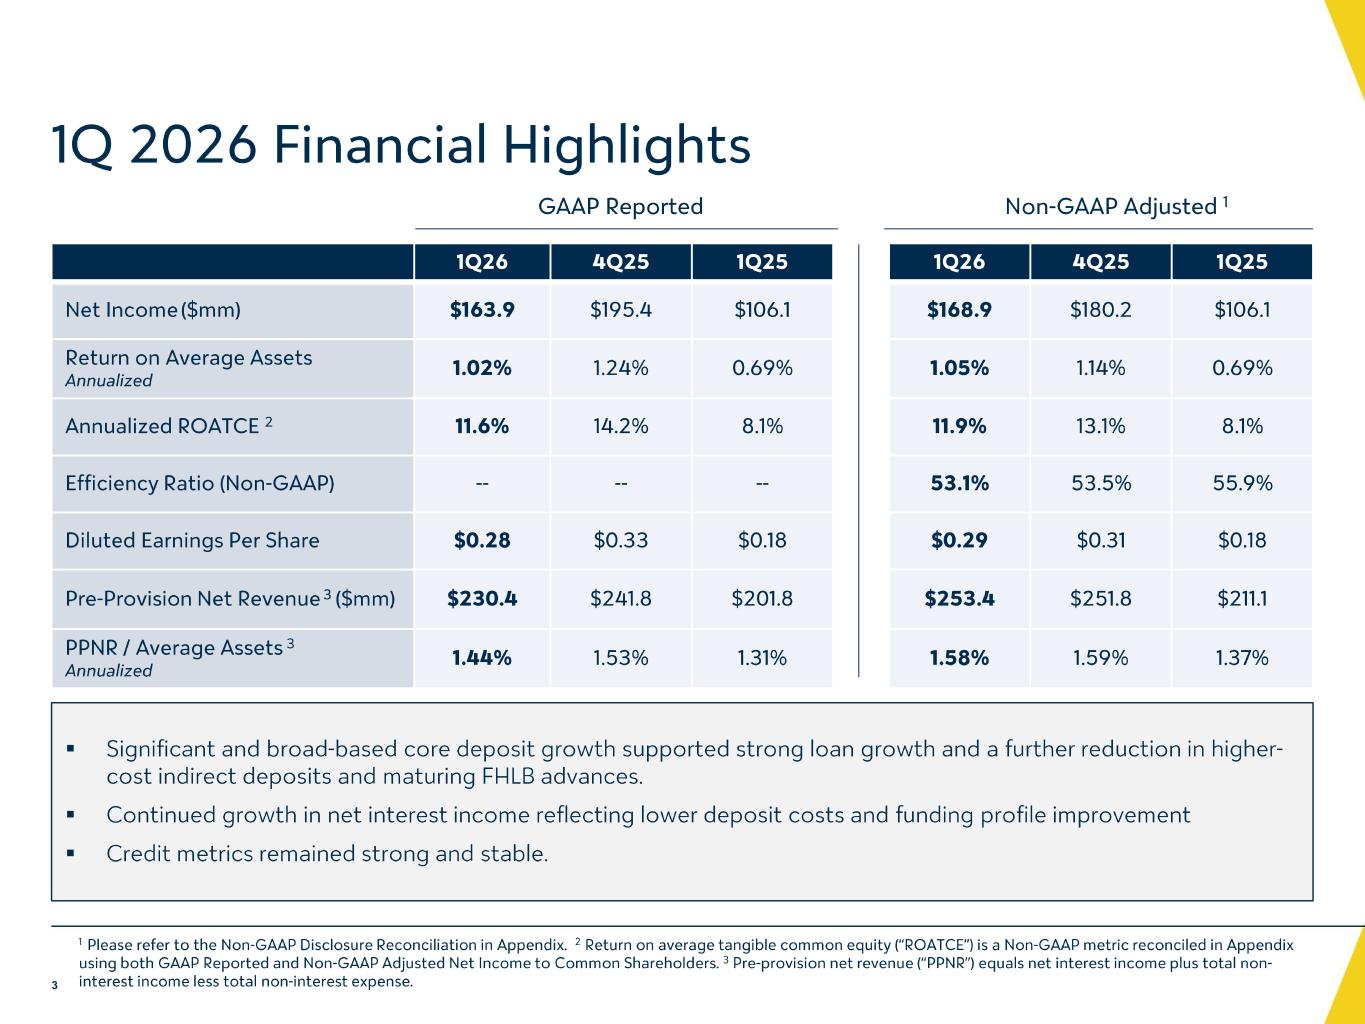
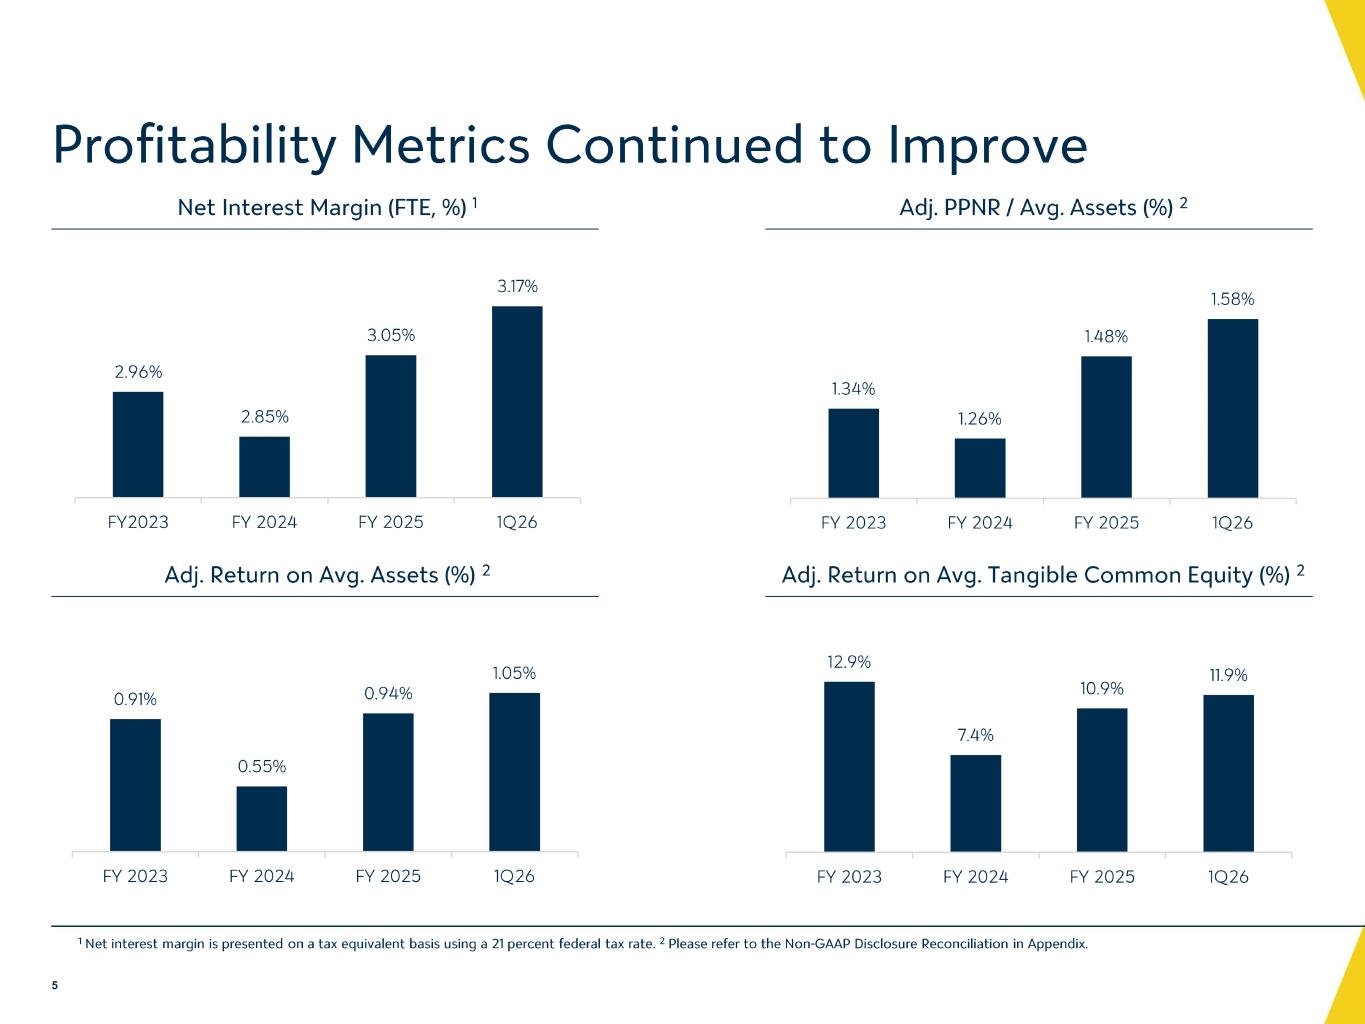
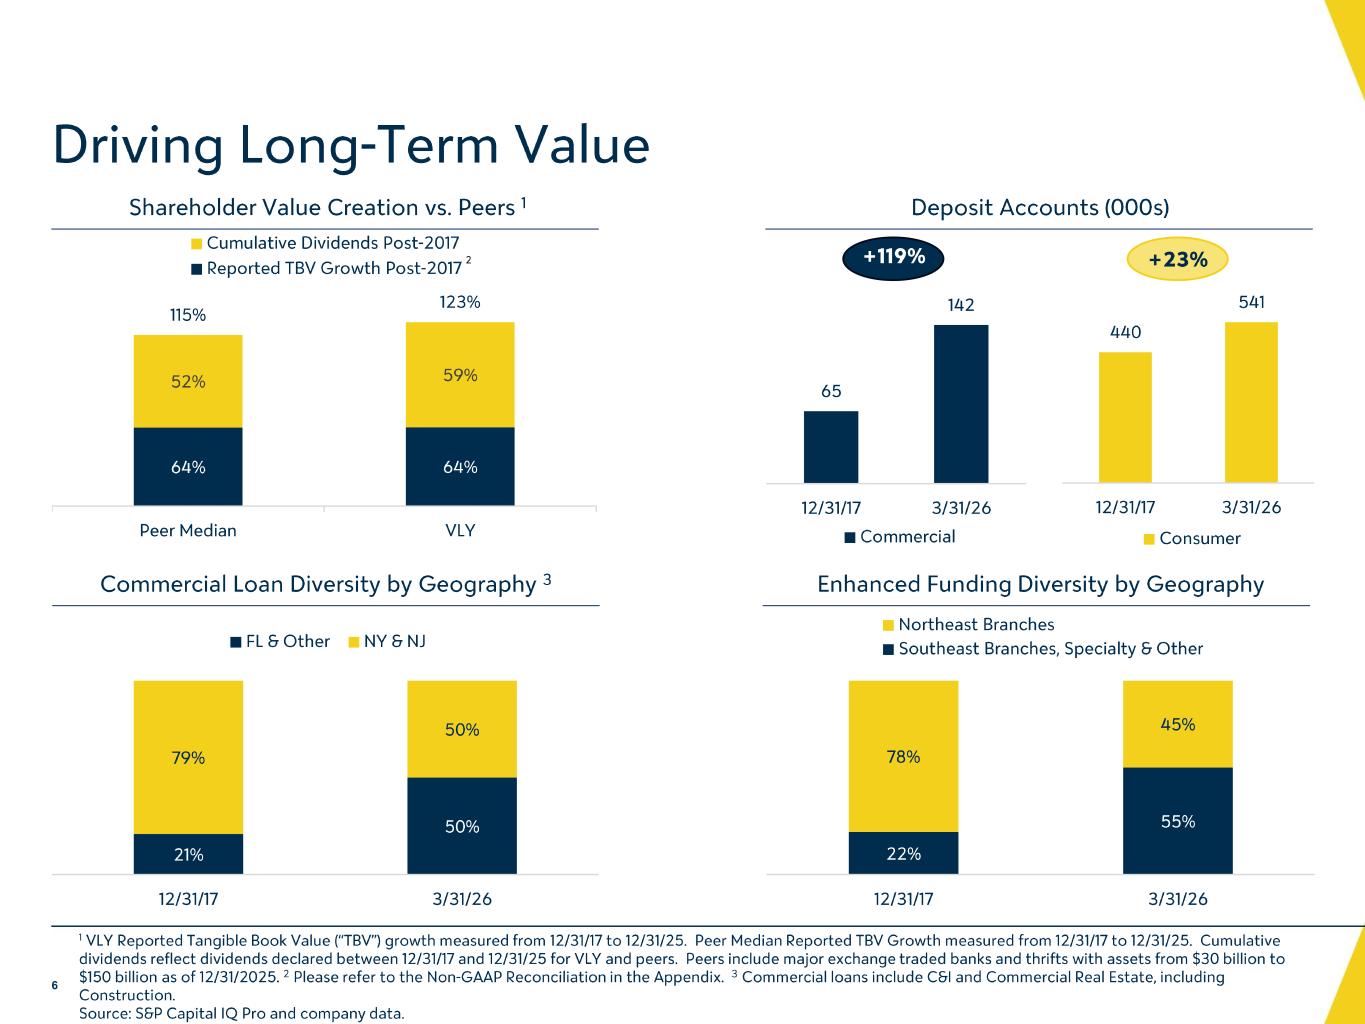
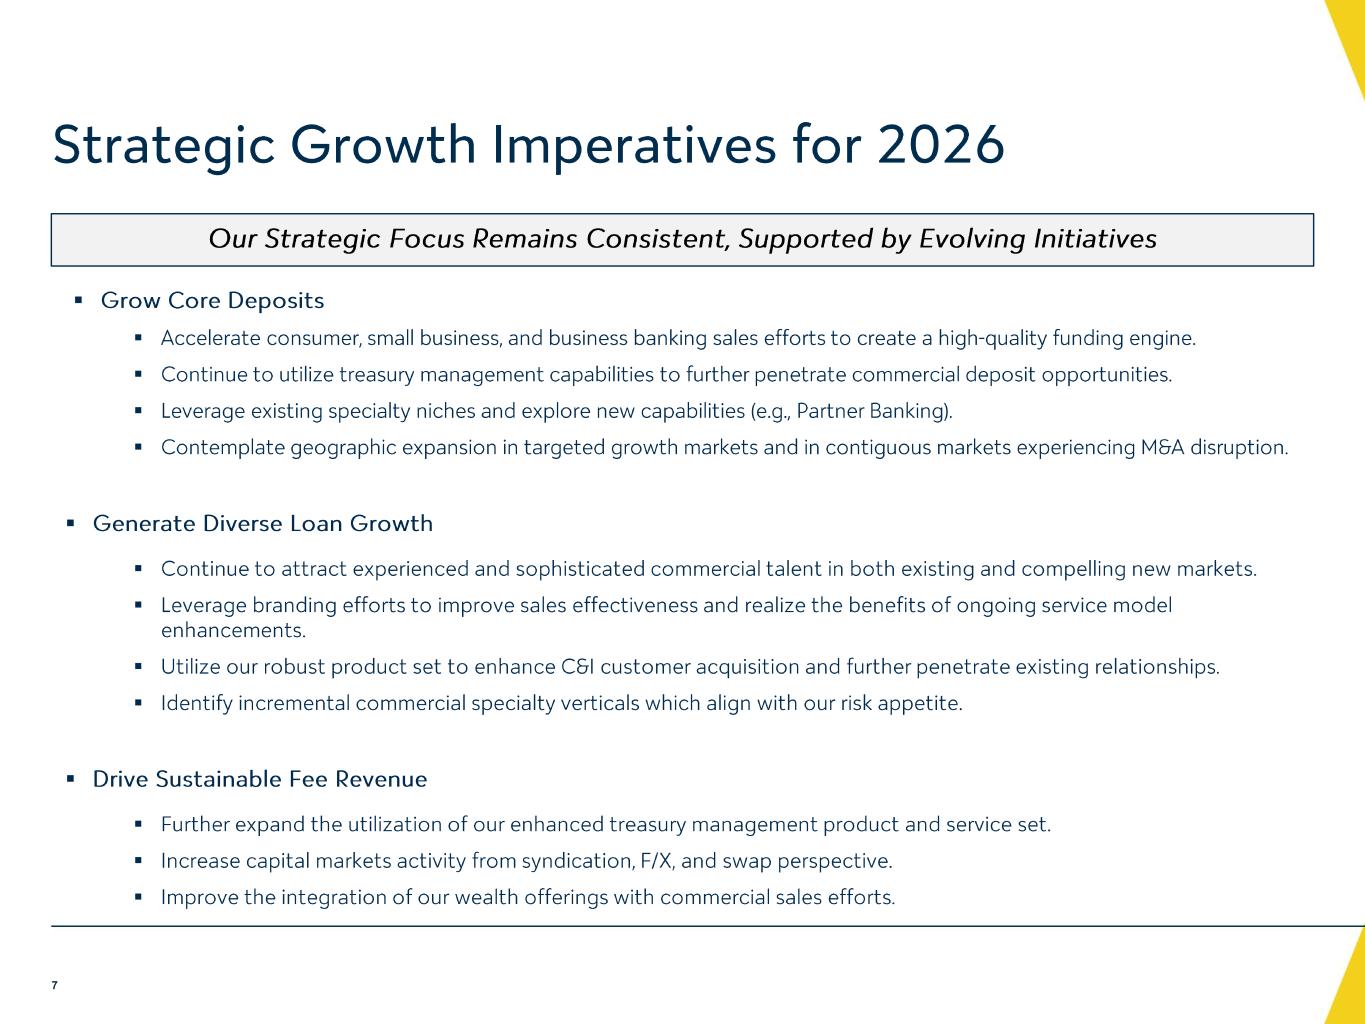
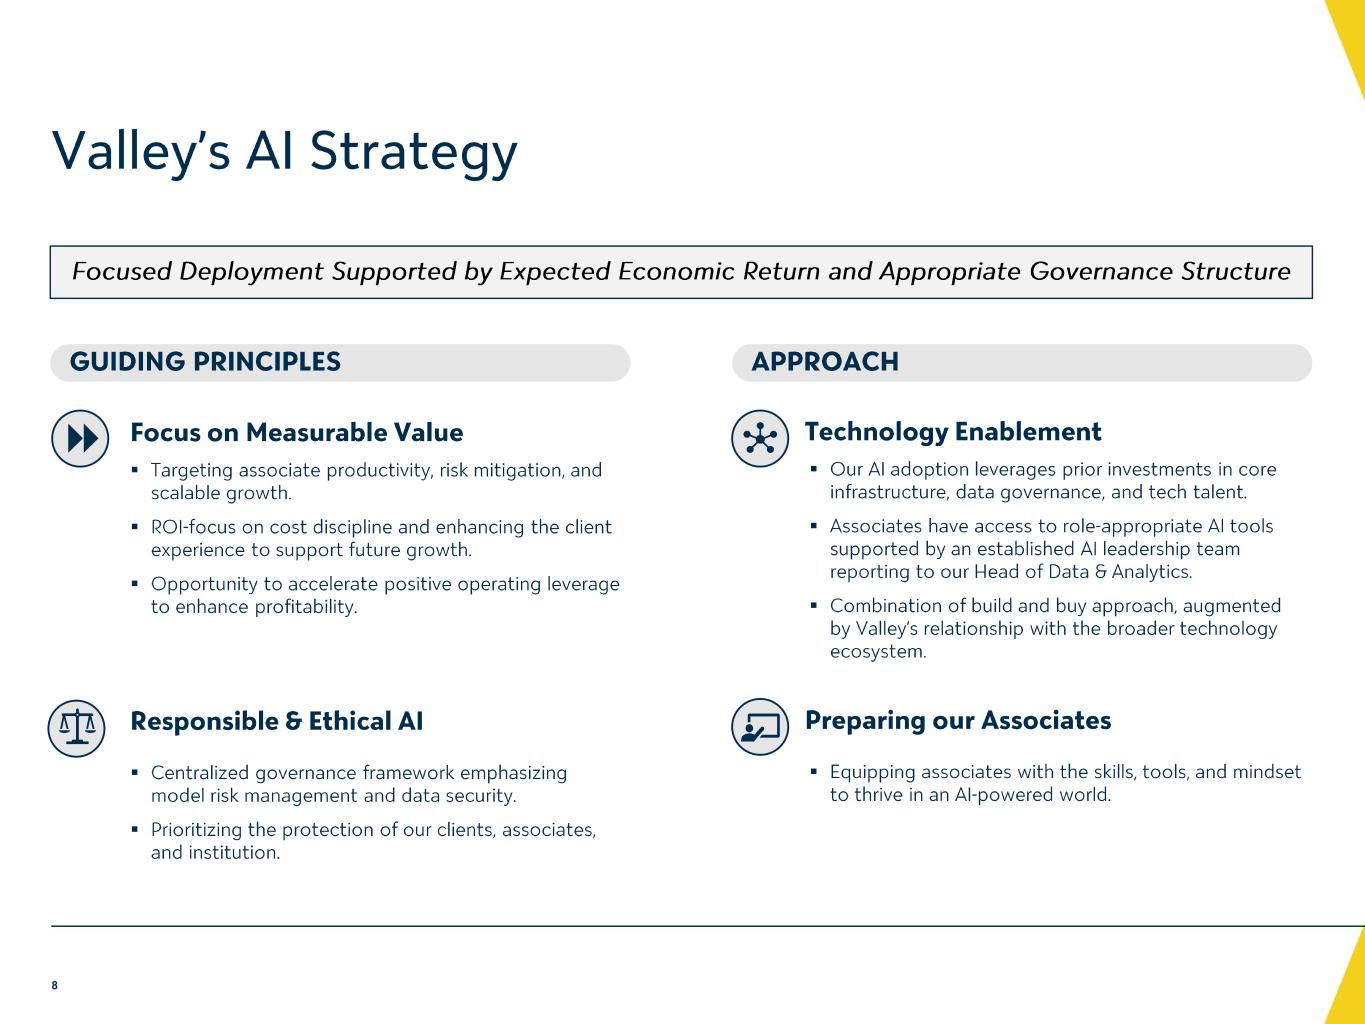
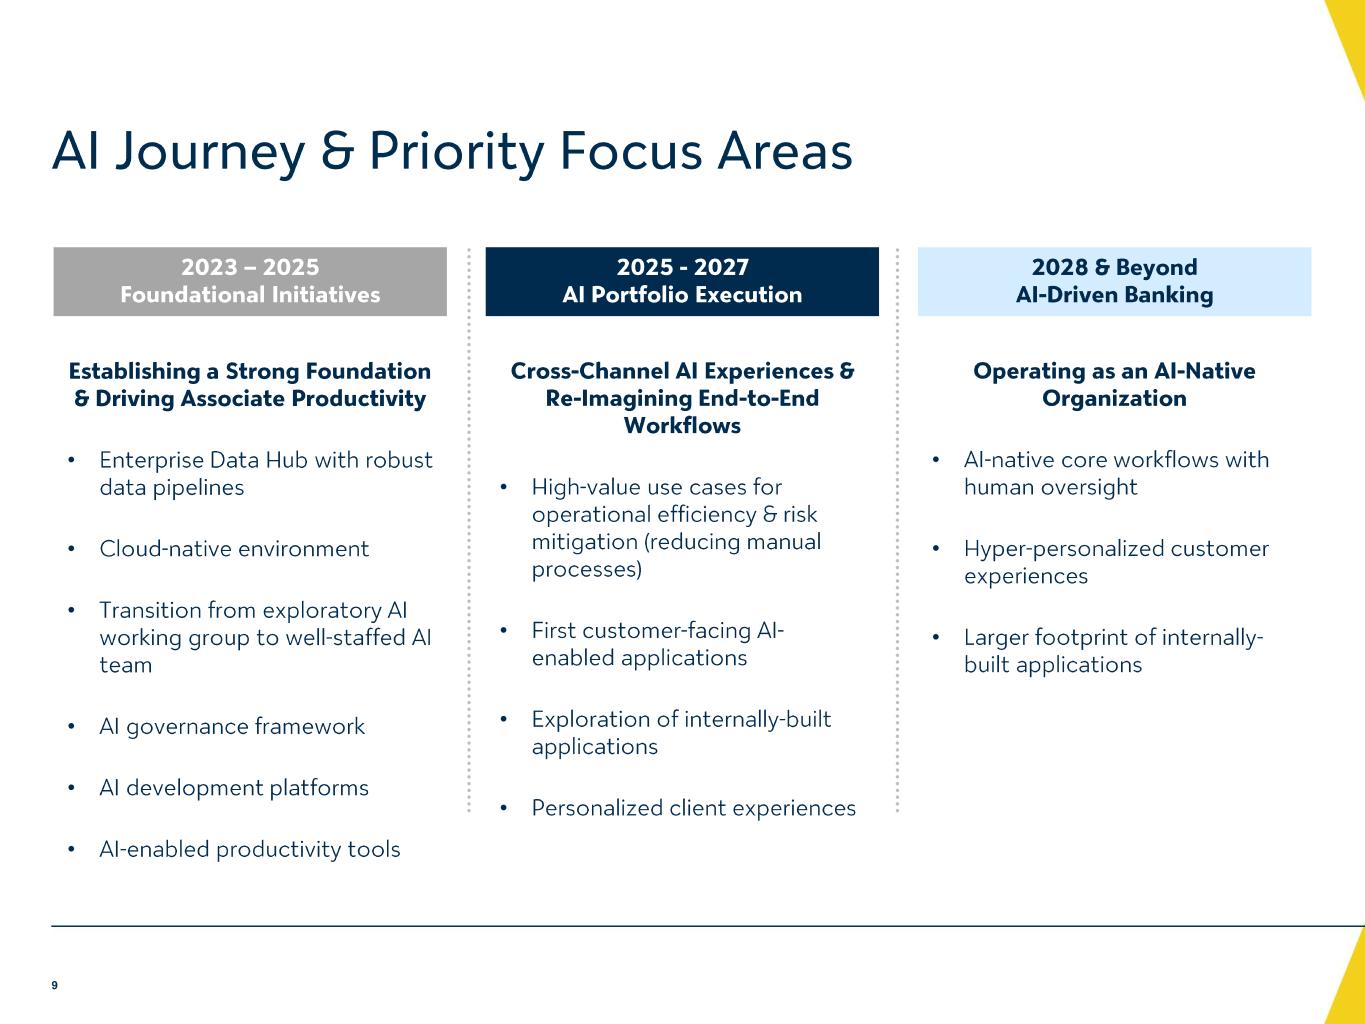
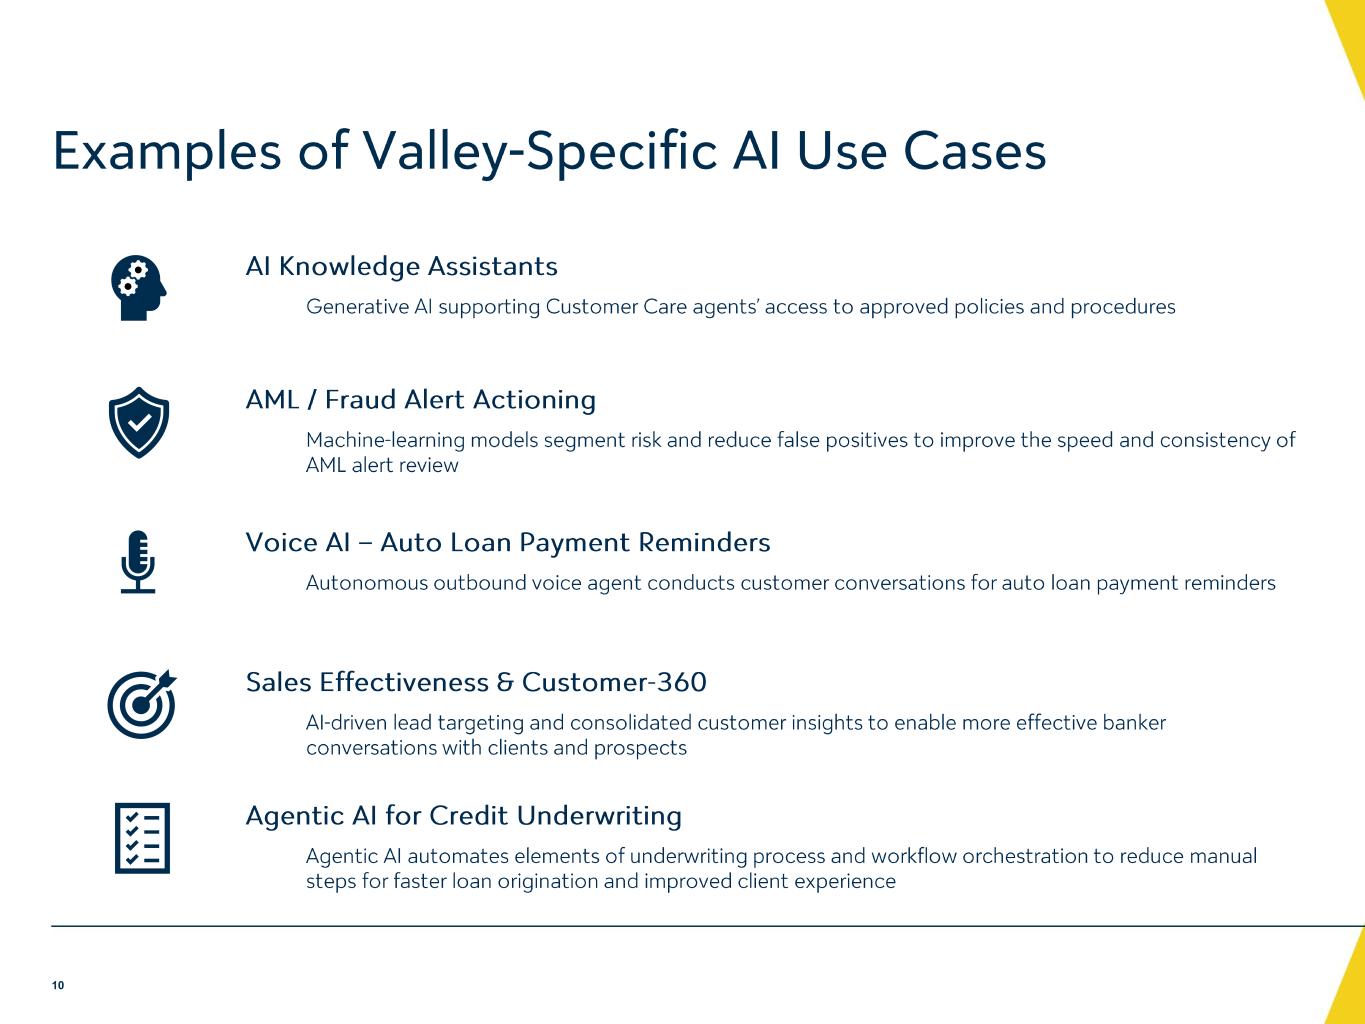
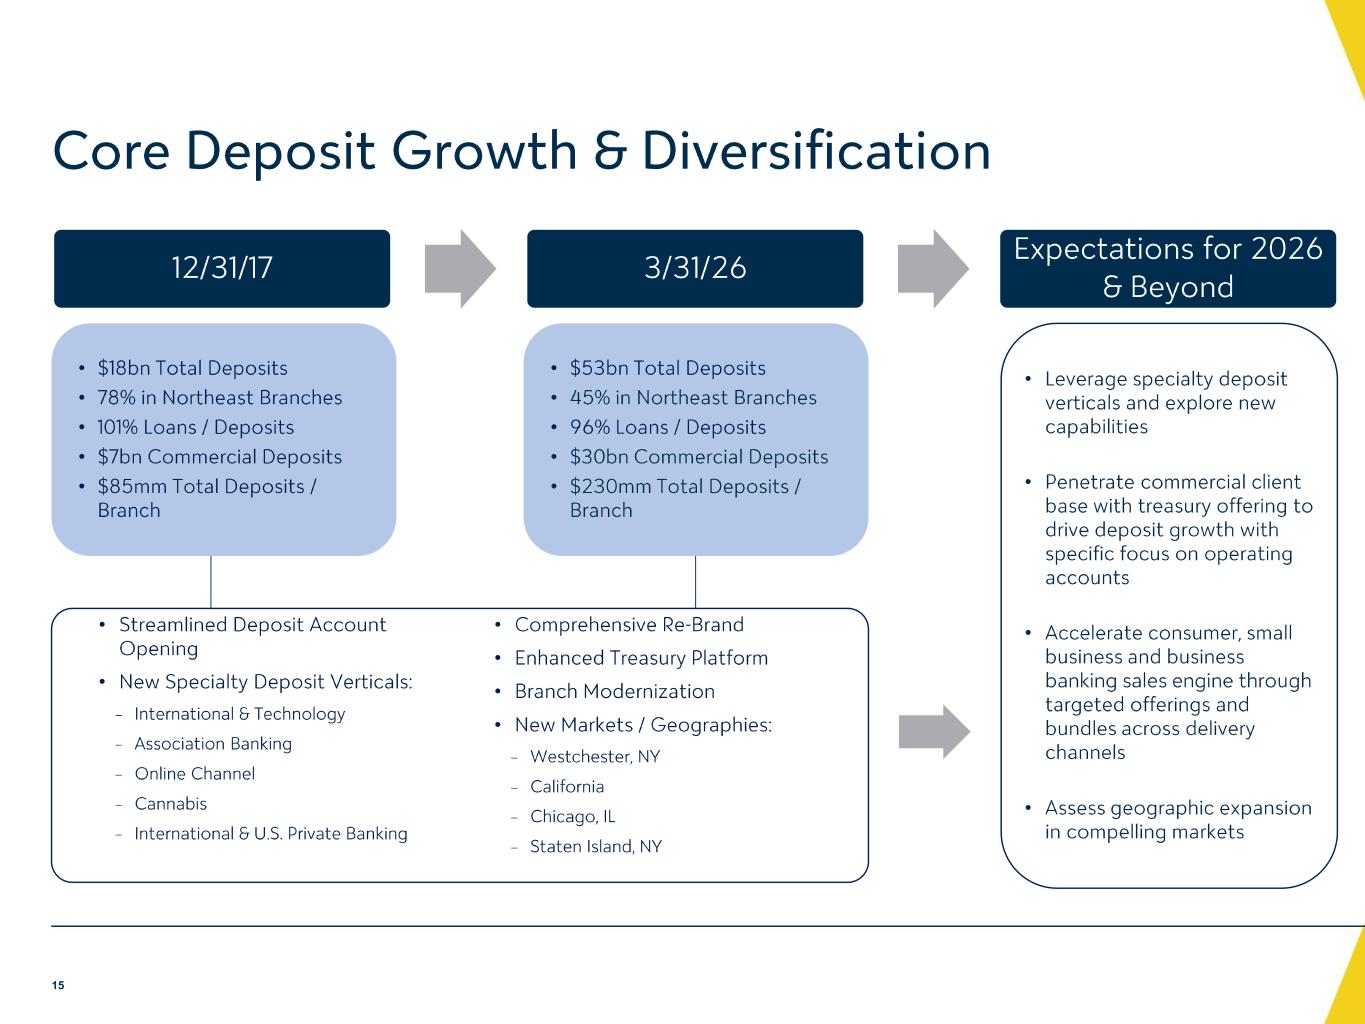
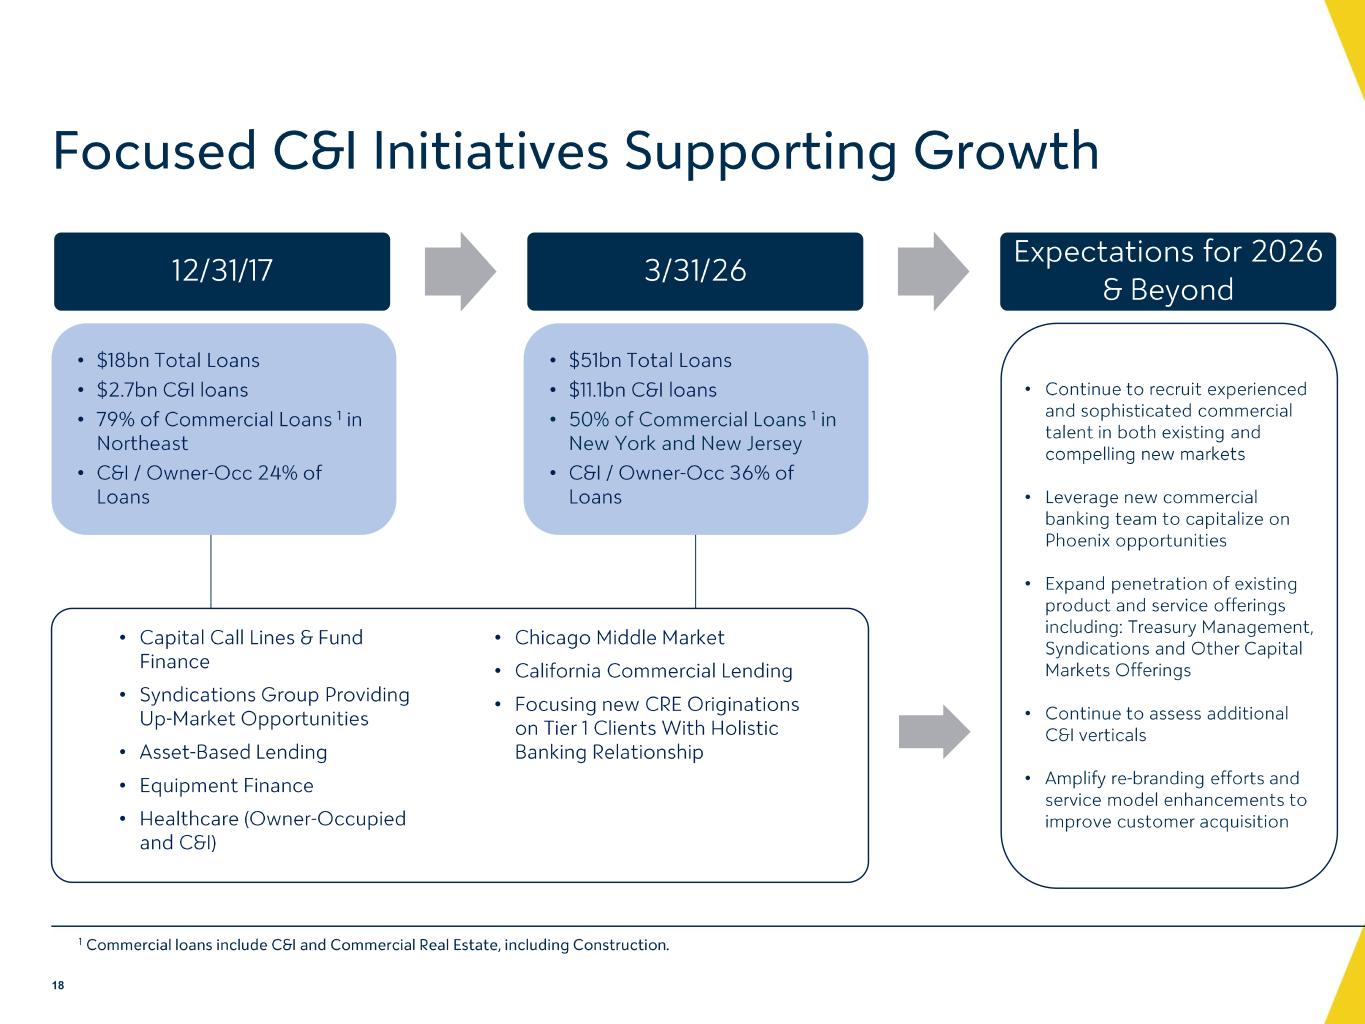
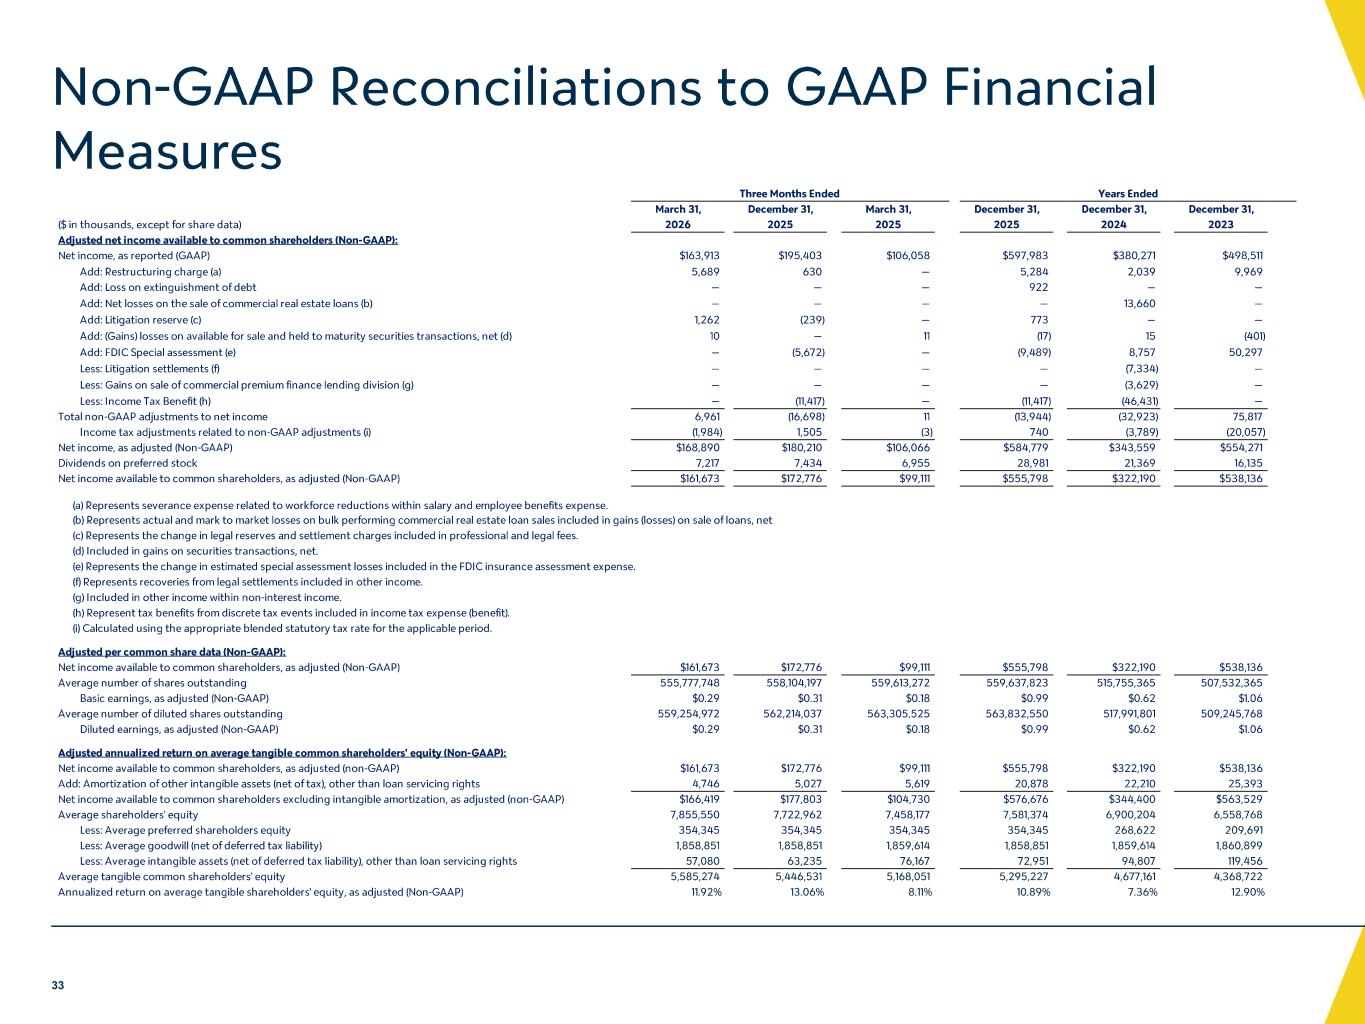
Thank you, Andrew. Valley delivered another strong quarter with net income of approximately $164 million or $0.28 per diluted share. Excluding certain non-core items, adjusted net income was $169 million or $0.29 per diluted Despite traditional first quarter headwinds, including elevated payroll taxes and a lower day count, adjusted pre-provisioned net revenue increased to $253 million during the quarter, providing a strong jumping-off point for the rest of the year. While Travis will provide additional detail on the financial performance, I wanted to spend my time discussing strategic execution and long-term value creation. We have spent the past few years deliberately reshaping this organization. We have strengthened our balance sheet and upgraded our operating model while supporting incremental investments in talent, technologies, and capabilities that we believe will be impactful over the long run. The cumulative impact of those efforts has become increasingly evident in our recent financial results. Just as importantly, these enhancements have positively impacted our daily operation and ways of working. Strategically, our focus is consistent and clear. First, we are building a higher quality and increasingly resilient funding franchise. Our emphasis on core deposit generation is not just about short-term pricing advantages. We are focused on winning primary operating relationships, deepening engagement across our client base, and creating a stable funding engine that can support our growth aspirations across cycles. The combination of scalable, specially deposited verticals, enhanced treasury management capabilities, and an improving client experience has enabled us to better compete across markets and channels. Secondly, we are pursuing diverse, relationship-focused loan growth. We are intentionally allocating capital towards businesses, geographies, and industry verticals where we see durable demand and strong risk-adjusted returns. This includes business banking and middle market opportunities in our high-quality markets, as well as specific niches, like healthcare, where we have a differentiated value proposition. To fund this strategic growth, we have remained disciplined about selectively exiting lower-return transactional clients that do not align with our future strategic focus. This is not about maximizing short-term growth. we are building a relationship-focused portfolio that we believe will perform consistently across economic environments. Thirdly, we continues to focus on operating leverage and scalability. Many of the investments that we have undertaken over the last few years, including our core conversion, data infrastructure enhancement, and organizational redesign were made with a long-term lens as a result we are increasingly able to grow deposits loans and revenue faster than our fixed cost investments and without adding unnecessary complexity we view this as a critical advantage for a regional bank that operates in an underserved size range but still competes regularly with upmarket institutions that brings me to values positioning around artificial intelligence, which we believe represents a meaningful inflection point for the banking industry. Vali's approach to AI reflects a balance between our pragmatic relationship-led culture and the acknowledgement that these technologies can enable us to reimagine how work gets done across our company. We believe these rapidly accelerating capabilities can augment the productivity of our associates, enhance decision-making, improve operational efficiency, and most importantly, position value to better serve our diverse client base. Our dedication to improving the granularity, consistency, and infrastructure around our data over the last few years has been a key underpinning in our ability to effectively utilize AI tools today. We invested early in AI talent and advanced analytics and have embedded certain capabilities into our operating model in the wake of our core conversion. Already, AI is helping our bankers prioritize opportunities and better understand client needs. We have already utilized AI to improve access to our internal knowledge base, to rethink legacy back office processes, including card service requests, certain elements of underwriting, and risk monitoring to accelerate data analytics and software development. Specific use cases implemented to date include a customer-facing voice AI agent that proactively contacts past due auto loan customers to motivate payment, fraud tools to verify transaction legitimacy and to prioritize suspicious activity alerts, and AI enhancements to our sales process to optimize the next best product offer. These are small examples of a much broader effort to unlock our associates to spend more time doing what they do best, building relationships and delivering high-value advice. We expect these capabilities will continue to translate into higher productivity, better risk outcomes, and a more consistent client experience with less friction, all while preserving the human element that defines our brand. Looking forward, our priorities remain consistent. We plan to continue to selectively invest in growth, maintain our balance sheet discipline, and deploy capital thoughtfully. We are confident that the foundation we have built positions Valley to navigate uncertainty, capitalize on opportunities around us, and deliver sustainable returns over time. With that, I would turn the call over to Travis to walk through the financial results in more Thank you, Ira.
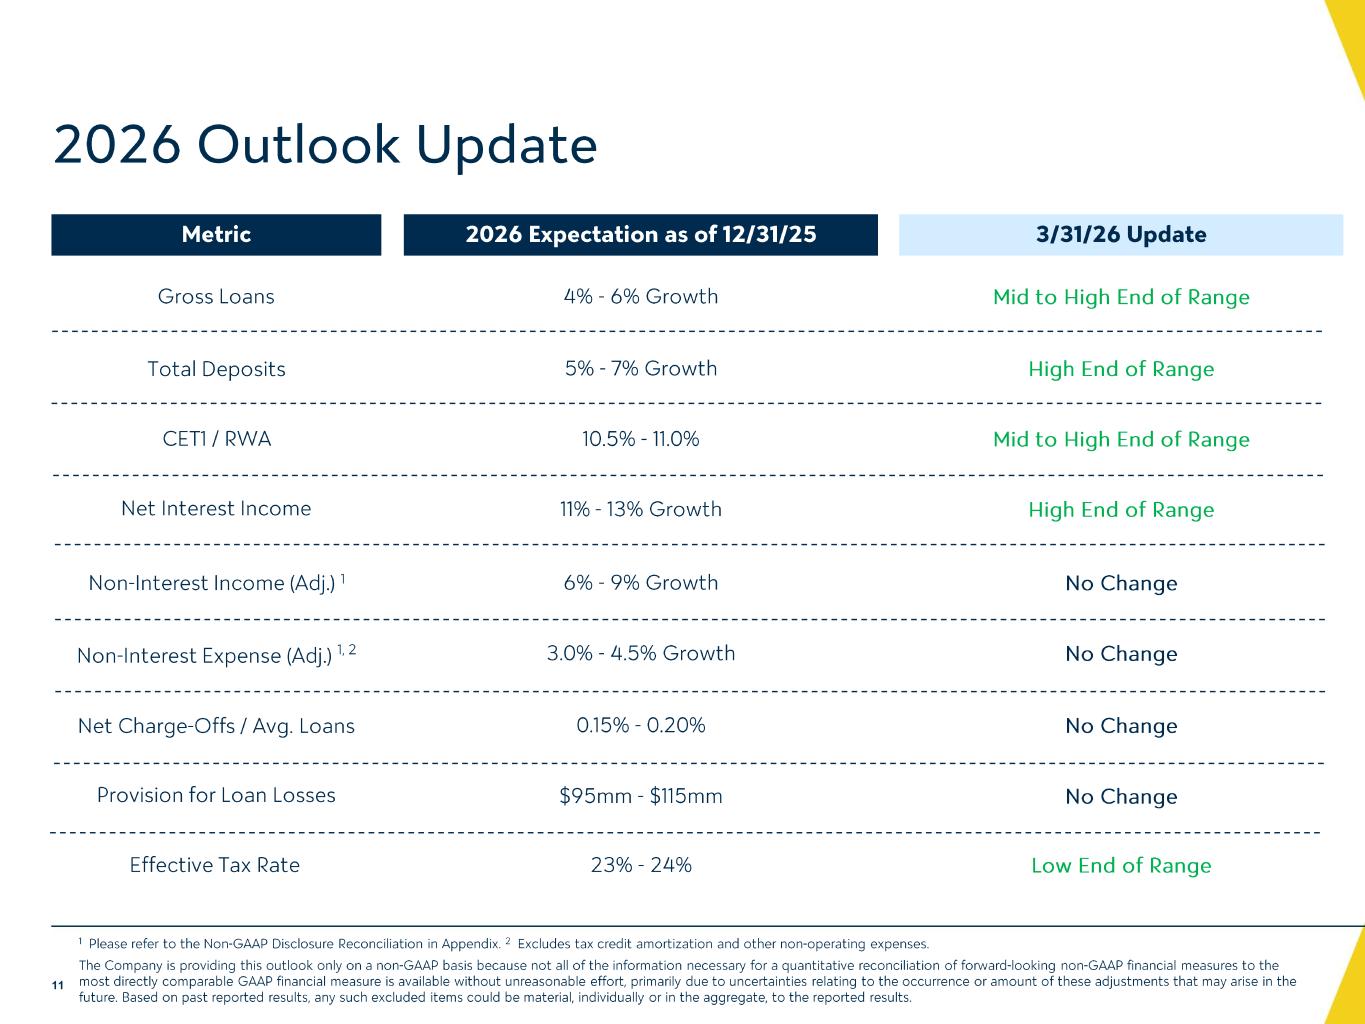
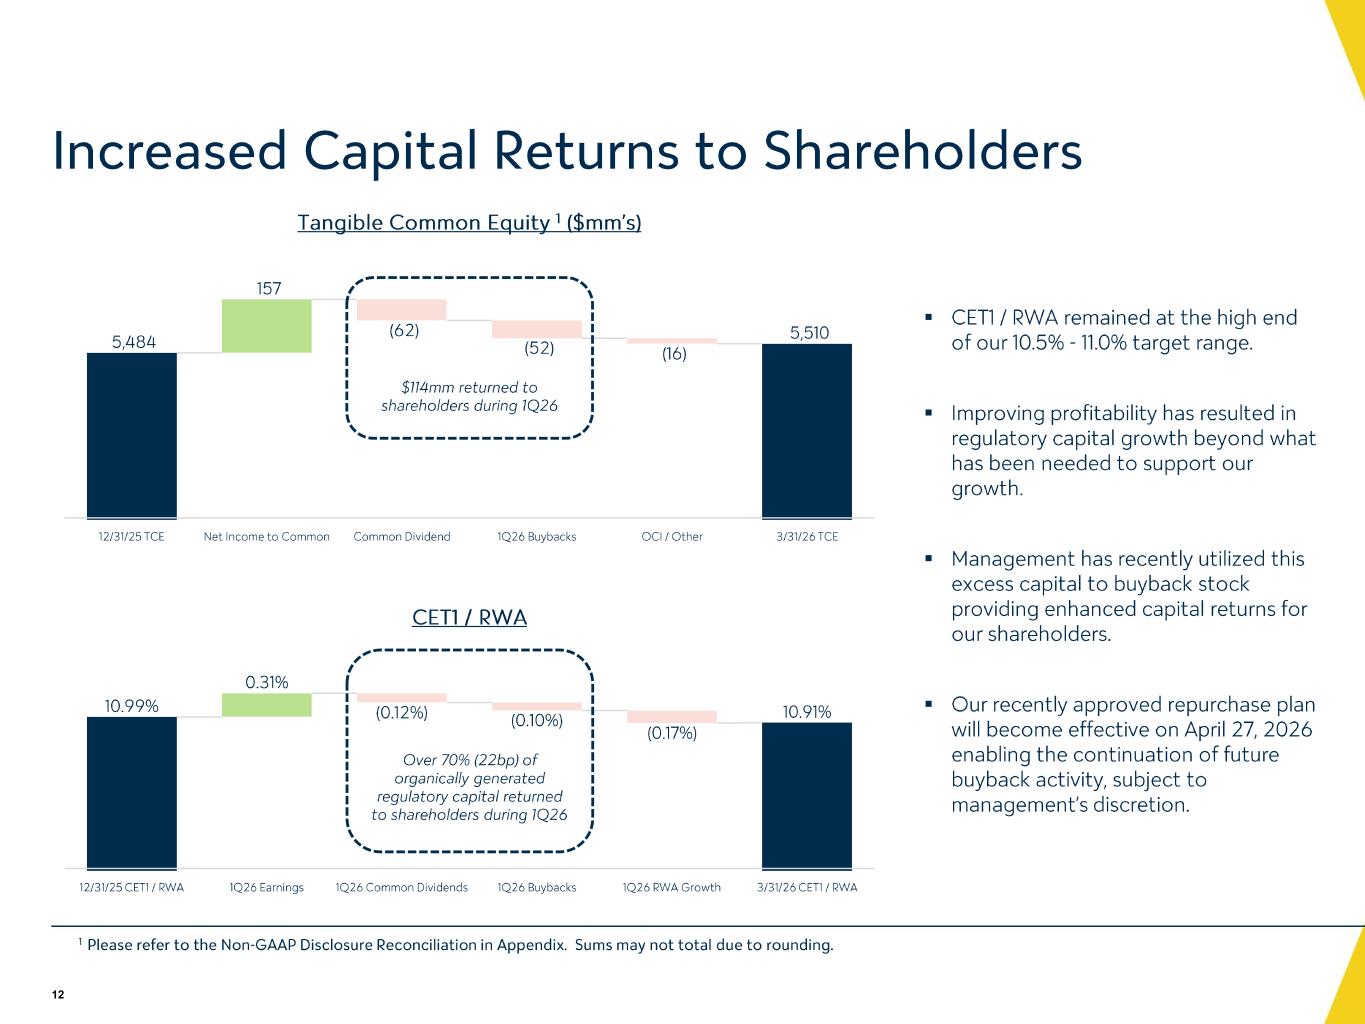
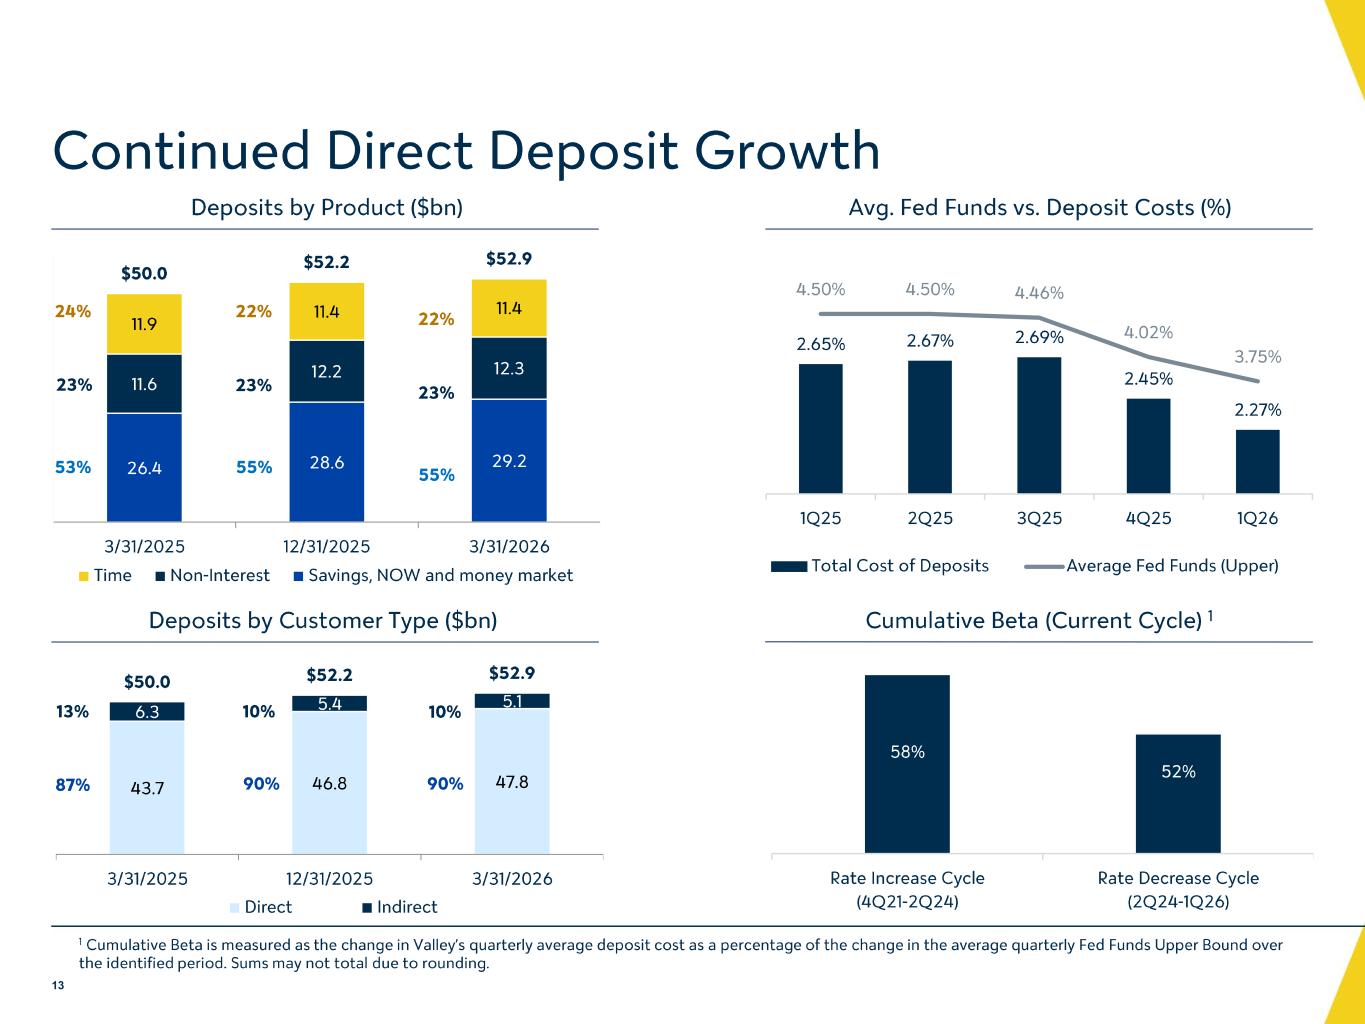
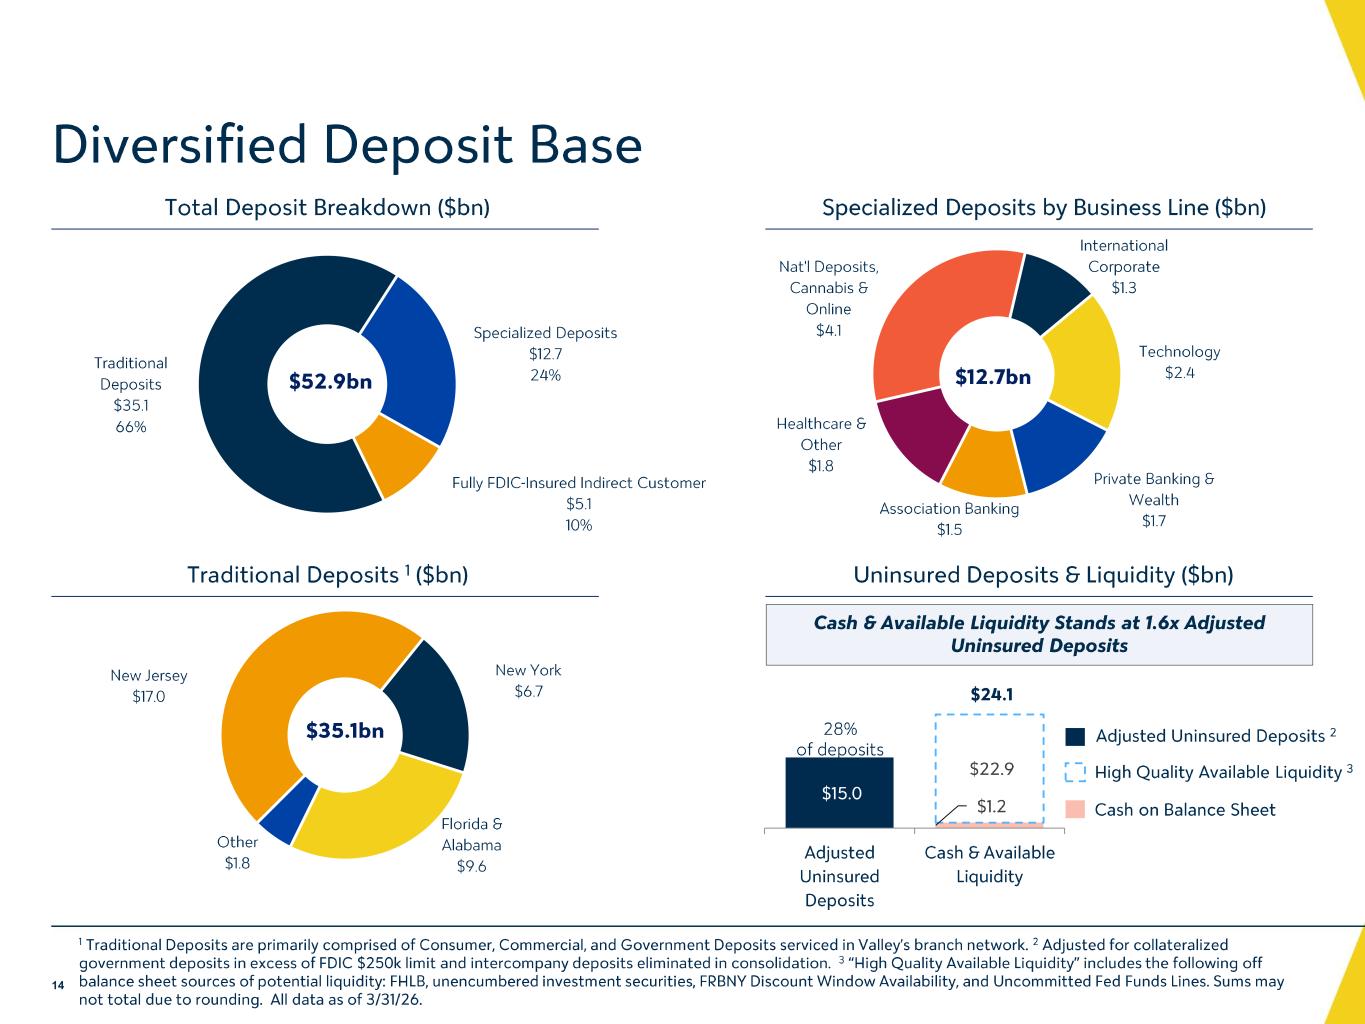
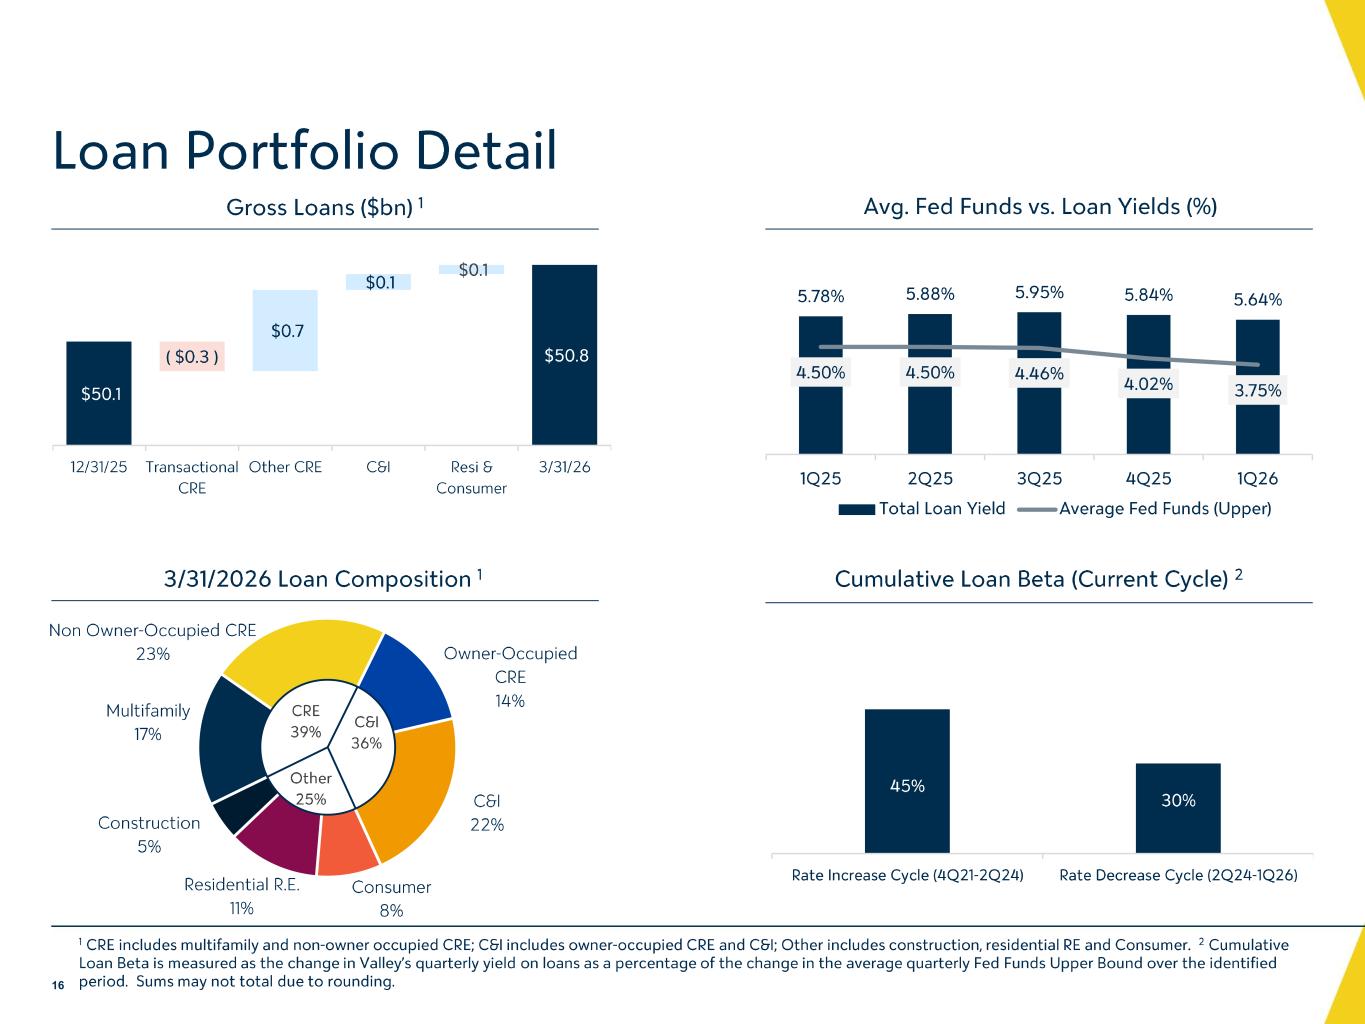
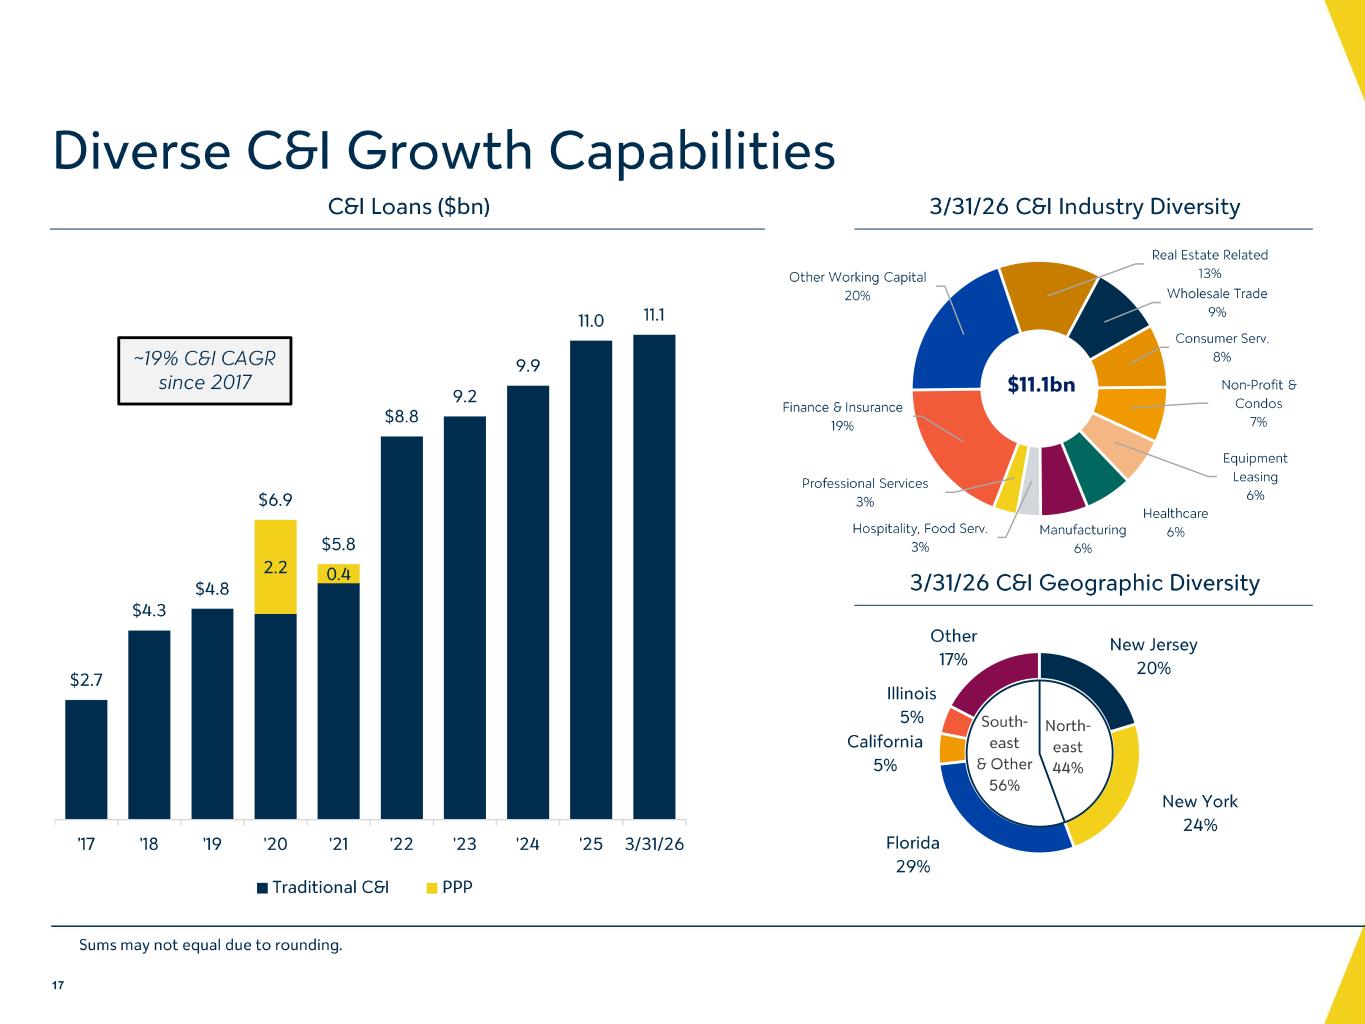
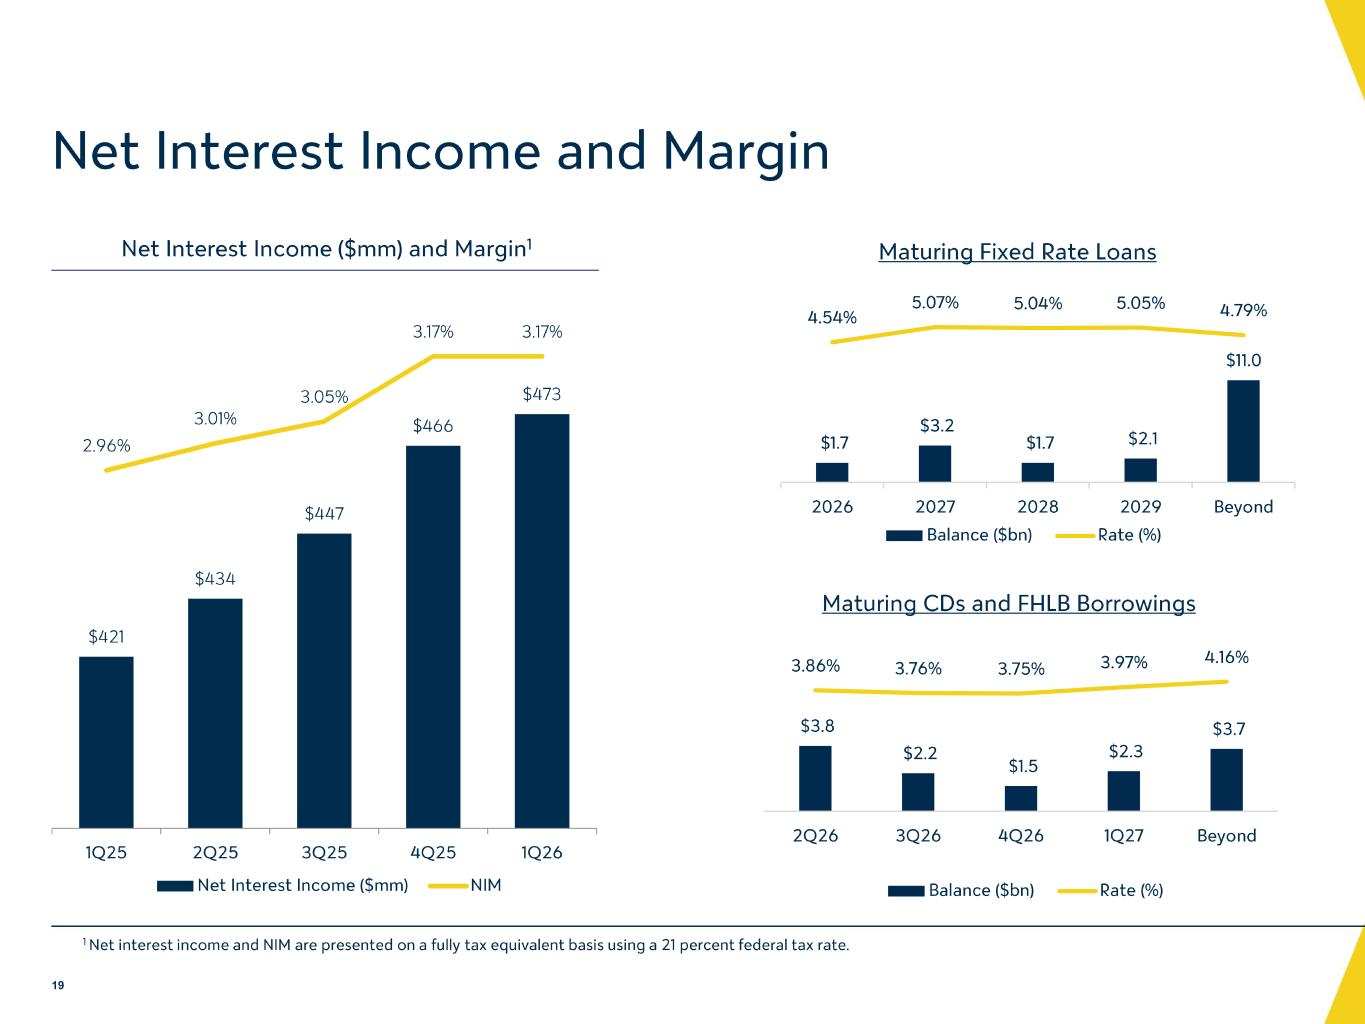
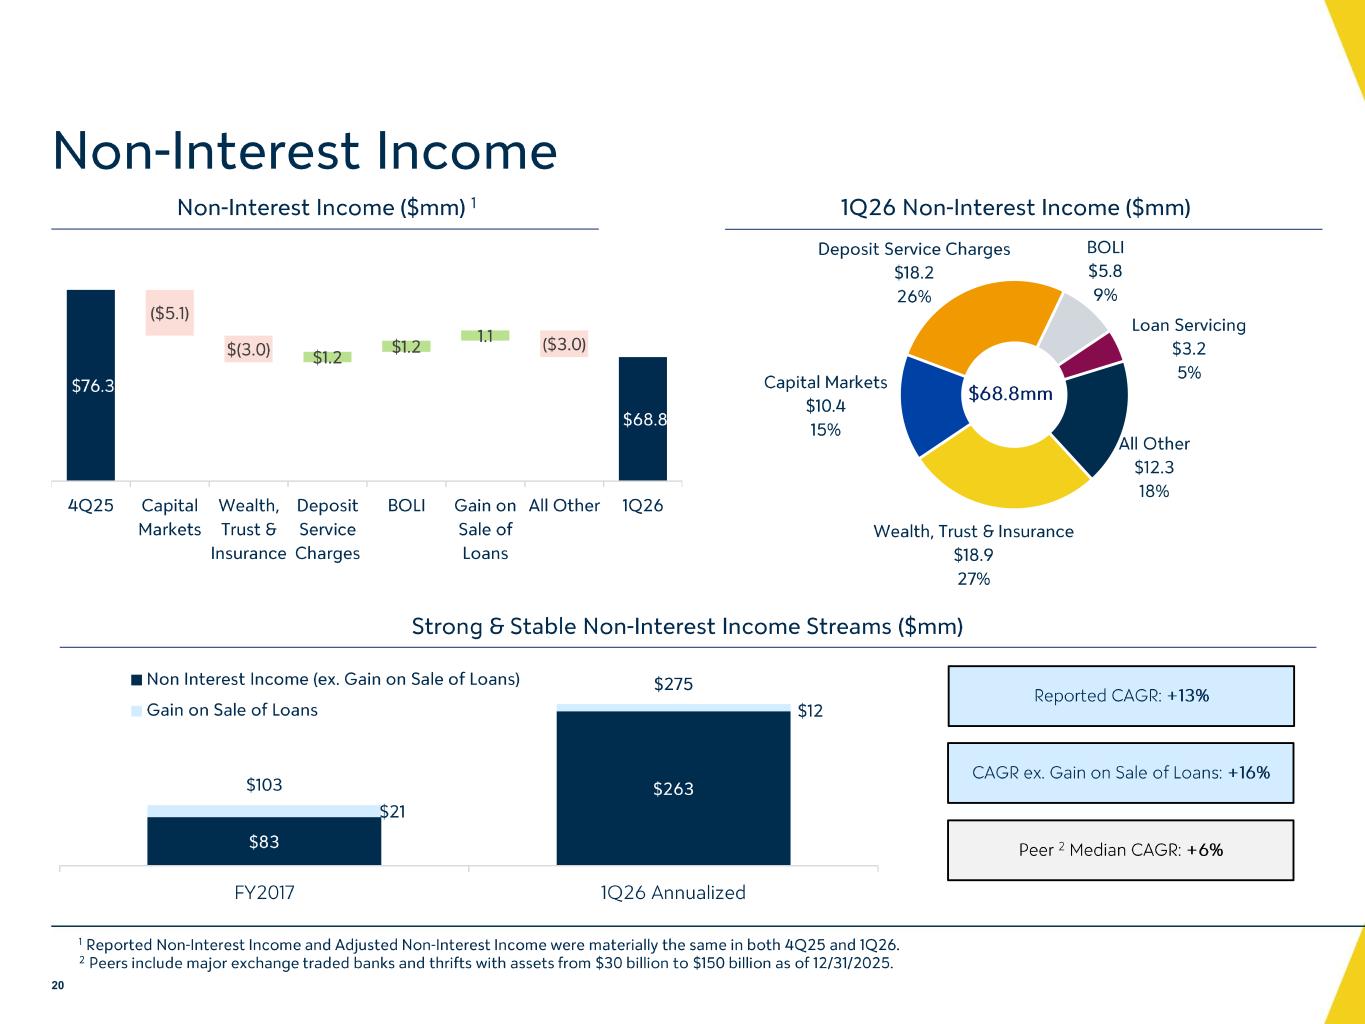
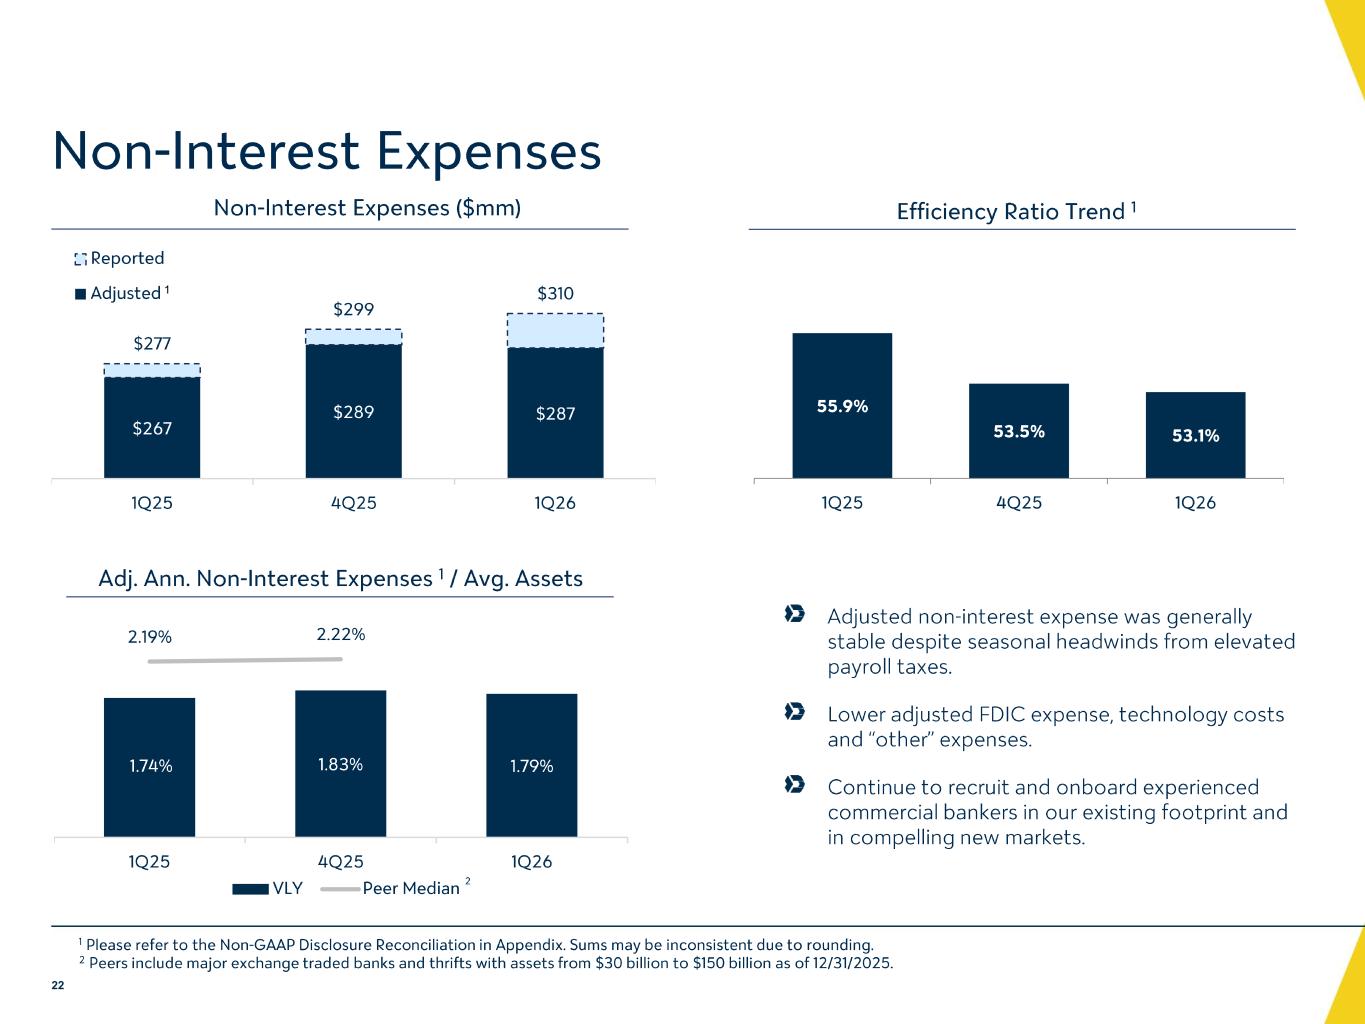
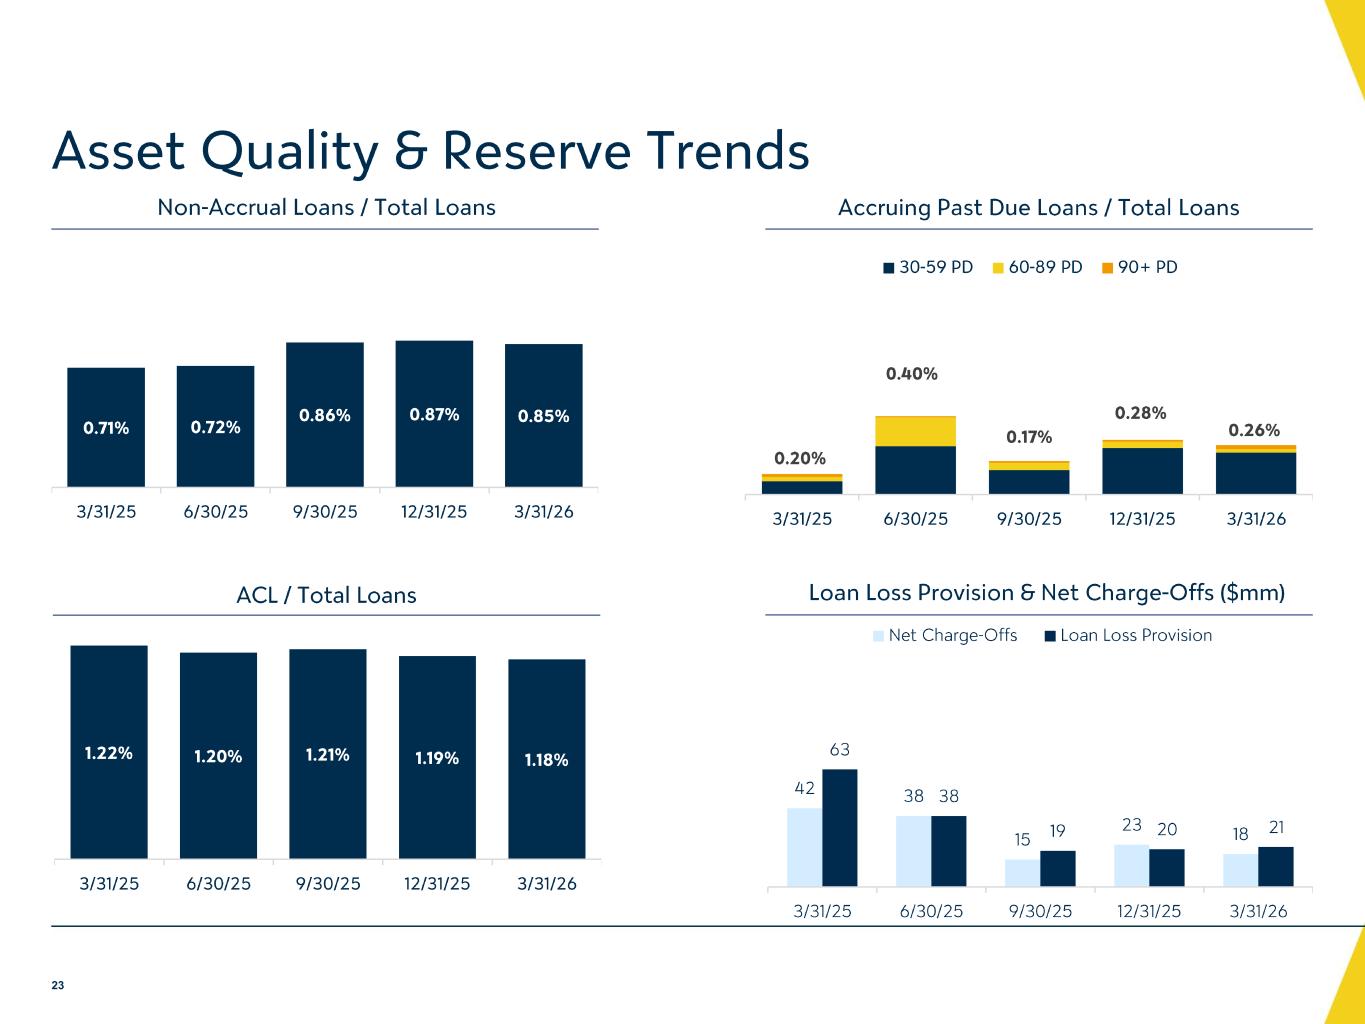
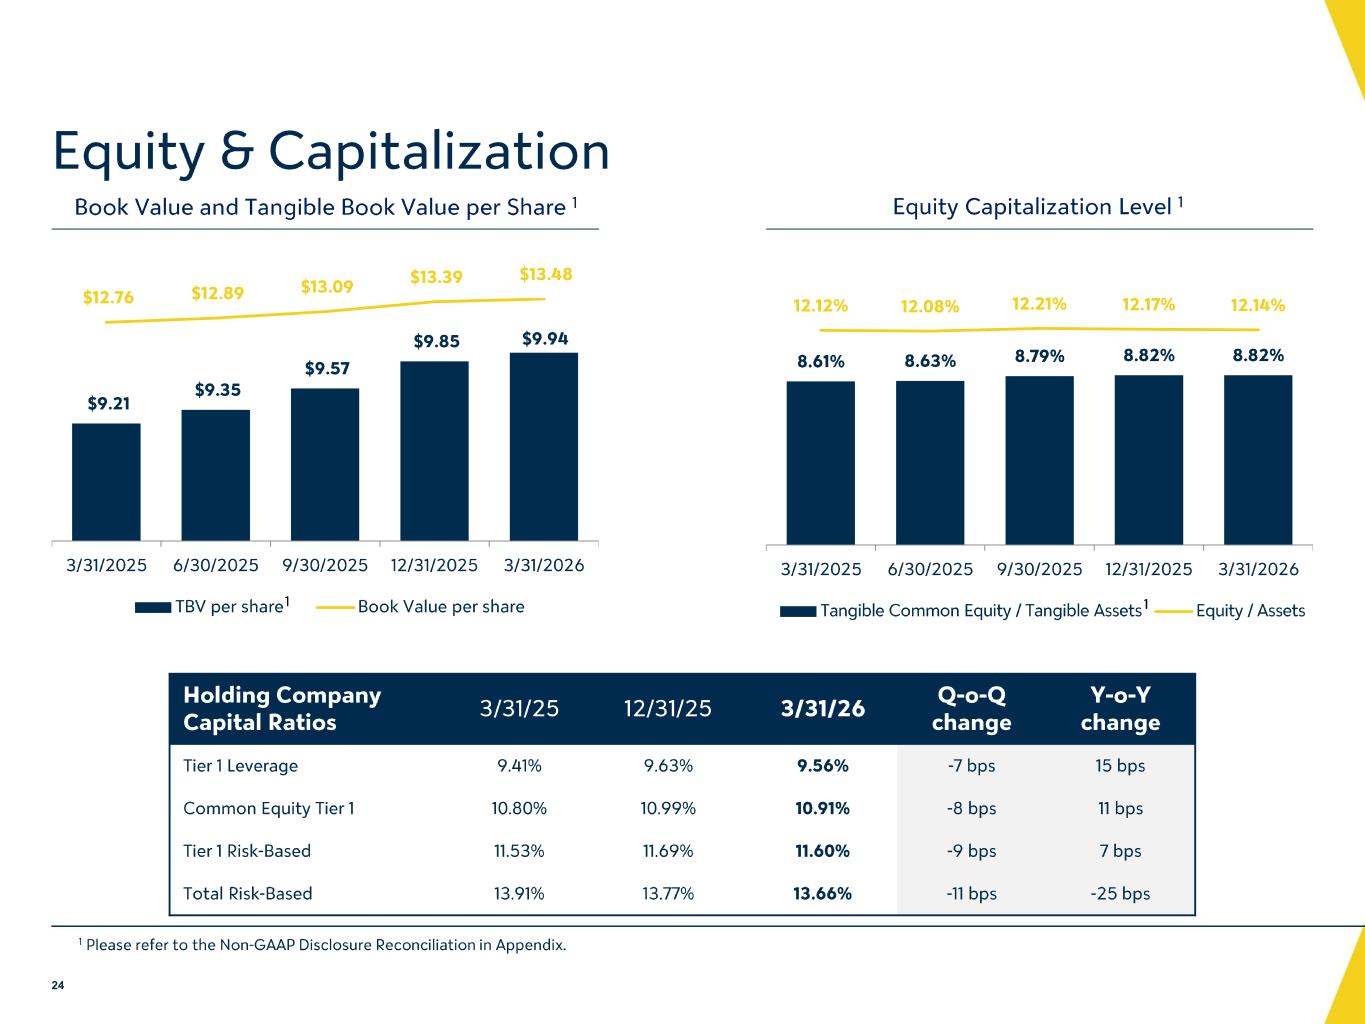
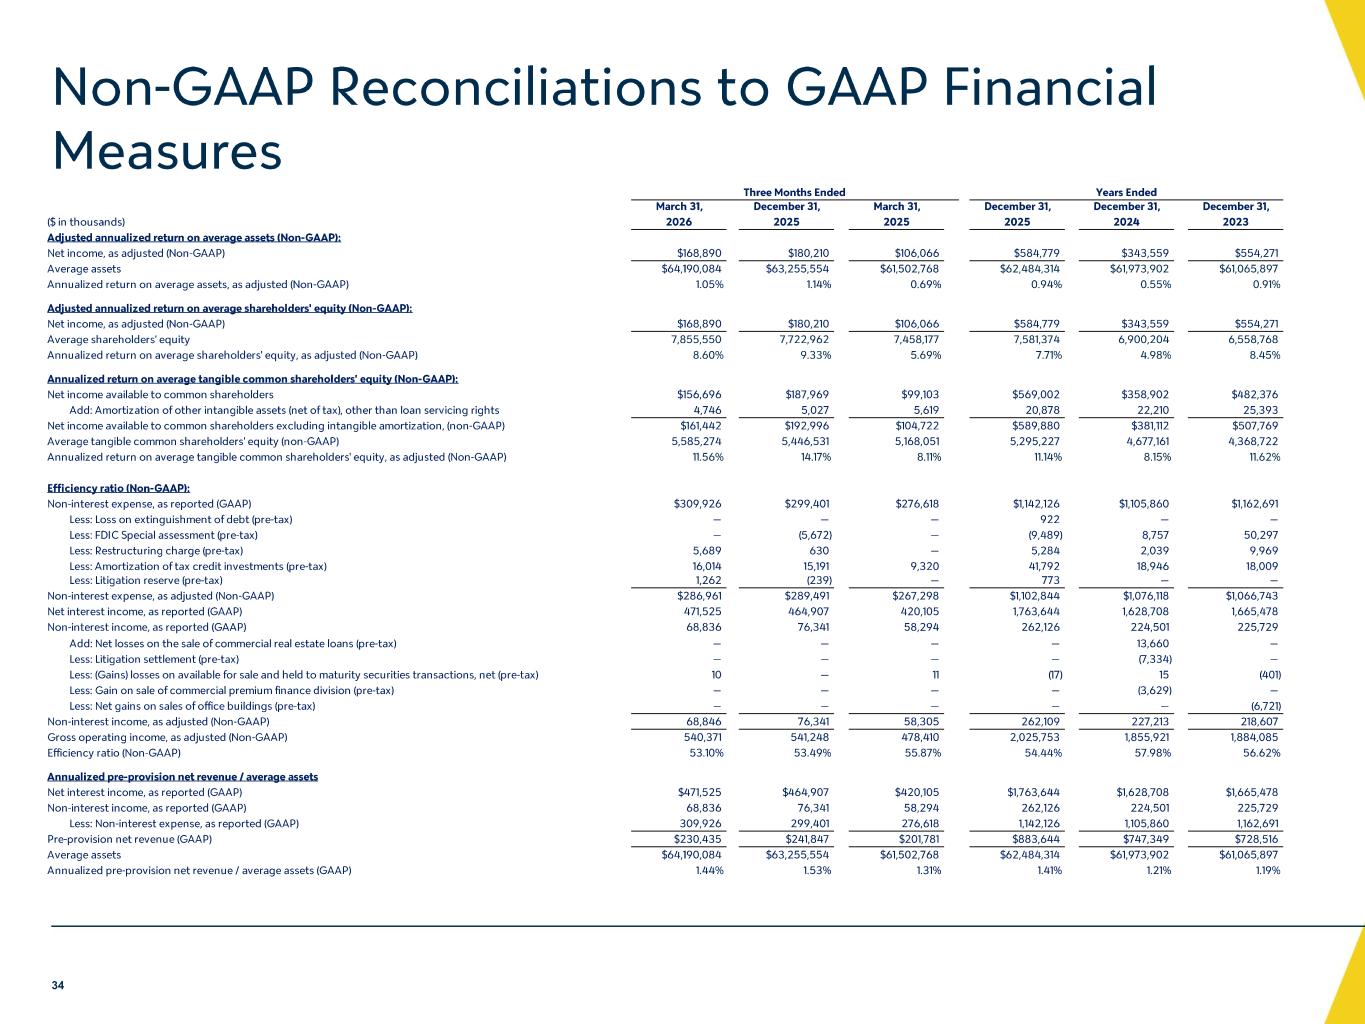
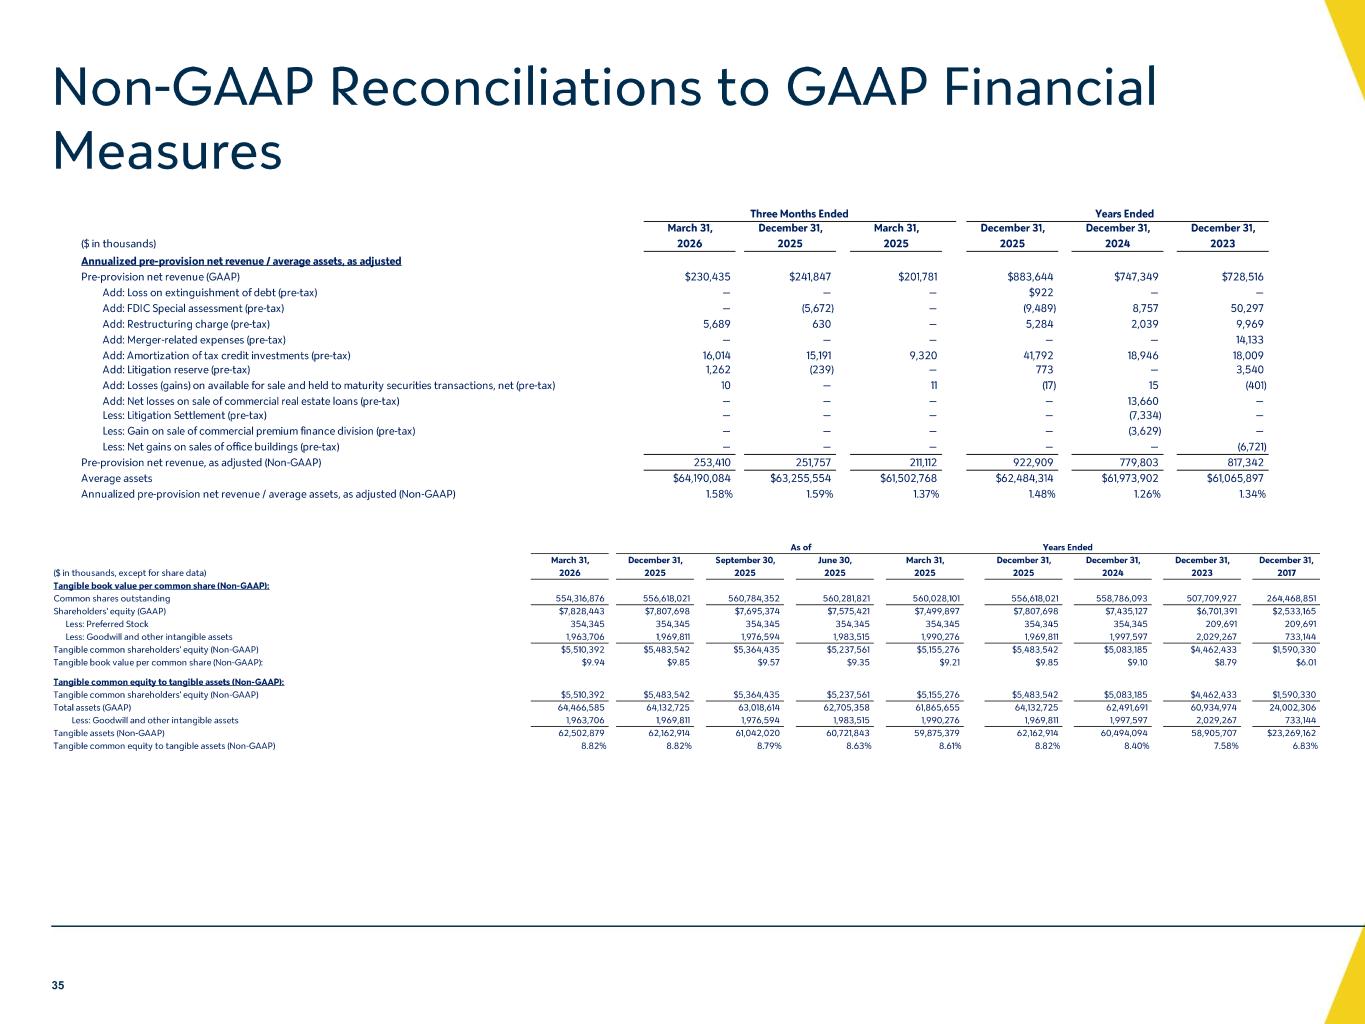
I wanted to start by giving a brief update on our 2026 financial expectations. As a result of continued strong core deposit growth, solid loan demand in our markets, and a favorable yield curve backdrop, we believe that annual net interest income growth will trend towards the higher end of our previously provided range. We expect more meaningful acceleration in the second half of the year. With no significant change to our expectations for non-interest income, income, non-interest expenses, or credit costs, we believe there is modest upside to our previous guidance range and existing consensus estimates. From a balance sheet perspective, we continue to believe that our CET1 ratio will remain towards the higher end of our target range. Slide 12 illustrates the execution of our capital strategy during the quarter. We generated over 30 basis points of regulatory capital in the period. Over half of this supported well-funded organic loan growth, and we used roughly a third of our capital generation to buy back stock. Relative to last quarter, slightly more capital was used for the buyback. Slide 13 illustrates the strong momentum in our deposit-gathering efforts. During the quarter, we increased direct customer deposits by over $900 million, which enabled us to pay off nearly $300 million of maturing higher-cost brokered deposits and $350 million of higher-cost FHLB advances. As a result of this strong direct deposit growth, loans to non-brokered deposits improved to 106% from 107% last quarter and 112% a year ago. Total deposit costs declined 18 basis points during the quarter, reflecting proactive reductions in core customer deposit costs and the funding rotation I just mentioned. We remain laser-focused on improving our funding profile to further de-risk our balance sheet and drive continued profitability improvement. We anticipate that total deposit growth will be towards the high end of our 5% to 7% guidance range for the year. Turning to slide 16, total loans grew nearly $700 million, or 5.5% annualized during the quarter. Owner-occupied Cree, particularly within our healthcare specialty vertical, continues to contribute to our growth as regulatory Cree declined modestly. C&I loans grew nearly $150 million during the quarter, reflecting strength across existing geographies and business lines, as well as contributions from newly onboarded talent. We anticipate that loan growth for the year will be between the midpoint and high end of our previous 4% to 6% range. Slide 19 illustrates the fourth consecutive quarter of net interest income expansion, which occurred despite day count headwinds associated with the first quarter. This increase was the result of solid loan growth, poor deposit generation, and repricing dynamics on both sides of the balance sheet. Net interest margin was flat from the fourth quarter, which, combined with our continued repricing tailwinds, positions us well to achieve the year-end margin guidance that we laid out previously. Despite the expected normalization of non-interest income from the fourth quarter, we posted strong first quarter results as compared to one year ago. On a year-over-year basis, non-interest income was up 18%, driven primarily by capital markets and deposit service-charge revenues. These results are in line with our expectations, and we believe set the stage for further improvement throughout the year. Turning to slide 22, reported non-interest expenses increased to $310 million in the first quarter from $299 million in the fourth quarter. On an adjusted basis, however, non-interest expenses were effectively flat as seasonal payroll tax headwinds were largely mitigated by modest reductions in other compensation costs, professional and legal fees, and adjusted FDIC insurance expense. As a result of our cultural focus on expense control, Valley's efficiency ratio declined to 53.1% in the first quarter from 53.5% in the fourth quarter and 55.9% a year ago. We continue to believe that positive operating leverage will accelerate throughout the year, which is expected to result in an efficiency ratio trending towards 50% by the end of 2026. Slide 23 illustrates our asset quality and reserve trends. Non-accrual and accruing past-due loans each decline modestly during the quarter, primarily as a result of positive migration of Cree out of each bucket. Net charge-offs as a percentage of total loans declined to 14 basis points from 18 basis points last quarter, and the modest uptick in provision expense reflected the quarter's strong loan growth. Allowance coverage remained generally consistent around 1.2%, and we do not anticipate material changes to this level throughout the year. Turning to slide 24, tangible book value increased approximately 1% during the quarter, as solid retained earnings growth was partially offset by an OCI headwind associated with our available for sale securities portfolio. Regulatory capital ratios declined modestly as a result of strong loan growth and our stock buyback activity. Based on our preliminary analysis, we estimate that regulatory capital ratios would increase between 80 and 100 basis points under the proposed BASIL-3 standardized approach. Until those rules are formalized, we continue to anticipate that our CET1 ratio will remain towards the higher end of our targeted guidance range. With that, I will turn the call back to the operator to begin Q&A. Thank you.
Operator
Thank you. As a reminder, to ask a question, please press star 11 on your telephone and wait for your name to be announced. To withdraw your question, please press star 11 again. Our first question comes from the line of Manan Nicosalia with Morgan Stanley. Your line is now open.
Good morning. Morning. My first question is on the NII side. You're pointing to the higher end of the NII guide, strong deposit growth already, strong loan growth. Can you talk about some of the inputs around the NII outlook today versus your outlook in January, the ways in which you can drive funding costs lower even if we don't get more rate cuts?
Yeah. Thanks, Manon. This is Travis. Relative to where we were coming into the year, you know, we had assumed two Fed cuts as of 1231, and obviously those are out of the forecast. But as we've said pretty consistently, you know, we're neutral to the front end of the curve. So the elimination of those cuts in the model is not overly impactful to our NII outlook. We are more exposed to the belly and longer end of the curve, and there's been some migration higher there, which has been, you know, incrementally helpful. From a deposit cost perspective, you know, even if we're unable to materially reduce core customer deposit costs in a vacuum, we still have what we view to be pretty significant tailwinds from the structural rotation of higher-cost wholesale funding into lower-cost core. And that's what I think has given us so much confidence about the margin trajectory that you've seen play out over the last year or two and why we continue to have confidence through the end of the year and into 2027.
That's really helpful. Thanks, Travis. And then Ira, maybe for you, you spoke about investing in AI early and the benefits that that should drive going forward. Are there any areas where you think you need to accelerate the investment spend there or is a lot of the investment spend going to be self-funded from here? So if you can just help us with how to think about the expense outlook this year and next year and how we should think about the operating leverage going forward.
Thank you. You know, I think it's a significant opportunity for us and really for the entire industry as to how we think about how we serve as clients from an operating expense perspective and then also, you know, how we enhance the revenue side of it as well. I think for us, when we think about the expense that would go into it, we've always been very mindful of what the efficiency ratio is within the organization and how we self-fund a lot of what we've done here. We've spent about $450 million on CapEx in the last seven to eight years versus a $50 million number in that seven to eight year cumulative period before, while still maintaining a very efficient organization. When I became CEO, I think we were 3,350 employees and $20 billion in size. Today, we're 3,607 employees and $64 billion in size. So having a more efficient organization, the more we can press that obviously provides an opportunity to really enhance the AI spend as well as other opportunities within the organization. Just over the last year, we declined about 100 employees within the organization. And as we think about the reduction in some of those roles, we're definitely enhancing the opportunities and reinvesting some of that back into AI that we think is going to be a lot more productive moving forward.
Great. Appreciate it, Carlo. Thank you.
Operator
Thank you. Our next question comes from the line of Fetty Strickland with Havadi Group. Your line is now open.
Hey, good morning. I was just wondering if you could talk about the competitive landscape on the retail deposit side, maybe how that's changed and whether that's really shifted as broad expectations and more cuts seem to have fizzled out.
Yeah, thanks, Fetty. This is Travis. Look, it does remain competitive out there for, I'd say, consumer deposits. I mean, as rates have kind of backed up, you see it in the offered rates that, you know, are posted in branches and online. I would just say for us, I mean, you know, obviously the consumer element is a component of our anticipated deposit growth, but the majority does come from the commercial side, and that would include small business and business banking in that as well. You know, there we're competing with the relationship, the service model that we have, the treasury platform that we can provide. So it's, you know, obviously rate will always be an element of how you compete for deposits, but it's not the only one. And I think that's what's enabled us to, you know, differentiate ourselves from a deposit growth perspective while also driving down costs.
Great. Thanks, Travis. And just on the Common Equity Tier 1 guide, you mentioned it in your open remarks, but can you just refresh us on capital priorities? And does that CET1 direction mean, you know, fewer buybacks or simply more capital generation, or do you take into account the Fed moves there? Just I wonder if you can talk a little bit more about buybacks relative to the CET1 ratio.
Yeah, thanks. We've been pretty consistent that we have this range, a target range of 10.5% to 11% on CET1, but throughout 2026, we anticipate staying at the higher end of that range. I think one key element, I mean, for us, the number one priority for capital utilization is to support high-quality, well-funded loan growth. And as we've seen kind of good activity in the first quarter and the pipeline's building as well, we anticipate, as we said, that loan growth will kind of trend towards the higher end of our range. We want to be able to support that. So we bought back 4 million shares this quarter in aggregate. It was about $52 million of capital we utilized for the buyback. I would anticipate that pulls back a little bit because as we look at the loan growth opportunities for the next couple of quarters, you know, we want to make sure that we're preserving the capital to support that. So we anticipate, you know, remaining active to some degree, but it wouldn't surprise me if it's a little bit less than what the first quarter was on the buyback.
All right, great. Thanks for taking my questions.
Operator
Thank you. Our next question comes from the line of David Chiaverini with Jeffries. Your line is now open.
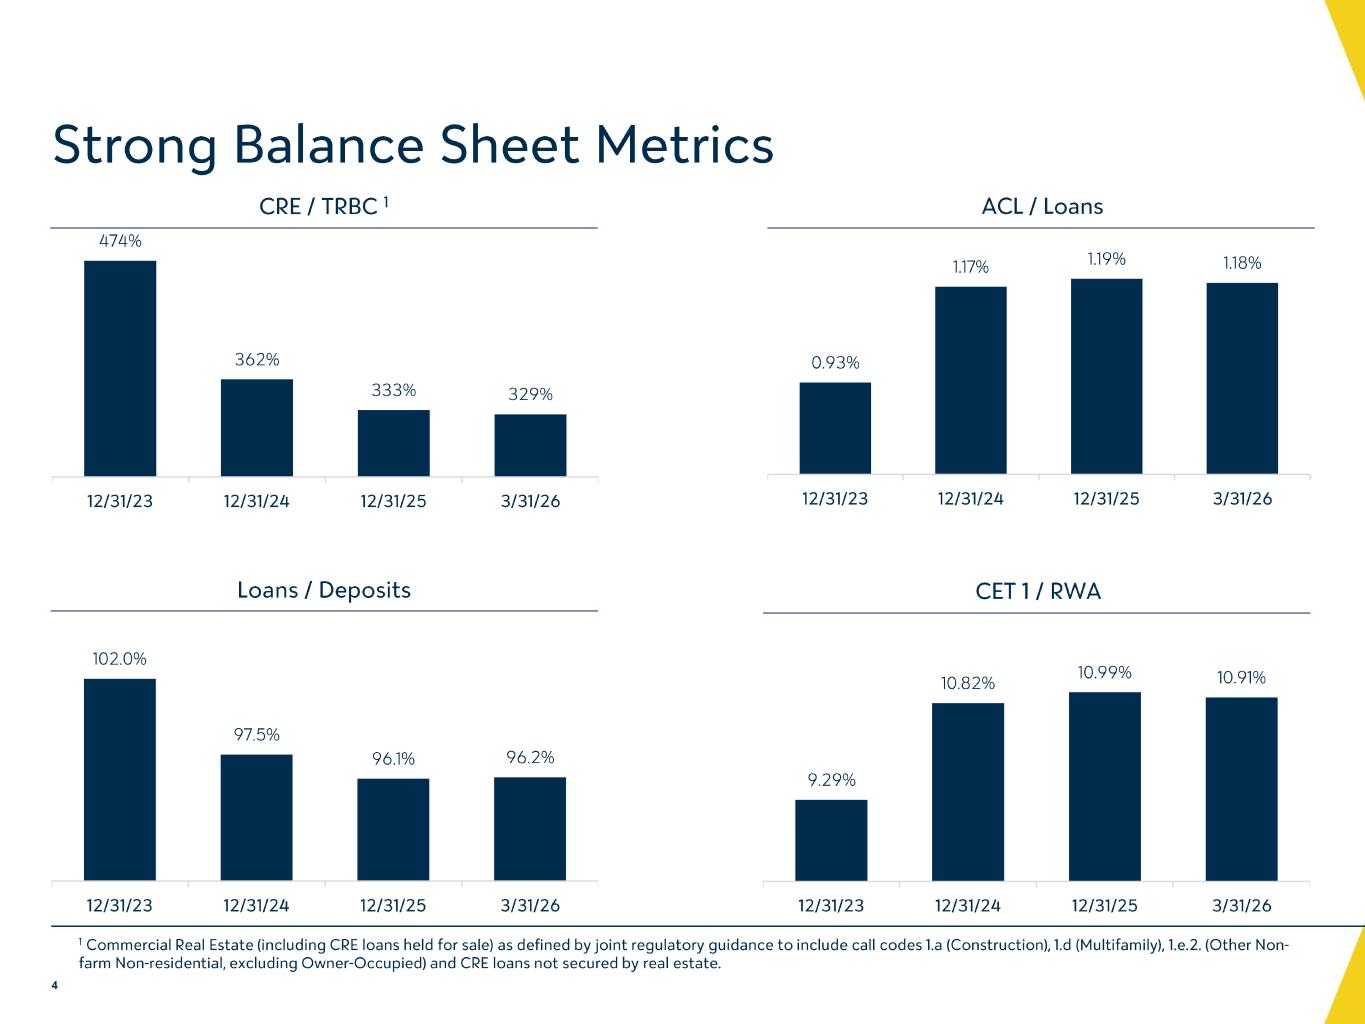
Hey, guys. Brooke Stutton on for Dave this morning. You know, with your CRE concentration ratio trending lower to 329%, what is the long-term target for this metric, and how does that influence you guys' 4% to 6% loan growth guide for the remainder of 2026?
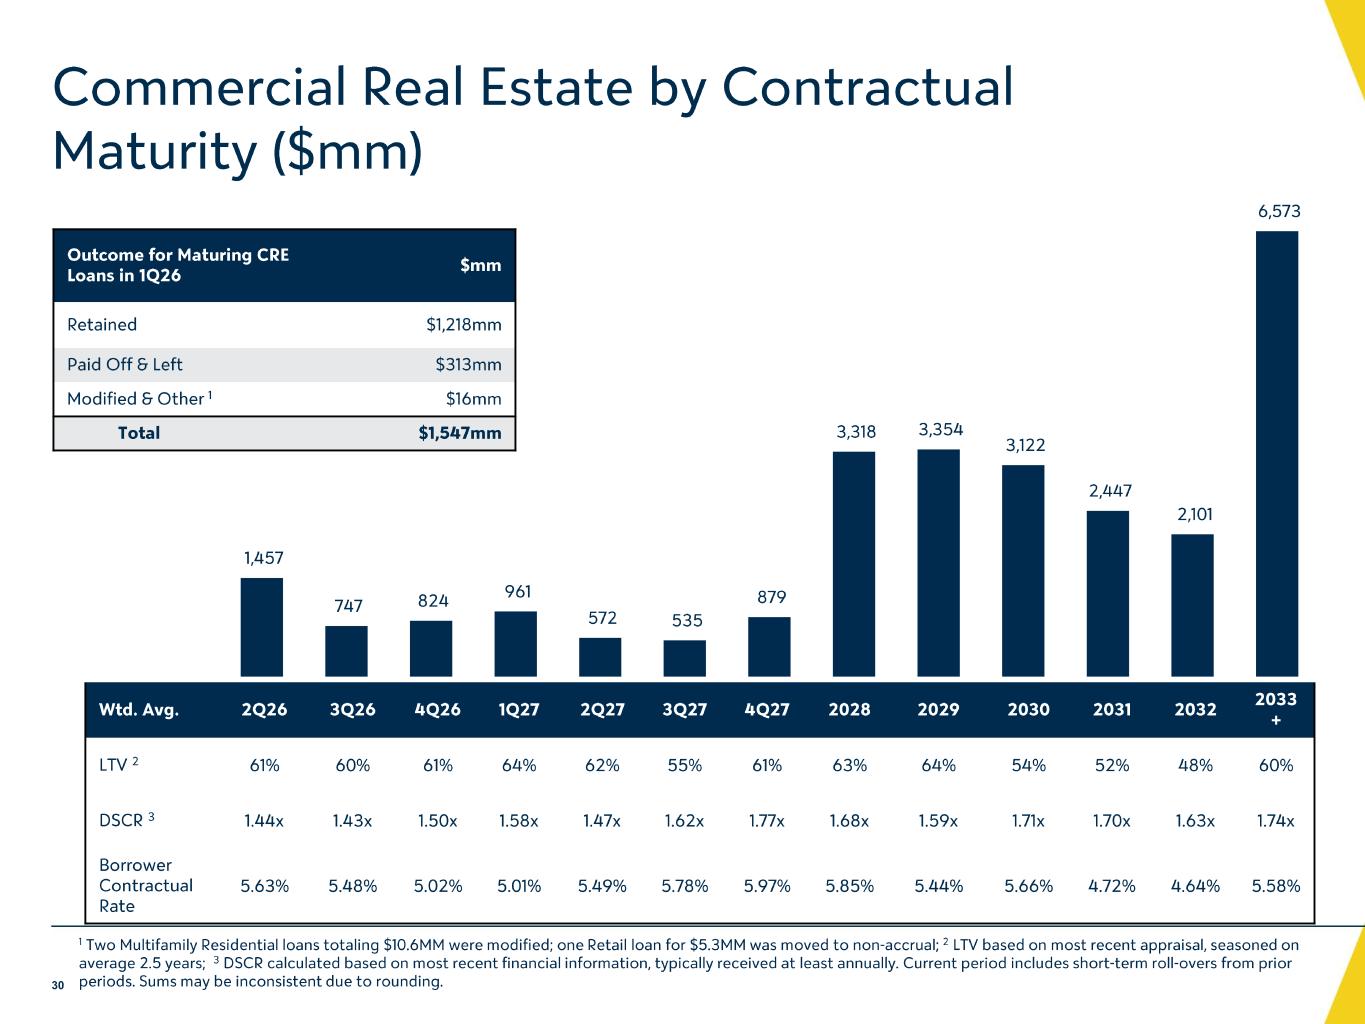
I think we were very diligent within the last two-ish years in identifying a certain runoff portfolio that really was transactional for us. So they didn't really bring the deposit relationships that we were looking for. So those tier three clients continue to run off, which creates capacity for a lot of other loan growth within the organization. I think when we think about absolutes, you know, getting under 300% as an absent number is a longer-term priority for us, and we think that we're trending there. But there's really very little pressure from an external perspective that we feel that we need to accelerate that. These are good quality loans, but I think maybe it's just not hitting the return hurdle that we're looking for. So for us, it really becomes how do we rotate the profitability of the clients from certain under ROI clients into higher ROI clients. And that's really what's driving how we think about the runoff of the CRE portfolio.
Great. Thanks. And then just on fee income, you know, there's lower capital markets activity this quarter. Can you guys talk about your run rate expectations for 2026 as we progress through the year?
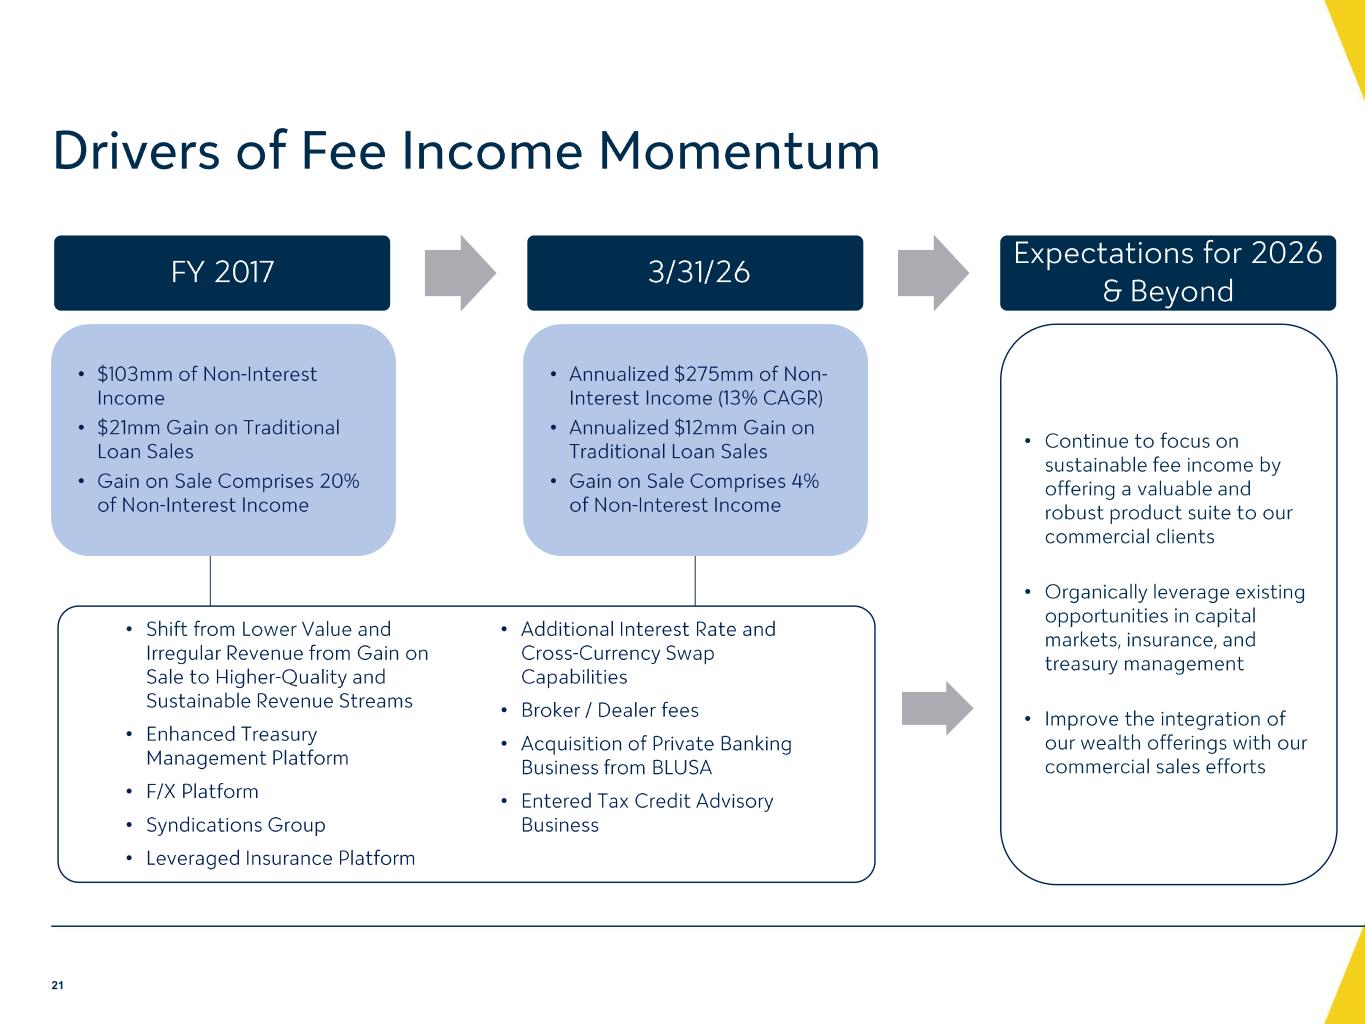
Yeah, thanks. We did indicate on the fourth quarter call that fee income in general was about $7 million elevated in a variety of ways. One of that was $4 or $5 million of elevation from a swap perspective in the fourth quarter. So that normalized as expected. The $10 million in capital markets in general is a good starting point. And I would anticipate that we see growth throughout the rest of the year.
Great. Thanks for taking the questions.
Operator
Thank you. Our next question comes from the line of Janet Lee with TD Cowan. Your line is now open.
Good morning. For long growth, is the more growth coming from non-transactional CRE and then still pretty robust growth in CNI there? Should we expect more of growth to also come from CRE in the future quarters versus what you expected in the prior quarter, or how should we think about the mix of loan growth as we head into the rest of 2026?
Yeah, Janet, maybe I'll start, and Gino can add some commentary in terms of what we're seeing in the pipeline. But coming into the year, we had guided to about $2.5 billion of loan growth, of which a billion was CNI, a billion was Cree, and $500 million was consumer and resi. Within that billion of Cree, we anticipated a couple hundred million would be regulatory CREs, so investor in multifamily. As you saw at the first quarter, right, that was a slight decline. I would anticipate maybe that we see a little bit of regulatory CRE growth throughout the year, but the majority will remain in kind of owner-occupied and CNI with support from the consumer areas as well. So maybe, Gino, just about what you're seeing across the markets.
I'll just add, we continue to invest in new talent, primarily with CNI talent, upmarket CNI. and business bankers as well that are focused on C&I and deposit-rich businesses. Our pipeline, C&I pipeline, is up a billion dollars since the end of the year. So we expect to see continued C&I growth throughout 2026, both because of the investments we made and because our clients continue to invest. We have relatively robust economies. We're in affluent markets, whether that's Coral Gables, Tampa, Morristown, Manhattan, or Garden City. All of those markets remain strong and robust, And our clients, despite the noise out there and the headwinds from input costs, our clients continue to remain confident and continue to invest, and we're supporting them.
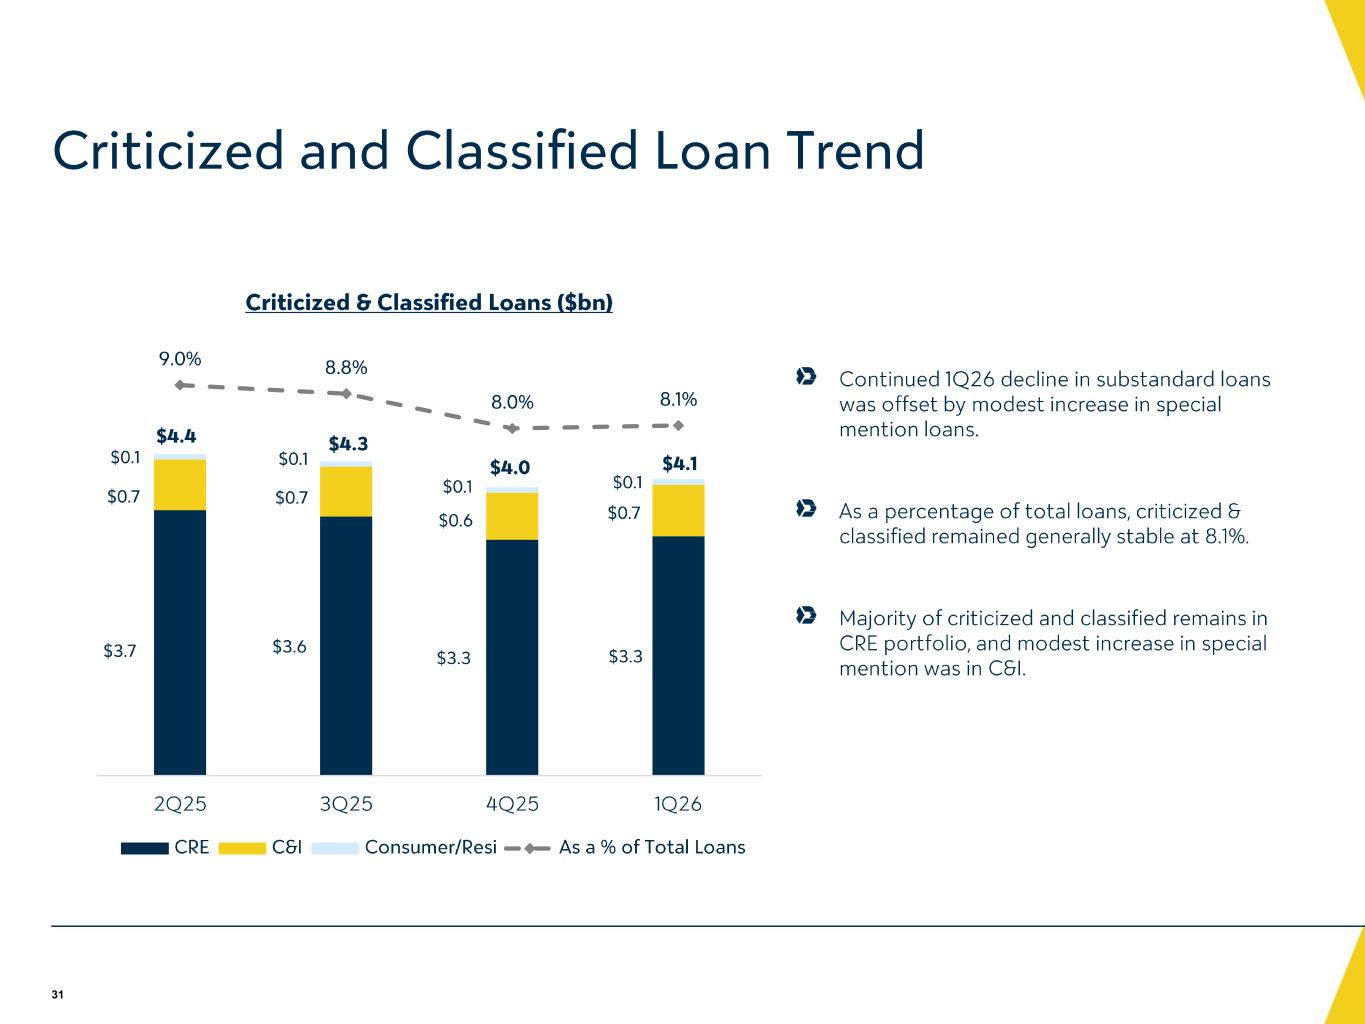
That's helpful. And your credit was very stable this quarter, but your criticized and classified loans were up a little bit, driven by C&I's special mention loans. Could you provide some color on the trend you're seeing? and do you still expect the trajectory of criticized and classified to decline from here or should it stabilize over the near term?
Hi, Janet. I'm Mark Sager. The really stabilization of criticized in first quarter is just a normal phenomenon of year-end financial collection and some migration. We do anticipate that we will still see a decline in the criticized throughout the year in noting, you know, we have the big decline in Q3 and Q4, and we still have an expectation for the year to be down.
Operator
Got it. Thank you. Thank you. Our next question comes from the line of David Smith with Truist Securities. Your line is now open.
Hey, good morning. Good morning, David. Can you give us a sense of where new loans are coming on the books today and how spreads have trended over the quarter, given everything that's going on?
Yeah, this is Travis. New loan yields declined modestly by, I think it was about 675 last quarter. It was maybe 655, 660 this quarter. We're seeing modest spread compression in certain asset classes on the commercial real estate side. I think that led to a little bit more runoff in the regulatory Cree book than maybe we had anticipated coming into the year. But spreads have remained generally stable in most of our target portfolios. It obviously remains competitive for high-quality customers that we're banking, but I do think we've reached an air pocket from a size perspective, where we're one of very few banks remaining in this size category that can offer all the products and services of a large bank with the high-touch service and quick response and credit underwriting of a more community-oriented bank. I think that's playing well for us to be able to grow without necessarily seeing spreads collapse.
Thank you. And did you have the spot deposit rate for March 31st?
Yeah, I do. Interest-bearing spot deposit cost was $295 versus $302 at December. All in was $226 spot deposit the cost versus $232,000 at December 31st. So down six basis points from the end of December to the end of March.
Got it. Thanks very much.
Operator
Thank you. Our next question comes from the line of Anthony Ellion with J.P. Morgan. Your line is now open.
Good morning. This is Mike Petrini on for Tony. So I guess I'll start on NIM. I guess, how are you guys thinking about NIM trending for the rest of the year? I know you guys mentioned coming into the year that the 330 mark was sort of what you expected. How do you guys see that trending?
Yeah, so coming into the year, we anticipated a slight reduction in margin in the first quarter and then building up to that 330 level by the fourth quarter. And the reality is we posted a better starting point. And so I would anticipate that there's some upside to that 330 fourth quarter 26 target that we've laid out. Again, I think the funding profile is better at 331 than we had maybe anticipated. The interest rate backdrop remains supportive of the margin expansion. And we still have the structural tailwinds that we outline on the net interest income slide of the deck, showing the fixed rate asset repricing and then the fixed rate liability repricing as well. So when you add it all up, I think we feel better about the margin guide than maybe we felt coming into the year, even though coming into the year was strong as well. Great.
And on loan growth, now you guys sort of got into the mid to high end of that range, the four to six range, I guess, what categories do you feel more encouraged on now than you did before or just any color on the expected growth trajectory of any of the different categories over the rest of the year? It'd be great.
Our pipeline remains very robust. It's basically double what it was a year ago. And it's primarily concentrated in CNI and healthcare. We've got a a very terrific healthcare franchise with very experienced people, and that business continues to grow. We do have a reasonable amount of CRE demand that is offset by the runoff of the non-regulatory book. And so we expect, and also it's robust growth across all of our geographies, whether that's Florida, New York, New Jersey, and even in our growth markets. We're seeing good growth in Illinois, LA, et cetera. So we expect a very robust origination tier. Great. Thank you.
Operator
Thank you. Our next question comes from the line of Matthew Brees with Stephen, Inc. Your line is now open.
Operator
Good morning, Matt.
Maybe just a quick one on expenses first, you know, just given some of the moving pieces, severance, et cetera. What's a good starting place for the second quarter on salary expenses? Is $150 million the right place to be? Any other moving parts there?
Yeah, Matt, I think that's right. And I would just say, so the first quarter payroll tax impact was about a $7 million headwind. That declines by about $4 million in the second quarter. At the same time, our merit bonuses only went into place kind of mid-March, so there's no real impact from that in the first quarter. So those two things effectively balance out. So if you take the severance away from the compensation line, I think that's a good starting point. The only element, and this moves around quarter to quarter, is we did see some higher insurance costs in that line in the first quarter. So, you know, it's possible that we could outperform from that perspective, but I don't think that would be overly material.
And then, you know, one thing I haven't heard a lot about, but I've heard a lot of peers talk about is just the extent they're seeing payoffs and prepayments. You know, first, maybe just your thoughts on that. Are you seeing that as well, but able to offset it? And then secondly, is there prepayment penalty income going into the NIM? And I would just love to get some sense for how that's trended and if it's extensive. And are we modeling too much of it right now? And just wanted your thoughts there.
Yeah, I don't think, first of all, it does go through our NII, although it's not an overly material number. You know, prepayments this quarter declined to about $1.2 billion. They've been running at around $1.4 billion for the last couple of quarters. So we saw a slight decline in prepayment activity. But it's been fairly consistent when you look back over, you know, five or eight quarters or so. So I don't think it's been a material moving piece in terms of balances for the NII.
Okay. And could you remind us of what the accretable yield that's flowing from the margin is?
Yeah, it's like $10 million this quarter. which has been consistent. It's about $4 million on the security side and $6 million on the loan side. And that was what it was last quarter, too? Yeah, this quarter. Excuse me. Yeah, it was $9.5 million this quarter. It was $10.9 million last quarter, so a slight decline.
And then last one for me, just on asset quality. You know, the big area is concern for the industry. You know, I would love your thoughts on NDFI, not that you have a ton of it, And then office, commercial, real estate, just love kind of color. And if you're seeing any sort of green shoots there or anything that's keeping you up at night, that's all I have.
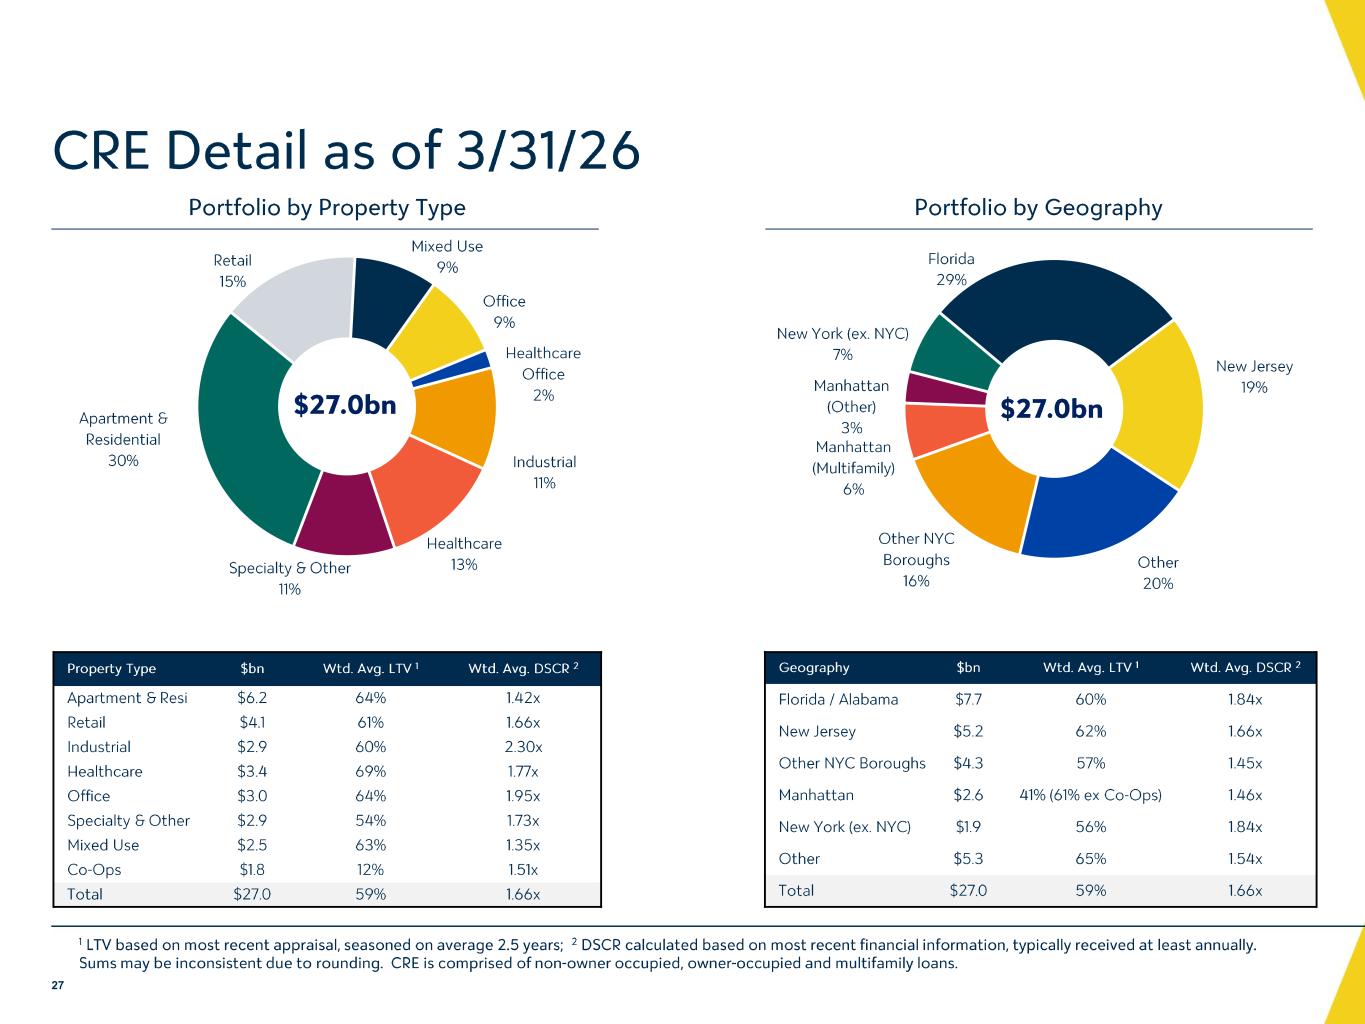
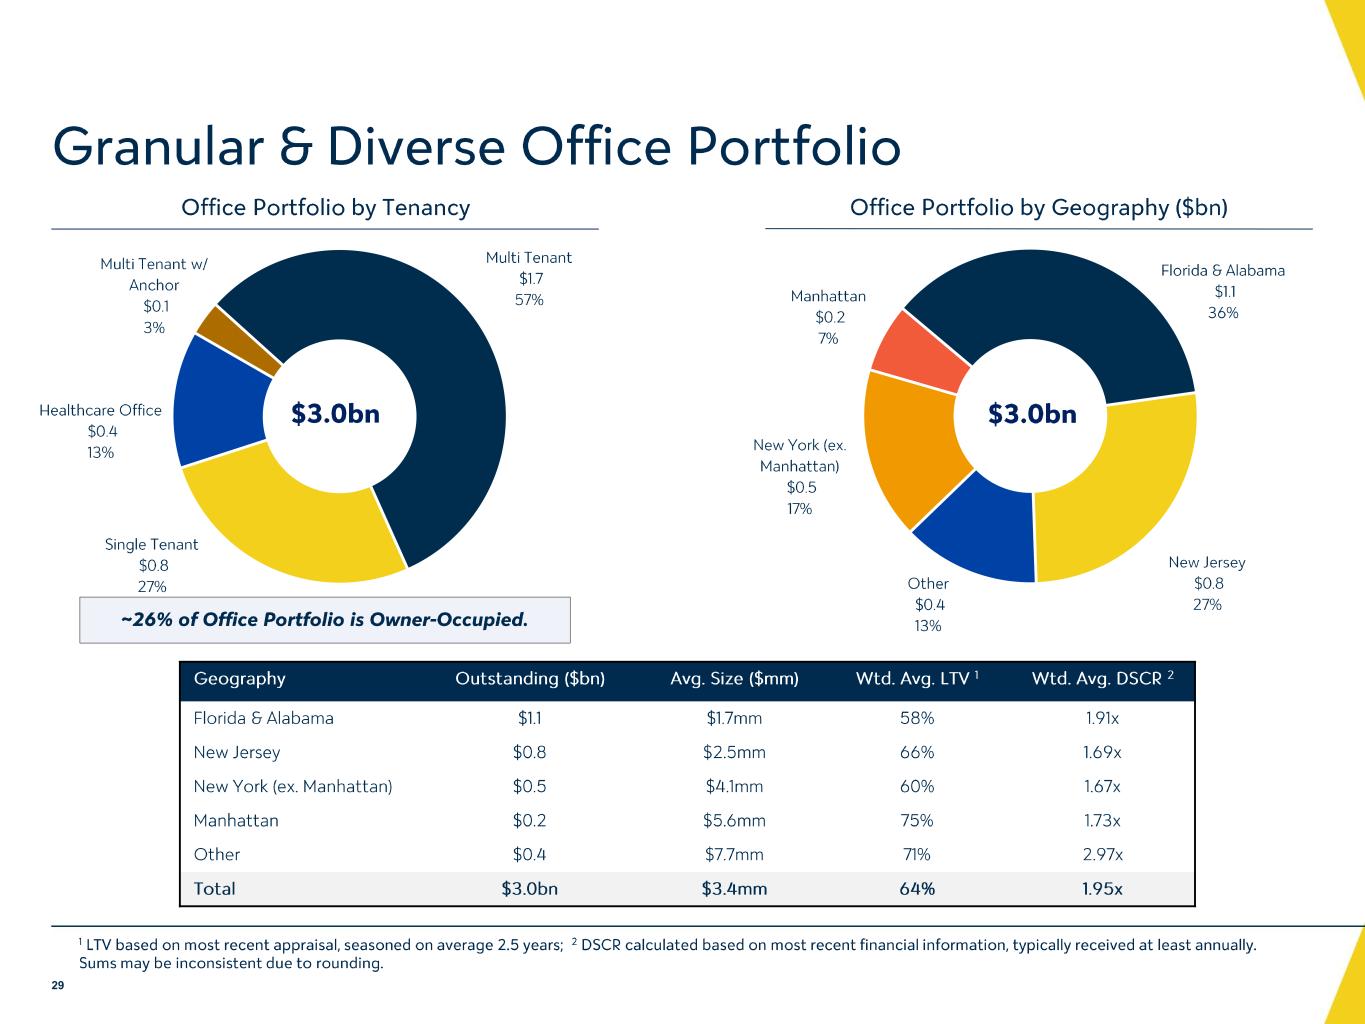
Hey, Matt. It's Mark Sager. NDFI has never been a big portion of our portfolio. We have about 2.6% of the portfolio in NDFI compared to 7% for our peers. That number for us also we've mentioned in the past. We've had a focus on capital call facilities out of our fund finance group. Those are exceptionally well-structured to entities with a strong history and a very strong institutional LP base. So we view that as safe lending. But yes, as you've mentioned, it's a small part of our portfolio. As it relates to the office portfolio, we have that breakout in our deck. We continue to be very granular in that space, diversified by geography, more suburban than urban. And we definitely are seeing more rational transactions happen in the office space. If it hasn't hit bottom in all markets, it's close to bottom, and we're seeing new lease-up activity, a reduction in subleasing in the majority of our markets. So, you know, not actively growing that portfolio, but our concerns on that portfolio have definitely abated.
Hey, it's Gina, too. I'll only add that in the last two quarters has been record leasing in New York City, and so at record rents, especially for Class A properties. You've received upwards of over $200 a square foot in rent. So some of the concerns about Montani and other things that are happening just aren't materializing with corporations in their leasing strategies, at least.
Thank you, Seth. Thank you.
Thank you. as a reminder to ask a question at this time please press star one one on your touch tone telephone our next question comes from the line of christopher mcgratty with kbw your line is now open oh great morning um travis going back to the capital just just to push a little bit on the like the buyback i mean you're you're are we going in the right direction generating more capital can't you do both high-end of growth and and buybacks or maybe you know it's more of a back half year as you kind of talk about the near-term loan growth, but I guess what's the hesitation, especially with the Basel III proposal?
Yeah, I don't think that there's any hesitation. I just think we have a very robust pipeline, and we want to make sure that we're well-positioned to support that loan growth, Chris. So again, we bought back $50 million of stock in the first quarter, something in that $40-ish million, $40 to $50 million range I still think feels reasonable. The average price we bought it back was below, you know, where the market is today. So that's another element that plays into it. But we will remain active in the buyback. I just indicated that I think it will be a little bit lighter than the first quarter.
That's a better color. And then, Ira, I didn't hear, you know, M&A or strategic mention at all. Maybe an updated view there if there is a change.
Yeah, I mean, from an M&A perspective, I don't think anything has really changed. I think from a historical perspective, it's been important for us to remain shareholder-friendly and do what's in the best instance of the shareholders, and I don't think that's ever going to change here. Thank you.
Operator
Thank you. And I'm currently showing no further questions at this time. I would now like to hand the conference back over to Ira Robbins for closing remarks.
I just want to thank everyone for the interest and look forward to speaking to you next quarter. Thank you.
Operator
This concludes today's conference. Thank you for your participation. You may now. disconnect.